Causes and Sources of Impairment - Belmont Soil & Water ... Creek/Watershed Action Plan/Part...
54
Causes and Sources of Impairment This section of the watershed action plan identifies point and nonpoint sources of pollution impairing or threatening water resource quality in the Captina Creek watershed region. In order to achieve full attainment status in all tributaries of the region, sources of pollution need to be identified and managed if not eliminated. Sources of impairment are arranged by subwatershed area, then by point and nonpoint origin. North Fork Captina Creek 12-Digit HUC: 050301060901 Figure 137a. An unknown sedimentation source exists in downstream portions of Long Run clouding runoff near the confluence with the North Fork
Transcript of Causes and Sources of Impairment - Belmont Soil & Water ... Creek/Watershed Action Plan/Part...

Causes and Sources of Impairment
This section of the watershed action plan identifies point and nonpoint sources of pollution
impairing or threatening water resource quality in the Captina Creek watershed region. In order
to achieve full attainment status in all tributaries of the region, sources of pollution need to be
identified and managed if not eliminated. Sources of impairment are arranged by subwatershed
area, then by point and nonpoint origin.
North Fork Captina Creek 12-Digit HUC: 050301060901
Figure 137a. An unknown sedimentation source exists in downstream portions
of Long Run clouding runoff near the confluence with the North Fork

Figure 137b. Confluence of Long Run and North Fork
Captina illustrating issue with increased sedimentation.
Credit: Eric Gibson
Figure 138a. Cabins along State Route 148 on the banks of
the North Fork have inadequate septic fields.

Figure 138b. More trailers and cabins along the North Fork lacking adequate septic fields

Figure 139. The Barnesville wastewater treat-
ment facility at the headwaters of the North Fork
has recently been upgraded with two new decanter
aeration tanks, a new sampling lab and a sludge
press costing approximately 3.3 million dollars.
The upgrades should alleviate occasional NPDES
violations received from OEPA for elevated solids
and ammonia nitrate/nitrite discharges into the
North Fork during high flow volumes. Facility
officials stated that a second round of upgrades
would further improve the quality of effluent
discharge in addition to removing clay tiles from
sewer lines in the village of Barnesville which
would reduce flow volume emptying into sewer
drains.
.

South Fork Captina 12-Digit HUC: 050301060902
Figure 140. Unrestricted livestock access to streams can lead to increased
sedimentation and nutrient loading. Additionally, lack of riparian cover increases
water temperatures thus decreasing dissolved oxygen especially in warmer months.

Bend Fork 12-Digit HUC: 050301060903
Figure 141. Built in 1990 the Bethesda wastewater treatment plant is located in the headwaters of Bend
Fork and services approximately 1500 persons in the village. Effluent discharge and E. coli parameters
downstream of the wastewater treatment plant are within accpetable EPA parameters. The stream is
designated Class B PCR recreational use however village officials have stated that upgrading the plant
with a UV sterilizer in place of chlorine and sulfate dosing pumps used in the final stages of treatment
will improve efficiency and reduce potential discharge downstream.
Figure 142. Gravel Pits on Bend Fork.

Piney Creek 12-Digit HUC: 050301060904
Figure 143. Casey Run is in danger of becoming the location for the OVCC's new slurry
impoundment facility pending permit approval from the USEPA. If approved, the
facility will severely impact the stream’s habitat, especially middle sections.

Figure 144. At least 8 coal slurry releases have been documented between Murray Energy's Century and
Powhatan #6 coal mines since 1999. The most recent occurring when a transport pipe north of the Century
mine burst releasing slurry into Captina Creek, severely impacting aquatic life for over a mile downstream.

Figure 145. A section of high density polymer pipeline used to transfer coal slurry from Century mine's prep
plant to the slurry impoundment pond at Powhatan #6 mine. This pipeline has burst in two separate locations since
2008 resulting in spillage into Captina Creek each time. The slurry mixture is highly abrasive and under extreme
pressure which, under the right conditions, can weaken bends and joints along the pipeline. Officials from Murray
Energy have commented on plans to install a protective cover around the pipeline that would capture slurry from
future breaks. The slurry would then be drained into concrete tanks placed along the pipeline where it could be
safely disposed without entering the creek. No timetable for the new installation was provided.
Figure 146. Slurry deposition on a bank in Captina Creek after the October 2010 accidental
release.

Figure 147. The Ohio Valley Coal Company's slurry impoundment facility near
Alledonia. The facility also accepts slurry from the Century mine via a 2500 foot
pipeline.

Figure 148. American Energy Corporation's Century Mine is a potetnial source of metals into
Piney Creek. OEPA test results indicated the following values in 2009 at RM 0.03; sodium 500
mg/l, sulfate 674 mg/l and conductivity 2442 umhos/cm, and TDS (2050 mg/l) (OEPA, 2009).
Despite these values , the Century mine today remains below acceptable parameters for discharging
metals and currently has no defined limits on discharging TDS (Wood-Pugh, 2011).

Figure 149. Perkins Run is an artificially constructed outfall drainage of OVCC's slurry
impoundment located west of Powhatan #6 coal mine. During low flows, conductivity may
approach 6,000 umhos/cm near the confluence with Captina Creek. Elevated levels of iron
(2561 µg/l), manganese (1756 µg/l), aluminum (831 µg/l), sulfate (2585 mg/l) and sodium
(1275 mg/l) were detected in 2009 sampling conducted by OEPA.

Pea Vine Creek 12-Digit HUC: 050301060905
Figure 150. Settling ponds surrounding the reclaimed Cravat Coal gob pile. AMD from the pile is treated
with limestone slag before entering the creek. Officials from Ohio Department of Mineral Resources
(ODMR) have stated that creating passive treatment wetland habitat around the gob pile would further
decrease the threat of AMD entering the stream from this location.

Figure 151. A portion of the Linn Tipple gob pile (field next to SR 148) was recently reclaimed by
Murray Energy between SR 148 and the railroad tracks. A large area remains on the hillside above
the railroad tracks and leaches AMD into a roadside ditch along SR 148. The pile is located in Section 4
of Washington Township.

Figure 152. AMD from reclaimed strip mine lands on the east and west sides of Dover Ridge Rd. (York
TWP Rd. 729) has been observed entering Captina Creek but does not seem to have an effect on water
chemistry, according to OEPA testing, and dilutes to undetectable levels further downstream.

Figure 153. An abandoned bridge across Captina Creek in Section 21 of York
Township partially obstructs flow and may be a barrier to fish movement upstream.
The bridge serves as access to abandoned gravel pits from SR 148.

Figure 154. Remnants of two small gob piles exist in this section of York TWP, originally occupied by
Bellaire Corporation Powhatan #5 coal mine. This site was also the former location of a limestone gravel
pit.

Figure 155. A dosing silo installed by ODMR treats acidic water pumped out of abandoned mine
shafts with limestone before it can enter Captina Creek. This is the location of Bellaire Corporation's
reclaimed Powhatan #5 coal mine in central York Township.

Figure 156. ATV traffic on an abandoned township road along Anderson Run has
accelerated rates of erosion on this exposed streambank resulting in increased sedimentation
in downstream. Several areas like this exist along the length of the tributary.

Cat Run 12-Digit HUC: 050301060906
Figure 157. Acid mine drainage currently being treated with a limewater dosing silo then released into a
settling ponds near Cove Rd. just west of Powhatan Point. This site is the former location of Bellaire
Corporation's Powhatan #2 coal mine.

Point Sources of Pollution
Causes & Sources of Point Source Pollution in the
Captina Creek Watershed Region
Generally speaking point source pollution differs from non-point source pollution in that it
can be traced back to a specific location, unlike non-point source pollution which covers a
broader scope and can originate from multiple sources in a local area. Generalized examples of
point source pollution include discharge pipes and hazardous chemical spills. Industrial facilities
discharging point source wastewater into a watershed must have a National Pollutant Discharge
Elimination System (NPDES) permit approved by the OEPA and must adhere to the guidelines
of the established discharge standards for hazardous materials. There are seven facilities having
NPDES permits on file with OEPA in the Captina Creek watershed (listed in Table 43).
Table 43. Permitted dischargers in the Captina Creek watershed region. Data from OEPA NPDES Online
Database Query.
NPDES Permits in the Captina Creek Watershed Region
Facility Name *Type NPDES ID Receiving Waters
American Energy Corp - Century Mine
Minor OH0059552 Piney Creek
Barnesville WWTP Major OH0024015 North Fork
Bellaire Corp. Powhatan #5 Mine
Minor OH0011576 Captina Creek
Bethesda WWTP Minor OH0021121 Bend Fork
Ohio Valley Coal Company Powhatan #6 Mine
Minor OH0012661 Captina Creek
Oklahoma Coal Company Linn Tipple Facility
Minor OH0059633 Captina Creek
Powhatan Point WWTP Minor OH0027219 Captina Creek
*A major discharge is defined as one exceeding a flow rate of 1 million gallons per day.

Table 44. Spills & illicit discharges from NPDES permitted facilities in the Captina Creek watershed region.
Data from OEPA NPDES Online Database Query.
Waste Water NPDES Permit Violations
Facility Quarters in Non-Compliance (of 12) Actions Receiving Waters Ohio Valley Coal Company #6 Mine
12 3 Letters of Warning Perkins Run/Captina Creek
AEC Century Mine 11 4 Letters of Warning Piney Creek
Barnesville WWTP 12 2 Letters of warning North Fork
Village of Bethesda WWTP
12 2 Letters of warning Bend Fork
Since 1999 OEPA has documented eight accidental slurry releases into Captina Creek via
faulty pipelines or leakage from the large impoundment at #6 coal mine. The most recent release
occurred on October 1st, 2010. Prior to that event, slurry releases were recorded on February
28th, 2008; July 10th, 2007; January 2, 2006; August 8th and July 31st of 2004; April 22nd,
2000 and July 8th, 1999.
Non-Point Sources of Pollution
Home Sewage Treatment Systems
As mentioned previously non-point sources of pollution are those that originate from
multiple sources over broad area and cannot be traced back to one specific location. Examples
of non-point sources of pollution in the watershed region is effluent released from private and
public septic systems and disturbances in the landscape that lead to increases in downstream
sedimentation. Table 48 lists non-point sources of pollution in the Captina watershed. Non-
point sources of pollution are often more difficult to identify and control in a watershed due to
their widespread and sometimes complex coverage.
According to records from the Belmont County Health Department there were 143 new
septic tanks installed in the county in 2009 and 79 systems installed in 2010. Of the systems
installed in 2010, 19 were within the Captina Creek watershed region bringing the total number
of systems on record to 2,303. Compliance with septic system rules is sometimes lacking in
rural areas especially those without access to county water sources and seasonal recreational
residences. The USDA 2002 census estimates a 2.18% failure rate for septic systems in eastern
Ohio. Based on that estimate, there are approximately 42 septic tanks in the Captina watershed
region that are not properly working. Data for systems installed before 1970 is spotty for
Belmont County as well as areas in Monroe County. Each faulty septic tank has the potential to
release excessive amounts of phosphorus and nitrogen into the water table as well as fecal
coliform pathogens.
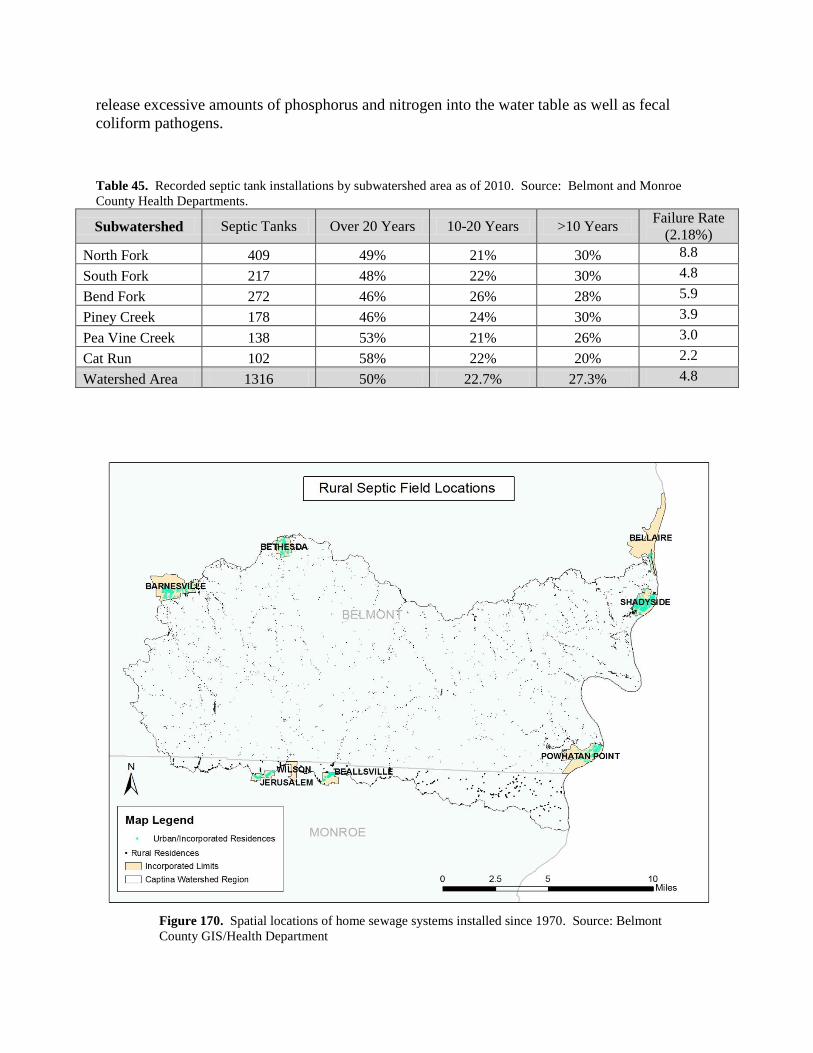
Table 45. Recorded septic tank installations by subwatershed area as of 2010. Source: Belmont and Monroe
County Health Departments.
Subwatershed Septic Tanks Over 20 Years 10-20 Years >10 Years Failure Rate
(2.18%)
North Fork 409 49% 21% 30% 8.8
South Fork 217 48% 22% 30% 4.8
Bend Fork 272 46% 26% 28% 5.9
Piney Creek 178 46% 24% 30% 3.9
Pea Vine Creek 138 53% 21% 26% 3.0
Cat Run 102 58% 22% 20% 2.2
Watershed Area 1316 50% 22.7% 27.3% 4.8
Figure 170. Spatial locations of home sewage systems installed since 1970. Source: Belmont
County GIS/Health Department

Acres of Highly Erodible Land and Potential Soil Loss
Table 46. Source: Eric Gibson personal tests
Sedimentation (TSS) Prior Seven Day Precipitation = 0.00in
Subwatershed Area lbs/day
North Fork 67
South Fork 35
Pea Vine 145
Piney Creek 90
Bend Fork 26
Cat Run 15
Average Daily TSS
Discharge for
Watershed Area
63
Causes & Sources of Non-Point Source Pollution in the
Captina Creek Watershed Region
Table 47.
Nonpoint Sources of Impairment
Cause Source
Elevated Fecal Coliform Counts
Unrestricted Livestock Access in Streams
Faulty/Absent Septic System Leach Fields
Faulty Wastewater Treatment Facilities
Excessive Sedimentation/Siltation
Pipeline Construction
Careless Logging Practices
Improper Installation of Natural Gas Drill
Pads
Lack of Riparian Cover - Bare Streambanks
Urbanization/Construction
ATV Trails through Streambeds and Banks
Excavation of Gravel Pits in Flood Plains
Improperly Reclaimed Strip Mine Ground
Flow Alterations Channelized Stream Segments to Counter
Flash Flooding

Table 48a. Non-point source pollution affecting the Captina watershed .
Tributary Name Length
(miles)
Attainment
Status Nonpoint Cause of Impairment
Long Run (N.F.) 6.4 Full Excessive Siltation/Sedimentation
Anderson Run 4.6 Unknown Excessive Siltation/Sedimentation
North Fork 10.5 Full
Nutrient Loading/High
Ammonia/Nitrate
Table 48b. Impairments due to naturally occurring features in stream.
Tributary Name
Location
of
Feature
Attainment
Status Nonpoint Cause of Impairment
Cat Run 7.8 Full/Partial
Waterfall possibly impacting IBI scores
upstream
South Fork 4.6 Full/Partial
Extensive beds of limestone create
shallow pools that impair fish habitat
Table 48b.
Water Segment Effect Source
Long Run (N.F.) Excessive Siltation Possibly due to runoff from abandoned strip mine grounds
Anderson Run Excessive Siltation Attributed to erosion of stream banks and channels due to ATV traffic riding between Centerville and Armstrongs Mills
Cat Run Natural Habitat Fragmented riparian cover near agricultural fields in downstream sections.
North Fork Nutrient Loading
Improperly treated wastewater discharge from the BWWTP combined with inadequate septic field installations from seasonal cabins and trailers along the creek.
South Fork Nutrient Loading Livestock access to stream, Missing sections of riparian corridor where creek cuts through agricultural fields.
Natural Habitat
North Fork Subwatershed 12-Digit HUC: 050301060901
Home Sewage Treatment Systems
Rural residences located outside of village public sanitary sewer networks use private septic
tanks with leach field drainages. Septic tanks filter home sewage using a two-step process. The
first step involves collecting raw sewage in a large concrete tank buried below the freeze line

down slope of a residential dwelling. Specialized bacteria in the tank biochemically degrade the
sewage into a liquid effluent which then drains into a leach field. The second step of the process
involves mechanical filtration of the effluent in a leach field which consists of a long perforated
pipe surrounded by polymer filler or gravel. The length of the pipe can be anywhere from 400 to
1000' and multiple pipes can service one tank. The length and number of leach field pipes is
determined by the estimated maximum load placed on the system. For example, based on
Belmont County Sanitary Sewer District requirements, a three bedroom home will need two 450'
leach pipes connected to a 1500 gallon collection tank.
Septic tanks can degrade stream quality if not properly maintained. Excess nitrogen and
fecal coliforms are generally seen in runoff from failing systems. Within the Captina Creek
watershed region there are estimated to be 1,930 septic tanks. This number was derived from
the actual number of septic tanks by township to estimated septic tanks by subwatershed
boundaries. The average septic tank in Belmont County was installed in 1988 which makes the
average septic tank over 20 years old. The Department of Agriculture estimates that 2.18% of
the septic tanks in the area are failing. This estimate was generated by a web tool, and it may be
possible that up to failure rates are higher than this. According to the EPA, septic systems
generally have a failure rate of about 1-5 percent, and southeastern Ohio has a lower failure rate
when compared to the rest of the state.
The data compiled for the septic systems in the Captina watershed are from the Belmont
County Health Department. The county records were extracted by addresses within the
watershed boundaries. Septic tank age is based on original installation date. Tanks that are no
longer in use or have been recently updated may appear in the spreadsheet as over 20 years.
Because of this, the percent of septic tanks over 20 years old may reflect a higher number than
actual numbers.
An area of concern may be the installation of seasonal trailers and cabins along the North
Fork to service absentee land owners and hunters. Few of these facilities have adequate sewage
disposal and sometimes let raw sewage enter directly into the streambed.
Table 46.
Septic Tanks Failure Rate (2.18%)
406 8.8
Age
Over 20 Years 10-20 Years >10 Years
49% 21% 30%
New Home Construction
The exact number of new homes and buildings built in the North Fork subwatershed area is
unknown. Visual observations from drive-by reveal three new homes constructed near Long
Run and Sandy Ridge within the last year. More homes possibly have been built, but have not
been observed. Building and zoning codes are limited in Belmont County with neither required
for residences in rural areas. Hence the US Census Bureau recorded only 10 building permits in
the entire County in 2008 even though the total number of new homes probably exceeded this

value. It is estimated that few homes will be built along streams in this subwatershed with
decreases in population and economy.
Animal Feeding Operations
Animal feeding operations of large scales, also referred to as industrial farming, are not
typical in the North Fork subwatershed area. Industrial farming operations use animal confined,
cost-effective methods to increase profits. Farming and ranching are somewhat common in
Belmont and Monroe Counties, and within the subwatershed area, but small family-run
operations are the typical practice. The USDA estimates 2.19 feedlots are in the area based on
minimum space requirements needed by animals, however these feedlots are not observed in the
subwatershed area.
Erodible Land
During periods of no precipitation, the North Fork subwatershed has excellent water quality
for sedimentation. It has less than 6.2 mg/l of total suspended solids with visibility over 36
inches. During periods of rain, the North Fork Subwatershed remains clear with visibility still
over 36 inches. Using sedimentation calculations, the North Fork dumps between 50-367
lbs/day of sediment into the Captina Creek (Total Suspended Solids are less than device can
measure). Data was collected using a sediment stick over a period of 6 months.
Channelized & Levied
There are 30.84 (98.5%) miles of natural channel with 0.23 miles of channel being
artificially modified. The modified sections are located in a tributary of Long Run (0.23 miles
affected) where strip mining has occurred and near the headwaters of the North Fork Captina
Creek (0.35 miles affected) at the Barnesville waste water treatment plant.
Human Impact
The North Fork subwatershed area does not appear to be impacted by humans as much as
other subwatersheds in the Captina Creek watershed region. The North Fork has more homes
than other subwatershed areas, but does not have as many homes or intensive land use near
larger streams. As mentioned previously, this subwatershed area has been extensively surface
mined in the Long Run area which may be contributing to sedimentation observed in
downstream portions of the tributary. Other impacts include seasonal residences with no septic
systems along SR 148, elevated ammonia levels downstream of the Barnesville WWTP, and
limited numbers of livestock having access near headwater streams along SR 148 (near SR800).
Effluent Volume

Non point source pollution effluent volume is not known, and is very difficult to quantify.
Polluting effluent consists of emissions from faulty treatment equipment at the Barnesville
WWTP, from an estimated 12 seasonal hunting cabins and trailers with no septic tanks, from
limited amounts of livestock waste, and possibly seasonal lawn/agriculture runoff from the
southeast side of Barnesville.
Dammed
There are 7 major dams located in the North Fork subwatershed area. Barnesville
Reservoirs #1 and #2 drain into North Fork Captina Creek and are 12.2 and 20.6 surface acres
respectively. Neither lake impounds any named streams. Another dam located at the Bethesda
Sportsman's Club Pond begins the headwaters of Long Run and is approximately 8 acres in
surface area. The Bethesda Village Reservoir is 11 acres of surface water in area and located in
the headwaters of Jakes Run. Three private dams are located on Long Run next to and on the
stream, and heavy sedimentation is often seen within Long Run, possibly from previously strip
mined grounds. The private ponds are 2, 4, and 18 acres of surface water. The 3 private ponds
are downstream of 4.5 miles of Long Run.
Petition Ditches
No petition ditches are known to exist at this time in the North Fork subwatershed area.
South Fork Subwatershed
12-Digit HUC: 050301060902
Home Sewage Treatment Systems
Rural residences located outside of village public sanitary sewer networks use private septic
tanks with leach field drainages. Septic tanks filter home sewage using a two-step process. The

first step involves collecting raw sewage in a large concrete tank buried below the freeze line
down slope of a residential dwelling. Specialized bacteria in the tank biochemically degrade the
sewage into a liquid effluent which then drains into a leach field. The second step of the process
involves mechanical filtration of the effluent in a leach field which consists of a long perforated
pipe surrounded by polymer filler or gravel. The length of the pipe can be anywhere from 400 to
1000' and multiple pipes can service one tank. The length and number of leach field pipes is
determined by the estimated maximum load placed on the system. For example, based on
Belmont County Sanitary Sewer District requirements, a three bedroom home will need two 450'
leach pipes connected to a 1500 gallon collection tank.
Septic tanks can degrade stream quality if not properly maintained. Excess nitrogen and
fecal coliforms are generally seen in runoff from failing systems. Within the Captina Creek
watershed region there are estimated to be 1,930 septic tanks. This number was derived from
the actual number of septic tanks by township to estimated septic tanks by subwatershed
boundaries. The average septic tank in Belmont County was installed in 1988 which makes the
average septic tank over 20 years old. The Department of Agriculture estimates that 2.18% of
the septic tanks in the area are failing. This estimate was generated by a web tool, and it may be
possible that up to failure rates are higher than this. According to the EPA, septic systems
generally have a failure rate of about 1-5 percent, and southeastern Ohio has a lower failure rate
when compared to the rest of the state.
The data compiled for the septic systems in the Captina watershed are from the Belmont
County Health Department. The county records were extracted by addresses within the
watershed boundaries. Septic tank age is based on original installation date. Tanks that are no
longer in use or have been recently updated may appear in the spreadsheet as over 20 years.
Because of this, the percent of septic tanks over 20 years old may reflect a higher number than
actual number.
Table 47.
Septic Tanks Failure Rate (2.18%)
215 4.7
Age
Over 20 Years 10-20 Years >10 Years
48% 22% 30%
New Home Construction
The exact number of new homes and buildings built in the South Fork subwatershed is
unknown. More homes possibly have been built, but have not been seen in mobile drive-by
observation. The US Census Bureau recorded only 10 building permits in the entire County in
2008. It is estimated that few homes will be built with decreases in population and economy.
Animal Feeding Operations

Animal feeding operations of large scales, also referred to as industrial farming, are not
implemented in the watershed. Industrial farming operations use animal confined, cost-effective
methods to increase profits. Farming and ranching are common within Belmont and Monroe
Counties, and within the watershed area, but family-run operations are the typical practice. The
USDA website estimates 2.19 feedlots are in the area based on minimum space requirements
needed by animals, but they have not been observed.
Erodible Land
During periods of no precipitation, the South Fork subwatershed has excellent water quality
for sedimentation. It has less than 6.2 mg/l of total suspended solids with visibility over 36
inches. During periods of rain, the South Fork subwatershed remains clear with visibility still
over 36 inches. Using sedimentation calculations, the South Fork dumps 33-367 lbs/day of
sediment into the Captina Creek (Total Suspended Solids are less than device can measure).
Data was collected using a sedimentation stick over a period of 6 months.
Channelized & Levied
There are 47.3 miles (99%) of natural channel with 0.7 miles of channel being modified.
The majority of the channelized stream segments are around South Fork Captina Creek and are
channelized near farmland by the creek, or near roads. The stream segment by the outfall of
Slope Creek Dam is also channelized.
Human Impact
The South Fork subwatershed area is visibly impacted by humans in some locations because
of agricultural land use. Agriculture and livestock are heavily present in some areas with
fragmented riparian corridor and livestock access to the creekbed. Nutrient loading is evident in
certain areas due to observed blooms of algae present in pools within the creek during warmer
months of the year.
Effluent Volume
The non point source pollution effluent is not known, and is very difficult to quantify. The
effluent would mostly consist of agricultural runoff into streams combined with faulty or missing
septic field service to rural residences.
Dammed

South Fork subwatershed has two major dams. Slope Creek Dam is located on Slope Creek,
and retains Barnesville Reservoir #3. Barnesville Reservoir #3 is approximately 82 acres in
surface area and is located 2 miles downstream of the headwaters of Slope Creek. The other dam
is a private dam which retains a surface area over 10 acres of water. The outflow of this dam
drains into Cranenest Creek and no named streams drain into the dam.
Petition Ditches
No petition ditches are known to exist in the South Fork subwatershed at this time.

Bend Fork Subwatershed 12-Digit HUC: 050301060903
Home Sewage Treatment Systems
Rural residences located outside of village public sanitary sewer networks use private septic
tanks with leach field drainages. Septic tanks filter home sewage using a two-step process. The
first step involves collecting raw sewage in a large concrete tank buried below the freeze line
down slope of the residence. Specialized bacteria in the tank biochemically degrade the sewage
into a liquid effluent which then drains into a leach field. The second step of the process
involves mechanical filtration of the effluent in a leach field which consists of a long perforated
pipe surrounded by polymer filler or gravel. The length of the pipe can be anywhere from 400 to
1000' and multiple pipes can service one tank. The length and number of leach field pipes is
determined by the estimated maximum load placed on the system. For example, based on
Belmont County Sanitary Sewer District requirements, a three bedroom home will need two 450'
leach pipes connected to a 1500 gallon collection tank.
Septic tanks can degrade stream quality if not properly maintained. Excess nitrogen and
fecal coliforms are generally seen in runoff from failing systems. Within the Captina Creek
watershed region there are estimated to be 1,930 septic tanks. This number was derived from
the actual number of septic tanks by township to estimated septic tanks by subwatershed
boundaries. The average septic tank in Belmont County was installed in 1988 which makes the
average septic tank over 20 years old. The Department of Agriculture estimates that 2.18% of
the septic tanks in the area are failing. This estimate was generated by a web tool, and it may be
possible that up to failure rates are higher than this. According to the EPA, septic systems
generally have a failure rate of about 1-5 percent, and southeastern Ohio has a lower failure rate
when compared to the rest of the state.
The data compiled for the septic systems in the Captina watershed are from the Belmont
County Health Department. The county records were extracted by addresses within the
watershed boundaries. Septic tank age is based on original installation date. Tanks that are no
longer in use or have been recently updated may appear in the spreadsheet as over 20 years.
Because of this, the percent of septic tanks over 20 years old may reflect a higher number than
actual numbers. Table 48.
Septic Tanks Failure Rate (2.18%)
270 5.9
Age
Over 20 Years 10-20 Years >10 Years
46% 26% 28%

New Home Construction
The exact number of new homes and buildings built in Bend Fork subwatershed is unknown.
More homes possibly have been built, but have not been seen in vehicle drive-by observations.
The US Census Bureau recorded only 10 building permits in the entire County in 2008. It is
estimated that few homes will be built with decreases in population and economy.
Animal Feeding Operations
Animal feeding operations of large scales, also referred to as industrial farming, are not
implemented in this subwatershed area. Industrial farming operations use animal confined, cost-
effective methods to increase profits. Farming and ranching are common within Belmont and
Monroe Counties, and within the subwatershed area, but family-run operations are the typical
practice. The USDA website estimates 2.19 feedlots are in the area based on minimum space
requirements needed by animals, but they have not been observed.
Erodible Land
During periods of no precipitation, Bend Fork subwatershed has excellent water quality for
sedimentation. It has less than 6.2 mg/l of total suspended solids with visibility over 36 inches.
During periods of rain, Bend Fork subwatershed remains clear with visibility still over 36 inches.
Using sedimentation calculations, Bend Fork dumps between 20-334 lbs/day of sediment into
Captina Creek depending on stream flow. Data was collected using a sedimentation stick over a
period of 6 months.
Channelized & Levied
There are 32.5 miles (94%) of natural channel in Bend Fork subwatershed with 1.96 miles of
channel being modified. The modified sections are located on Bend Fork and Joy Fork. Most of
the modified channel consists of short segments that have been straightened near a home or
agricultural field. Channelization was also observed along property lines or roads and driveways
that cross the creek. The quantified effect of channelization on streams in Bend Fork is unknown
but increases may lead t sedimentation downstream.
Human Impact
Bend Fork subwatershed does not appear to be impacted by humans as much as other
subwatershed areas in the Captina Creek watershed region. There have been areas surface mined
within the subwatershed, but they have been reclaimed. The most visible human impact is in the
southern sections of the subwatershed where more population interacts with the stream. In these
areas, driveways cross the creek and homes are built along the edge of the streams. ATV traffic
is prevalent in the downstream portions of the subwatershed area affecting Millers Run and Bend

Fork. Also two large gravel pits are located downstream of township road 234 which could add
to the sediment load of Bend Fork. In general, over its entire length Bend Fork remains highly
vegetated and many of the streams flow through dense forest with little human impact.
Effluent Volume
The non point source pollution effluent is not known, and is very difficult to quantify. The
effluent would consist of sediment from eroding streambanks and beds as well as any discharge
from faulty or missing septic tanks.
Dammed
There is one major dam in the Bend Fork subwatershed area that forms one of the Bethesda
Reservoirs at the headwaters of Bend Fork. The reservoir covers 8.5 acres of surface area and its
outfall flows 0.6 miles before it reaches Bend Fork.
Petition Ditches
No petition ditches are known to exist in the Bend Fork subwatershed at this time.

Piney Creek Subwatershed 12-Digit HUC: 050301060904
Home Sewage Treatment Systems
Rural residences located outside of village public sanitary sewer networks use private septic
tanks with leach field drainages. Septic tanks filter home sewage using a two-step process. The
first step involves collecting raw sewage in a large concrete tank buried below the freeze line
down slope of the residence. Specialized bacteria in the tank biochemically degrade the sewage
into a liquid effluent which then drains into a leach field. The second step of the process
involves mechanical filtration of the effluent in a leach field which consists of a long perforated
pipe surrounded by polymer filler or gravel. The length of the pipe can be anywhere from 400 to
1000' and multiple pipes can service one tank. The length and number of leach field pipes is
determined by the estimated maximum load placed on the system. For example, based on
Belmont County Sanitary Sewer District requirements, a three bedroom home will need two 450'
leach pipes connected to a 1500 gallon collection tank.
Septic tanks can degrade stream quality if not properly maintained. Excess nitrogen and
fecal coliforms are generally seen in runoff from failing systems. Within the Captina Creek
watershed region there are estimated to be 1,930 septic tanks. This number was derived from
the actual number of septic tanks by township to estimated septic tanks by subwatershed
boundaries. The average septic tank in Belmont County was installed in 1988 which makes the
average septic tank over 20 years old. The Department of Agriculture estimates that 2.18% of
the septic tanks in the area are failing. This estimate was generated by a web tool, and it may be
possible that up to failure rates are higher than this. According to the EPA, septic systems
generally have a failure rate of about 1-5 percent, and southeastern Ohio has a lower failure rate
when compared to the rest of the state.
The data compiled for the septic systems in the Captina watershed are from the Belmont
County Health Department. The county records were extracted by addresses within the
watershed boundaries. Septic tank age is based on original installation date. Tanks that are no
longer in use or have been recently updated may appear in the spreadsheet as over 20 years.
Because of this, the percent of septic tanks over 20 years old may reflect a higher number than
actual numbers.
Table 49.
Septic Tanks Failure Rate (2.18%)
177 3.9
Age
Over 20 Years 10-20 Years >10 Years
46% 24% 30%

New Home Construction
The exact number of new homes and buildings built in Piney Creek subwatershed is
unknown. More homes possibly have been built, but have not been seen in vehicle drive-by's.
The US Census Bureau recorded only 10 building permits in the entire County in 2008. It is
estimated that few homes will be built with decreases in population and economy.
Animal Feeding Operations
Animal feeding operations of large scales, also referred to as industrial farming, are not
implemented in Piney Creek subwatershed. Industrial farming operations use animal confined,
cost-effective methods to increase profits. Farming and ranching are common within Belmont
and Monroe Counties, and within the subwatershed, but family-run operations are the typical
practice. The USDA website estimates 2.19 feedlots are in the area based on minimum space
requirements needed by animals, but they have not been observed.
Erodible Land
During periods of no precipitation, Piney Creek and its tributaries have good water quality
for sedimentation but contains more sediment than other creeks in the watershed region.
Sedimentation ranges from 6.2 to 21.6 mg/l of total suspended solids were recorded at the
confluence of Captina Creek and Piney Creek. Total Suspended Solids values of 167 to 701
lbs/day were calculated for the mainstem of Captina Creek in this subwatershed area. Data was
collected using a sedimentation stick over a period of 6 months. Possible sources of sediment
could originate from Century Mine located along Piney Creek.
Channelized & Levied
Within Piney Creek subwatershed, very few streams have been channelized. Less than 0.25
total miles of stream have been channelized or artificially modified. There are 6 known locations
that have been modified from their natural state to control stream flow around homes and roads.
Human Impact
The Piney Creek subwatershed is possibly the most impacted subwatershed area in the
region in terms of human activity. Two sub-surface coal mining operations exist here, one along
the mainstem of Captina Creek (Powhatan #6) and one along Piney Creek (Century Mine).
Since 2008 two slurry spills have occurred in this subwatershed area both originating from a
transfer pipe running between the two mines. The slurry impoundment facility at OVCC
Powhatan #6 coal mine has the potential to affect the mainstem of Captina Creek but does not
allow slurry into the creek under normal conditions. Pending the USEPA's decision, Casey Run
may be the location of the OVCC's new slurry impoundment, as the current location is

approaching full capacity. Other than the coal mines, agriculture along upstream portions of
Long Run and downstream portions of Berrys Run is the other human impact within the
subwatershed area. In general most of the tributaries in Piney Creek subwatershed are forested
and have little human presence.
Effluent Volume
The non point source pollution effluent is not known, and is very difficult to quantify. The
effluent would consist of any discharges emitted from the OVCC impoundment (slurry, metals
and TDS), agricultural runoff and sediment from eroding banks.
Dammed
There are 4 major dams located in the Piney Creek subwatershed area. The OVCC slurry
impoundment dam is privately owned and operated to hold coal waste from both the Century
Mine and Powhatan #6 mine. It is built on a pre-existing creek named Perkins Run and holds
182 surface acres of water and coal slurry which is more dense and thus sinks to the bottom of
the impoundment. The impoundment is close to reaching its maximum volume and a permit has
been applied for that would raise allow the OVCC to raise the current height of the dam to make
room for additional slurry. Switzerland Lake is another major dam in the Piney Creek
subwatershed area located in the headwaters of Piney Creek near Wilson. It also holds 42 acres
of surface water. The other two dams are located on private lots near Beallsville at the
headwaters of Piney Creek and Crabapple Creek. Neither is on a named stream and each is less
than 10 acres of surface water.
Petition Ditches
No petition ditches are known to exist in Piney Creek subwatershed at this time.

Pea Vine Creek Subwatershed 12-Digit HUC: 050301060905
Home Sewage Treatment Systems
Rural residences located outside of village public sanitary sewer networks use private septic
tanks with leach field drainages. Septic tanks filter home sewage using a two-step process. The
first step involves collecting raw sewage in a large concrete tank buried below the freeze line
down slope of the residence. Specialized bacteria in the tank biochemically degrade the sewage
into a liquid effluent which then drains into a leach field. The second step of the process
involves mechanical filtration of the effluent in a leach field which consists of a long perforated
pipe surrounded by polymer filler or gravel. The length of the pipe can be anywhere from 400 to
1000' and multiple pipes can service one tank. The length and number of leach field pipes is
determined by the estimated maximum load placed on the system. For example, based on
Belmont County Sanitary Sewer District requirements, a three bedroom home will need two 450'
leach pipes connected to a 1500 gallon collection tank.
Septic tanks can degrade stream quality if not properly maintained. Excess nitrogen and
fecal coliforms are generally seen in runoff from failing systems. Within the Captina Creek
watershed region there are estimated to be 1,930 septic tanks. This number was derived from
the actual number of septic tanks by township to estimated septic tanks by subwatershed
boundaries. The average septic tank in Belmont County was installed in 1988 which makes the
average septic tank over 20 years old. The Department of Agriculture estimates that 2.18% of
the septic tanks in the area are failing. This estimate was generated by a web tool, and it may be
possible that up to failure rates are higher than this. According to the EPA, septic systems
generally have a failure rate of about 1-5 percent, and southeastern Ohio has a lower failure rate
when compared to the rest of the state.
The data compiled for the septic systems in the Captina watershed are from the Belmont
County Health Department. The county records were extracted by addresses within the
watershed boundaries. Septic tank age is based on original installation date. Tanks that are no
longer in use or have been recently updated may appear in the spreadsheet as over 20 years.
Because of this, the percent of septic tanks over 20 years old may reflect a higher number than
actual numbers.
Table 50.
Septic Tanks Failure Rate (2.18%)
136 3.0
Age
Over 20 Years 10-20 Years >10 Years
53% 21% 26%

New Home Construction
The exact number of new homes and buildings built in Pea Vine Creek subwatershed is
unknown though 5-10 new constructed homes have been observed over the last 6 years. New
homes possibly have been built, but have not been seen in vehicle drive-by's. The US Census
Bureau recorded only 10 building permits in the entire County in 2008. It is estimated that few
homes will be built with decreases in population and economy.
Animal Feeding Operations
Animal feeding operations of large scales, also referred to as industrial farming, are not
implemented in the Pea Vine Creek subwatershed. Industrial farming operations use animal
confined, cost-effective methods to increase profits. Farming and ranching are common within
Belmont and Monroe Counties, and within the subwatershed area, but family-run operations are
the typical practice. The USDA website estimates 2.19 feedlots are in the area based on
minimum space requirements needed by animals, but they have not been observed.
Erodible Land
During periods of no precipitation, streams in Pea Vine Creek subwatershed have excellent
water quality for sedimentation. Pea Vine Creek itself has less than 6.2 mg/l of total suspended
solids with visibility over 36 inches. During periods of rainfall, Pea Vine Creek remains clear
with visibility still over 36 inches. Using sedimentation calculations, Captina Creek receives 110
to 1,100 lbs/day of sediment from Pea Vine Creek. Data was collected using a sedimentation
stick over a period of 6 months.
Channelized & Levied
Within Pea Vine Creek subwatershed there are three sections of stream that have been
channelized. The channelized sections are on Captina Creek, Moore Run, and on Rocky Fork.
The sections on Moore Run and Rocky Fork are less than 0.1 miles in length and are located at
confluences with Captina Creek where culverts have been installed under SR 148 and the
railroad tracks.
Human Impact
Some streams in this subwatershed area have been impacted more than others though all
streams are in good condition in terms of habitat and biodiversity. Pea Vine Creek is mostly
forested and shows signs of impact from ATV traffic, logging operations and construction of
scattered seasonal hunting cabins. Moore and Anderson Runs are also mostly forested but have
abandoned township roads running along their lengths that serve as access for ATV traffic.
Rocky Fork has some agriculture in its headwaters but the impact is minimal due to size and

coverage. Areas of minimal human impact are scattered along the mainstem of Captina Creek
from Armstrongs Mills to Steinersville. A golf course is managed with conservation practices in
mind while private residences and some agriculture boarder the creek, but most of the land use is
deciduous forest.
Settling ponds used to treat acid mine drainage are located at Linn Tipple and at a reclaimed
AML gob pile approximately one mile east of Linn Tipple. A 3.5 acre unreclaimed gob pile is
located above the railroad tracks at the Linn Tipple facility. Other AMD sites can be seen
discharging into the creek further downstream in York township from abandoned strip mines
near the base of Dover Ridge. Officials from OEPA have commented that drainage from this
location seems to have no impact on aquatic life or water chemistry in Captina Creek.
Effluent Volume
Non point source pollution effluent is not known, and is very difficult to quantify. The
effluent would consist of any AMD seepages from previously surface and sub-surface mining,
erosion from streambanks, runoff from agricultural land, fertilizers and runoff from seasonal
cabins with inadequate sewage systems.
Dammed
There are no major dams located in Pea Vine Creek subwatershed area.
Petition Ditches
No petition ditches are known to exist in the Pea Vine Creek subwatershed area at this time.

Cat Run Subwatershed 12-Digit HUC: 050301060906
Home Sewage Treatment Systems
Rural residences located outside of village public sanitary sewer networks use private septic
tanks with leach field drainages. Septic tanks filter home sewage using a two-step process. The
first step involves collecting raw sewage in a large concrete tank buried below the freeze line
down slope of the residence. Specialized bacteria in the tank biochemically degrade the sewage
into a liquid effluent which then drains into a leach field. The second step of the process
involves mechanical filtration of the effluent in a leach field which consists of a long perforated
pipe surrounded by polymer filler or gravel. The length of the pipe can be anywhere from 400 to
1000' and multiple pipes can service one tank. The length and number of leach field pipes is
determined by the estimated maximum load placed on the system. For example, based on
Belmont County Sanitary Sewer District requirements, a three bedroom home will need two 450'
leach pipes connected to a 1500 gallon collection tank.
Septic tanks can degrade stream quality if not properly maintained. Excess nitrogen and
fecal coliforms are generally seen in runoff from failing systems. Within the Captina Creek
watershed region there are estimated to be 1,930 septic tanks. This number was derived from
the actual number of septic tanks by township to estimated septic tanks by subwatershed
boundaries. The average septic tank in Belmont County was installed in 1988 which makes the
average septic tank over 20 years old. The Department of Agriculture estimates that 2.18% of
the septic tanks in the area are failing. This estimate was generated by a web tool, and it may be
possible that up to failure rates are higher than this. According to the EPA, septic systems
generally have a failure rate of about 1-5 percent, and southeastern Ohio has a lower failure rate
when compared to the rest of the state.
The data compiled for the septic systems in the Captina watershed are from the Belmont
County Health Department. The county records were extracted by addresses within the
watershed boundaries. Septic tank age is based on original installation date. Tanks that are no
longer in use or have been recently updated may appear in the spreadsheet as over 20 years.
Because of this, the percent of septic tanks over 20 years old may reflect a higher number than
actual numbers.
Table 51.
Septic Tanks Failure Rate (2.18%)
101 2.1
Age
Over 20 Years 10-20 Years >10 Years
58% 22% 20%

New Home Construction
The exact number of new homes and buildings built in Cat Run subwatershed is unknown
but limited construction in the last 5 years has been around Powhatan Point. More homes
possibly have been built, but have not been seen in vehicle drive-by observations. The US
Census Bureau recorded only 10 building permits in the entire County in 2008. It is estimated
that few homes will be built with decreases in population and economy.
Animal Feeding Operations
Animal feeding operations of large scales, also referred to as industrial farming, are not
implemented in the Cat Run subwatershed area. Industrial farming operations use animal
confined, cost-effective methods to increase profits. Farming and ranching are common within
Belmont and Monroe Counties, and somewhat common within the subwatershed area, but
family-run operations are the typical practice. The USDA website estimates 2.19 feedlots are in
the area based on minimum space requirements needed by animals, but they have not been
observed.
Erodible Land
During periods of no precipitation, Cat Run has excellent water quality for sedimentation.
Two major streams empty into Captina Creek at different areas in this subwatershed. The mouth
of Porters Run and the mouth of Cat Run each have less than 6.2 mg/l of total suspended solids
with visibility over 36 inches. This amounts to less than 15 lbs/day of sediment that flows into
Captina Creek from both streams in the Cat Run subwatershed.
Channelized & Levied
Two sections of streams are modified in the Cat Run watershed. Porters Run is culverted
under SR 148 before crossing into the Clair-Mar golf course and a section in Captina Creek is
modified near a bridge on the west end of the course. Both modified sections total less than 425
feet combined.
Human Impact
Cat Run subwatershed has many houses near the streams, and much more people living in
the entire subwatershed area compared to other sparsely populated subwatersheds. Powhatan
Point is located on the confluence of Captina Creek and the Ohio River. The population is the
most dense north of the creek and scattered near the banks of Captina Creek. There is also a golf
course constructed on the western edge of Powhatan Point. Human impacts also include a
passive treatment AMD dosing silo along Cove Road to treat discharge from the abandoned
Powhatan #2 subsurface coal mine. Belmont County Health Department has noted improperly

treated sewage discharging from homes with inadequate septic fields in Steinersville along SR
148. Few livestock and agriculture practices exist in this area and seemed to be concentrated
along Cat Run near the Belmont/Monroe county line. In Powhatan Point complaints have been
made against people dumping grass and brush into the creek and excessively eroding the banks
of Captina Creek with boat traffic.
Effluent Volume
Non point source pollution effluent is not known for this subwatershed area and is very
difficult to quantify. Total non-point source pollution would consist of any leaking AMD from
an abandoned mine site on Cove Road (which is currently being treated), untreated effluent from
private homes with dysfunctional septic fields, fertilizer along with runoff from the small amount
of livestock and agriculture, and sedimentation from eroding banks.
Dammed
There are no major dams located in Cat Run subwatershed.
Petition Ditches
No petition ditches are known to exist at this time in this subwatershed area.

Pipe Creek Subwatershed 12-Digit HUC: 050301061207
Home Sewage Treatment Systems
Rural residences located outside of village public sanitary sewer networks use private septic
tanks with leach field drainages. Septic tanks filter home sewage using a two-step process. The
first step involves collecting raw sewage in a large concrete tank buried below the freeze line
down slope of the residence. Specialized bacteria in the tank biochemically degrade the sewage
into a liquid effluent which then drains into a leach field. The second step of the process
involves mechanical filtration of the effluent in a leach field which consists of a long perforated
pipe surrounded by polymer filler or gravel. The length of the pipe can be anywhere from 400 to
1000' and multiple pipes can service one tank. The length and number of leach field pipes is
determined by the estimated maximum load placed on the system. For example, based on
Belmont County Sanitary Sewer District requirements, a three bedroom home will need two 450'
leach pipes connected to a 1500 gallon collection tank.
Septic tanks can degrade stream quality if not properly maintained. Excess nitrogen and
fecal coliforms are generally seen in runoff from failing systems. Within the Captina Creek
watershed region there are estimated to be 1,930 septic tanks. This number was derived from
the actual number of septic tanks by township to estimated septic tanks by subwatershed
boundaries. The average septic tank in Belmont County was installed in 1988 which makes the
average septic tank over 20 years old. The Department of Agriculture estimates that 2.18% of
the septic tanks in the area are failing. This estimate was generated by a web tool, and it may be
possible that up to failure rates are higher than this. According to the EPA, septic systems
generally have a failure rate of about 1-5 percent, and southeastern Ohio has a lower failure rate
when compared to the rest of the state.
The data compiled for the septic systems in the Captina watershed are from the Belmont
County Health Department. The county records were extracted by addresses within the
watershed boundaries. Septic tank age is based on original installation date. Tanks that are no
longer in use or have been recently updated may appear in the spreadsheet as over 20 years.
Because of this, the percent of septic tanks over 20 years old may reflect a higher number than
actual numbers.
Table 52.
Septic Tanks Failure Rate (2.18%)
356 7.7
Age
Over 20 Years 10-20 Years >10 Years
58% 25% 17%

New Home Construction
The exact number of new homes and buildings built in Pipe Creek subwatershed is
unknown, however private home construction has been observed to be greatest in this
subwatershed area and in Wegee Creek subwatershed over the last 5-10 years compared to the
rest of the Captina watershed region as a whole. Areas where new housing has been observed
are along Horsemill Hill, Lockwood Run Road, Cash Ridge Road and Workman Road all to the
southwest of Shadyside. At least two dozen new houses have been constructed in these areas
since 2000. More homes possibly have been built, but have not been seen in vehicle drive-by
observations.
Animal Feeding Operations
Animal feeding operations of large scales, also referred to as industrial farming, is not
implemented in the Pipe Creek subwatershed area. Industrial farming operations use animal
confined, cost-effective methods to increase profits. Farming and ranching are common within
Belmont and Monroe Counties, and somewhat common within the subwatershed, but family-run
operations are the typical practice. The USDA website estimates 2.19 feedlots are in the area
based on minimum space requirements needed by animals, but they have not been observed.
Erodible Land
Acres of highly erodible land and potential soil loss – *
Channelized & Levied
Within Pipe Creek subwatershed there are three locations with modified channel due to road
and bank stabilization and flood protection along Pipe Creek Road (CR 54). The terrain is steep
like most other areas in the watershed region, but there is a larger population of people living in
the area, especially in the floodplain of Pipe Creek. With more people living near streams and
floodplains, there is much more control of waterways to protect homes. The 0.6 miles of
modified channel have been straightened and dredged because of flash flooding problems in the
past.
Human Impact
A direct tributary of the Ohio river, Pipe Creek itself has more visible, non-industrial human
impact than other subwatersheds of Captina Creek watershed region. The water quality of Pipe
Creek is not as exceptional as some streams in the region due partly to artificial modification of
stream channel near its mouth and a history of acid mine drainage from an abandoned coal mine
in Businessburg. Gabion baskets used for flood control line the creek at certain points and
combined with residential floodplain occupancy, make the establishment of riparian zones

difficult in some areas. In the 2009 analysis of Pipe Creek's stream habitat and water quality,
OEPA biologists noted improvement in water chemistry from past values and recommended its
status be raised from limited resource water (LRW) to warmwater habitat (WWH) for fish. The
same could not be said for Big Run which continues to be affected by two gob piles left near its
mouth from abandoned Powhatan #3 subsurface coal mine. Drainage from these piles limits
accessibility of upstream areas to fish populations.
Small scale agriculture and livestock facilities are visible in the headwaters of Pipe Creek
and also along the ridgetops of Lockwood Run Road and Mt. Victory Ridge . SR 7 passes
through the east end of the subwatershed along the Ohio River and Pipe Creek Road (CR 54)
runs parallel to Pipe Creek. Cooling ponds associated with First Energy's Burger Power Plant
are located at Dilles Bottom on the Ohio River along with a gravel company and two trucking
companies
Effluent Volume
Non point source pollution effluent volume is not known, and is very difficult to quantify for
the Pipe Creek subwatershed area. Total non-point source pollution would consist of any
remaining acid mine drainage from abandoned subsurface coal mines, storm runoff from private
homes, runoff from small livestock and agriculture operations, runoff from any faulty septic
tanks, and sedimentation from eroding banks and land.
Dammed
There are no major dams located in the Pipe Creek subwatershed area.
Petition Ditches
No petition ditches are known to exist at this time in the Pipe Creek subwatershed area.

Wegee Creek Subwatershed 12-Digit HUC: 050301061206
Home Sewage Treatment Systems
Rural residences located outside of village public sanitary sewer networks use private septic
tanks with leach field drainages. Septic tanks filter home sewage using a two-step process. The
first step involves collecting raw sewage in a large concrete tank buried below the freeze line
down slope of the residence. Specialized bacteria in the tank biochemically degrade the sewage
into a liquid effluent which then drains into a leach field. The second step of the process
involves mechanical filtration of the effluent in a leach field which consists of a long perforated
pipe surrounded by polymer filler or gravel. The length of the pipe can be anywhere from 400 to
1000' and multiple pipes can service one tank. The length and number of leach field pipes is
determined by the estimated maximum load placed on the system. For example, based on
Belmont County Sanitary Sewer District requirements, a three bedroom home will need two 450'
leach pipes connected to a 1500 gallon collection tank.
Septic tanks can degrade stream quality if not properly maintained. Excess nitrogen and
fecal coliforms are generally seen in runoff from failing systems. Within the Captina Creek
watershed region there are estimated to be 1,930 septic tanks. This number was derived from
the actual number of septic tanks by township to estimated septic tanks by subwatershed
boundaries. The average septic tank in Belmont County was installed in 1988 which makes the
average septic tank over 20 years old. The Department of Agriculture estimates that 2.18% of
the septic tanks in the area are failing. This estimate was generated by a web tool, and it may be
possible that up to failure rates are higher than this. According to the EPA, septic systems
generally have a failure rate of about 1-5 percent, and southeastern Ohio has a lower failure rate
when compared to the rest of the state.
The data compiled for the septic systems in the Captina watershed are from the Belmont
County Health Department. The county records were extracted by addresses within the
watershed boundaries. Septic tank age is based on original installation date. Tanks that are no
longer in use or have been recently updated may appear in the spreadsheet as over 20 years.
Because of this, the percent of septic tanks over 20 years old may reflect a higher number than
actual numbers.
Table 53.
Septic Tanks Failure Rate (2.18%)
309 6.7
Age
Over 20 Years 10-20 Years >10 Years
58% 26% 16%

New Home Construction
The exact number of new homes and buildings built in Wegee Creek subwatershed is
unknown however more home construction has happened in this subwatershed than any other in
the past 5-10 years. Estimates of two to three dozen new homes around Shadyside in this time
period would be accurate. Most of the new homes are centered around Shadyside along Wegee
Creek, Daisy Run, Broadview Acres, Webb Heights Road and New Cut Road. Potential exists
for more development in this area, especially along New Cut Road to the north and west of
Shadyside but economic factors are greatly inhibiting growth.
Animal Feeding Operations
Animal feeding operations of large scales, also referred to as industrial farming, is not
implemented in Wegee Creek subwatershed. Industrial farming operations use animal confined,
cost-effective methods to increase profits. Farming and ranching are common within Belmont
and Monroe Counties, and somewhat common within the subwatershed, but family-run
operations are the typical practice. The USDA website estimates 2.19 feedlots are in the area
based on minimum space requirements needed by animals, but they have not been observed.
Erodible Land
Acres of highly erodible land and potential soil loss – During periods of no precipitation,
the *
Channelized & Levied
Within Wegee Creek subwatershed there is more modified stream channel than in any other
subwatershed area. The terrain is steep like most other areas in the watershed, but there is a
larger population of people living in the area. There are 0.8 miles of modified channel on Pinch
Run in south Bellaire, 1.1 miles along Daisy Run in Shadyside and 1.1 miles on Wegee Creek to
the southwest of Shadyside. Most of the dredging on Wegee Creek happened after the cleanup
of the June 1990 flash flood when the stream bed was widened and straightened near the mouth
of the creek and the streambanks were buried with cobble. The straightened channels along
Daisy Run are the result of private homes built next to the creek in which the bank has been
buttressed with concrete walls or gabion baskets. With more people living near streams and
floodplains, there is much more control of waterways to protect homes.
Human Impact
Wegee Creek is similar to Pipe Creek in that it is a direct tributary of the Ohio River and not
Captina Creek. In general, areas in eastern Ohio near the Ohio River have higher populations
than those away from the river in the Captina Creek watershed region. The village of Shadyside

and the south end of the village of Bellaire are located within the Wegee Creek subwatershed
which together represent nearly a third of the region's total population. Stone Coal Run is a
remotely located tributary of Wegee Creek with no roads or houses on its banks. Pinch Run is
more developed near Bellaire and has many houses on its banks where channelization has
occurred, but its headwaters are just the opposite being very natural and remote. Wegee Creek is
the largest stream in the subwatershed area, and the most impacted by human actions. Wegee
Creek has many houses on its banks and CR 48 runs parallel to it for over half of its length.
Many eroding banks can be seen next to the creek and an unreclaimed gob pile from abandoned
Webb mine sits on its banks. Several areas along stream have been modified due to flood control
and consist of high concrete walls and gabion baskets. Like Pipe Creek, some acid mine
drainage is present from past underground mining operations and runoff from the Webb mine
gob pile.
Small amounts of livestock and agriculture are present in the headwaters of Wegee Creek.
Accounts of unrestricted cattle access to the streambed have been recorded in this area resulting
in increased nutrient loading. The R.E. Burger power plant is partially located in the southern tip
of Wegee Creek subwatershed but its settling ponds are in Pipe Creek subwatershed area. A fly
ash storage facility exists north of the Burger plant in a streambed that drains into Dilles Bottom
and has recently moved into an adjacent valley with plans to completely fill it in with waste ash
from power plants.
Effluent Volume
Non point source pollution effluent volumes are not known for Wegee Creek and its
tributaries, and are very difficult to quantify. The total non-point source pollution would consist
of any acid mine drainage from subsurface coal mines, runoff from the Webb mine gob pile,
storm runoff from private homes, runoff from the small amount of livestock and agriculture,
runoff from any faulty septic tanks, and sedimentation from eroding banks and land.
Dammed
There are no major dams located in the Wegee Creek subwatershed area.
Petition Ditches
No petition ditches are known to exist at this time in the Wegee Creek subwatershed area.

Big Run Subwatershed 12-Digit HUC: 050301061208
Home Sewage Treatment Systems
Rural residences located outside of village public sanitary sewer networks use private septic
tanks with leach field drainages. Septic tanks filter home sewage using a two-step process. The
first step involves collecting raw sewage in a large concrete tank buried below the freeze line
down slope of the residence. Specialized bacteria in the tank biochemically degrade the sewage
into a liquid effluent which then drains into a leach field. The second step of the process
involves mechanical filtration of the effluent in a leach field which consists of a long perforated
pipe surrounded by polymer filler or gravel. The length of the pipe can be anywhere from 400 to
1000' and multiple pipes can service one tank. The length and number of leach field pipes is
determined by the estimated maximum load placed on the system. For example, based on
Belmont County Sanitary Sewer District requirements, a three bedroom home will need two 450'
leach pipes connected to a 1500 gallon collection tank.
Septic tanks can degrade stream quality if not properly maintained. Excess nitrogen and
fecal coliforms are generally seen in runoff from failing systems. Within the Captina Creek
watershed region there are estimated to be 1,930 septic tanks. This number was derived from
the actual number of septic tanks by township to estimated septic tanks by subwatershed
boundaries. The average septic tank in Belmont County was installed in 1988 which makes the
average septic tank over 20 years old. The Department of Agriculture estimates that 2.18% of
the septic tanks in the area are failing. This estimate was generated by a web tool, and it may be
possible that up to failure rates are higher than this. According to the EPA, septic systems
generally have a failure rate of about 1-5 percent, and southeastern Ohio has a lower failure rate
when compared to the rest of the state.
The data compiled for the septic systems in the Captina watershed are from the Belmont
County Health Department. The county records were extracted by addresses within the
watershed boundaries. Septic tank age is based on original installation date. Tanks that are no
longer in use or have been recently updated may appear in the spreadsheet as over 20 years.
Because of this, the percent of septic tanks over 20 years old may reflect a higher number than
actual numbers.
Table 54.
Septic Tanks Failure Rate (2.18%)
87 1.9
Age
Over 20 Years 10-20 Years >10 Years
N/A N/A 4

New Home Construction
The exact number of new homes and buildings built in Big Run subwatershed is unknown.
More homes possibly have been built, but have not been seen in vehicle drive-by observations.
The US Census Bureau recorded 0 building permits in Monroe County in 2009. It is estimated
that few homes will be built with decreases in population and economy.
Animal Feeding Operations
Animal feeding operations of large scales, also referred to as industrial farming, are not
implemented in Big Run subwatershed. Industrial farming operations use animal confined, cost-
effective methods to increase profits. Farming and ranching are common within Belmont and
Monroe Counties, and within the subwatershed, but family-run operations are the typical
practice. The USDA website estimates 2.19 feedlots are in the area based on minimum space
requirements needed by animals, but they have not been observed.
Erodible Land
Acres of highly erodible land and potential soil loss – During periods of no precipitation,
the *
Channelized & Levied
Within Big Run subwatershed there are few sections of stream that have been channelized.
Most of the channelized segments are located where Big Run, Blair Run and Little Run pass
through culverts under SR 7 to the Ohio River. Few people live along the streams of this area
which have the smallest collective discharge volumes of any subwatershed area in the Captina
Creek watershed region. Because of these two factors the flash flood threat is less here than in
other subwatershed areas.
Human Impact
The four streams that make up Big Run subwatershed area (Big Run, Little Run,
Bearwallow Run, Blair Run) are small and remotely located with good riparian cover. Kreb's
Hill Road runs parallel to the lower half of Blair Run and Switzerland TWP Road 947 travels
one half mile alongside Big Run from SR 7. A communications tower sits at the top of German
Hill above Powhatan Point and several high tension power line right-of-ways pass through the
forests of this area. A natural gas pumping station is located near the hamlet of Switzer and
several small farming and agriculture operations are located on the ridgetops of this area but
probably have little to no impact on the streams. At the very northern edge of the subwatershed
in the south end Powhatan Point is a coal loading facility for barges operated by Murray Energy.

Trucks and rail cars transport coal from Powhatan #6 and Century mines to conveyors that load
the coal onto barges for transport on the Ohio River.
Effluent Volume
Non point source pollution effluent is not known for Big Run subwatershed, and is very
difficult to quantify. The total NPS pollution would consist of runoff from private homes, runoff
from the small amount of livestock and agriculture in the area, runoff from any faulty septic
tanks, runoff from coal piles at the loading facility and sedimentation from eroding banks and
land.
Dammed
There are no major dams located in the Big Run subwatershed area.
Petition Ditches
No petition ditches are known to exist at this time in the Big Run subwatershed area.
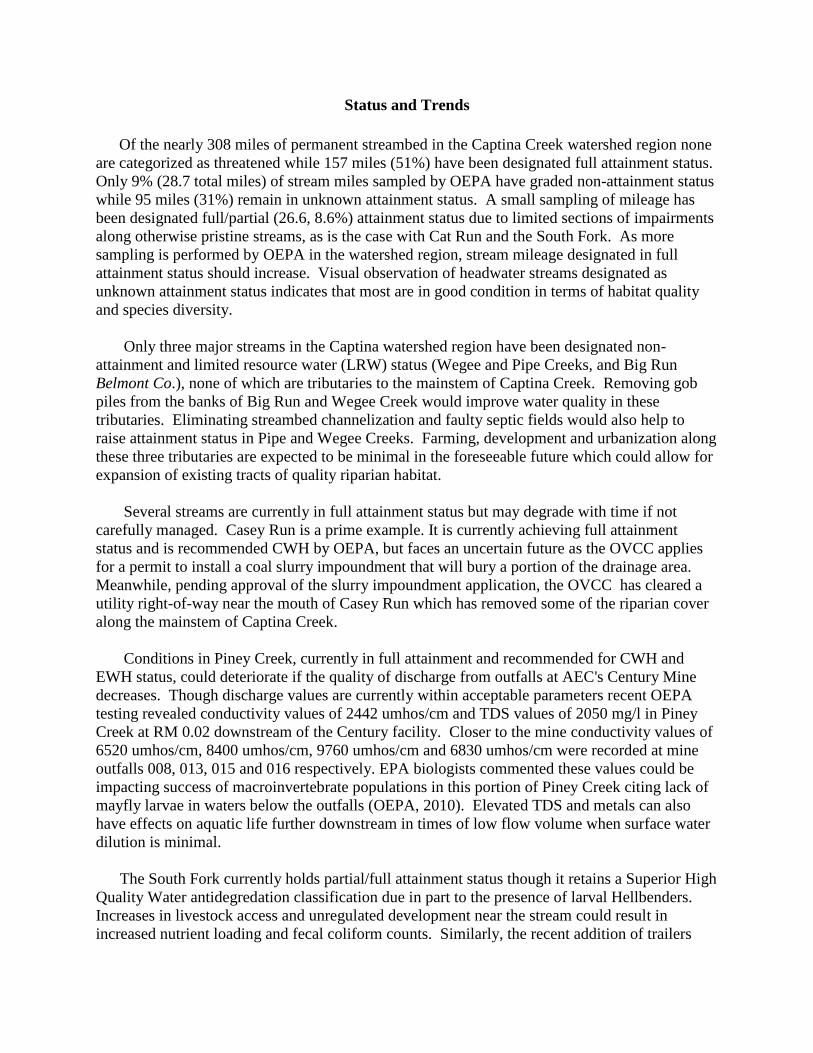
Status and Trends
Of the nearly 308 miles of permanent streambed in the Captina Creek watershed region none
are categorized as threatened while 157 miles (51%) have been designated full attainment status.
Only 9% (28.7 total miles) of stream miles sampled by OEPA have graded non-attainment status
while 95 miles (31%) remain in unknown attainment status. A small sampling of mileage has
been designated full/partial (26.6, 8.6%) attainment status due to limited sections of impairments
along otherwise pristine streams, as is the case with Cat Run and the South Fork. As more
sampling is performed by OEPA in the watershed region, stream mileage designated in full
attainment status should increase. Visual observation of headwater streams designated as
unknown attainment status indicates that most are in good condition in terms of habitat quality
and species diversity.
Only three major streams in the Captina watershed region have been designated non-
attainment and limited resource water (LRW) status (Wegee and Pipe Creeks, and Big Run
Belmont Co.), none of which are tributaries to the mainstem of Captina Creek. Removing gob
piles from the banks of Big Run and Wegee Creek would improve water quality in these
tributaries. Eliminating streambed channelization and faulty septic fields would also help to
raise attainment status in Pipe and Wegee Creeks. Farming, development and urbanization along
these three tributaries are expected to be minimal in the foreseeable future which could allow for
expansion of existing tracts of quality riparian habitat.
Several streams are currently in full attainment status but may degrade with time if not
carefully managed. Casey Run is a prime example. It is currently achieving full attainment
status and is recommended CWH by OEPA, but faces an uncertain future as the OVCC applies
for a permit to install a coal slurry impoundment that will bury a portion of the drainage area.
Meanwhile, pending approval of the slurry impoundment application, the OVCC has cleared a
utility right-of-way near the mouth of Casey Run which has removed some of the riparian cover
along the mainstem of Captina Creek.
Conditions in Piney Creek, currently in full attainment and recommended for CWH and
EWH status, could deteriorate if the quality of discharge from outfalls at AEC's Century Mine
decreases. Though discharge values are currently within acceptable parameters recent OEPA
testing revealed conductivity values of 2442 umhos/cm and TDS values of 2050 mg/l in Piney
Creek at RM 0.02 downstream of the Century facility. Closer to the mine conductivity values of
6520 umhos/cm, 8400 umhos/cm, 9760 umhos/cm and 6830 umhos/cm were recorded at mine
outfalls 008, 013, 015 and 016 respectively. EPA biologists commented these values could be
impacting success of macroinvertebrate populations in this portion of Piney Creek citing lack of
mayfly larvae in waters below the outfalls (OEPA, 2010). Elevated TDS and metals can also
have effects on aquatic life further downstream in times of low flow volume when surface water
dilution is minimal.
The South Fork currently holds partial/full attainment status though it retains a Superior High
Quality Water antidegredation classification due in part to the presence of larval Hellbenders.
Increases in livestock access and unregulated development near the stream could result in
increased nutrient loading and fecal coliform counts. Similarly, the recent addition of trailers

and cabins in the North Fork threatens its full attainment status due to faulty or lacking septic
fields next to the creek.
Pea Vine Creek is recommended dual coldwater habitat (CWH) and exceptional warmwater
habitat (EWH) status and is currently in full attainment status. It is a pristine stream with
minimal human impact and contains the largest expanse of forest found anywhere in the Captina
Creek watershed region. Potential threats to water quality in Pea Vine Creek include unregulated
ATV traffic, careless logging practices and an increase in seasonal hunting cabins with
inadequate septic systems. Other tributaries in this subwatershed area, like Anderson Run, face
similar threats from excessive ATV traffic. A golf course also exists on the banks of Captina
Creek in this subwatershed area and could potentially affect water quality with runoff from
fertilizers used to maintain the greens.
Bend Fork is designated EWH while its tributary Joy Fork is CWH. Activity along Bend
Fork like gravel extraction and ATV traffic could impair water quality. Removing the submarine
bridge acting as a fish barrier to Joy Fork will improve its Index of Biological Integrity (IBI)
score by allowing fish to migrate further upstream.
Like the South Fork, Cat Run is designated partial/full attainment status and warmwater
habitat classification. Livestock operations next to the stream potentially threaten its waters with
sedimentation and nutrient loading. Unlike the South Fork though, Cat Run has two natural
waterfalls that are acting as fish barriers limiting its IBI score, and thus keeping the stream from
attaining EWH classification. Like Pea Vine Creek subwatershed, a golf course is also present in
this subwatershed area and could potentially affect the mainstem of Captina Creek with runoff
from fertilizers. An official from the Belmont County Health Department commented on homes
near Captina Creek in the Steinersville area that have failing septic systems or no systems at all
based on dye testing.
Pipe Creek subwatershed is an impacted subwatershed area due to dredging practices that
have happened recently near the mouth of Pipe Creek. Though OEPA biologists have noted
recent improvement in Pipe Creek's water quality based on macroinvertebrate taxa sampled in
2009, threats exist that could impede the creek's recovery from a limited resource water (LRW).
Continued dredging near the mouth of the creek will degrade suitable fish habitat in the creekbed
and promote excess sedimentation downstream near the Ohio River. An abandoned subsurface
coal mine still exists near Businessburg though based on OEPA testing it is not currently
affecting water chemistry with AMD.
Outside of Pipe Creek in this subwatershed area other streams are threatened and may
degrade in the future if no actions are taken. Downstream waters near the mouth of Big Run are
greatly impacted by two gob piles that leach acid mine drainage into the creek limiting the
migration of aquatic organism upstream. Septic systems in Dilles Bottom were observed in 2009
by OEPA biologists draining into Big Run near the SR 7 bridge. Further upstream in Big Run
limited amounts of iron staining were observed on the creek bank at RM 1.3 in November of
2010, but appear not to have a significant impact on water quality as macroinvertebrate taxa were
considered good to exceptional from this area.