Causes and Consequences of Metallic Bridge Failures …epubs.surrey.ac.uk/795965/3/Causes and...
12
Causes and Consequences of Metallic Bridge Failures B.M. Imam & M.K. Chryssanthopoulos Faculty of Engineering and Physical Sciences, University of Surrey, Guildford, UK Abstract Robustness evaluation of bridges within a risk-based framework requires estimation of the probability of occurrence of different hazards followed by an assessment of the vulnerability of the bridge with respect to those hazards, as well as quantification of the consequences of potential failure. The first part of the paper deals with a statistical analysis of past metallic bridge failures which can aid towards identifying the principal hazards affecting the bridges and their associated vulnerability. The results show that natural hazards, design errors and limited knowledge are amongst the most commonly encountered causes of collapse in metallic bridges, followed by accidents and human error aspects other than in design. When analysed chronologically, the data demonstrates a decreasing trend for collapses attributed to limited knowledge and an increasing trend in failures resulting from accidents and natural hazards. The paper continues by presenting a categorisation procedure through which consequences arising from potential bridge failures can be estimated. Associated models for quantifying their magnitude considering both spatial and temporal domains are highlighted. Finally, the predictive capability of the models is outlined through a case study. Keywords: Bridges; risk assessment; robustness; failure; causes; consequences. 1. INTRODUCTION Studying past failures can be useful in mitigating the incidence and potential of future adverse events. A first step towards understanding and quantifying the risk of bridge failures can be provided by acquiring knowledge on possible failure mechanisms of existing structures and the root causes of collapse. Trends revealed through statistical analysis can aid in identifying the potential of the most significant hazards affecting bridge structures and help in planning against their consequences. An overview of past efforts in establishing databases of bridge failures and analysing them statistically is presented in [1]. These investigations covered all types of bridges without making a distinction between different constitutive materials. The aim of the present study is to synthesise and classify structural collapses in metallic bridges in particular, starting from the early 19 th century up to the present time. A database of such cases was extracted from published literature, the internet and various news reports. Statistical analysis of the database was carried out in terms of identifying the factors contributing to the collapse and the modes of failure of this particular bridge type and associated forms. A discussion on the significance of consequence analysis in risk-based assessments follows, presenting general guidelines on how consequences of bridge failures can be categorised and quantified. 2. ANALYSIS OF BRIDGE FAILURE DATA A total of 164 cases of failure of metallic bridges were retrieved from the study in [2]. Of these 53% were highway bridges, 34% were railway bridges and a small percentage were footbridges. Of the 164 reported cases, 87 (51%) were classified as ‘collapse’, 73 (47%) as ‘no collapse’ and 4 (3%) as unknown. For the purposes of this
Transcript of Causes and Consequences of Metallic Bridge Failures …epubs.surrey.ac.uk/795965/3/Causes and...

Causes and Consequences of Metallic Bridge Failures B.M. Imam & M.K. Chryssanthopoulos
Faculty of Engineering and Physical Sciences, University of Surrey, Guildford, UK
Abstract Robustness evaluation of bridges within a risk-based framework requires estimation of the probability of occurrence of different hazards followed by an assessment of the vulnerability of the bridge with respect to those hazards, as well as quantification of the consequences of potential failure. The first part of the paper deals with a statistical analysis of past metallic bridge failures which can aid towards identifying the principal hazards affecting the bridges and their associated vulnerability. The results show that natural hazards, design errors and limited knowledge are amongst the most commonly encountered causes of collapse in metallic bridges, followed by accidents and human error aspects other than in design. When analysed chronologically, the data demonstrates a decreasing trend for collapses attributed to limited knowledge and an increasing trend in failures resulting from accidents and natural hazards. The paper continues by presenting a categorisation procedure through which consequences arising from potential bridge failures can be estimated. Associated models for quantifying their magnitude considering both spatial and temporal domains are highlighted. Finally, the predictive capability of the models is outlined through a case study. Keywords: Bridges; risk assessment; robustness; failure; causes; consequences. 1. INTRODUCTION Studying past failures can be useful in mitigating the incidence and potential of future adverse events. A first step towards understanding and quantifying the risk of bridge failures can be provided by acquiring knowledge on possible failure mechanisms of existing structures and the root causes of collapse. Trends revealed through statistical analysis can aid in identifying the potential of the most significant hazards affecting bridge structures and help in planning against their consequences. An overview of past efforts in establishing databases of bridge failures and analysing them statistically is presented in [1]. These investigations covered all types of bridges without making a distinction between different constitutive materials. The aim of the present study is to synthesise and classify structural collapses in metallic bridges in particular, starting from the early 19th century up to the present time. A database of such cases was extracted from published literature, the internet and various news reports. Statistical analysis of the database was carried out in terms of identifying the factors contributing to the collapse and the modes of failure of this particular bridge type and associated forms. A discussion on the significance of consequence analysis in risk-based assessments follows, presenting general guidelines on how consequences of bridge failures can be categorised and quantified. 2. ANALYSIS OF BRIDGE FAILURE DATA A total of 164 cases of failure of metallic bridges were retrieved from the study in [2]. Of these 53% were highway bridges, 34% were railway bridges and a small percentage were footbridges. Of the 164 reported cases, 87 (51%) were classified as ‘collapse’, 73 (47%) as ‘no collapse’ and 4 (3%) as unknown. For the purposes of this

study, ‘collapse’ is defined as one or more structural elements falling down from the bridge as a result of the failure, rendering the structure incapable of remaining in service. ‘No collapse’ covers the cases that have resulted in loss of function (such as fatigue cracking which could result in collapse if left unchecked) and have caused bridge closures, repairs or strengthening works. Considering the cases which resulted in collapse, about two thirds took place while the bridge was in service, whereas the remaining occurred during construction. It should be noted that in compiling the database, cases for which damage/collapse was attributed to earthquake action or wars have been excluded. However, other natural hazards (e.g. flooding, extreme wind) are included. This paper focuses on the failure cases where bridge collapses took place. More details regarding the ‘no collapse’ cases are provided in [1]. The causes of failure have been divided into seven categories. The first three are limited knowledge, design errors and other aspects of human error; the remaining four are natural hazards (excluding earthquakes), accidents, overloading and deterioration. Design errors include cases where there was evidence of incorrect design assumptions, wrong estimation of loads, mistakes in calculations, oversight of failure modes etc. Limited knowledge captures the cases where there was insufficient understanding of a failure mode at the relevant time, such as aerodynamic instability or a structural/material problem such as brittle fracture, fatigue or buckling. Failures due to limited knowledge usually took place with the introduction of new materials or new forms of design or due to severe extrapolation of what at the time had proved successful. Natural hazards encompass cases where failures have taken place due to extreme loading such as flooding, storms or very high winds. The remaining aspects of human errors are distinguished from design errors and cover those failures caused by negligence, ignorance, as well as poor workmanship, wrong assembly sequence, etc. Accidents pertain to vehicle and ship impacts, fire and explosions (excluding war actions, vandalism and terrorist attacks). Corrosion is the principal cause of deterioration in the case of metallic bridge failures leading to collapse. It should be mentioned here that, in many cases, failure is caused by a combination of causes. In these cases, an attempt has been made to identify as far as possible the primary cause, and to classify the case accordingly, though this cannot always be achieved without a degree of subjective judgement. Figure 1 presents the distribution of the failure causes for the collapsed bridges database. Out of the 87 cases, 36% of the collapses were observed in the USA and 20% in the UK, partly due to the large number of such bridges in these countries and a larger number of documented cases. The most recurrent causes of failure are design errors (22%), limited knowledge (22%) and natural hazards (21%) with almost equal contribution. These are followed by accidents (14%), other human errors (13%) and overloading (5%). It is evident that there is no single dominant cause of collapse for metallic bridges, though the top three account for almost two thirds of the whole. If the subset of metallic bridges is compared with the database for all bridge types [2], it appears that limited knowledge is a more frequent cause of failure for the former (22%) than the latter (10%). This may be attributed to the way in which the technology for metallic bridges often moved in spurts, typically related to progress in iron/steel manufacturing and/or assembly, with structural understanding following suite. However, it may also be related to more intrinsic factors such as the relative ratios of dead-to-live loads in different bridge types and the concomitant difference in uncertainty levels. Natural hazards and design errors are at the top of the list for both
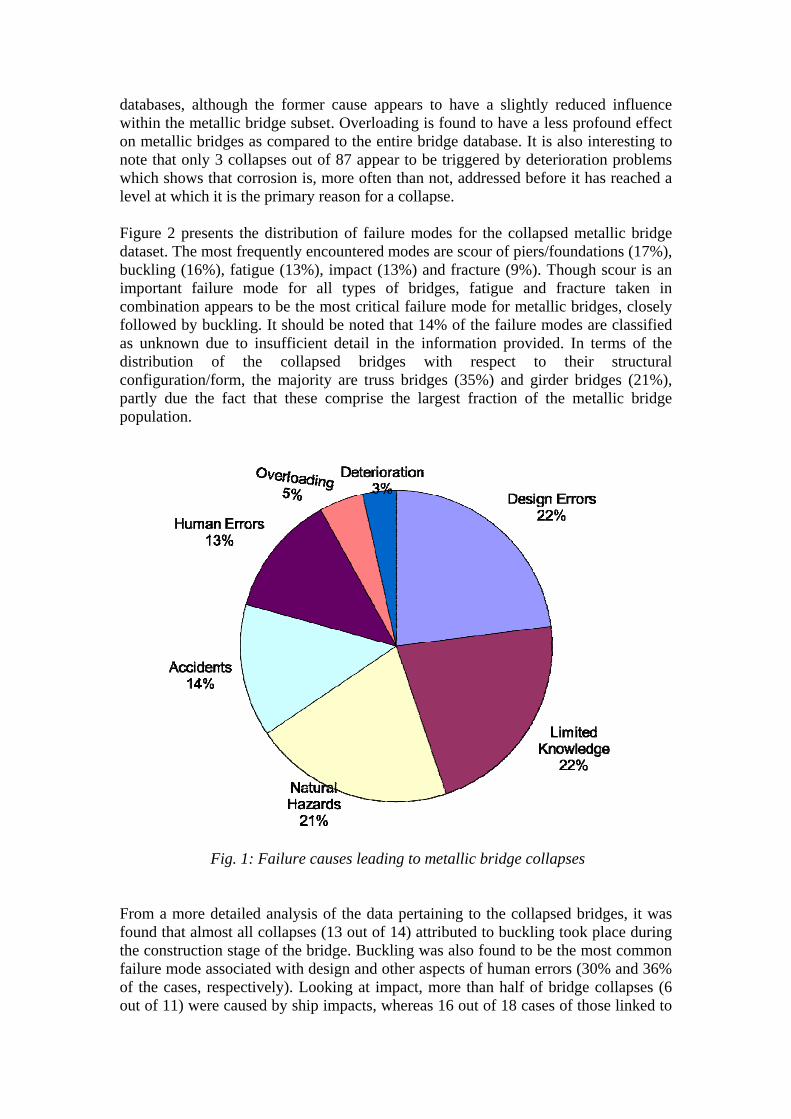
databases, although the former cause appears to have a slightly reduced influence within the metallic bridge subset. Overloading is found to have a less profound effect on metallic bridges as compared to the entire bridge database. It is also interesting to note that only 3 collapses out of 87 appear to be triggered by deterioration problems which shows that corrosion is, more often than not, addressed before it has reached a level at which it is the primary reason for a collapse. Figure 2 presents the distribution of failure modes for the collapsed metallic bridge dataset. The most frequently encountered modes are scour of piers/foundations (17%), buckling (16%), fatigue (13%), impact (13%) and fracture (9%). Though scour is an important failure mode for all types of bridges, fatigue and fracture taken in combination appears to be the most critical failure mode for metallic bridges, closely followed by buckling. It should be noted that 14% of the failure modes are classified as unknown due to insufficient detail in the information provided. In terms of the distribution of the collapsed bridges with respect to their structural configuration/form, the majority are truss bridges (35%) and girder bridges (21%), partly due the fact that these comprise the largest fraction of the metallic bridge population.
Fig. 1: Failure causes leading to metallic bridge collapses From a more detailed analysis of the data pertaining to the collapsed bridges, it was found that almost all collapses (13 out of 14) attributed to buckling took place during the construction stage of the bridge. Buckling was also found to be the most common failure mode associated with design and other aspects of human errors (30% and 36% of the cases, respectively). Looking at impact, more than half of bridge collapses (6 out of 11) were caused by ship impacts, whereas 16 out of 18 cases of those linked to

natural hazards were attributed to flooding, scour and hydraulic effects on the collapsed bridges. Clearly, there is need for more efficient design and assessment of bridges with respect to flood and scour conditions, especially during a period where changing environmental conditions have been established as a critical issue for civil infrastructure in general, and bridge structures in particular.
Fig. 2: Failure modes associated with metallic bridge collapses Figure 3 attempts to compare failure causes for different time periods. These time periods were chosen in a way to cover major advances in steel bridge construction such as the use of cast and wrought iron (pre-1900), the rapidly increasing use of steel (1900-1940) and the introduction of welding in the 1940s. It can be seen from Figure 3 that limited knowledge played a major role in the recorded collapses up to the mid-twentieth century. This coincides with periods when fatigue, fracture and buckling were still not fully understood and materials with imprecisely known behaviour were first introduced, such as cast and wrought iron and, much more recently, high strength steel. These resulted in five bridges which collapsed, in that period, due to fatigue failure, four due to buckling of compression members and four due to brittle fracture. As Figure 3 shows, collapses due to limited knowledge have considerably decreased in recent decades with the last recorded case being the catastrophic 1970 and 1971 box-girder bridge collapses in Milford Haven, UK, West Gate, Australia and Koblenz, Germany due to buckling effects. Figure 3 shows no obvious trend in terms of design and human errors, which is an interesting observation, given the emphasis on quality assurance and other human error mitigating procedures introduced in the past thirty years or so. Perhaps, issues related to increased complexity and required skills base, as well as the higher number of technical-human interfaces may counteract the benefits accrued from improvements in other areas. On the other hand, there appears to be an overall increase in the percentage of bridge collapses due to natural hazards

and accidents over the years. The latter can be attributed to the continuous increase in transportation demand, both highway and railway as well as waterway ship traffic, which has resulted in a number of vessel impacts to bridges. The increase in bridge collapses due to natural hazards may be attributed, on one hand, to the development of infrastructure in more hazardous terrain, and, on the other, to changing environmental conditions and more extreme weather circumstances observed during the last decades, though it is speculative to suggest that this is linked in some way to climate change effects. It would certainly be of interest to ascertain whether the magnitude of environmental loads at the time of collapse was within the corresponding design envelope and the prevailing design code.
Figure 3: Cause of bridge collapses by date
In Figure 4, the bridge collapses are divided between those that happened during the construction stage of the bridge and those that took place when the bridge was in service. As previously mentioned, two thirds of the collapses took place while the bridge was in service whereas the remaining one third occurred during construction. Figure 4 shows that design and human errors are more common during the construction stage but play a secondary role when compared to natural hazards and accidents for completed bridges. Similar statistics available for all types of structures [3] demonstrated that 52% of the failures occurred during construction and 48% in service. The difference can be attributed to the longer service life of bridges as compared to buildings but perhaps also to the higher skill level in construction and workmanship usually encountered in bridges.

Figure 4: Cause of bridge collapses by stage
3. CONSEQUENCES OF BRIDGE FAILURES Once the likelihood of occurrence of the hazards that may affect a bridge structure is estimated, this should be followed by the assessment of the vulnerability of the bridge against these hazards and an appropriate assessment of risk. The latter also requires estimation of the consequences of failure, which play an essential role in both qualitative and quantitative risk-based design and assessment and robustness evaluation of bridges. Consequences of failure can often be seen as a good indicator of the importance of a bridge structure, given its form, function and location within a transport network. They can range from casualties and injuries to structural damage, reduction in network functionality and may also extend into environmental as well as societal impact. Table 1 shows that, in general, consequences resulting from bridge failures may be divided into four main categories: human, economic, environmental and social. This categorisation is consistent with Eurocode provisions [4]. Each of these main four categories can be further sub-divided into a number of more specific areas, so that itemisation and appropriate modelling, where possible, may be undertaken. Consequences can be classified as either direct or indirect. Direct consequences are considered to result from damage states of individual components. Indirect consequences, triggered by the former, are associated with reduction in, or loss of, system functionality and can be linked to the level of robustness [5]. The differentiation between direct and indirect consequences depends on the system boundaries considered in the analysis as well as on the extent of the time frame that is used; they may, therefore, be subjective to a degree [6].

Consequence categories Examples Human Fatalities
Injuries Psychological damage
Economic Replacement / repair costs Loss of functionality/downtime Traffic delay / re-routing costs Traffic management costs Clean up costs Rescue costs Regional economic effects Loss of production / business Investigations / compensations Infrastructure inter-dependency costs
Environmental CO2 Emissions Energy use Pollutant releases Environmental clean-up/reversibility
Social Loss of reputation Erosion of public confidence Undue changes in professional practice
Table 1: Categorisation of bridge failure consequences 3.1. FACTORS AFFECTING CONSEQUENCES A modelling framework for bridge failure consequences should account for their type, the relevant time frame, as well as the system boundaries surrounding the structure. The time frame considered (days/weeks/years) plays an important role in consequence modelling; consequences will be different when considering only a short-term post-event time frame or a long-term period extending well after the failure event. The actual duration in considering long-term periods is also expected to affect the magnitude of estimated consequences. For example, a bridge failure may result during the immediate and mid-term aftermath, in loss of business revenue and high traffic delay costs but over longer periods these might change as new regional equilibria are reached. Lastly, consequence estimation is affected by the definition of the system boundaries; for example, the system may be defined as solely the structural system of the bridge (structural domain) or it may be extended into the transportation network that the bridge is within (spatial domain). The extent of the spatial domain is also an important factor, depending on whether a single route (with diversions) or a more widely encompassing spatial network is considered. Here, the level of redundancy of the transportation network in redistributing traffic flows following the bridge collapse plays an important role. Further layers can be added to the above systems by addressing wider societal consequences such as business losses, environmental impact, etc. The consequences of failure vary significantly from structure to structure, and may depend on a range of factors which are related to the hazard itself, the structure and its utilization, as well as the surrounding environment. First, the source and nature of the
hazard leading to the bridge collapse will affect considerably the consequences. It is expected that the greater the magnitude and duration of a hazard, the greater the consequences will be. The bridge type will also influence both its vulnerability and robustness, and, hence, the consequences, which are likely to be sensitive to factors such as the structural form, the material used, age and condition, as well as quality of construction. Bridge location is one of the major factors expected to influence the magnitude of failure consequences. The type of road or rail route served by the bridge influences the traffic intensity and, hence, the number of people exposed to any given hazard, as well as the traffic delay costs. Moreover, the availability of emergency services and accessibility to treatment for injuries will most likely be best in urban areas, hence, the number of fatalities may be lower in such locations. Finally, the cost of repair or reconstruction of the bridge structure may be higher in rural areas due to increased labour, materials and transportation costs. On the other hand, access might be easier and inter-dependency issues might be less critical than in urban areas. The time of the day that a bridge failure may take place will also have an effect on human consequences. Bridge structures will experience high levels of traffic during peak times and the potential for mass casualties is thus higher. 3.2. QUANTIFICATION OF CONSEQUENCES Quantification of bridge failure consequences is, in all but the simplest of cases, challenging and multi-faceted. The level and sophistication of the various analysis types increases considerably as the range and extent of considered consequences widens. It is often practical to express consequences in terms of monetary units, though this is rarely easy to do so. Difficulties are encountered in expressing loss of life or injuries in monetary units and in quantifying economically social and environmental impacts.
Sources for the quantification of consequences from bridge failures can be found in natural hazard loss estimation manuals (e.g. [7]), reports analysing past failures (e.g. [8]), industry and regulatory authorities guidelines (e.g. [9], [10]). An attempt to highlight different consequence models, and focus on their relevance in relation to bridge failures in the context of robustness evaluation, is made in [11]. A summary is presented in the following. A starting point in quantifying human consequences is to estimate the number of casualties and/or injuries resulting from bridge collapse. In [7], an empirical relationship for estimating the number of people on or under bridges, NBRDG, is provided as NBRDG = CDF × Commuter Population (1) where CDF is a commuter distribution factor taking into account the percentage of commuters on or under bridges. Suggested values for CDF are 0,02 during peak times and 0,01 otherwise, and the expected number of casualties due to a bridge collapse may be taken equal to 7% of the value calculated for NBRDG [7]. Alternative models have also been proposed [12] and simplistically an estimate of casualties can also be obtained by considering an appropriate ‘worst case’ scenario, such as a full traffic jam on the bridge at the time of collapse.

In addition to fatalities, a bridge failure can result in human injuries. Quantifying the consequences of injuries is an even more challenging task due to the wide range of different injuries that may result. As a result, different injury severity scales have been developed in the past such as the five-scale abbreviated injury scale (AIS) [12] and a two-scale distinction (minor/slight and major/serious) suggested by the UK transport regulatory authorities [10, 13]. A four-scale injury severity categorisation and estimated injuries falling in the different categories expected to result from a bridge collapse are given in [7]. Information on injury costs can be found in [14] and [15], whereas methods addressing the contentious issue of attributing economic values to deaths and injuries are reviewed in [11] and [16]. Economic consequence models are, on the whole, available for bridge structures, especially with respect to repair/reconstruction costs, typically linked to a damage severity index. Reconstruction time is an important parameter since the duration of the unavailability of the bridge will govern the traffic delay costs in the highway/railway network but estimates for this duration are subject to uncertainties. Typical reconstruction times and associated uncertainties for different types of bridges are given in [7]. Typical values which may be used in estimating traffic delay costs for both highway and railway networks are summarised in Table 2; such values are expected to be different from country to country, whereas further data on traffic management costs can be found in [12] and [17]. All the above costs can be used, together with site specific information regarding traffic and/or rail service levels, to produce estimates of economic losses as a result of bridge restrictions or unavailability. Wider and long-term losses require the availability of econometric models, which analyse how detours and delays might affect supply and demand for goods and services in a region, although such estimates are expected to be characterised by a high degree of variability and uncertainty. Environmental consequences range from CO2 emissions associated with clean up, reconstruction and traffic delays to the release of toxic or other pollutants that might affect water or air quality and human health. Life cycle assessment analyses can be used to estimate typical CO2 content per tonne of construction material used in repair/reconstruction, with typical values given in [11, 16]. Similarly, emissions from traffic detours and delays can be estimated as a by-product of the economic analysis of such costs. Typical values of emissions from different types of vehicles per distance travelled can be found in [18]. If deemed appropriate, the overall emission quantities can be expressed through monetary units, though, at present, the range of values quoted for the economic cost of CO2 emissions [11, 19] is impracticably wide.
Finally, it is worth noting that recent events from the UK (failure of bridges due to flooding in Cumbria in 2009) and elsewhere have focused attention on crucial inter-dependencies that exist between critical infrastructures. For example, loss of a bridge may result not only in transport being disrupted but also in other utilities (electricity, water) being adversely affected. Such losses are perhaps more difficult to quantify but should be borne in mind in evaluating the robustness of structures whose function provides a critical link within a multi-layered utility network [20, 21].

Mode Passenger Transport Freight Transport
Car Business: €32,90/person-hour
Commuting/Private: €9,40/person-hour Leisure/Holiday: €6,30/person-hour
Light Goods Vehicle: €62,6/vehicle-
hour Heavy Goods Vehicle: €67,3/vehicle-
hour
Interurban Rail
Business: €32,90/person-hour Commuting/Private: €10,00/person-hour
Leisure/Holiday: €5,00/person-hour
Full train (950 tonnes): €1135,0/tonne-
hour Wagon (40 tonnes): €47,0/tonne-hour Average per tonne: €1,20/tonne-hour
Table 2: Average European value-of-time estimates (2011 values based on [8])
3.3. CASE STUDY In this section, the applicability of the consequence models is outlined through a case study on the I-35W bridge which collapsed in 2007 and for which detailed information about the consequences of failure is available [8, 22-24]. Table 3 summarises the failure consequence figures quoted in the literature compared with estimates, predicted from the models presented in this paper. Good agreement is found for detour costs, which is due to the similarity of the methodology used. Casualty predictions are higher than the actual values, particularly if the conservative traffic jam scenario is considered. On the other hand, the number of injuries was reasonably predicted, given the uncertainty levels present. The replacement cost prediction [7] is, however, highly inaccurate and better models based on construction cost per unit area could lead to substantially better agreement. It should be noted that the applicability of the models for predicting bridge failure consequences should be verified with additional real cases in order to assess their suitability and accuracy. Clearly, any predictions should address not only mean values but also given an estimate of their spread and variability.
Consequences Observed Predicted
Casualties 13 15-45 Injuries 145 192
Replacement cost $234m $20m Cost of detours $120m [8, 22] $115m
Regional economic loss $60m [22] Traffic management costs $7m [23]
Clean up costs $8m [24] Additional vehicle emissions $25m
Table 3: Consequences for the I-35W collapse

4. CONCLUSIONS A review of failure statistics for metallic bridges was presented first, with design errors, natural hazards and limited knowledge found to be primary factors contributing to past collapses. In the last few decades failures attributed to limited knowledge have become increasingly rare, whereas incidents attributed to natural hazards and accidents show an increasing trend. Design and human errors appear to remain remarkably constant in percentage terms during the investigated 150-year period. The second part of the paper presented a categorisation of failure consequences and associated models for their quantification, applicable to bridge structures. The predictions given by the models were compared with figures quoted in the literature for the case of the collapse of a real bridge. The presented framework may be used for the purposes of risk assessment and robustness evaluation. A thorough understanding and justification of the appropriate system boundaries, in relation to spatial and temporal domains, is fundamental in quantifying consequences, and in enabling a rational distinction between direct and indirect components. Given the scarcity of information on structural failure consequences, investigating in detail selected past events should prove both instructive and valuable. Part of the challenge is to undertake such studies using a common framework so that meaningful comparisons can be undertaken, and it is hoped that this paper contributes towards this objective. Much work remains to be done in sifting through relevant sources and data, establishing commonly acceptable models and values for the various forms of consequences under consideration, and understanding the associated uncertainties and variabilities. In turn, this will help in developing necessary guidance for risk assessments of major bridges, and will inform the debate on acceptable risk criteria. ACKNOWLEDGEMENTS The work reported herein was developed in the course of the COST Action TU601: Robustness of Structures. The authors would like to thank the participants of the action, particularly those in Working Group 3, for many fruitful discussions. The financial support provided by the COST office is also gratefully acknowledged. REFERENCES [1] Imam BM, Chryssanthopoulos MK. A review of metallic bridge failure
statistics. Proceedings 5th International Conference on Bridge Maintenance, Safety and Management (IABMAS’10). Philadelphia, USA, 2010.
[2] Imhof D. Risk assessment of existing bridge structures. PhD Thesis. University of Cambridge, UK, 2004.
[3] Schneider J. Introduction to Safety and Reliability of Structures. Structural Engineering Documents. International Association for Bridge and Structural Engineering (IABSE), Zurich, 2006.
[4] European Committee for Standardisation (CEN). Eurocode 1: Actions on Structures - Part 1-7: General actions; Accidental actions. BS EN 1991-1-7:2006, 2006, Brussels.
[5] Baker JW, Schubert M, Faber MH. On the assessment of robustness. Structural Safety, 30, 2008, 253-267.
[6] Faber MH. (ed). Joint Committee on Structural Safety (JCSS). Risk Assessment in Engineering. 2008.

[7] Federal Emergency Management Agency (FEMA). HAZUS-MH MR4 Multi-Hazard Loss Estimation Methodology – Earthquake Model: Technical Manual. Department of Homeland Security, Washington D.C, 2003.
[8] Xie F, Levinson D. Evaluating the Effects of I-35W Bridge Collapse on Road-Users in the Twin Cities Metropolitan Region. 88th Transportation Research Board Conf., Washington D.C, 2009.
[9] Van Essen HP, Boon BH, den Boer LC, Faber J, van den Bossche MA, Vervoort KTH, Rochez C. Marginal costs of infrastructure use – towards a simplified approach. Final Report, CE Solutions for environment, economy and technology, Delft, The Netherlands, 2004.
[10] Rail Safety & Standards Board (RSSB). Proposals for the weighting of Major and Minor injuries. London, 2008.
[11] Imam BM, Chryssanthopoulos MK. Consequences of Failure: Bridges, Proceedings of the Final Conference, COST Action TU601: Robustness of Structures, Prague, 2011.
[12] Wong SM, Onof CJ, Hobbs RE. Models for evaluating the costs of bridge failure. Proceedings of the Institution of Civil Engineers (ICE) – Bridge Engineering, 158 (BE3), 2005, 117-128.
[13] Department for Transport. Highways Economics Note No.1: 2005 Valuation of the Benefits of Prevention of Road Accidents and Casualties. Department for Transport, London, 2007.
[14] Personal Injuries Assessment Board. Book of Quantum, Ireland, 2004. [15] Judicial Studies Board. Guidelines for the Assessment of General Damages in
Personnel Injury Cases. 10th Edition, 2010. [16] Janssens V, O’Dwyer DW, Chryssanthopoulos MK. Consequences of Failure:
Buildings. Proceedings of the Final Conference, COST Action TU601: Robustness of Structures, Prague, 2011.
[17] Highways Agency. Network Management Manual, Part 6: Network Occupancy Management. The Highways Agency, UK, 2009.
[18] Department for Environment, Food and Rural Affairs (Defra). 2010 Guidelines to Defra / DECC’s GHG Conversion Factors for Company Reporting. Department for Energy and Climate Change, 2010.
[19] Chandler RF. Life-Cycle cost model for evaluating the sustainability of bridge decks. Report No. CSS04-06. Centre for Sustainable Systems, University of Michigan, 2004.
[20] Bloomfield R, Chozos N, Nobles P. Infrastructure Interdependency Analysis: Introductory Research Review. Adelard LLP, 2009.
[21] Pederson P, Dudenhoeffer D, Hartley S, Permann M. Critical infrastructure interdependency modelling: A survey of U.S. and international research. Technical Report, Idaho National Laboratory, USA, 2006.
[22] Minnesota Department of Transportation. Economic Impacts of the I35-W Bridge Collapse. [available at http://www.dot.state.mn.us/i35wbridge/rebuild/ municipal-consent/economic-impact.pdf, accessed on June 25th, 2011]
[23] Kranig J. Mn/DOT Traffic Response to the I-35W Bridge Collapse. [available at www.pcb.its.dot.gov/t3/s090603/s090603_tsagi35_kranig_present.ppt, accessed on August 10th, 2011]
[24] I-35W Bridge Collapse – Environmental, [available at http://35wbridge. pbworks.com/w/page/900694/Environmental, accessed on August 15th, 2011]