
Causes and Consequences of Corporate Assets Exchange … · Causes and Consequences of Corporate...
38
Causes and Consequences of Corporate Assets Exchange by China’s Listed Companies Jiwei Wang* Singapore Management University [email protected] Hongqi Yuan Fudan University [email protected] Preliminary draft, please do not quote without the authors’ permission. Comments are welcome. We gratefully appreciate the insightful comments and suggestions from xxx and seminar participants at the 18th Annual Conference on PBFEAM at Beijing. Wang acknowledges the research grant (08-C206-SMU-010) from the Office of Research, Singapore Management University and the Seedcorn Research Grant from the Institute of Certified Public Accountants of Singapore (ICPAS). Yuan acknowledges the support of the National Natural Science Foundation of China (NSFC). * Contact author’s address: School of Accountancy, Singapore Management University, Republic of Singapore 178900. Tel: +65-68280616. E-mail: [email protected]
Transcript of Causes and Consequences of Corporate Assets Exchange … · Causes and Consequences of Corporate...

Causes and Consequences of Corporate Assets Exchange by
China’s Listed Companies
Jiwei Wang*
Singapore Management University
Hongqi Yuan
Fudan University
Preliminary draft, please do not quote without the authors’ permission.
Comments are welcome.
We gratefully appreciate the insightful comments and suggestions from xxx and
seminar participants at the 18th Annual Conference on PBFEAM at Beijing. Wang
acknowledges the research grant (08-C206-SMU-010) from the Office of Research,
Singapore Management University and the Seedcorn Research Grant from the
Institute of Certified Public Accountants of Singapore (ICPAS). Yuan acknowledges
the support of the National Natural Science Foundation of China (NSFC).
* Contact author’s address: School of Accountancy, Singapore Management
University, Republic of Singapore 178900. Tel: +65-68280616. E-mail:

Causes and Consequences of Corporate Assets Exchange by
China’s Listed Companies
ABSTRACT
China’s listed companies often exchange corporate assets with their unlisted affiliates
such as parent companies, which is rarely observed in their American counterparts.
We find that listed companies which are incompletely restructured from former state-
owned enterprises tend to exchange more profitable assets for less profitable assets
(i.e., tunneling). However, when there is a need to avoid reporting losses and to raise
additional capital, listed companies tend to exchange less profitable assets for more
profitable assets (i.e., propping). We also find that the market reacts indifferently to
assets exchange announcement. Finally, we find that assets exchange with tunneling
(propping) incentive is associated with detrimental (improved) post-exchange stock
performance and financial performance. In summary, this study contributes to the
corporate assets literature by providing two new incentives (tunneling and propping).
JEL classification: G14, G15, G34
Keywords: Assets exchange, Tunneling, Propping, China

1
Causes and Consequences of Corporate Assets Exchange by
China’s Listed Companies
The existing literature on corporate assets focuses on transactions with
payment methods of cash, equity, and/or future considerations (Slovin, Sushka, and
Polonchek (2005)), rather than barter-type assets exchange.1 In China, however, many
listed companies barter exchange corporate assets with their related parties such as
parent companies and brother companies under common control. This paper aims to
address why listed companies in China exchange corporate assets and what the
consequences are.
We identify two possible nonexclusive incentives to the assets exchange. One
is that related parties would like to reclaim more profitable assets and inject less
profitable assets which results in expropriation of minority shareholders of listed
companies. We label it as tunneling incentive in the spirit of Johnson et al. (2000).
One is that related parties may exchange more profitable assets for less profitable
assets to help listed companies to boost operating performance. We label it as
propping incentive in the spirit of Friedman et al. (2003). We argue that both the
tunneling and the propping incentives exist in the unique Chinese institutional setting.
Most of China’s listed companies are restructured from State-Owned
Enterprises (SOE). There are three typical restructuring processes to form a listed
company in China. First, an existing State-Owned Enterprise (SOE) may peel off part
of its operating assets to form a listed company and remains as the parent of the listed
company. Second, an SOE may also be fully integrated to a listed company and a
government agency or equivalent act as the parent of the listed company. The last
type is that some SOEs are bundled to form a listed company and a government
1 Although we could not obtain any statistics about barter-type assets exchange in the U.S., we
conjecture that this type of assets transaction is quite rare in the U.S.

2
agency or equivalent act as the parent of the listed company. We classify the first type
as an incomplete restructuring because only partial of an existing SOE is transformed
to a listed company. The other two types are treated as a complete restructuring
because the whole existing SOE has been integrated into a listed company. In the
incomplete restructuring process, in order to help the to-be-listed firm to go public,
unlisted parent company tends to carve out more profitable assets to boost pre-IPO
performance (Aharony et al. (2010)). Remaining less profitable assets and other non-
operating assets such as schools and hospitals become its financial burden and hence
it has strong incentive to exchange less profitable assets for more profitable assets
from listed company in the post-IPO period. Following Johnson et al.’s (2000)
description of tunneling as “the transfer of assets and profits out of firms for the
benefit of those who control them,” in this paper we label parent companies’ incentive
to exchange less profitable assets for more profitable assets from listed company as
“tunneling incentive”. Thus we expect that listed firms restructured from an
incomplete process would exchange more profitable assets for less profitable assets
from their related parties.
Unlike in a more developed market, Chinese securities regulators have set two
bright-line earnings targets that regulate firm listings. In particular, a firm must report
at least 0% return on equity (ROE) to maintain its listing status and 10% (6% after
2001) ROE to issue new shares. Although these bright-line rules bring benefits such
as reducing adverse selection problems (Chen and Wang (2007)), the ROE targets
create opportunistic earnings manipulation by listed firms’ managers (Chen and Yuan
(2004)) and give incentives for parent companies to assist listed firms in boosting
ROEs. We thus expect that listed companies that need to avoid reporting losses and
raise additional capital through equity offerings would exchange less profitable assets

3
for more profitable assets with their related parties. Following Friedman et al.’s
(2003) description of propping as “transferring private resources into firms that have
minority shareholders,” in this paper we label parent companies’ incentive to
exchange more profitable assets for less profitable assets from listed company as
“propping incentive”. Thus we expect that listed firms with intention to avoid
reporting losses and raise additional capital would exchange less profitable assets for
more profitable assets from their related parties.
Due to limited information about exchanged assets, we could not measure
assets’ profitability and quality directly. In an arm’s length exchange, the valuation of
exchanged assets should be equivalent. If a manager wants to exchange less profitable
assets for more profitable assets without extra compensation, he would
opportunistically manipulate revaluation of the less profitable assets to match with the
revaluation of the more profitable assets. Thus we shall be able to infer assets quality
difference from comparison of abnormal revaluation rate of the exchanged assets.
When the abnormal revaluation of assets surrendered by listed companies is higher
than that of assets acquired by listed companies, we infer that quality of assets
surrendered is lower than that of assets acquired and vice versa.
We identify a sample of 305 assets exchanges by 229 China’s listed
companies on the Shanghai Stock Exchange and the Shenzhen Stock Exchange from
2000 to 2006. We present a model for determination of assets revaluation and
abnormal assets revaluation rate is measured by the residual of the model (we will
discuss the model in Section IV). The difference between abnormal surrendered assets
revaluation rate and abnormal acquired assets revaluation rate is then used as a proxy
for the quality of exchanged assets. If the abnormal surrendered assets revaluation is
higher than that of acquired assets, we interpret it as that the quality of surrendered

4
assets is lower than that of acquired assets. Thus, a higher difference in abnormal
assets revaluation rate indicates that it is more probable that the firm exchanges less
profitable assets for more profitable assets and vice versa (i.e., the propping
incentive). A lower difference in abnormal assets revaluation rate then indicates the
tunneling incentive.
We then provide empirical evidence that firms with incomplete restructuring
during their IPO process is associated with lower abnormal assets revaluation
difference. The evidence indicates firms with incomplete restructuring exchange more
profitable assets for less profitable assets, which is consistent with the tunneling
incentive. On the other hand, we find that firms which have intention to avoid
reporting losses and raise additional capital through equity offerings is associated with
higher abnormal assets revaluation difference. It indicates these firms are more likely
to exchange less profitable assets with more profitable assets, which is consistent with
the propping incentive. The evidence is valid even after we control for the incomplete
restructuring and other firm-level factors such as return on assets (ROA), firm size,
past stock return, market-to-book ratio of equity, cash, leverage and growth rates in
sales and gross property, plant and equipment. The tunneling and propping behavior
suppose to have different effects on investors and we expect investors should be able
to see through such behavior through different reactions to assets exchange
announcements. However, we find that the market reacts to assets exchange
announcements indifferently. It may cast doubt on the Chinese capital markets’
reputation for semi-strong efficiency.
We also examine the consequences of barter-type assets exchange. With the
tunneling incentive, managers in listed companies exchange higher quality assets for
lower quality assets. Hence we expect a long-term underperformance of both financial

5
and stock performance in listed companies. In contrast, with the propping incentive,
managers exchange lower quality assets for higher quality assets. Hence we expect a
long-term performance improvement of both financial and stock performance. We use
both stock performance (12-month and 24-month post-exchange buy-and-hold-
abnormal-return (BHAR)) and financial performance (1-year and 2-year average post-
exchange ROA) to test the consequences on post-exchange performance. As
predicted, we find a positive association between both firm performance measures and
the difference in abnormal assets revaluation, indicating that assets exchanges with
propping incentives results in improved post-exchange firm performance and vice
versa. We also control for other factors, such as current ROA, firm size and leverage,
which may affect firm performance.
This paper contributes to the corporate assets literature in a number of ways.
First, this paper identifies a sample of firms which engage in barter-type assets
exchange. Existing literature focuses on assets sales and purchases in monetary terms
only (e.g., Maksimovic and Phillips (2001) and Warusawitharana (2008)). Second, to
the best of our knowledge, we present new incentives for assets sales and purchases
(the tunneling incentive and the propping incentive) which are never examined in the
corporate assets literature. Existing literature examines corporate assets transaction
from either investment efficiency incentive (such as John and Ofek (1995),
Maksimovic and Phillips (2001) and Warusawitharana (2008)) or financing incentive
(such as Lang, Poulsen, and Stulz (1995), Brown, James, and Mooradian (1994) and
Asquith, Gertner and Scharfstein (1994)). Finally, we use assets revaluation
information to infer the quality of surrendered and acquired assets, which is not
examined in the literature.

6
This study also extends the research in expropriation and propping of minority
shareholders by controlling shareholders. Johnson et al. (2000) conjecture that
controlling shareholders would, legally or illegally, have incentive to expropriate (or
“tunnel”) minority investors when there is a weak legal environment and weak
corporate governance system. Friedman et al. (2003) extend Johnson et al.’s findings
to show that managers (or controlling shareholders) may also have incentives to
transfer their private resources to benefit minority shareholders. We present the assets
exchange as a direct evidence of tunneling and propping which has not been
examined in the existing literature.
This study also contributes to the asset revaluation literature in accounting.
Jarrell (1979) finds that utility companies overvalue their assets in order to increase
the price of products. Our study complements the existing literature by showing that
manipulation of assets revaluation can be used to achieve different goals such as
propping or tunneling in our context.
The remainder of this paper is organized as follows. Section I provides a
literature review on assets sales and purchases. Section II outlines the China’s unique
institutional background and develops the hypotheses. In Section III we present the
sample and empirical results. Finally, conclusions are presented in Section IV.
I. Literature Review on Assets Exchange
The existing literature on corporate assets focuses on transactions with
payment methods of cash, equity, and/or future considerations (Slovin, Sushka, and
Polonchek (2005)), rather than barter-type assets exchange. The overall market for
corporate assets includes mergers, acquisitions and partial assets sales. Assets
exchange is relating to the literature on partial assets sales. Alexander, Benson, and

7
Kampmeyer (1984) and Jain (1985) are among the first to show valuation
consequences of assets sell-off. Using a sample of over 1,000 voluntary sell-off
announcements, Jain (1985) shows that there is a positive effect on the shareholders
of both the sellers and the buyers.2 Subsequent studies offer various theories to
explain the motives and valuation consequences of partial assets sales by a
corporation.
The efficiency hypothesis is the dominant theory but with various views of
efficiency. It generally argues that managers efficiently reallocate resources through
asset sales and purchases. Managers may sell assets if they discover that another party
can manage the assets more efficiently. Hite, Owers, and Rogers (1987) investigate
valuation consequences of voluntary proposals to sell part of a corporation’s assets.
They find that both successful and unsuccessful sellers reap statistically significant
abnormal returns from initial proposal announcements but unsuccessful sellers lose
the initial gain at the offer termination. They interpret these findings as evidence that
assets sales are associated with the movement of resources to higher-valued uses. The
rational is that asset sales are in the best interest of stockholders if and only if the net
sale proceeds exceed the present value of the net future cash flows from continued
ownership and operation. Thus potential productive gains can be realized only by the
transfer of the target assets from their current use to the buyer’s control.
John and Ofek (1995) offer an alternative view of the efficiency. They argue
that the motive to sell an asset is that the divested asset interferes with the seller’s
other operations. Hence selling the unrelated asset leads to an increase in focus and
more efficient operation of the core business. Using several accounting performance
2 Alexander, Benson, and Kampmeyer (1984) find the similar results but with a much smaller sample
(53 announcements).

8
measures, such as operating margin and return on assets, they find that the firm’s
remaining assets are more profitable after the sell-off.
Maksimovic and Phillips (2001, 2002) provide both theoretical model and
empirical results to support the efficiency view. Their intuition is that some firms are
more productive and can produce more than other firms from a given number of
plants. They argue that firms adjust in size until the marginal benefit is equal to the
marginal cost of production. As output prices increase, the more productive firms
have a larger gain in value from the assets they control. As a result, they find it
optimal to acquire plants from less productive firms in the industry. By the same
token, a positive shock in an industry increases the opportunity cost of operating as an
inefficient producer in that industry. Thus, industry shocks alter the value of the assets
and create incentives from transfers to more productive uses. Their empirical results
show that asses are more likely to be sold (1) when the economy is undergoing
positive demand shocks, (2) when the assets are less productive than their industry
benchmarks, (3) when the selling division is less productive, and (4) when the selling
firm has more productive divisions in other industries.
The most recent study by Warusawitharana (2008) develops a model to link
asset purchases and sales to fundamental properties of a value-maximizing firm. The
key economic idea of the model is that firms engage in asset purchases and sales to
move the firm toward its optimal size, which varies with profitability. Their empirical
results show that return on assets strongly predict when firms purchase or sell assets.
In response to improved profitability, firms have the option of growing externally
through asset purchases. Firms with low profitability can improve their average
productivity of capital via asset sales. In summary, the above studies characterize
assets sales and purchases as a process to efficiently reallocate corporate resources.
9
The existing literature also suggests alternative explanations of asset sales.
The financing hypothesis of asset sales argues that management values firm size and
control and hence it is reluctant to sell assets from efficiency reasons alone. For such
management, a more compelling motivation to sell assets is that asset sales provide
funds when alternative sources of financing are too expensive. This hypothesis also
argues that the completion of an asset sale is good news about the value of the asset
because if the value of the asset had turned out to be low, the sale would not have
taken place. Lang, Poulsen, and Stulz (1995) provide empirical results to support the
financing hypothesis. They find that firms selling assets, even excluding bankruptcy
firms and firms in default, tend to be poor performers and/or have high leverage. This
result suggests that the typical firm selling assets is motivated to do so by its financial
situation rather than efficiently reallocating corporate resources. They also report that
the stock-price reaction to asset sales is significantly positive for those firms expected
to use the proceeds to pay down debt, but negative and insignificant for firms which
are expected to keep the proceeds within the firm, which is also inconsistent with the
efficiency hypothesis. Asset sales may also be an important way of resolving financial
distress. Asquith, Gertner and Scharfstein (1994) find that asset sales are a way of
avoiding Chapter 11 but they are limited by industry factors: firms in distressed and
highly leveraged industries are less prone to sell assets. Brown, James, and Mooradian
(1994) find significantly lower returns to shareholders when asset sales proceeds are
used to repay debt than when sales proceeds are retained by the firm.
II. Institutional Background and Hypotheses
Due to the unique institutional background of Chinese firms, the motives of
assets exchange in China are different from the motives discussed above.

10
A. The Restructuring Process of China’s Listed Companies
In the process of transition from a central-planned economy to a market
economy, Chinese government adopts a gradual approach by introducing private
ownership to wholly state-owned enterprises (SOEs) without selling any state-owned
assets. Exiting SOEs are first restructured to a corporation and then go public to raise
private capital. There are three types of restructuring: peel-off, integration, and
buddle.
An existing SOE may peel off part of its operating assets to form a new
independent corporation, which can be termed as an incomplete restructuring. The
existing SOE becomes parent of the new independent corporation by retaining the
ownership of all peeled-off assets. The peel off restructuring is different from the
typical carve-out or spin-off. It is different from a typical carve-out because the parent
company does not sell any existing assets to other investors and hence there is no cash
flow effect on the parent. It is also different from a typical spin-off because the newly
independent corporation will have new investors through subscribing new shares in
the IPO process. As Aharony, Lee and Wong (2000) point out, to make the new
corporate more marketable to attract public investors, parent companies have strong
incentive to peel off only their profitable business units for public offering and keep
the nonproductive and unprofitable units in the parent company. Another important
incentive is due to a strict quota system of IPO set by the Chinese government
(Aharony, Wang and Yuan (2010)). Prior to 1999, the total annual number of IPOs
was subject to a quota system, meaning that the central government set a quota for the
entire capital value of shares to be issued every year. This total amount would then be
allocated among local governments which in turn were directed to identify key

11
industries and nominate worthy companies for listing on the local stock exchanges.
Thus parent companies also have the incentive to make the to-be-listed company
stronger by peeling off more profitable assets. Although the quota system has been
eliminated since 1999, the first incentive mentioned in Aharony et al. (2000) still
exists.
The incomplete peel-off restructuring leaves most of the financial and social
burden to the remaining parent company. The parent company may reduce the burden
by improving operating efficiency of remaining assets. Or it may have incentive to
reclaim the better assets injected to their listed subsidiary during the restructuring
process. One feasible way is to exchange unprofitable assets with listed company for
more profitable assets.3 To summarize, the incomplete peel-off restructuring suggests
test of the following predictions.
HYPOTHESIS 1: Listed companies from incomplete restructuring are more likely to
exchange more profitable assets for less profitable assets (i.e., the tunneling
hypothesis).
B. Bright-line Regulations on Firm Listings
We consider two situations in which the parent companies have incentive to
prop up their listed affiliates by injecting more profitable assets to replace less
profitable assets. The more profitable assets may come from parent companies or
other companies. Although Chen and Yuan (2004) show that regulation based on
accounting numbers such as return on equity triggers opportunistic earnings
3 Aharony et al. (2010) also find that Chinese parent companies expropriate their listed affiliates
through non-repayment of corporate loans.
12
management, the China Securities Regulatory Commission (CSRC) stands out to use
bright-line regulations to monitor firm listings.4
The first situation is to avoid reporting losses by China’s listed companies.
According to the guidelines introduced by the CSRC in 1998, a listed firm will be
designated as a special treatment (ST) firm if it reports a net loss for two consecutive
years. An ST firm’s semi-annual report is required to be audited. If it reports a net loss
for three consecutive years, the firm is suspected for normal trading and investors can
only trade under a particular transfer (PT) arrangement. Further, if a PT firm cannot
become profitable in one year, it will be completely delisted. Although avoiding
reporting losses has been regarded as one important incentive to manage earnings in
the literature (Degeorge, Patel and Zeckhauser (1999)), the institutional setting in
China gives managers stronger incentive to do so to avoid government scrutiny and
delisting.
The other situation in which the parent company has strong incentive to
engage in assets exchange to prop up its listed affiliate is during rights offerings (RO)
and seasoned equity offerings (SEO). In the 1990s, listed companies were able to
issue additional shares only through preemptive rights offered to their existing
shareholders. Due to the lack of other means for listed companies to raise capital and
the insatiable demand for stocks from the investing public in China in the early 1990s,
ROs were excessively abused by listed companies (Chen and Yuan (2004)). To curb
this excessive activity, the CSRC uses a minimum ROE of 10% (6% after 2001) to
curb the activity.5 Since 2002, a similar threshold (10% of ROE) is set to regulate
SEO. Since RO and SEO are the primary channels for Chinese listed companies to
raise capital, qualification for RO and SEO is an important objective for parent
4 Chen and Wang (2007) show that, in China, bright-line rules may serve to reduce adverse selection
problems. 5 Table 1 in Chen and Wang (2007) summaries the regulations on RO and SEO in China.

13
companies. Li and Zhou (2005) also argue that listed companies are better able to help
relieve unemployment problems and enhance the infrastructure development of the
ministries where the firms belong or of the regions where the firms operate. Thus,
both the central and local governments who act as the ultimate controlling owners
have strong incentives to help listed firms maintain listing status and qualify for
raising more funds. Thus we predict that parent company has strong incentive to
replace listed companies’ less profitable assets with more profitable assets in the
above two situations. We summarize these predictions in the following hypothesis.
HYPOTHESIS 2: Listed companies with intention to avoid reporting losses and raise
additional capital are more likely to exchange less profitable assets for more
profitable assets (i.e., the propping hypothesis).
If the market is efficient, investors should be able to see through the tunneling
and propping behavior in assets exchange. Cheung, Rau and Stouraitis (2006) find
that listed firms in Hong Kong announcing assets sale which a priori might be most
likely to result in expropriation of minority shareholders earn significantly negative
abnormal returns during the days following the announcement. Hence we expect
investors in Shanghai and Shenzhen react negatively to assets exchange with
tunneling incentive but positively to assets exchange with propping incentive if the
Chinese market is as efficient as Hong Kong’s. We summarize the predictions in the
following hypothesis.

14
HYPOTHESIS 3: Investors react negatively to assets exchanges with tunneling
incentive but positively to assets exchanges with propping incentive surrounding
assets exchange announcement date.
Given the different quality of exchanged assets, we predict different post-
exchange firm performance. The prediction is summarized in the following
hypothesis.
HYPOTHESIS 4: Listed companies which exchange more (less) profitable assets for
less (more) profitable assets experience performance decline (improvement) in the
post-exchange period.
III. Assets Exchange Data Description
We hand-collected all 305 public announcements of assets exchange with
parent companies and other parties by 229 listed companies in Shanghai and
Shenzhen Stock Exchanges during the period 2000-2006. The sample period starts
from 2000 because there were very few assets exchanges (only five in total) in the
prior period. We also hand-collected IPO restructuring data from company’s IPO
prospectus. Other data such as stock returns and financial performance are obtained
from China Stock Market & Accounting Research (CSMAR) database.6
Table 1 presents the sample composition for each year from 2000 to 2006,
classified by ten major industries categories (two-digit SIC code). The original
industry classification is first obtained from the CSRC. We then reclassified the
industries into ten categories based on Campbell (1996). As there are only three firms
6 The CSMAR is a leading data vendor which provides both financial accounting data and stock prices for all listed
companies in China. It also provides other databases such as corporate governance and merger & acquisition
databases. The CSMAR database may be obtained from the Wharton Research Data Services (WRDS).

15
in the Petroleum industries (SIC code 13, 29), we combine them with the Basic
industries. The Financial Services industries (SIC code 60-69) are included in the
Services category. As Table 1 shows, four industry groups, the Basic industries
including Petroleum, the Consumer Durables industries, the Capital Goods industries,
and the Conglomerate have a higher proportion of assets exchanges during the sample
period (from 38 cases or 12.5% to 54 cases or17.7%) than the remaining industry
categories (from 14 cases or 4.6% to 25 cases or 8.2%). The table also shows that
there are generally fewer assets exchanges in the early period than that in the later
period (the least number of cases is 10 in 2000 and the most number of cases is 79 in
2003).
(Insert Table 1 here)
We present the types of exchange parties and the type of assets exchanged in
Table 2. Exchange parties are generally classified as related parties and non-related
parties. The classification is disclosed by listed companies in their assets exchange
announcements and the definition of related parties should follow the Chinese
Accounting Standard 36 (CAS 36 issued in 2006) which is the same as the
International Accounting Standard 24 (IAS 24 revised in 2011). Related parties
consist of parent companies (i.e., the largest corporate shareholders) of listed
companies, other large corporate shareholders, brother companies which are under the
common control with listed companies, and others.7 As shown in Panel A of Table 2,
the majority of assets exchanges are between listed companies and their parent
companies (219 cases or 71.8% of the sample). There are also 49 cases (16.1%) with
7 The “others” category is disclosed as “other related parties” by listed company and we do not know
their specific relationship with the listed company.

16
non-related parties. Non-related parties may be de facto related with listed companies
because they are under the common control of government which are not treated as
related parties by the CAS 36 and the IAS 24. Since all the non-related parties are
non-listed companies and we cannot identify whether or not they are de facto related
to listed companies.8 As shown in Panel B of Table 2, there are five types of assets
exchanged: Assets group, Equity shares, Receivables, PPE, Land and Other tangible
assets, and Intangibles. Assets group includes a group of assets and liabilities such as
a production line and an operating unit. Equity shares refers to company’s equity
ownership in a separate entity. Receivables means the exchanged asset mainly
consists of receivables. PPE, Land and Other tangible assets include Property, Plant,
and Equipment, or Land, or Other intangible assets such as inventories, or a
combination of these tangible assets. Intangibles means the exchanged asset mainly
consists of intangible assets. Panel B shows that, for assets surrendered, Equity shares
and Receivables are the most popular types of assets (113 or 37.0% of Equity shares
and 110 or 36.1% of Receivables). In contrast, more than half of all the acquired
assets are Equity shares (176 or 57.7%) and about one quarter are PPE, Land and
Other tangible assets (73 or 23.9%).
(Insert Table 2 here)
Table 3 reports end of fiscal year summary statistics for firms that exchange
assets during the next year (thus the period for reported statistics is 1999-2005, i.e.,
one year ahead of the sample period). For comparison, we also present the statistics
for all listed firms during the same period with sufficient data. As Table 3 shows, the
8 Our research results remain qualitatively the same when we exclude the 49 assets exchanges with
non-related parties.

17
sample firms tend to have a lower return on assets (ROA). For example, the means of
ROA for sample firms and all firms are 0.8% and 3.4%, respectively. The t-statistic
for test of mean difference is 5.80 with a statistical significance level of 1%. We
observe the same pattern for other profitability and performance measures such as
stock return (SRET), cash holdings (CASH), and sales growth (SALESG). This
suggests that managers of firms with low return on assets, low stock returns, low cash
holdings and low sales growth are more likely to conduct assets exchange with parent
companies, which is consistent with Warusawitharana’s (2008) observation on
corporate assets sales in the U.S. The table also shows that other statistics of our
sample firms, such as firm size (SIZE), market-to-book ratio (MTB), LEVERAGE,
and PPE growth (PPEG), are similar to that of average listed firms. The deal value
reported at the third to last row reveals the average and median values of assets
exchanged are about 270 million RMB and 98 million RMB, respectively.
(Insert Table 3 here)
IV. Empirical Results
The empirical implementation tests four hypotheses derived in Section II. We
provide research design to test these hypotheses and discuss empirical results in this
section.
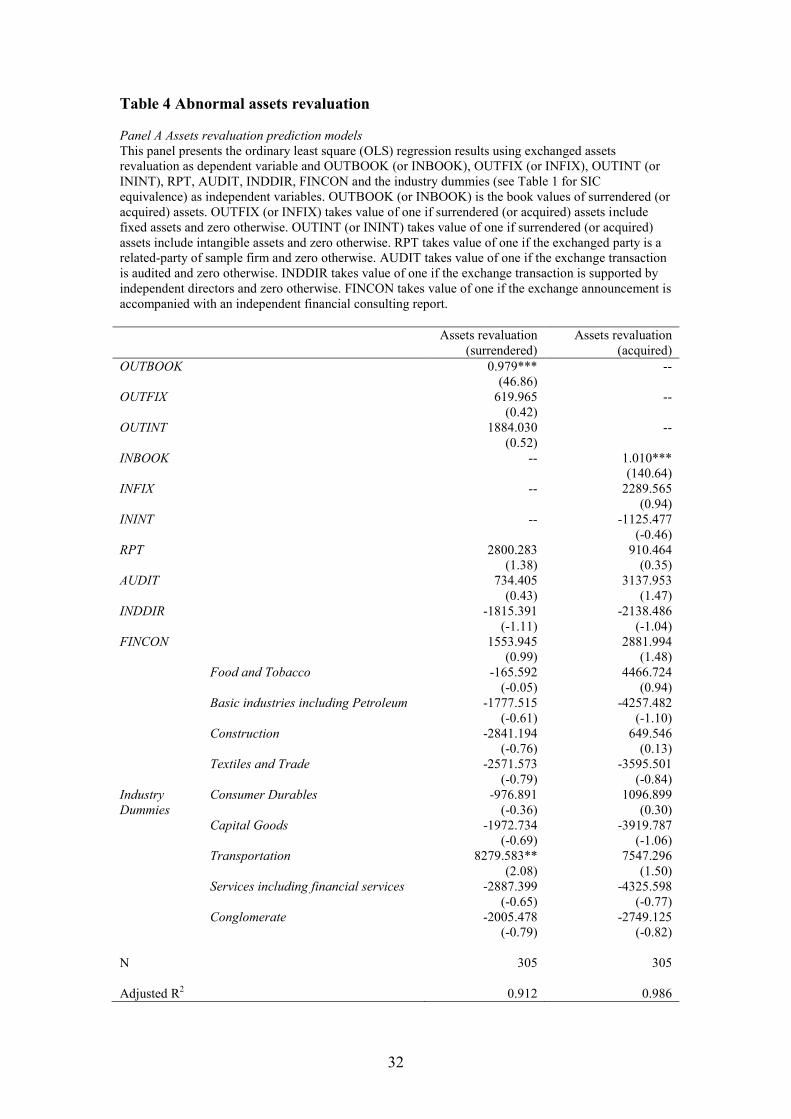
A. Abnormal Assets Revaluation
During assets exchange process, firms need to hire professional valuers to
revalue surrendered and acquired assets. In an arm’s length transaction, the valuation
of surrendered and acquired assets should be equivalent. However, in China,

18
professional valuers are not properly regulated and they are typically not independent.
If a manager wants to exchange less profitable assets for more profitable assets, he
would collude with professional valuers to opportunistically manipulate revaluation of
the less profitable assets to match with the revaluation of the more profitable assets.
Based on information disclosed in assets exchange announcements, we employ the
following model to determine normal revaluation rate of assets and the abnormal
revaluation rate is the residual of the model.
OUTREV (or INREV) = a1OUTBOOK (or INBOOK) + a2OUTFIX (or INFIX) +
a3OUTINT (or ININT) + a4RPT + a5AUDIT + a6INDDIR + a7FINCON + Industry
Dummies + e
(1)
We run ordinary least square (OLS) regression based on the above model (without
intercept) for assets surrendered and assets acquired separately. OUTREV (INREV) is
the revaluation of surrendered (acquired) assets disclosed in assets exchange
announcements by listed companies. Book value is an important determinant of
revaluation of the asset, hence we include OUTBOOK (INBOOK) which is the book
value of surrendered (acquired) assets in the model. OUTFIX (INFIX) takes value of
one if surrendered (acquired) assets include fixed assets and zero otherwise. Fixed
assets are carried at historical cost under the current Chinese Accounting Standards
and hence fixed assets are subject to more revaluation. OUTINT (ININT) takes value
of one if surrendered (acquired) assets include intangible assets and zero otherwise.
We include this variable is because intangible assets are more difficult to revalue.
RPT takes value of one if the exchange party is a related party of sample firm and

19
zero otherwise. We believe it is easier for managers to collude with related party to
manipulate asset revaluation. AUDIT takes value of one if the exchange transaction is
audited and zero otherwise. INDDIR takes value of one if the exchange transaction is
supported by independent directors and zero otherwise. FINCON takes value of one if
the exchange announcement is accompanied with an independent financial consulting
report. The above three variables are introduced to control for monitoring effects on
assets revaluation by auditors, independent directors and professional consultants.
Finally, we introduce nine industry dummies in the model.
(Insert Table 4 here)
Panel A of Table 4 reports the OLS regression results. As expected, the book
value of assets (OUTBOOK and INBOOK) are significantly positively associated
with revaluation of both surrendered and acquired assets. Other independent variables
generally have no significantly impacts on assets revaluation. The adjusted R-squares
for both regressions are above 90%, indicating a very high prediction power of the
model. The abnormal assets revaluation rate is the residual obtained from the
regressions in Panel A, scaled by the book value of exchanged assets. We then take
the difference between abnormal surrendered assets revaluation rate and abnormal
acquired assets revaluation rate to infer the quality of exchanged assets. As we
mentioned before, a higher abnormal revaluation difference indicates the surrendered
asset is less profitable than the acquired assets which indicates possible propping up
by exchange parties. Panel B of Table 4 shows the descriptive statistics of abnormal
revaluation rate. We find that the abnormal revaluation rate of surrendered assets is
significantly higher than that of acquired assets. The mean and median abnormal

20
revaluation rate differences are 13.5% and 10.8%, respectively. Both are significantly
different at the 1% level. We present further empirical tests to explain this asymmetry
of revaluation rate.
B. Tunneling and propping incentive of assets exchange
Hypothesis 1 and Hypothesis 2 state that firms with tunneling and propping
incentives would behave differently when exchange assets. We employ the following
model to investigate these two incentives.
ABREVDIF = b0 + b1INCREST + b2INTENTION + b3INCREST*INTENTION +
b4ROA + b5SIZE + b6SRET + b7MTB + b8CASH + b9LEVERAGE + b10SALESG +
b11PPEG + Industry Dummies + Year Dummies + e
(2)
The dependent variable ABREVDIF is the abnormal revaluation difference of
surrendered and acquired assets obtained from regressions in model (1) reported in
Table 4. The independent variables include the following variables.
(1) INCREST: Incomplete restructuring takes value of one if the listed firm is
peeled-off from an existing SOE during its IPO process and zero otherwise. It
serves as an indication of tunneling incentives by related parities.
(2) INTENTION: It takes value of one if the listed firm has at least one of the
following characteristics and zero otherwise: (i) previous net loss; (ii) current
net loss; (iii) current ROE is lower than 1.5%; (iv) raising additional capital in
the current year; (v) intention to raise additional capital in the coming two
years. It is an indication of propping incentives by related parties.

21
(3) ROA, SIZE, SRET, MTB, CASH, LEVERAGE, SALESG, PPEG: same as
the definitions in Table 3.
(4) Nine Industry Dummies and six Year Dummies.
(Insert Table 5 here)
Table 5 presents the OLS regression results of the above model. Regression 1
includes only the tunneling incentive indicator (INCREST). The estimated coefficient
on INCREST is -0.385 which is statically significant at the 5% level. As we discussed
in hypothesis development, a lower revaluation difference infers the quality of
surrendered assets is higher than that of acquired assets. Thus, the result shows that
firms from incomplete restructuring tend to exchange more profitable assets for less
profitable assets (i.e., lower revaluation difference), which is consistent with the
tunneling hypothesis (Hypothesis 1). Regression 2 includes only the propping
indicator (INTENTION). The estimated coefficient is 0.581 and significant at the
level of 5%. Thus, the result indicate that firms with intention to avoid losses or raise
additional capital tend to exchange less profitable assets for more profitable assets,
which is consistent with the propping hypothesis (Hypothesis 2). Regression 3
includes both INCREST and INTENTION and also their interaction terms
(INCREST*INTENTION). We find that the estimated coefficient of INCREST is not
significant but the estimated coefficient of INTENTION remains significantly
positive (0.563 at the significance level of 5%). The result indicates that parent
companies are willing to prop up their listed affiliates even when they have incentives
to expropriate their listed affiliates. Hence we conclude that propping incentive
dominants tunneling incentive when both are present. As we discussion in Section II,

22
the result is reasonable because both the central and local governments have strong
incentive to help listed companies to maintain listing status even though parent
companies may have tunneling incentive.
Among the control variables, only ROA and CASH have significant impacts
on revaluation difference. In all three regressions, the estimated coefficients of ROA
are negative and significant at the 5% level. It means a high profitable firm tends to
exchange profitable assets for less profitable assets, which is consistent with the
tunneling behavior. When listed companies are more profitable, parent companies
have more excuses to tunnel assets back. The same logic holds for CASH: the more
cash the company holds, the more profit parent company is able to tunnel. All other
control variables have no significant impact on assets exchange revaluation. The
adjusted R-squares of the regressions range from 7.8% to 9.5%.
C. Market reaction to assets exchange
Hypothesis 3 states that if listed firms exchange more profitable assets for
less profitable assets, investors should react negatively, vice versa. To test the
market reaction, we employ the event-study methodology summarized by Campbell
et al. (1997). The event date (day zero) is defined as the date the firm makes an
announcement of assets exchange. For each company, we use an event period of 300
days (starting at day -279 and ending at day +20 relative to day zero). The first 259
days in this period (-279 through -21) are designated as the “estimation period,” and
the following 41 days (-20 through +20) are designated as the “event period.” We
run OLS regressions using security’s daily return as dependent variable and market
daily return as independent variable. Abnormal daily return is obtained from the
regression model’s residual.

23
Table 6 reports 3-day, 5-day, and 11-day cumulative abnormal returns (CAR)
surrounding assets exchange announcements. We also divide sample firms based on
the tunneling incentive and the propping incentive. As Table 6 shows, all average
CARs are positive. For example, the average 3-day window CAR is 0.706% and the
average 11-day window CAR is 0.947%. However, there is no significant difference
between subgroups for all the window periods. For example, for the 3-day CAR, the
average CAR for firms from incomplete restructuring is 0.846% and that for firms
from complete restructuring is 0.623% but they are insignificantly different. We
tried various windows such as 1-day, 2-day, 5-day and 10-day and get similar results
as Table 6 reports. Thus, we conclude that investors in China cannot see through the
different incentives during assets exchange. It casts doubt on the efficiency of
China’s capital market. It also indicates that Chinese market is less efficient than
Hong Kong’s where Cheung et al. (2006) find that investor can see through the
tunneling behavior.
(Insert Table 6 here)
D. Post-exchange firm performance
Although investors cannot see through the profitability of exchanged assets
in short-term window, we expect that the exchanged assets will affect firm
performance in the long-term. We measure post-exchange performance by both
stock returns and financial performance. We employ the following model to test the
last hypothesis.

24
BHAR (or AROA) = c0 + c1ABREVDIF + c2ROA + c3SIZE + c4MTB + c5CASH +
c6LEVERAGE + Industry Dummies + e
(3)
BHAR is the firm’s 12-month (or 24-month) post-exchange buy-and-hold-abnormal-
return starting one month after the assets exchange announcement month. AROA is
the one-year (or two-year) average return on assets in the following two years after
the announcement year. The independent variables include the following variables.
(1) ABREVDIF: it is the abnormal revaluation difference of surrendered and
acquired assets obtained from regression model (1).
(2) ROA, SIZE, MTB, CASH, and LEVERAGE: their definitions are the same as
those defined in Table 3 but they are calculated in the year of assets exchange
in this regression. These variables are included to control for factors which
may affect firm performance.
(Insert Table 7 here)
Table 7 reports the results for the above regression model. In Regressions 1
and 2 when 12-month and 24-month BHAR are used as the dependent variable, the
estimated coefficients on ABREVDIF are 0.039 and 0.051 with a significance level of
5%. The positive association between revaluation difference and long-term stock
returns indicate that firms will outperform the market if they exchanged less profitable
assets for more profitable assets with their parent companies, which is consistent with
Hypothesis 4. It makes sense because the more profitable assets acquired will bring
more income to the firm and hence better stock performance in the future. We find the

25
same results in Regressions 3 and 4 when one-year and two-year average ROA are
used as the dependent variable. These consistent results show that firms exchanged
more (less) profitable assets for less (more) profitable assets will have detrimental
(improved) stock and financial performance in the long term.
For both regressions, the ROA in the exchange year has significant positive
impacts on firms’ future performance. Firm size (SIZE) has positive impact on future
financial performance but not stock performance. Consistent with existing literature,
market-to-book (MTB) is negatively associated with future stock performance but not
with financial performance. The cash holding (CASH) has positive association with
future financial performance but not with stock performance. Finally, we find firm
leverage (LEVERAGE) has no impact on either stock performance or financial
performance. The adjusted R-squares are about 11% for stock performance
regressions and 39% for financial performance regressions.
V. Summary and Conclusion
The study examines the causes and consequences of a sample of assets
exchanges by China’s listed companies. The dataset is unique because it is very rare
in the U.S. that companies do barter-type assets exchanges.
Unlike the efficiency hypothesis and financing hypothesis examined in the
assets sales and purchase literature, we identify two different causes of assets
exchange in China: tunneling and propping. When firms are restructured incompletely
from existing enterprises, they tend to exchange more profitable assets for less
profitable assets to help their unlisted parent companies. On the other hand, when
firms have intention to avoid losses and to raise additional capital, their parent
companies tend to exchange more profitable assets for less profitable assets to help

26
their listed subsidiaries. We find empirical evidence which is consistent with our
hypotheses.
We further examine whether investors can see through the different incentives
of assets exchange in the short term and the result is they cannot. It may due to the
inefficiency of China’s capital market. But in the long term, the asymmetry of assets
revaluation in the exchange does have impacts on firm performance. If more
profitable assets are exchanged out, firms tend to underperform in the long run, and
vice versa.
Out results may have practical implications. We reveal additional investment
risks to both domestic and foreign investors in China’s capital markets as well as in
Chinese firms cross-listed in non-Chinese stock exchanges from assets exchanges.
According to our results, special attention should be paid by both domestic and
foreign investors to listed companies’ restructuring history and intention to avoid
losses and to raise additional capital when they exchange assets with parent
companies.

27
References
Aharony, J., Lee, C-W J., Wong, T. J., 2000. Financial packaging of IPO firms in
China. Journal of Accounting Research 38, 103-26.
Aharony, J., J. Wang and H. Yuan (2010), Tunneling as an incentive for earnings
management during the IPO process in China’, Journal of Accounting and Public
Policy 29, 1-26.
Alexander, G.J., P.G. Benson, and J.K. Kampmeyer. 1984. Investigating the valuation
effects of announcements of voluntary corporate selloffs. Journal of Finance 39, 503-
517.
Asquith, P., R. Gertner and D. Scharfstein. 1994. Anatomy of financial distress: An
examination of junk bond issuers. Quarterly Journal of Economics 109, 625-658.
Brown, D.T., C.M. James and R.M. Mooradian. 1994. Asset sales by financially
distressed firms. Journal of Corporate Finance 1: 233-257.
Campbell, J. Y., 1996. Understanding risk and return. Journal of Political Economy
104, 298-345.
Chen Kevin and Jiwei Wang. 2007. Accounting-based regulation in emerging
markets: the case of China's seasoned equity offerings. International Journal of
Accounting 42, 221-236.
Chen Kevin C. W. and Hongqi Yuan. 2004. Earnings management and capital
resource allocation: evidence from China's accounting-based regulation of rights
issues. The Accounting Review 79, 645-666.
Cheung, Yan-Leung, P. Raghavendra Rau, and Aris Stouraitis. 2006. Tunneling,
propping, and expropriation: evidence from connected party transactions in Hong
Kong. Journal of Financial Economics 82, 343-386.
Degeorge, F., J. Patel and R. Zeckhauser. 1999. Earnings management to exceed
thresholds. Journal of Business 72, 1–33.
Friedman, Eric, Simon Johnson and Todd Mitton. 2003. Propping and Tunneling,
Journal of Comparative Economics 31, 732-750.
Hite, G.L., J.E. Owers and R.C. Rogers. 1987. The market for interfirm asset sales.
Journal of Financial Economics 18, pp. 229–253.
Jain, P.C. 1985. The effect of voluntary sell-off announcements on shareholder
wealth. Journal of Finance 40, pp. 209–223.
Jarrell, G.A., 1979, “Pro-producer Regulation and Accounting for Assets: The Case of
Electric Utilities.” Journal of Accounting and Economics 1 (2): 93-116.

28
John, K. and E. Ofek. 1995. Asset sales and increase in focus. Journal of Financial
Economics 37, pp. 105–126.
Johnson, S., R. La Porta, F. Lopez-de-Silanes, and A. Shleifer. 2000. Tunneling.
American Economic Review 90, 22-27.
Lang, L.H.P., A.B. Poulson and R.M. Stulz. 1995. Asset sales firm performance and
the agency costs of managerial discretion. Journal of Financial Economics 37, pp. 3–
37.
Li, H. and L. A. Zhou. 2005. Political turnover and economic performance: The
disciplinary role of personnel control in China. Journal of Public Economics 89,
1743-1762.
Maksimovic, V. and G. Phillips. 2001. The market for corporate assets: who engages
in mergers and asset sales and are there efficiency gains? Journal of Finance 56, pp.
2019–2065.
Maksimovic, V. and G. Phillips. 2002. Do conglomerates allocate resources
efficiently? Journal of Finance 57, pp. 721–767.
Slovin, M.B., M.E. Sushka and J.A. Poloncheck. 2005. Methods of payment in asset
sales: contracting with equity versus cash. Journal of Finance 60, pp. 2385–2407.
Warusawitharana, Missaka. 2008. Corporate asset purchases and sales: Theory and
evidence. Journal of Financial Economics 87, 471-497.

29
TABLE 1: Sample composition of assets exchange firms
The table shows the sample composition by year and by industry, classified by ten
major industries (two-digit SIC code). The sample consists of 305 asset exchanges by
229 listed Chinese firms on the Shanghai Stock Exchange and Shenzhen Stock
Exchange from 2000 to 2006. The industry classification is based on Campbell
(1996). The equivalent two-digit SIC codes are: Food and Tobacco (1, 2, 9, 20, 21,
54); Basic industries including Petroleum (10, 12, 13, 14, 24, 26, 28, 29, 33);
Construction (15, 16, 17, 32, 52); Textiles and Trade (22, 23, 31, 51, 53, 56, 59);
Consumer Durables (25, 30, 36, 37, 39, 50, 55, 57); Capital Goods (34, 35, 38);
Transportation (40, 41, 42, 44, 45, 47); Utility (46, 48, 49); Services (60-69 for
financial services, 72, 73 75, 76, 80, 82, 87, 89); and there are no specific SIC code
for Conglomerate. As the number of firms in the Petroleum industries (SIC code 13,
29) is small (only one exchange in 2001, 2005 and 2006 respectively), we combine
them with the Basic industries.
Industry
Year
2000 2001 2002 2003 2004 2005 2006 Subtotal Percentage
Food and Tobacco
2 0 2 1 7 3 2 17 5.6%
Basic industries
including
Petroleum
1 2 4 6 16 2 7 38 12.5%
Construction
1 0 3 3 2 3 4 16 5.2%
Textiles and Trade
0 5 0 3 11 3 2 24 7.9%
Consumer
Durables
1 2 7 15 11 6 12 54 17.7%
Capital Goods
1 2 5 14 7 8 11 48 15.7%
Transportation
1 2 0 6 5 0 0 14 4.6%
Utility
1 2 1 7 1 1 6 19 6.2%
Services including
Financial Services
1 3 4 5 5 5 2 25 8.2%
Conglomerate
1 8 5 19 3 7 7 50 16.4%
Entire sample 10 26 31 79 68 38 53 305 100%

30
TABLE 2: Description of assets exchanges
Panel A: Type of exchange parties
The panel shows the number of exchanges by the type of exchange parties. Exchange
parties are generally classified as related parties and non-related parties. Related
parties consist of parent companies (or the largest corporate shareholders) of listed
companies, other large corporate shareholders, brother companies which are under the
common control with listed companies, and others. Non-related parties have no
relation with listed companies. The type of exchange parties is disclosed by listed
companies in their assets exchange announcements.
Related parties Non-related
parties
Total
Parent
companies
Other
shareholders
Brother
companies
Others
Number of
exchanges
219
(71.8%)
17
(5.6%)
8
(2.6%)
12
(3.9%)
49
(16.1%)
305
(100%)
Panel B: Type of assets exchanged
The panel shows the number of exchanges by the type of assets exchanged. Assets
group means the exchanged asset includes a group of assets and liabilities such as a
product line and an operating unit. Equity shares means the exchanged asset is the
equity ownership in another entity. Receivables means the exchanged asset mainly
consists of receivables. PPE, Land and Other tangible assets means the exchanged
asset is either PPE (property, plant and equipment), or land, or other tangible assets
such as inventories, or a combination of tangible assets. Intangibles means the
exchanged asset mainly consists of intangible assets.
Assets
group
Equity
shares
Receivables PPE, Land
and Other
tangible
assets
Intangibles Total
Assets
Surrendered
32
(10.5%)
113
(37.0%)
110
(36.1%)
43
(14.1%)
7
(2.3%)
305
(100%)
Assets
Acquired
15
(4.9%)
176
(57.7%)
11
(3.6%)
73
(23.9%)
30
(9.9%)
305
(100%)

31
TABLE 3: Sample descriptive characteristics
The table reports end of fiscal year summary statistics for listed firms that exchange assets during the
next year. For comparison, it also reports the statistics for all listed firms during the same period (1999-
2005, i.e., one year ahead of the sample period). Return on assets (ROA) is the operating income before
depreciation scaled by book value of total assets at the beginning of the fiscal year. SIZE measures the
nature logarithm of book value of total assets at the end of fiscal year. Stock return (SRET) is
computed over the fiscal year. Market-to-book (MTB) ratio of equity is computed as the ratio between
the market value of equity and the book value of equity at the end of the fiscal year. CASH denotes
cash and short-term investments scaled by the book value of assets at the end of fiscal year.
LEVERAGE denotes book value of debt scaled by book value of total assets at the end of the fiscal
year. Sales growth (SALESG) and PPE growth (PPEG) measure growth in net sales and net plant,
property, and equipment, respectively, over the previous fiscal year. All the above statistics are
winsorized at the 1st and 99th percentiles. The deal value is reported in millions of Chinese Renminbi
(RMB). The assets-out value and assets-in value are the revaluation of surrendered and acquired assets
in millions of RMB, respectively. The N denotes the number of observations and Std denotes the
standard deviation. The last column reports statistics for test of differences in means and medians of the
two groups. Bold statistics denote statistical significance at the 1% level.
All listed firms Sample firms Test of
difference
N Mean Median Std. N Mean Median Std. t-stat
(z-stat)
ROA 6917
0.034 0.038 0.073 305 0.008 0.014 0.059 5.80
(8.22)
ROE
6917 0.057 0.073 0.180 305 -0.011 0.026 0.217 5.40
(7.85)
ROS
6908 0.048 0.077 0.336 305 -0.012 0.035 0.258 3.12
(6.51)
SIZE 6917
21.004 20.929 0.885 305 20.927 20.882 0.819 1.42
(1.20)
SRET 6921
-0.010 -0.107 0.492 305 -0.142 -0.150 0.314 4.10
(3.27)
MTB 6750
4.150 3.150 3.812 305 4.227 3.090 3.451 -0.42
(-0.45)
CASH 6917
0.158 0.129 0.119 305 0.135 0.113 0.101 3.04
(2.75)
LEVERAGE 6917
0.078 0.040 0.099 305 0.072 0.042 0.087 0.82
(0.19)
SALESG 6908
0.215 0.114 0.587 305 0.096 0.066 0.515 3.20
(3.40)
PPEG 6915
0.178 0.044 0.496 305 0.158 0.011 0.596 1.04
(2.64)
Deal value --
-- --
-- 305 270.145 97.764 1272.466 --
Assets-Out value --
-- --
-- 305 251.991 87.939 1264.481 --
Assets-In value --
-- --
-- 305 256.471 95.201 1267.095 --
32
Table 4 Abnormal assets revaluation
Panel A Assets revaluation prediction models
This panel presents the ordinary least square (OLS) regression results using exchanged assets
revaluation as dependent variable and OUTBOOK (or INBOOK), OUTFIX (or INFIX), OUTINT (or
ININT), RPT, AUDIT, INDDIR, FINCON and the industry dummies (see Table 1 for SIC
equivalence) as independent variables. OUTBOOK (or INBOOK) is the book values of surrendered (or
acquired) assets. OUTFIX (or INFIX) takes value of one if surrendered (or acquired) assets include
fixed assets and zero otherwise. OUTINT (or ININT) takes value of one if surrendered (or acquired)
assets include intangible assets and zero otherwise. RPT takes value of one if the exchanged party is a
related-party of sample firm and zero otherwise. AUDIT takes value of one if the exchange transaction
is audited and zero otherwise. INDDIR takes value of one if the exchange transaction is supported by
independent directors and zero otherwise. FINCON takes value of one if the exchange announcement is
accompanied with an independent financial consulting report.
Assets revaluation
(surrendered)
Assets revaluation
(acquired)
OUTBOOK 0.979***
(46.86)
--
OUTFIX 619.965
(0.42)
--
OUTINT 1884.030
(0.52)
--
INBOOK -- 1.010***
(140.64)
INFIX -- 2289.565
(0.94)
ININT -- -1125.477
(-0.46)
RPT 2800.283
(1.38)
910.464
(0.35)
AUDIT 734.405
(0.43)
3137.953
(1.47)
INDDIR -1815.391
(-1.11)
-2138.486
(-1.04)
FINCON 1553.945
(0.99)
2881.994
(1.48)
Industry
Dummies
Food and Tobacco -165.592
(-0.05)
4466.724
(0.94)
Basic industries including Petroleum -1777.515
(-0.61)
-4257.482
(-1.10)
Construction -2841.194
(-0.76)
649.546
(0.13)
Textiles and Trade -2571.573
(-0.79)
-3595.501
(-0.84)
Consumer Durables -976.891
(-0.36)
1096.899
(0.30)
Capital Goods -1972.734
(-0.69)
-3919.787
(-1.06)
Transportation 8279.583**
(2.08)
7547.296
(1.50)
Services including financial services -2887.399
(-0.65)
-4325.598
(-0.77)
Conglomerate -2005.478
(-0.79)
-2749.125
(-0.82)
N 305 305
Adjusted R2 0.912 0.986

33
Table 4 Abnormal assets revaluation (continued)
Panel B Abnormal assets revaluation descriptive statistics
This panel reports the abnormal assets revaluation for surrendered and acquired
assets. The residuals obtained from the regressions in Panel A scaled by book value of
exchanged assets are used to proxy for abnormal assets revaluation. The difference
between the abnormal surrendered assets revaluation and abnormal acquired assets
revaluation is used as a proxy for the quality of exchanged assets in later analyses.
The abnormal assets revaluation measures are winsorized at the 1st and 99
th
percentiles. *** denotes statistical significance at the 1% level.
Min 25th
Median 75th
Max Mean Std
Abnormal assets
revaluation
(surrendered) -3.852 -0.252 -0.049 0.069 3.119 -0.085 0.853
Abnormal assets
revaluation
(acquired) -7.278 -0.658 -0.141 0.134 7.220 -0.253 1.627
Abnormal
revaluation
difference
(surrendered –
acquired) -7.179 -0.120 0.108*** 0.469 4.635 0.135*** 1.415

34
Table 5 Tunneling and propping incentives of assets exchange
This table presents the OLS regression results using abnormal revaluation difference
(ABREVDIF) as dependent variable and INCREST, INTENTION, ROA, SIZE, SRET, MTB,
CASH, LEVERAGE, SALESG, PPEG, and the industry and year dummies as independent
variables. Incomplete restructuring (INCREST) takes value of one if the firm is incompletely
restructured during IPO process and zero otherwise. INTENTION equals one when the firm
has the intention to avoid losses (it has previous one or two years’ losses) or raise additional
capital (either rights offering or seasonal equity offering) in the following year and zero
otherwise. INCREST*INTENTION is an interaction term. Return on assets (ROA) is the
operating income before depreciation scaled by book assets at the beginning of the fiscal year.
SIZE measures the log book value of total assets in millions of Chinese Renminbi (RMB).
Stock return (SRET) is computed over the fiscal year. Market-to-book (MTB) ratio is
computed as the ratio between the market value of equity and the book value of equity. CASH
denotes cash and short-term investments scaled by the book value of assets. LEVERAGE
denotes book value of debt scaled by book value of debt plus equity. Sales growth (SALESG)
and PPE growth (PPEG) measure growth in net sales and net plant, property, and equipment,
respectively, over the previous fiscal year. * and ** denote statistical significance at the 10%
and 5% level, respectively.
Regression 1 Regression 2 Regression 3
ABREVDIF ABREVDIF ABREVDIF
INCREST
-0.385**
(-2.11)
-0.011
(-0.04)
INTENTION
0.581**
(2.27)
0.563**
(2.05)
INCREST * INTENTION 0.170
(0.97)
ROA -5.156**
(-2.35)
-5.296**
(-2.44)
-5.314**
(-2.43)
SIZE -0.098
(-0.72)
-0.109
(-0.81)
-0.117
(-0.83)
SRET 0.366
(0.79)
0.244
(0.53)
0.241
(0.52)
MTB 0.012
(0.39)
0.012
(0.39)
0.010
(0.32)
CASH -1.878*
(-1.88)
-2.058**
(-2.09)
-2.061**
(-2.07)
LEVERAGE -0.396
(-0.37)
-0.429
(-0.41)
-0.456
(-0.42)
SALESG -0.038
(-0.21)
-0.126
(-0.66)
-0.121
(-0.65)
PPEG 0.168
(0.91)
0.175
(0.96)
0.171
(0.93)
Industry Dummies Included Included Included
Year Dummies Included Included Included
Intercept 2.158
(0.75)
2.554
(0.90)
2.617
(0.91)
N 305 305 305
Adjusted R2 0.078 0.090 0.095

35
Table 6 Cumulative abnormal returns surrounding assets exchange
announcements
This table reports the 3-day, 5-day and 11-day cumulative abnormal returns
surrounding assets exchange announcements. The normal return is predicted by a
regression using security’s daily return on market daily return. Abnormal return is
then obtained from the residual of the regression model. The sample is divided into
two groups based on either INCREST or INTENTION. INCREST and INTENTION
are defined in Table 5. The last column reports the t-statistics for test of mean
difference and z-statistics for test of median difference.
Number
of events
Average
CAR (%)
Median
CAR (%)
t-statistics
(z-statistics)
Three-day window CAR (-1, +1)
Full sample 305 0.706 0.052
INCREST=1 171 0.846 -0.052
INCREST=0 134 0.623 0.121 0.35 (-0.78)
INTENTION=1 142 1.123 0.086
INTENTION=0 163 0.360 -0.016 1.16 (0.51)
Five-day window CAR (-3, +1)
Full sample 305 0.829 0.151
INCREST=1 171 0.919 0.116
INCREST=0 134 0.850 0.224 0.18 (-0.60)
INTENTION=1 142 1.115 0.013
INTENTION=0 163 0.595 0.170 0.70 (-0.59)
Eleven-day window CAR (-9, +1)
Full sample 305 0.947 0.566
INCREST=1 171 1.213 0.605
INCREST=0 134 0.826 0.575 0.43 (0.58)
INTENTION=1 142 0.854 0.119
INTENTION=0 163 1.023 0.656 -0.20 (-0.47)

36
Table 7 The association between abnormal assets revaluation difference and
post-exchange firm performance
This table reports the results for regressions using post-exchange firm performance as
dependent variables and ABREVDIF, ROA, SIZE, MTB, CASH, LEVERAGE and Industry
Dummies as independent variables. Post-exchange firm performance is measured by both
stock returns and financial performance. 12-month (24-month) post-exchange BHAR is the
firm’s 12-month (24-month) post-exchange buy-and-hold-abnormal-return (BHAR) starting
one month after the assets exchange announcement month. One-year post-exchange ROA is
the firm’s ROA (operating income scaled by beginning-of-year total assets) in the fiscal year
immediately after the assets exchange fiscal year. Average post-exchange ROA is calculated
as the average of two years’ ROA after the fiscal year of assets exchange. The independent
variable of ROA is the firm’s ROA in the fiscal year of assets exchange. SIZE measures the
log book value of total assets at the end of exchange year. Market-to-book (MTB) ratio is
computed as the ratio between the market value of equity and the book value of equity at the
end of exchange year. CASH denotes cash and short-term investments scaled by the book
value of assets at the end of exchange year. LEVERAGE denotes book value of debt scaled
by book value of total assets at the end of exchange year. t-statistics are reported in
parentheses. *, ** and *** denote two-tailed significance at the 10%, 5% and 1% level,
respectively.
Regression 1 Regression 2 Regression 3 Regression 4
Explanatory
variables
12-month post-
exchange BHAR
24-month post-
exchange BHAR
One-year post-
exchange ROA
Average two-year
post-exchange
ROA
Intercept
2.362**
(2.05)
2.532**
(2.27)
-0.220**
(-2.26)
-0.214**
(-2.14)
ABREVDIF
0.039**
(2.01)
0.051**
(2.26)
0.016**
(2.11)
0.015**
(2.01)
ROA
1.316**
(2.00)
1.325**
(1.98)
0.419***
(8.95)
0.376***
(8.47)
SIZE
0.071
(1.58)
0.063
(1.56)
0.011**
(2.05)
0.010**
(2.03)
MTB
-0.057***
(-5.16)
-0.056***
(-5.23)
-0.000
(-0.26)
-0.000
(-0.25)
CASH
0.032
(0.09)
0.033
(0.09)
0.072**
(2.26)
0.082**
(2.37)
LEVERAGE
0.319
(0.98)
0.409
(0.99)
0.029
(0.78)
0.028
(0.77)
Industry
Dummies
Included
Included
Included Included
N 305 305 305 305
Adjusted R2 0.113 0.115 0.393 0.387