Causal&Inference - CEGAcega.berkeley.edu/assets/cega_events/33/2.02_Casual_Inference_McCoy.pdf ·...
60
Causal Inference Sandi McCoy, MPH, PhD University of California, Berkeley July 16, 2011 Enhancing Implementa/on Science: Program Planning, Scaleup, and Evalua/on
Transcript of Causal&Inference - CEGAcega.berkeley.edu/assets/cega_events/33/2.02_Casual_Inference_McCoy.pdf ·...
Causal Inference Sandi McCoy, MPH, PhD University of California, Berkeley July 16, 2011 Enhancing Implementa/on Science: Program Planning, Scale-‐up, and Evalua/on
Program Outcome ?

Program Outcome ?
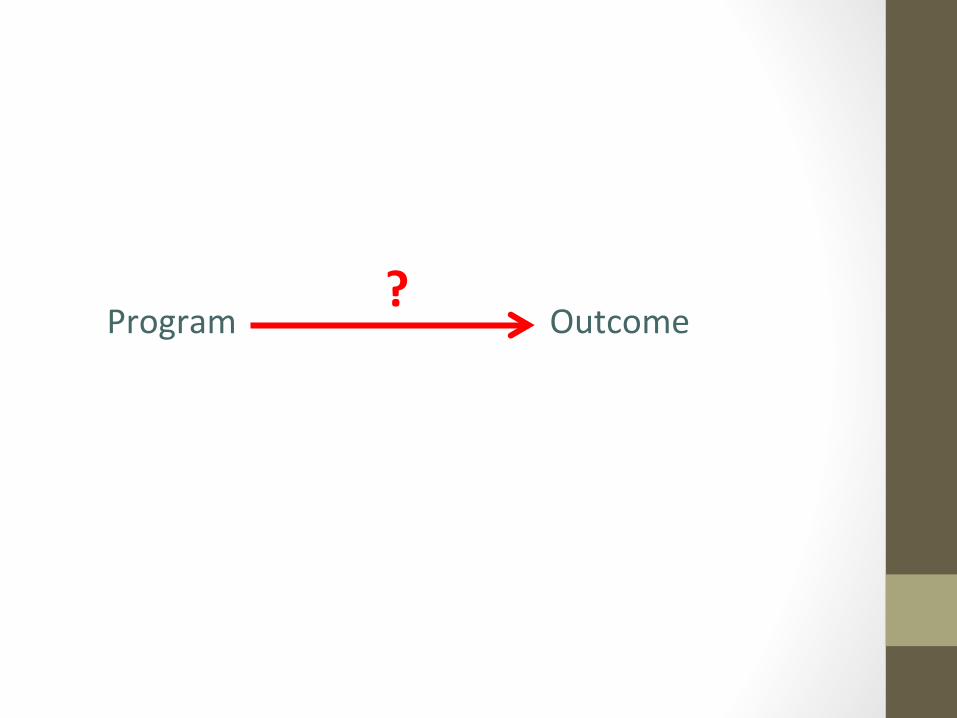
Other programs Socioeconomics
Individual factors: Sexual risk
behavior, condom use, MC
Social norms, inequality
Regional Prevalence Fidelity
Epidemic phase
Source: Stefano Bertozzi, BMGF
Social, economic, cultural, poli/cal and biological milieu
HIV Incidence
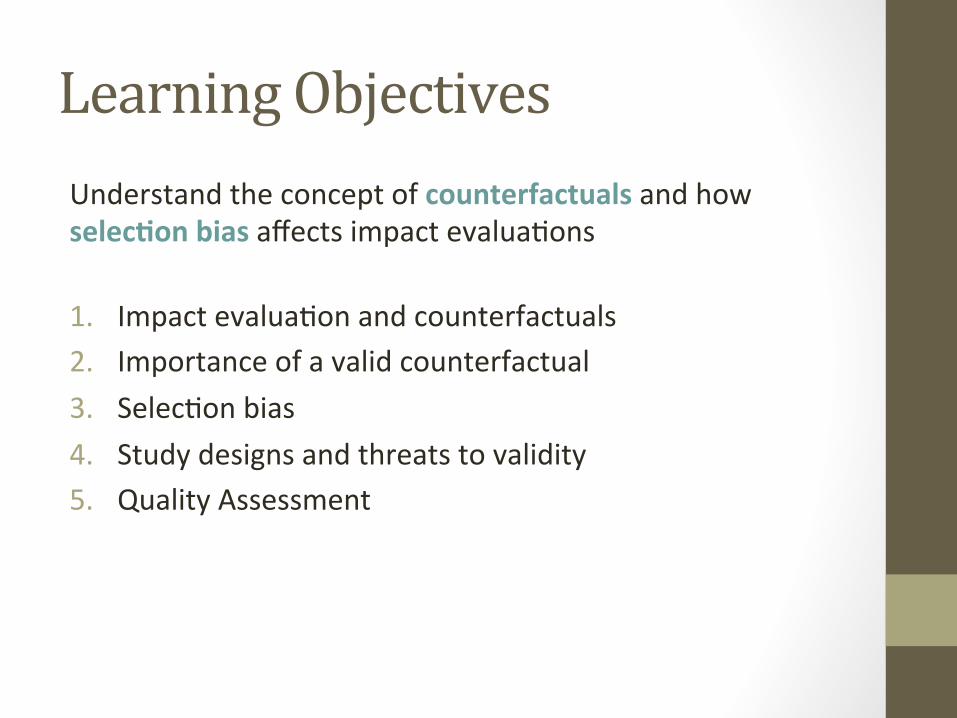
Learning Objectives Understand the concept of counterfactuals and how selec/on bias affects impact evaluaOons 1. Impact evaluaOon and counterfactuals 2. Importance of a valid counterfactual 3. SelecOon bias 4. Study designs and threats to validity 5. Quality Assessment
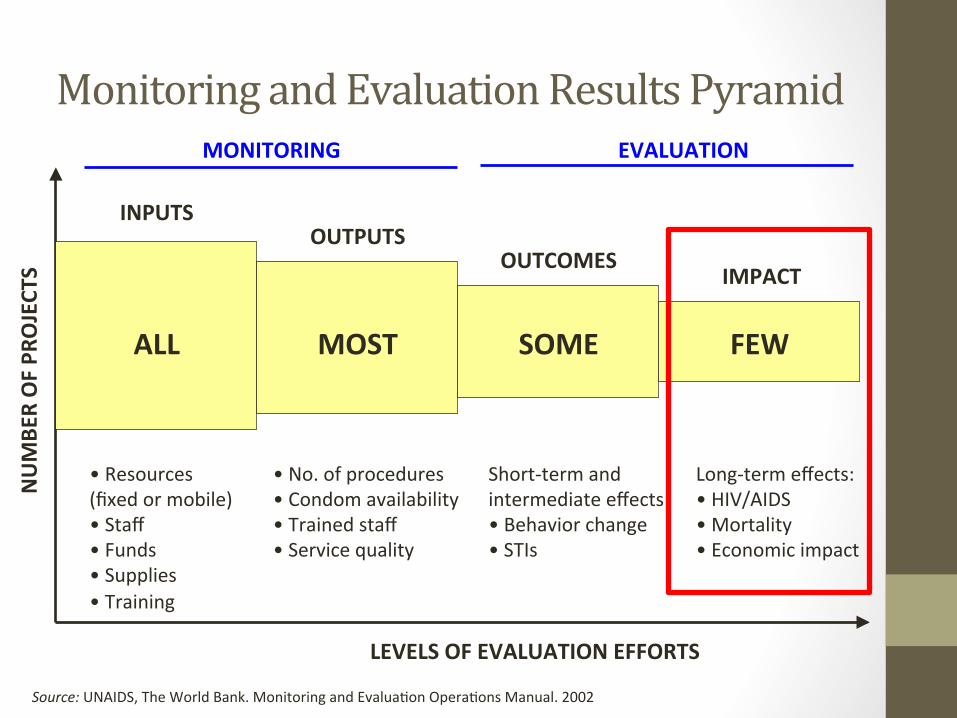
Monitoring and Evaluation Results Pyramid
Source: UNAIDS, The World Bank. Monitoring and EvaluaOon OperaOons Manual. 2002
NUMBE
R OF PR
OJECT
S
LEVELS OF EVALUATION EFFORTS
ALL MOST SOME FEW
MONITORING EVALUATION
INPUTS OUTPUTS
OUTCOMES IMPACT
• Resources (fixed or mobile) • Staff • Funds • Supplies • Training
• No. of procedures • Condom availability • Trained staff • Service quality
Short-‐term and intermediate effects: • Behavior change • STIs
Long-‐term effects: • HIV/AIDS • Mortality • Economic impact

Impact Evaluation Answers: • What was the effect of the program on outcomes? (causal a6ribu8on)
• How much beber off are the beneficiaries as a result of the program?
• What happened compared to what would have happened without the program?
• Is the program cost-‐effecOve?

Example: What is the Impact of…
giving Robert
(P)
(Y)?
addiOonal pocket money
on Robert’s consumpOon of candies?

The Perfect Clone Robert Robert’s Clone
IMPACT: 6-‐4=2 Candies
6 candies 4 candies

Solving the Evaluation Problem • Problem: we never observe the same individual with and without program at same point in Ome
• Need to es/mate what would have happened to the beneficiary if he or she had not received benefits; i.e. causal a6ribu8on

In reality, use statistics
Average Y=6 candies Average Y=4 Candies
IMPACT=6-‐4=2 Candies
Treatment Comparison

Our Objective: EsOmate the CAUSAL effect (impact) of:
interven'on P (male circumcision) on outcome Y (HIV incidence)

Solution: • EsOmate what would have happened to Y in the absence of P • We call this the…………
COUNTERFACTUAL

Solution: • EsOmate what would have happened to Y in the absence of P • We call this the…………
COUNTERFACTUAL
The key to a good impact evaluation is a valid counterfactual!

Why Do We Need a Counterfactual?
Preven/on failure or treatment success?
Balanced success?
Treatment failure or preven/on success?
At this stage of the epidemic…?
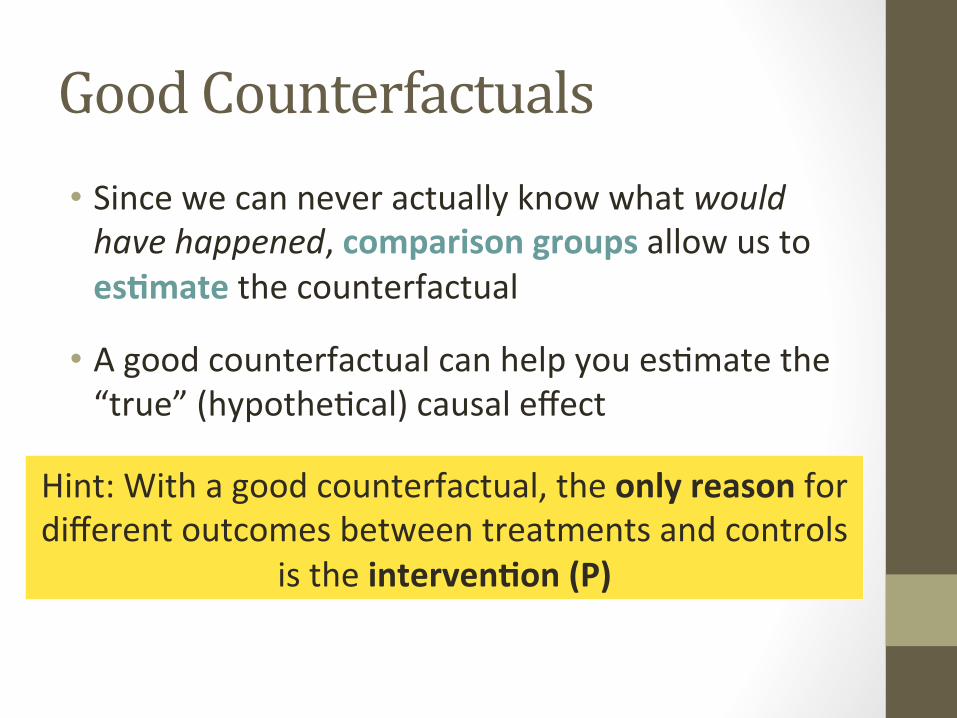
Good Counterfactuals • Since we can never actually know what would have happened, comparison groups allow us to es/mate the counterfactual
• A good counterfactual can help you esOmate the “true” (hypotheOcal) causal effect
Hint: With a good counterfactual, the only reason for different outcomes between treatments and controls
is the interven/on (P)

Finding a Good Counterfactual The treated group and the counterfactual group: • Have idenOcal factors/characterisOcs, except for benefiOng from the intervenOon • The only reason for the difference in outcomes is due to the intervenOon
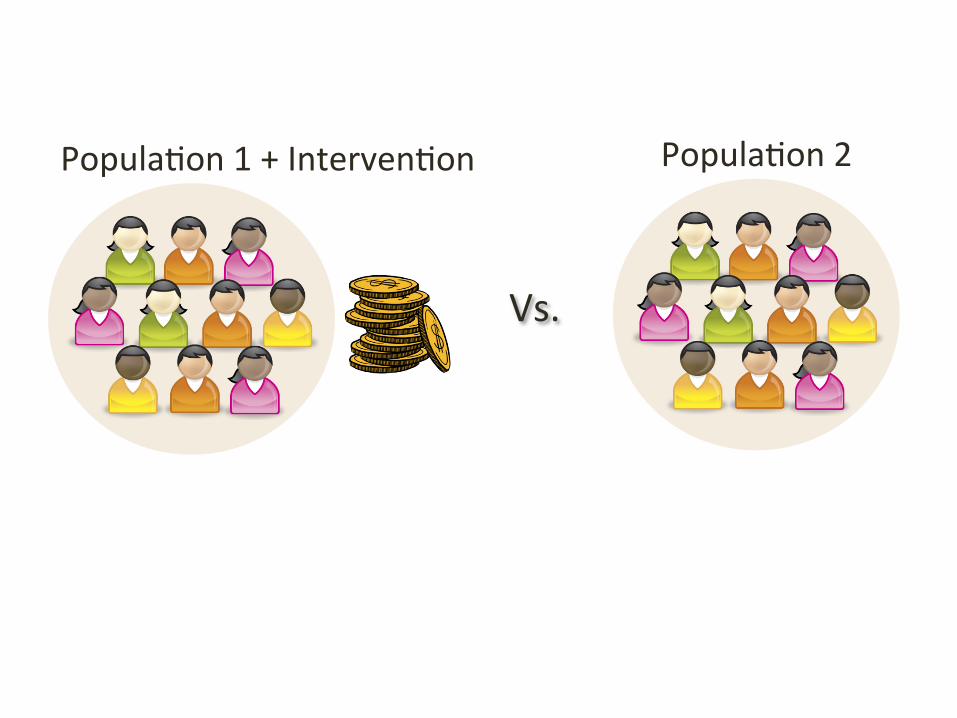
Vs.
PopulaOon 1 + IntervenOon PopulaOon 2

Poor Counterfactuals Can Threaten Validity 1. Selec/on Bias • Volunteer parOcipants or those not receiving program are different than those without
2. Confounding 3. Endogenous Change • Secular changes or drik (long term trends
in community, region or country) • MaturaOonal trends (Individual change) • Interfering events
• Measurement error • Hawthorne/cohort effects
All studies!
Study Designs & Threats to Validity
1. Enrolled vs. Not Enrolled (Selec/on Bias)
”
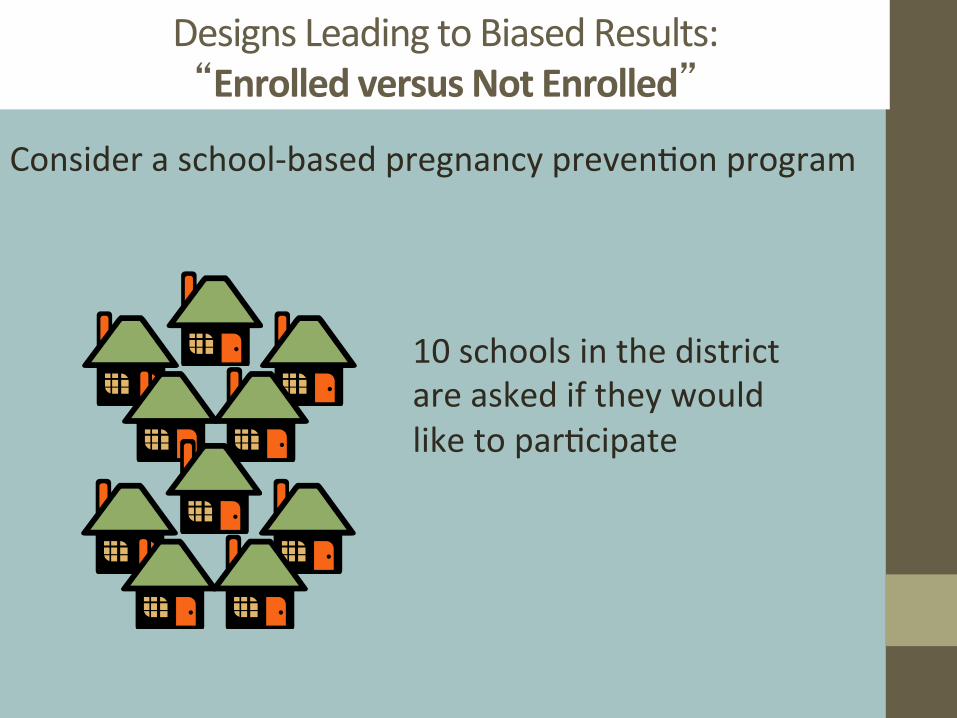
Designs Leading to Biased Results: “Enrolled versus Not Enrolled”
Consider a school-‐based pregnancy prevenOon program
10 schools in the district are asked if they would like to parOcipate

Designs Leading to Biased Results: “Enrolled versus Not Enrolled”
5 schools decline par/cipa/on
5 schools elect to par/cipate in the
program Pregnancy Preven'on Program
No interven'on
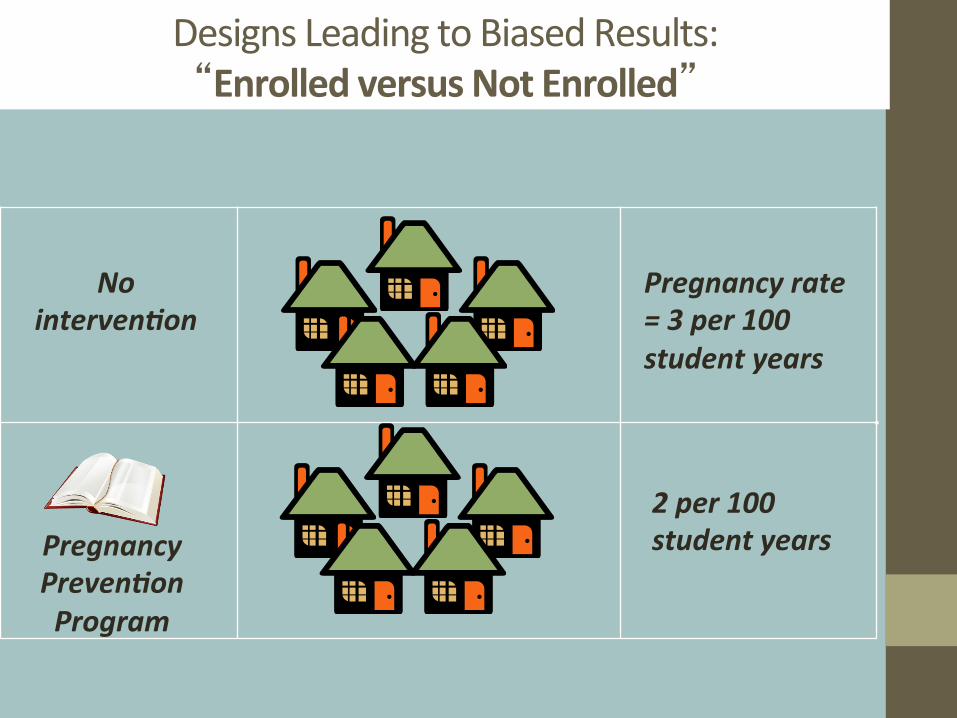
Designs Leading to Biased Results: “Enrolled versus Not Enrolled”
Pregnancy Preven'on Program
No interven'on
Pregnancy rate = 3 per 100 student years
2 per 100 student years

Designs Leading to Biased Results: “Enrolled versus Not Enrolled”
Pregnancy Preven'on Program
No interven'on
Pregnancy rate = 3 per 100 student years
2 per 100 student years
Schools in the program had fewer adolescent pregnancies…
Can we a[ribute this difference to the program?

Designs Leading to Biased Results: “Enrolled versus Not Enrolled”
Pregnancy Preven'on Program
No interven'on
Pregnancy rate = 3 per 100 student years
2 per 100 student years
Factor X (more conserva've)
Less conserva've

Designs Leading to Biased Results: “Enrolled versus Not Enrolled”
Pregnancy Preven'on Program
No interven'on
Pregnancy rate = 3 per 100 student years
2 per 100 student years
Factor X (More conserva've))
Less conserva've
Observed effect might be due to differences in “Factor X” which led to differen/al self-‐ selec/on
into the program (“selec/on bias”)

Designs Leading to Biased Results: “Enrolled versus Not Enrolled”
• This design compares “apples to oranges” • The reason for not enrolling in the program might be correlated with the outcome – You can staOsOcally “control” for observed factors – But you cannot control for factors that are “unobserved”
• EsOmated impact erroneously mixes the effect of different factors
Study Designs & Threats to Validity
2. Confounding (Correla/on or Causa/on?)
”
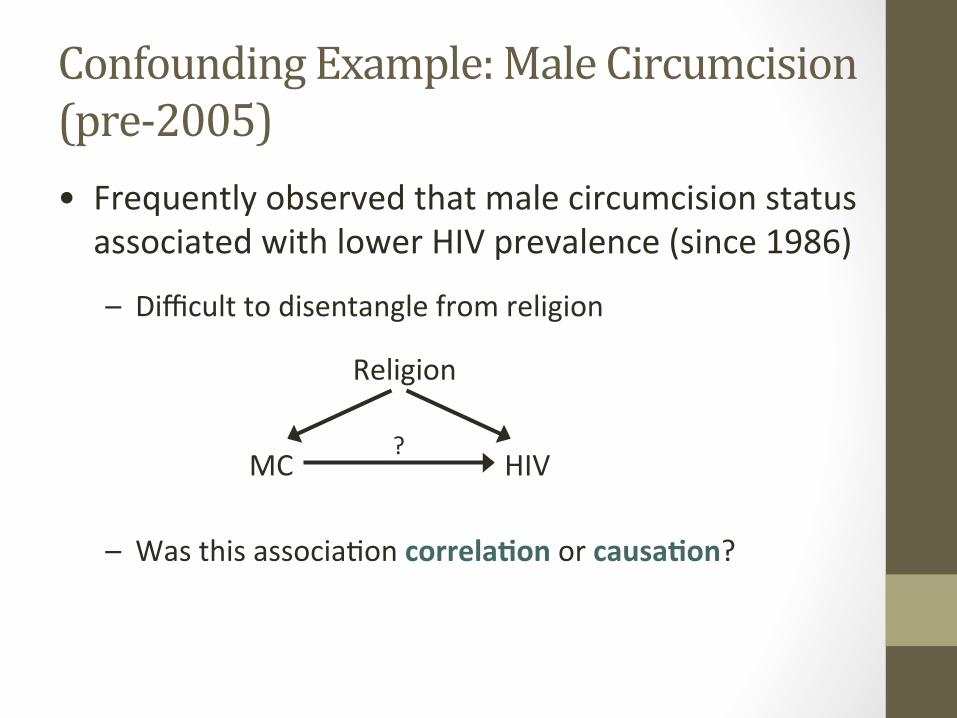
Confounding Example: Male Circumcision (pre-‐2005) • Frequently observed that male circumcision status associated with lower HIV prevalence (since 1986)
– Difficult to disentangle from religion
– Was this associaOon correla/on or causa/on?
MC HIV
Religion
?

RCTs conVirmed the observational data
Study Result
Auvert, 2005, South Africa IRRA = 0.39 (0.23, 0.66)
Bailey, 2007 , Kenya RR = 0.47 (0.28, 0.78)
Gray, 2007, Uganda IRRA = 0.49 (0.29, 0.81)
Combined Effect ↓58% (95% CI: 43–69%)
The RCTs addressed this problem by randomizing men to get circumcised immediately or aker a waiOng period, eliminaOng selecOon bias & confounding

Study Designs & Threats to Validity
3. Before-‐Afer or Pre-‐Post (endogenous changes)
”
Designs Leading to Biased Results: “Before-‐Afer” or “Pre-‐Post” Designs
• Data on the same individuals before and aker an intervenOon

Designs Leading to Biased Results: “Before-‐Afer” or “Pre-‐Post” Designs
Time
Designs Leading to Biased Results: “Before-‐Afer” or “Pre-‐Post” Designs
Time
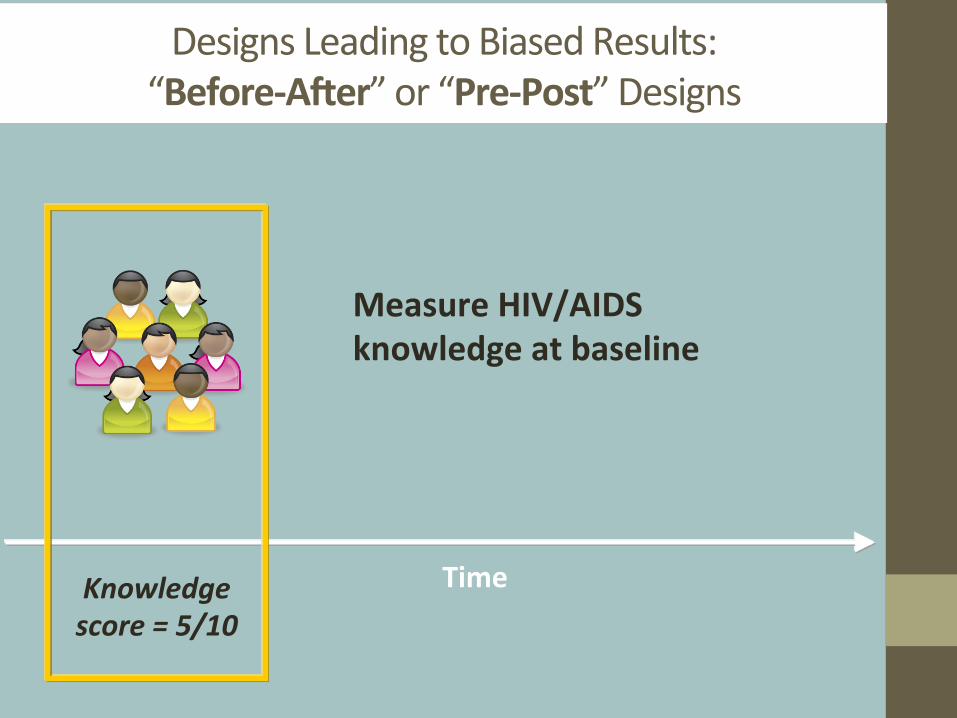
Measure HIV/AIDS knowledge at baseline
Knowledge score = 5/10

Designs Leading to Biased Results: “Before-‐Afer” or “Pre-‐Post” Designs
Time Knowledge score = 5/10
HIV Educa8onal Interven8on

Designs Leading to Biased Results: “Before-‐Afer” or “Pre-‐Post” Designs
Time Knowledge score = 5/10
HIV Educa8onal Interven8on

Designs Leading to Biased Results: “Before-‐Afer” or “Pre-‐Post” Designs
Time Knowledge score = 5/10
HIV Educa8onal Interven8on
Knowledge score = 9/10

Designs Leading to Biased Results: “Before-‐Afer” or “Pre-‐Post” Designs
Time Knowledge score = 5/10
HIV Educa8onal Interven8on
Knowledge score = 9/10
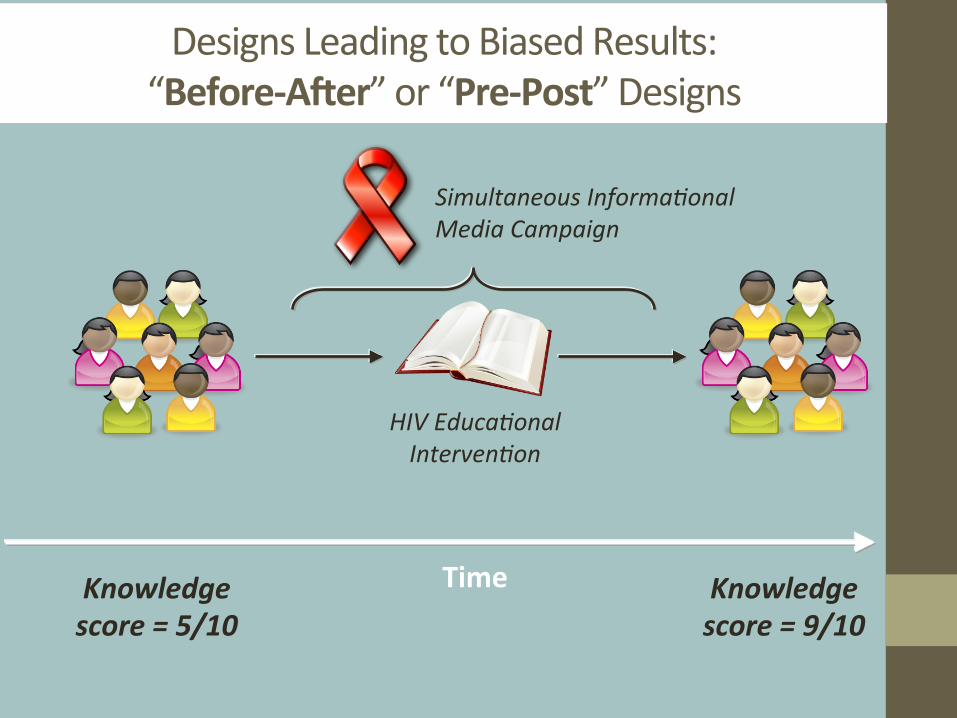
4 point improvement in score afer the interven/on…
Can we a[ribute this improvement to the program?
Designs Leading to Biased Results: “Before-‐Afer” or “Pre-‐Post” Designs
Time Knowledge score = 5/10
HIV Educa8onal Interven8on
Knowledge score = 9/10
Simultaneous Informa8onal Media Campaign

Designs Leading to Biased Results: “Before-‐Afer” or “Pre-‐Post” Designs
Time Knowledge score = 5/10
HIV Educa8onal Interven8on
Knowledge score = 9/10
Simultaneous Informa8onal Media Campaign
Problem: Can’t account for /me varying factors that impact the outcome, such as:
• changes in the economy
• natural changes in the epidemic
• simultaneous interven/ons

Study Designs & Threats to Validity
4. Historical Controls”
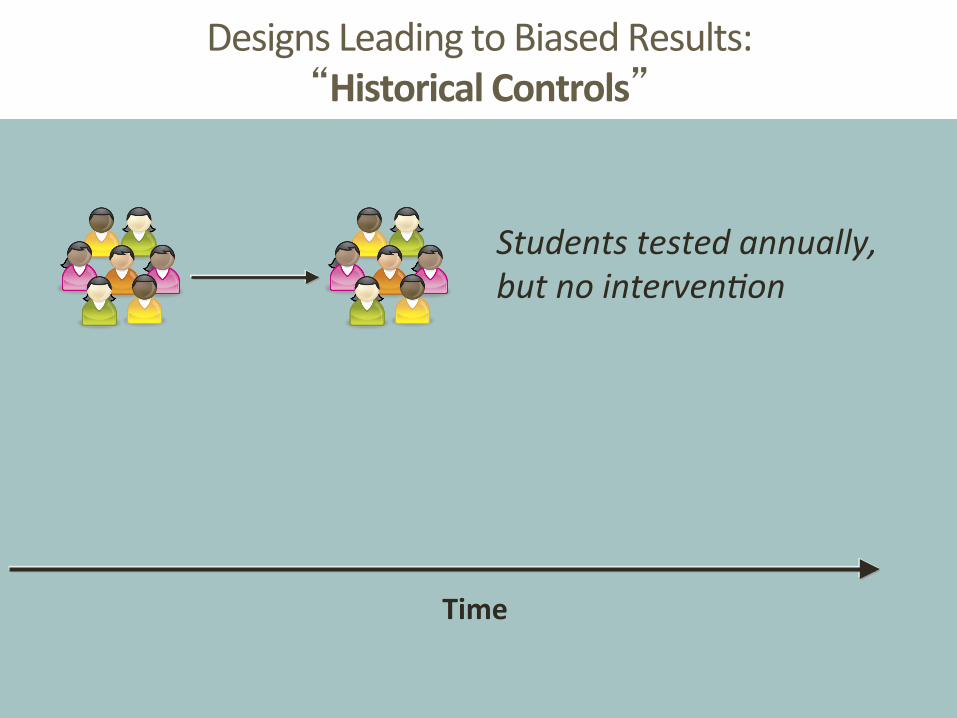
Designs Leading to Biased Results: “Historical Controls”
Time
Students tested annually, but no interven8on

Designs Leading to Biased Results: “Historical Controls”
Time
Students tested annually, but no interven8on
Knowledge score = 4/10
A

Designs Leading to Biased Results: “Historical Controls”
Time
Students tested annually, but no interven8on
Knowledge score = 4/10
A
Knowledge score = 5/10
B

Designs Leading to Biased Results: “Historical Controls”
Time
Knowledge score = 4/10
A
Knowledge score = 5/10
B
Knowledge score = 5/10
Knowledge score = 9/10
C D
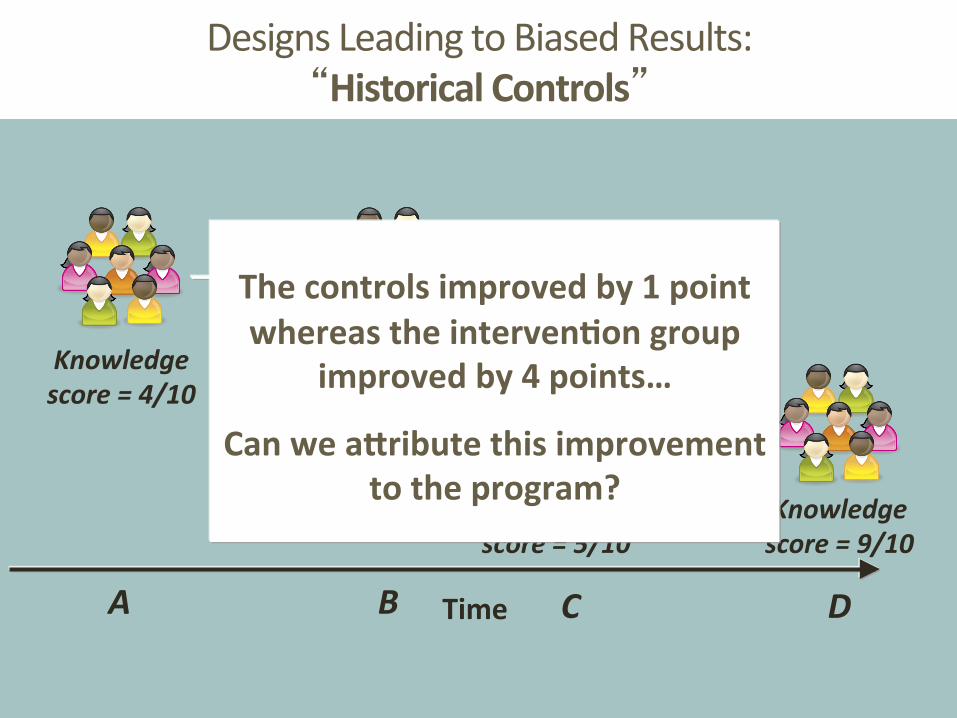
Designs Leading to Biased Results: “Historical Controls”
Time
Knowledge score = 4/10
A
Knowledge score = 5/10
B
Knowledge score = 5/10
Knowledge score = 9/10
C D
The controls improved by 1 point whereas the interven/on group
improved by 4 points…
Can we a[ribute this improvement to the program?

Designs Leading to Biased Results: “Historical Controls”
Time
Knowledge score = 4/10
A
Knowledge score = 5/10
B
Knowledge score = 5/10
Knowledge score = 9/10
C D
Problem: Control group may not be comparable
Factors (other than the interven/on) may differ:
• teachers
• teacher: student ra/o • funding
• textbooks

Study Designs & Threats to Validity
5. Matched Designs
”
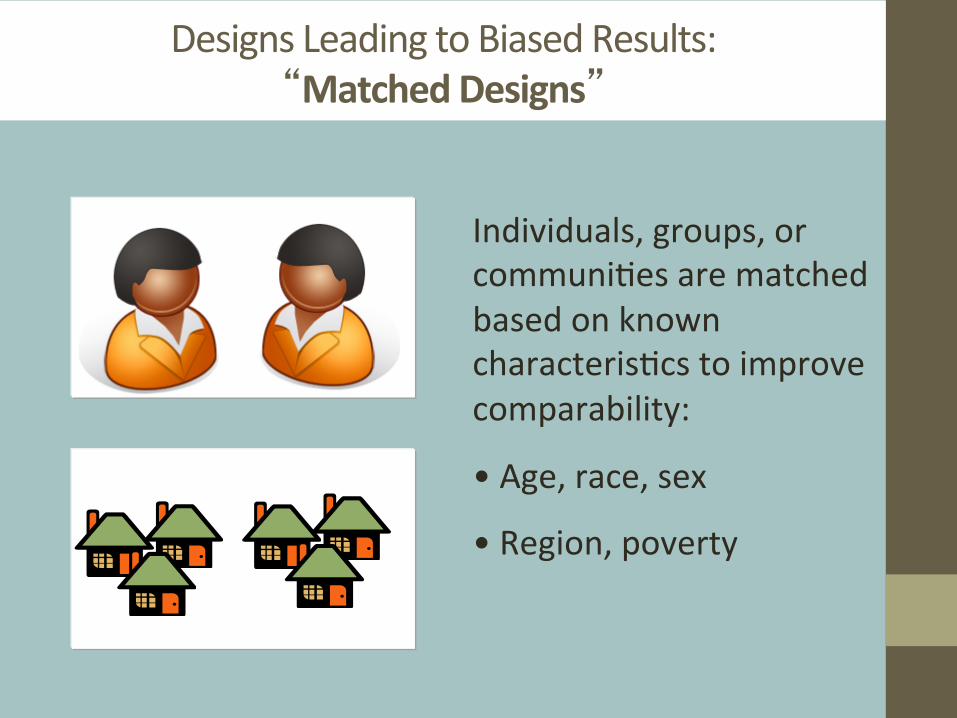
Designs Leading to Biased Results: “Matched Designs”
Individuals, groups, or communiOes are matched based on known characterisOcs to improve comparability:
• Age, race, sex • Region, poverty
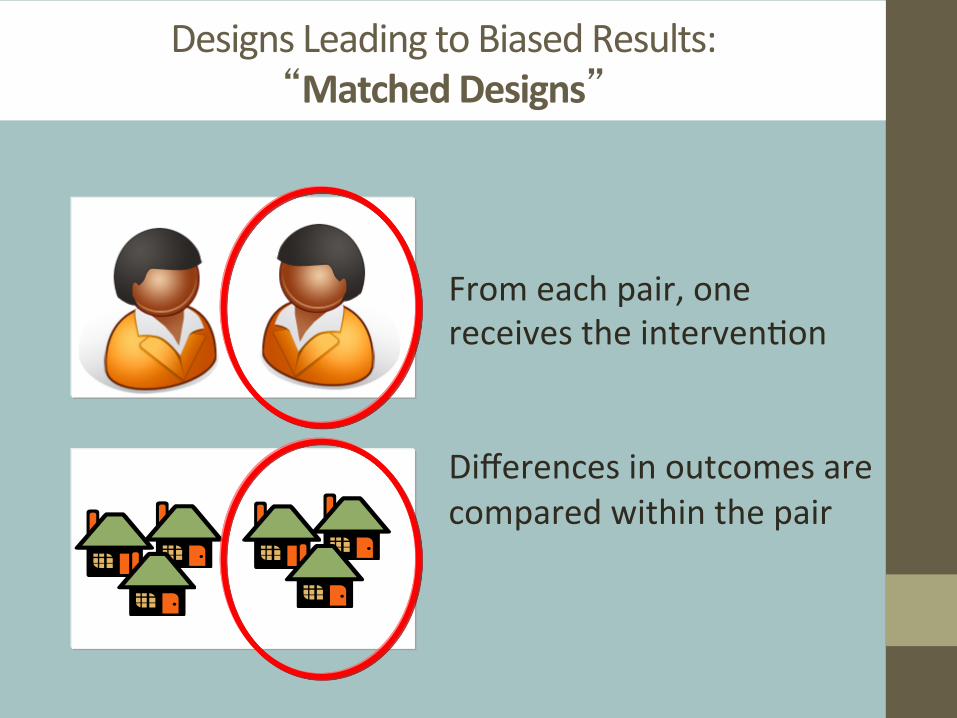
Designs Leading to Biased Results: “Matched Designs”
From each pair, one receives the intervenOon
Differences in outcomes are compared within the pair

Designs Leading to Biased Results: “Matched Designs”
Does this design ensure that the matched pairs are comparable on all factors except the interven8on?

Designs Leading to Biased Results: “Matched Designs”
Does this design ensure that the matched pairs are comparable on all factors except the interven8on?
No: Only observed factors are used for matching
Unobserved factors may differ

Counterfactuals & Ethical Conduct of Research • Oken our choice of counterfactuals is limited by
ethics
• Lack of naive comparison groups
• When we might want to compare “something” to “nothing” we have to instead compare to “something” to “something else”
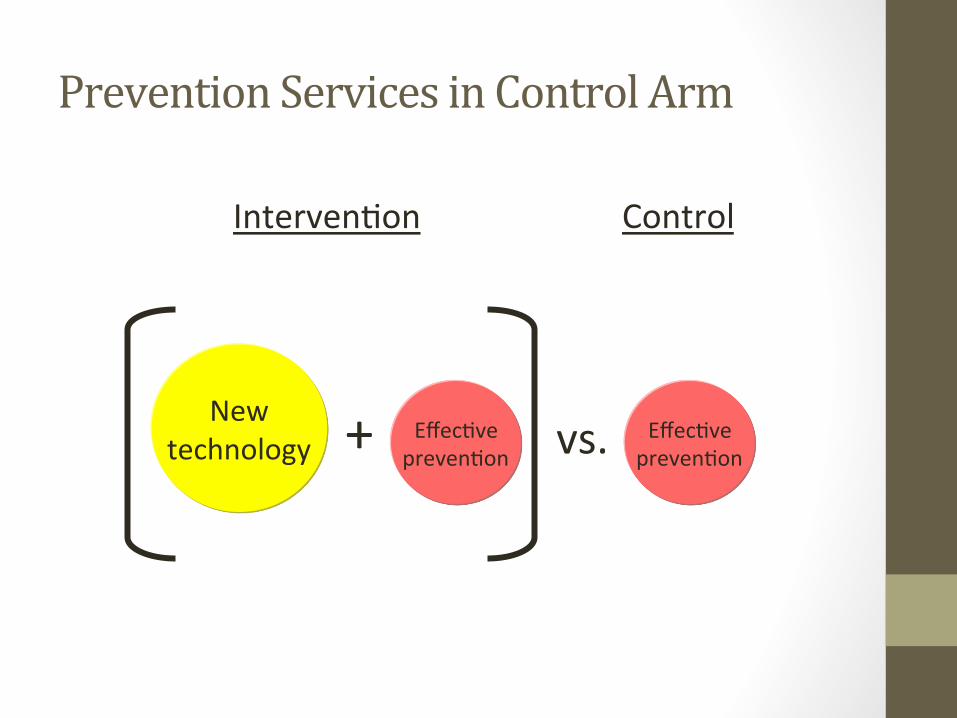
Prevention Services in Control Arm
vs.
New technology
+ EffecOve
prevenOon EffecOve prevenOon
IntervenOon Control

0
20
40
60
80
100
120
Standard of care "ExcepOonal" prevenOon intervenOons
Tested intervenOon only Tested plus excepOonal
Percen
tage of the
baseline nu
mbe
r of n
ew infec/on
s per year
observed af
er th
e interven
/on /ral is com
plete
Universal ethical guidelines prohibit observing the two groups of villages which do not receive "excep/onal" preven/on interven/ons
Hypothe/cal results of measuring new HIV infec/ons in four groups of villages
receiving four preven/on op/ons
Upper bound incidence for tested plus excep/onal

Impact Evaluation Quality Assessment
What is the ques/on of interest? • “What is the impact of P on Y among popula8on X?” • What is the program, intervenOon, or treatment, P? • What is the outcome, Y, of interest?
What is the unit of analysis?
• Is impact being measured in individuals or clusters (e.g., faciliOes, schools)?
• Was clustering accounted for in the analysis?

Impact Evaluation Quality Assessment
What is the counterfactual? • Is there an observed comparison group?
• If not, what are observed data being compared to (e.g., historical controls, pre-‐intervenOon baseline, modeled counterfactual)?
• How is membership in the treatment and comparison group determined?

Impact Evaluation Quality Assessment
Quality of the counterfactual
• Does the treatment and comparison groups differ only with respect to the program? If randomized assignment Yes If non-‐randomized assignment No
• What are potenOal sources of bias?
• What are strengths and weaknesses of this counterfactual?
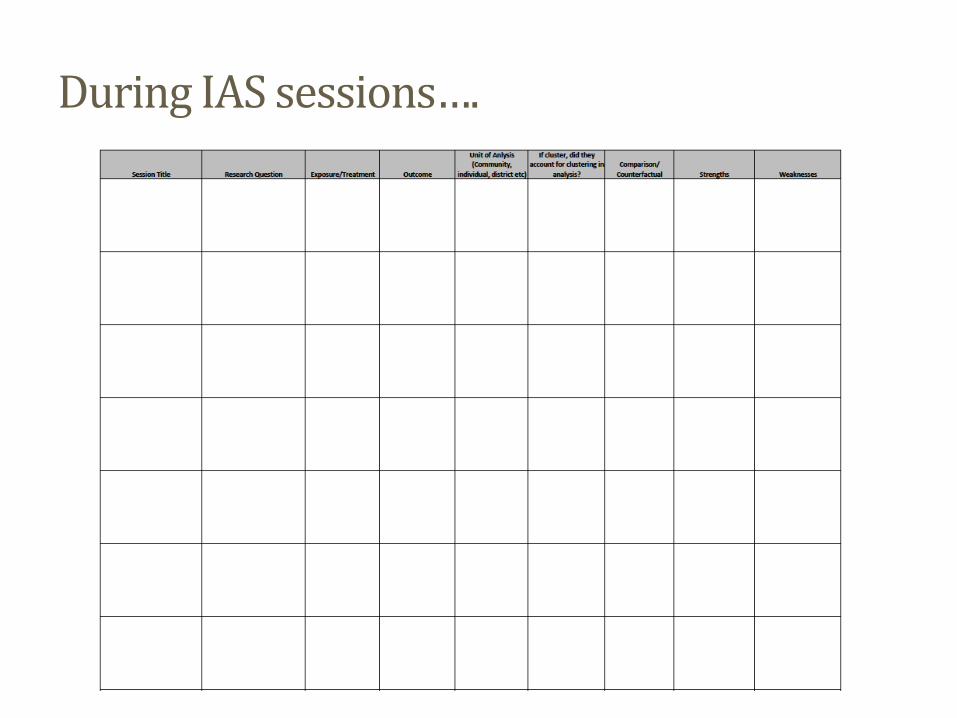
During IAS sessions….

Questions? Many thanks to those whose slides I’ve borrowed: Nancy Padian, Stefano Bertozzi, Sebas/an Mar/nez, Paul Gertler, Mead Over Several slides adapted from: Impact Evalua'on in Prac'ce by Paul J. Gertler, SebasOan MarOnez, Patrick Premand, Laura B. Rawlings, Christel M. J. Vermeersch hbp://publicaOons.worldbank.org/index.php?main_page=product_info&products_id=23915
60


![Bayesian Causal Inference - uni-muenchen.de...from causal inference have been attracting much interest recently. [HHH18] propose that causal [HHH18] propose that causal inference stands](https://static.fdocuments.in/doc/165x107/5ec457b21b32702dbe2c9d4c/bayesian-causal-inference-uni-from-causal-inference-have-been-attracting.jpg)