Causal inference in data science
48
Causal inference in data science: From Prediction to Causation Amit Sharma Postdoctoral Researcher, Microsoft Research @amt_shrma 1 Data Engineering Conf 2016, NYC Global Data Science Conf 2017, Bay Area http://www.amitsharma.in http://www.github.com/amit-sharma/causal- inference-tutorial
-
Upload
amit-sharma -
Category
Data & Analytics
-
view
1.534 -
download
0
Transcript of Causal inference in data science

Causal inference in data science: From Prediction to CausationAmit SharmaPostdoctoral Researcher, Microsoft Research@amt_shrma
Data Engineering Conf 2016, NYCGlobal Data Science Conf 2017, Bay Area
http://www.amitsharma.in
http://www.github.com/amit-sharma/causal-inference-tutorial

• Why should we care about causal inference?• Most machine learning algorithms depend on correlations.• Correlations alone are a dangerous path to actionable insights.
• Causal inference can make prediction models more robust• Ensure assumptions more robust to changes in data.
• Causal inference can help evaluate impact of systems• What is the additional revenue if we build a recommender
system?
Objectives and Takeaways

3
I. We have increasing amounts of data and highly accurate predictions. How is causal inference useful?

Predictive systems are everywhere

Aim: Predict future activity for a user.
We see data about their user profile and past activity.
E.g., for any user, we might see their age, gender, past activity and their social network.
How do predictive systems work?
…
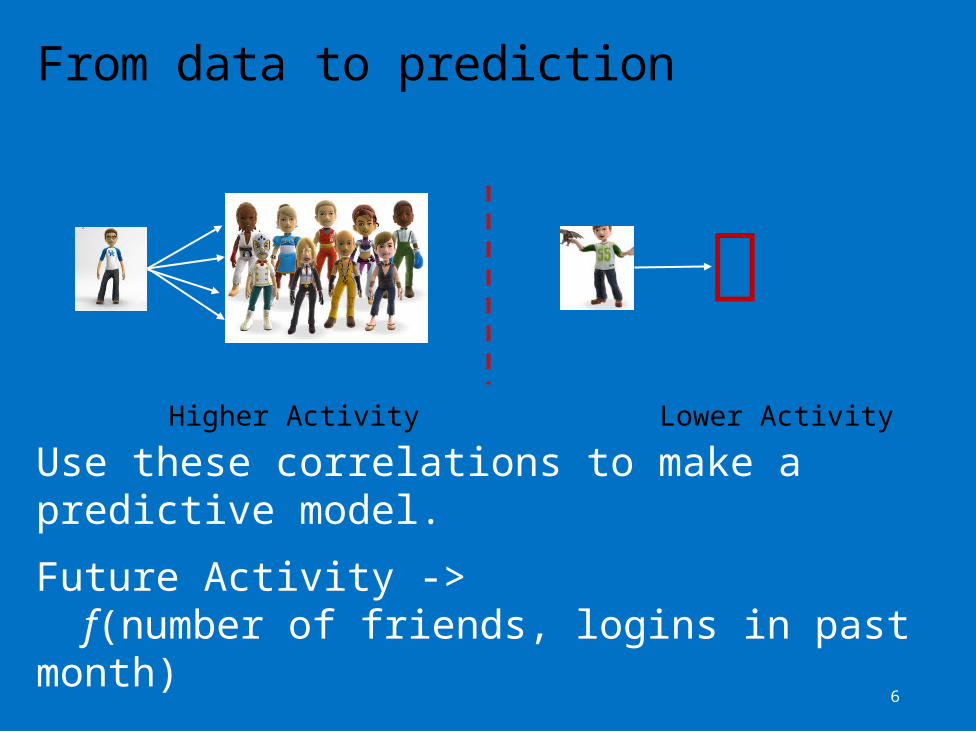
From data to prediction
Higher Activity Lower ActivityUse these correlations to make a predictive model.Future Activity ->
f(number of friends, logins in past month)

From data to “actionable insights”
Number of friends can predict activity with high accuracy.How do we increase activity of users?
Would increasing the number of friends increase people’s activity on our system?Maybe, may be not (!)

Different explanations are possible
How do we know what causes what?Decision: To increase activity, would it make sense to launch a campaign to increase friends?

Search engines uses ad targeting to show relevant ads.Prediction model based on user’s search query.
Search Ads have the highest click-through rate (CTR) in online ads.
An example with $$$: Search Ads

Are search ads really that effective?
Ad targeting was highly accurate. Blake-Tadelis-Noskos (2014)

But search results point to the same website
Counterfactual question: Would I have reached Amazon.com anyways, without the ad?

Without reasoning about causality, may overestimate effectiveness of ads
x% of ads shown are effective
<x% of ads shown are effective

Okay, search ads have an explicit intent. Display ads should be fine?
Probably not. There can be many hidden causes for an action, some of which may be hard to quantify.

Estimating the impact of ads
Toys R Us designs new ads.Big jump in clicks to their ads compared to past campaigns.
Were these ads more effective?

People anyways buy more toys in December
Misleading to compare ad campaigns with changing underlying demand.

So far, so good. Be mindful of hidden causes, or else we might overestimate causal effects.
1 2
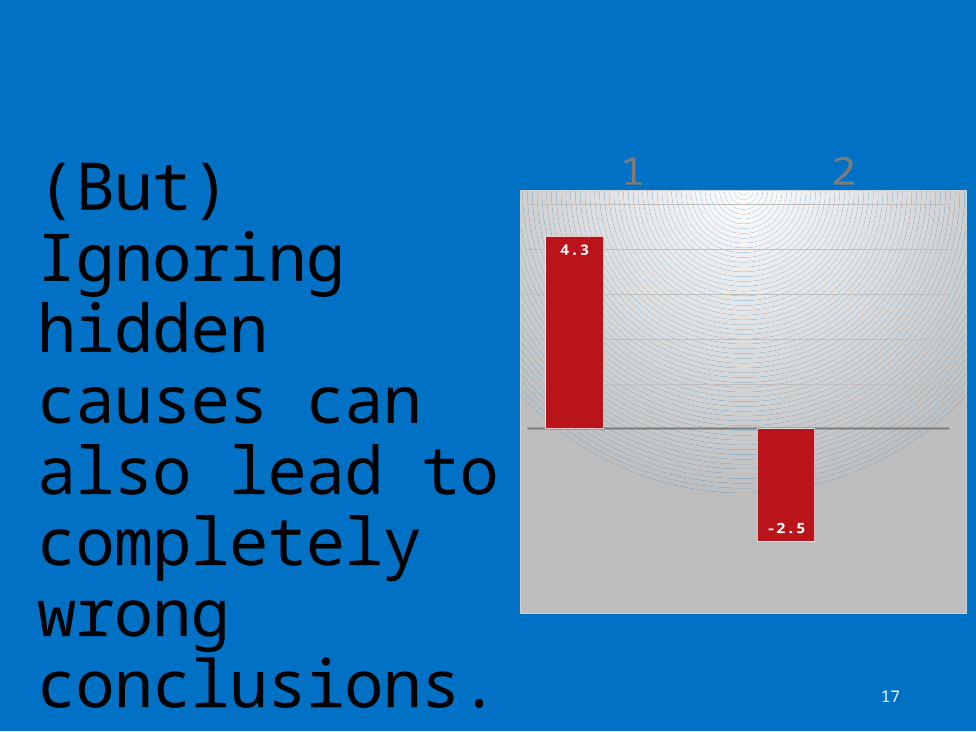
(But)Ignoring hidden causes can also lead to completely wrong conclusions.
1 2

Have a current production algorithm. Want to test if a new algorithm is better. Say recommendations for an app or to try out an health exercise.
Example: Which algorithm is better?
Algorithm A Algorithm B
?

Two algorithms, A and B running on the system according to some logic. From system logs, collect data for 1000 sessions for each. Measure the success rate.
Comparing two algorithms
Algorithm A Algorithm B50/1000 (5%) 54/1000 (5.4%)
New algorithm is better?

Suppose we divide users into two groups:
Low-activityHigh-activity
Looking at change in Success Rate by activity
Algorithm A Algorithm B 10/400 (2.5%) 4/200 (2%)
Algorithm A Algorithm B 40/600 (6.6%) 50/800 (6.2%)
Low-activity Users
High-activity Users
Is Algorithm A better?
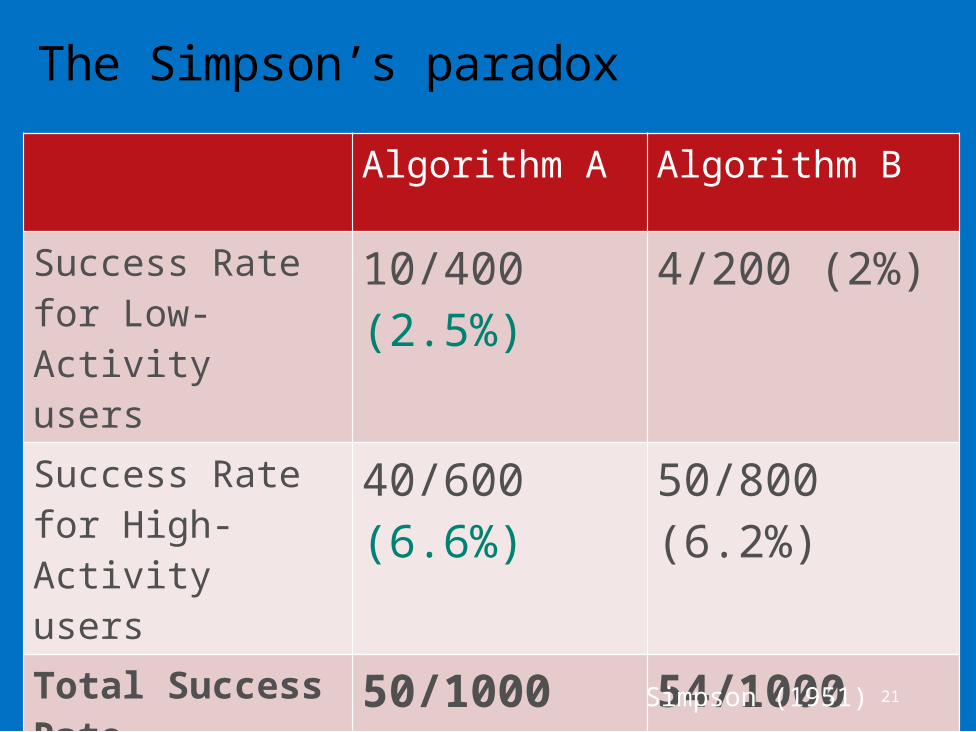
The Simpson’s paradoxAlgorithm A Algorithm B
Success Rate for Low-Activity users
10/400 (2.5%) 4/200 (2%)
Success Rate for High-Activity users
40/600 (6.6%) 50/800 (6.2%)
Total Success Rate 50/1000 (5%) 54/1000 (5.4%)
Simpson (1951)

E.g., Algorithm A could have been shown at different times than B. There could be other hidden causal variations.
Answer (as usual): May be, may be not.
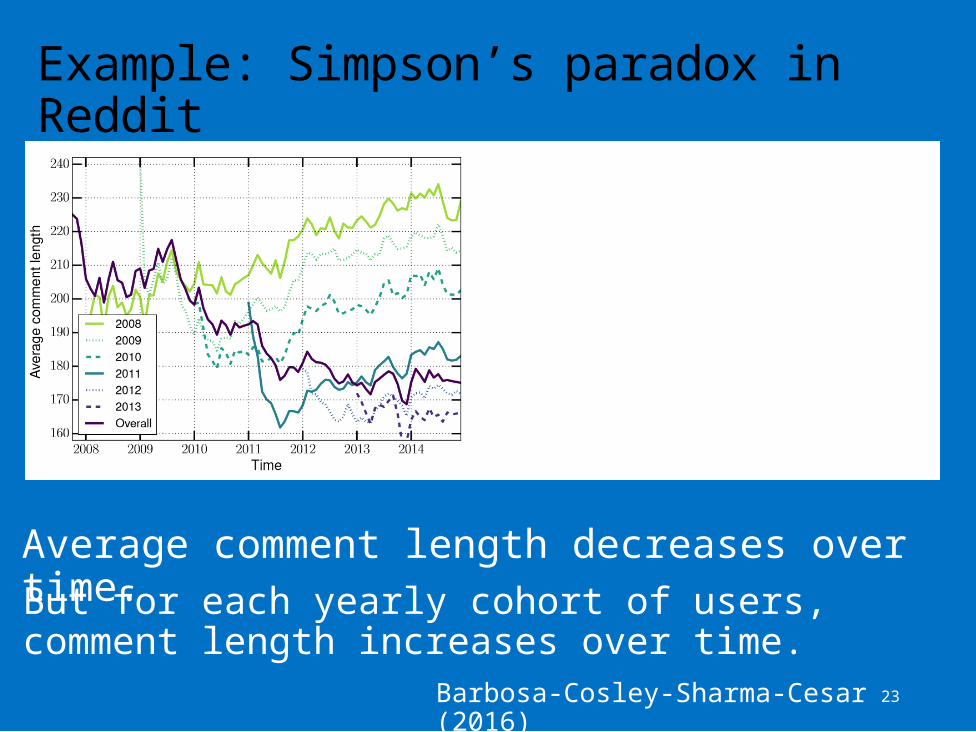
Average comment length decreases over time.
Example: Simpson’s paradox in Reddit
Barbosa-Cosley-Sharma-Cesar (2016)
But for each yearly cohort of users, comment length increases over time.

Making sense of such data can be too complex.

25
II. How do we systematically reason about and estimate the relationship between effects and their causes?

Formulating causal inference problems
Causal inference: Principled basis for both experimental and non-experimental methods.
Aside: Such questions form the basis of almost all scientific inquiry.E.g., occur in medicine (drug trials, effect of a drug), social sciences (effect of a certain policy), and genetics (effect of genes on disease).
Frameworks:• Causal graphical models [Pearl 2009]• Potential Outcomes Framework [Imbens-Rubin 2016]

A big philosophical debate (since the times of Aristotle, Hume and others).
Practical meaning*: X causes Y iff changing X leads to a change in Y, keeping everything else constant.
The causal effect is the magnitude by which Y is changed by a unit change in X.
What does it mean to cause?
*Interventionist definition [http://plato.stanford.edu/entries/causation-mani/]

Basic construct of causal inference.
Counterfactual thinking*: What would have happened if I had changed X?
E.g. What would have been the Success Rate had we not shifted to the new algorithm?
Need answers to “what if” questions
*Counterfactual theories of causationhttp://plato.stanford.edu/entries/causation-counterfactual/

29
A hard problem.Naïve estimate
Causal estimate
Cloned user
clicks
clicks
Old Algorithm
Old AlgorithmNew Algorithm clicks
Ideally, requires creation of multiple worlds.

30
Randomizing algorithm assignment: A/B testWe cannot clone users.
Next best alternative: Randomly assign which users see new Algorithm’s recommendations and which see the old algorithm’s.

31
Randomization removes hidden variation
Causal estimate
Random User 2
clicks
clicks
Old Algorithm
Old Algorithm
New Algorithm clicks
Random User 1
…

32
Continuous experimentation: Multi-armed bandits
Two goals:1. Show the best
known algorithm to most users.
2. Keep randomizing to update knowledge about competing algorithms.

33
Bandits: The right mix of explore and exploit
clicks to recommendation
s
clicks to recommendatio
ns
Old Algorithm
Random Algorithm
Current-best Algorithm
clicks to recommendation
sMost users
…
Other users
34
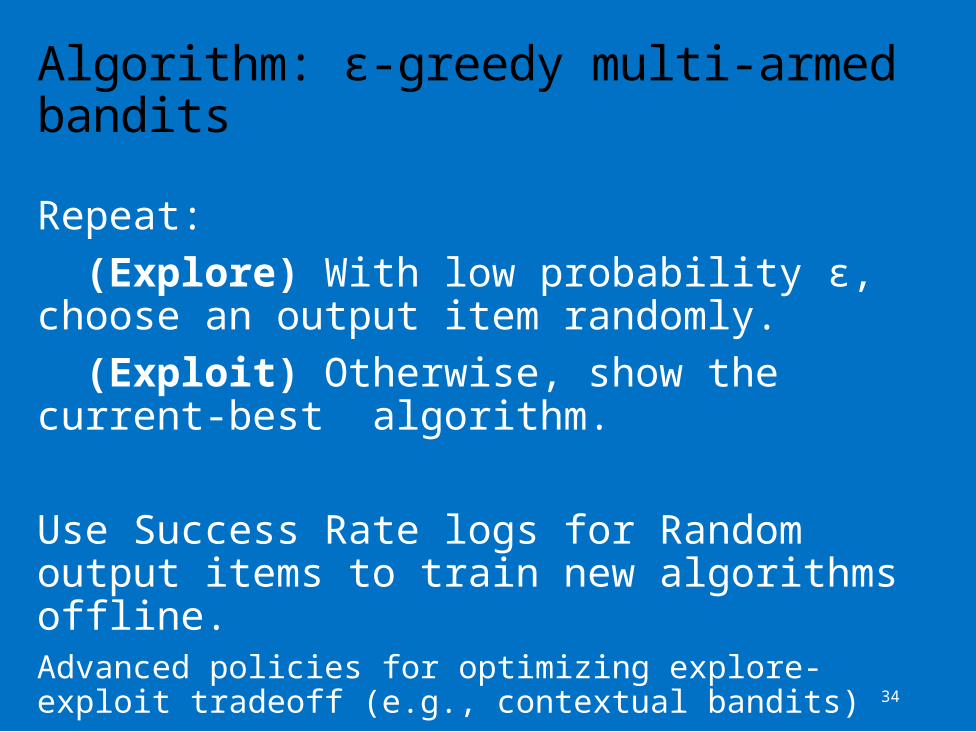
Algorithm: ɛ-greedy multi-armed banditsRepeat:
(Explore) With low probability ɛ, choose an output item randomly.
(Exploit) Otherwise, show the current-best algorithm.
Use Success Rate logs for Random output items to train new algorithms offline. Advanced policies for optimizing explore-exploit tradeoff (e.g., contextual bandits)

35
Practical Example: Contextual bandit recommendations on Yahoo! News Actions: Different news articles to displayA/B tests using all articles inefficient.
Randomize the articles shown using ɛ-greedy policy.Better: Use context of visit (user, browser, time, etc.) to have different current-best algorithms for different contexts. Li-Chu-Langford-Schapire
(2010)
36
May be infeasible, unethical or possibly bad experience for many usersExperiment to determine if becoming a subscriber makes you shop more. Experiment that shows different subscription price to different users to find price elasticity.Experiment that changes a familiar UI component.
Even when feasible, randomization methods need a limited set of "good" alternatives to test. • How do we identify a good set of algorithms or a good set of
parameters?
Need causal metrics.

37
What can we do with only observational data (such as log data)?

38
Can exploit naturally occurring close-to-random variation in data. Since data is not randomized, need assumptions about the data-generating process.If there is sufficient reason to believe the assumptions, we can estimate causal effects.
“Natural” experiments: exploit variation in observed data
Dunning (2002), Rosenzweig-Wolpin (2000)

39
Suppose instead of comparing recommendation algorithms, we want to estimate the causal effect of showing any algorithmic recommendation.
Can be used to create better metrics for evaluating any recommendation algorithm.
Study: Effect of Store recommendations

40
Can look at as-if random variations due to external events. E.g. Featuring on the Today show may lead to a sudden spike in installs for an app. Such external shocks can be used to determine the causal effect of showing recommendations.
A natural experiment: Instrumental Variables
Angrist-Pischke (2008)

41
Estimating the counterfactual
How many new visits are caused by the recommender system?Demand for App 1 is correlated with demand for App 2. Users would most likely have visited App 2 even without recommendations.
42
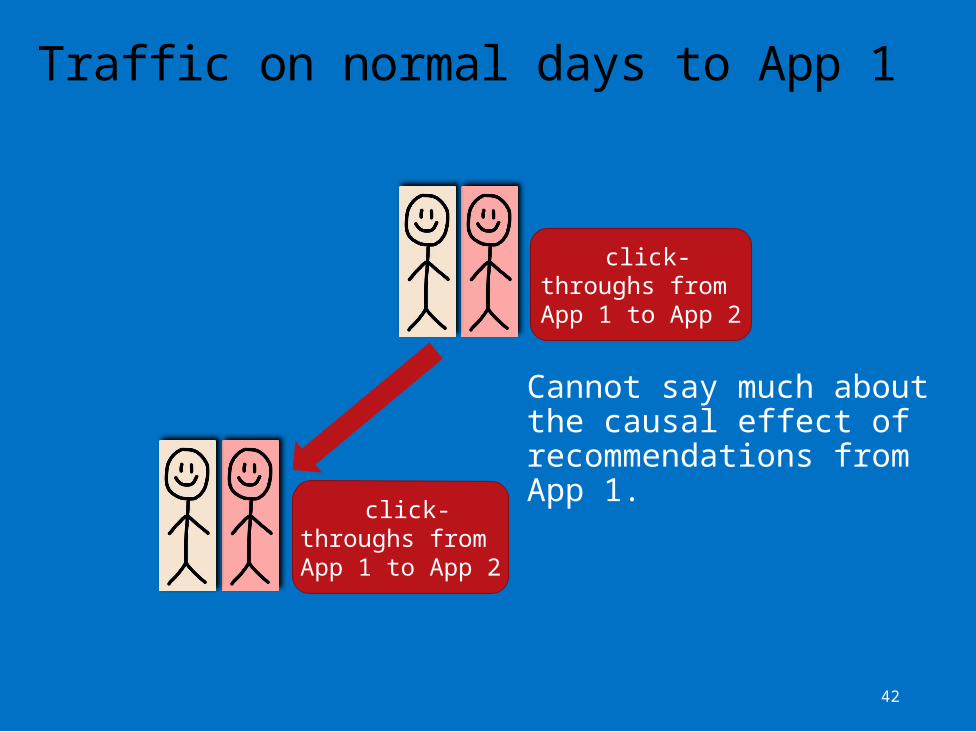
Traffic on normal days to App 1
click-throughs from
App 1 to App 2
click-throughs from
App 1 to App 2
Cannot say much about the causal effect of recommendations from App 1.

43
External shock brings as-if random users to App1
click-throughs from
App 1 to App 2
click-throughs from
App 1 to App 2
If demand for App 2 remains constant, additional views to App 2 would not have happened had these new users not visited App 1.
Spike
in
visits
to App
1
Sharma-Hofman-Watts (2015)

44
To compute Causal CTR of Visits to App1 on Visits to App2:• Compare observed effect of external event separately on
Visits to App1, and on Rec. Clicks to App2. • Causal click-through rate =
Exploiting sudden variation in traffic to App 1

45
Estimates may not be generalizable to all products.
Whenever possible, use randomization.If number of output items low, consider using contextual bandits.
If randomization is not feasible, consider exploiting natural experiments. Better to consider multiple sources of natural experiments.
Caveat: Natural experiments are hard to find

46
Methods for answering causal questions
RandomizationA/B testMulti-armed bandits
Natural Experiments Regression
discontinuityInstrumental Variables
ConditioningStratification,
MatchingPropensity Scores
EASE OF USEVA
LIDI
TY

47
Causal inference is tricky.Correlations are seldom enough. And sometimes horribly misleading.
Always be skeptical of causal claims from observational any data.More data does not automatically lead to better causal estimates. http://tylervigen.com/spurious-correlat
ions

© 2015 Microsoft Corporation. All rights reserved. © 2015 Microsoft Corporation. All rights reserved.
48
For more, check out a detailed tutorial on causal inference techniques:http://www.github.com/amit-sharma/causal-inference-tutorial
thank you!@[email protected]