Catfish Brochure (Page 1) - aquaflor-usa. · PDF fileEnvironmental Exposure Profile ... a...
36
Aquaflor ® T E C H N I C A L M O N O G R A P H FOR CATFISH HEALTH PROFESSIONALS FLORFENICOL S C H E R I N G - P L O U G H A N I M A L H E A L T H
Transcript of Catfish Brochure (Page 1) - aquaflor-usa. · PDF fileEnvironmental Exposure Profile ... a...
Aquaf lor®
T E C H N I C A L
M O N O G R A P H
F O R C A T F I S H H E A L T H P R O F E S S I O N A L S
F L O R F E N I C O L
S C H E R I N G - P L O U G H A N I M A L H E A L T H
AQUAFLOR® T E C H N I C A L M O N O G R A P H
AcknowledgementsSchering-Plough Animal Health Corporation would like to thank: The Aquatic
Animal Drug Approval Partnership Program (AADAP); Thad Cochran NationalWarmwater Aquaculture Center, Mississippi State University College of Veterinary Medicine;The National Coordinator for Aquaculture New Animal Drug Applications; The United States Fish and Wildlife Service; and The United States Geological Survey for their contributions to the development and registration of the Aquaflor® Type A MedicatedArticle in the United States.
Schering-Plough Animal Health Corporation would also like to thank The CatfishInstitute for use of their photos in this publicaton.
CONTENTS
1. Introduction . . . . . . . . . . . . . . . . . . . . . . . . . . . . . . . . . . . . . . . . . . . . . . . . . . . . . . . . . . . . . . . . . . . . . . . . . 1
Chemistry . . . . . . . . . . . . . . . . . . . . . . . . . . . . . . . . . . . . . . . . . . . . . . . . . . . . . . . . . . . . . . . . . . . . . . . . . . . . 3
Mode of Action . . . . . . . . . . . . . . . . . . . . . . . . . . . . . . . . . . . . . . . . . . . . . . . . . . . . . . . . . . . . . . . . . . . . . . 4
Dosage Form . . . . . . . . . . . . . . . . . . . . . . . . . . . . . . . . . . . . . . . . . . . . . . . . . . . . . . . . . . . . . . . . . . . . . . . . . 5
2. Pharmacokinetics . . . . . . . . . . . . . . . . . . . . . . . . . . . . . . . . . . . . . . . . . . . . . . . . . . . . . . . . . . . . . . . . . . 8
Studies in Fish . . . . . . . . . . . . . . . . . . . . . . . . . . . . . . . . . . . . . . . . . . . . . . . . . . . . . . . . . . . . . . . . . . . . . . . 8
3. Toxicology . . . . . . . . . . . . . . . . . . . . . . . . . . . . . . . . . . . . . . . . . . . . . . . . . . . . . . . . . . . . . . . . . . . . . . . . . . 10
Food Safety and Residues . . . . . . . . . . . . . . . . . . . . . . . . . . . . . . . . . . . . . . . . . . . . . . . . . . . . . . . . . . 10
• Maximum Residue Limit . . . . . . . . . . . . . . . . . . . . . . . . . . . . . . . . . . . . . . . . . . . . . . . . . . . . 10
• Residue Depletion Study . . . . . . . . . . . . . . . . . . . . . . . . . . . . . . . . . . . . . . . . . . . . . . . . . . . . 10
Safety Studies in Catfish . . . . . . . . . . . . . . . . . . . . . . . . . . . . . . . . . . . . . . . . . . . . . . . . . . . . . . . . . . . . . . 12
4. Efficacy . . . . . . . . . . . . . . . . . . . . . . . . . . . . . . . . . . . . . . . . . . . . . . . . . . . . . . . . . . . . . . . . . . . . . . . . . . . . . . 14
In vitro Susceptibility of E. ictaluri to Florfenicol . . . . . . . . . . . . . . . . . . . . . . . . . . . . . . . . . . 14
In vivo Efficacy . . . . . . . . . . . . . . . . . . . . . . . . . . . . . . . . . . . . . . . . . . . . . . . . . . . . . . . . . . . . . . . . . . . . . . 15
• Dose Titration Studies . . . . . . . . . . . . . . . . . . . . . . . . . . . . . . . . . . . . . . . . . . . . . . . . . . . . . . . 15
• Dose Confirmation Study . . . . . . . . . . . . . . . . . . . . . . . . . . . . . . . . . . . . . . . . . . . . . . . . . . . . 21
• Clinical Efficacy – Pond Trial . . . . . . . . . . . . . . . . . . . . . . . . . . . . . . . . . . . . . . . . . . . . . . . 23
5. Environment . . . . . . . . . . . . . . . . . . . . . . . . . . . . . . . . . . . . . . . . . . . . . . . . . . . . . . . . . . . . . . . . . . . . . . . 25
Environmental Exposure Profile . . . . . . . . . . . . . . . . . . . . . . . . . . . . . . . . . . . . . . . . . . . . . . . . . . . 25
Environmental Exposure Concentrations . . . . . . . . . . . . . . . . . . . . . . . . . . . . . . . . . . . . . . . . . 26
Environmental Safety . . . . . . . . . . . . . . . . . . . . . . . . . . . . . . . . . . . . . . . . . . . . . . . . . . . . . . . . . . . . . . 26
6. References . . . . . . . . . . . . . . . . . . . . . . . . . . . . . . . . . . . . . . . . . . . . . . . . . . . . . . . . . . . . . . . . . . . . . . . . . . 28

1 AQUAFLOR® T E C H N I C A L M O N O G R A P H
1IntroductionBacterial diseases represent some of the most significant challenges facing fish farmingworldwide. According to the 2000 United States Department of Agriculture NationalAnimal Health Monitoring System (USDA-NAHMS) report, bacterial diseases account for approximately 70% of all diseases affecting catfish (Ictalurus punctatus) in the southeastern US.1
The most important bacterial disease in commercial catfish aquaculture is enteric septicemia of catfish (ESC), a highly fatal systemic disease caused by infection withEdwardsiella ictaluri.2,3 Signs of E. ictaluri infection include inflammation through the
sutra fontanel of the skull (“hole in the head”);hemorrhages on the skin, fins, and/or gills; white spots or nodules on the skin and/or fins; oral hemorrhages; abdominal distention(ascites); and exophthalmia. Mortality rates in susceptible catfish can reach 100%; and in surviving fish, growth rates and weight gains may be significantly affected.4,5
Outbreaks of ESC typically occur in the spring and fall months, when water temperatures are 20° – 28°C and other conditions are optimal for growth of E. ictaluri.Husbandry and environmental stress play significant roles in determining the clinical and economic impact of E. ictaluri infections.
Nevertheless, this organism is considered a primary pathogen and is capable of causing substantial losses even on well-managed farms.
For successful treatment during an outbreak of ESC, the diagnosis must be made andtreatment with an effective antibiotic initiated while the majority of fish are still feeding.3
E. ictaluri is susceptible to a variety of antibiotics,6 but until recently only 2 antibacterialagents were approved for use in food fish: sulfadimethoxine-ormetoprim (Romet 30®)7 andoxytetracycline (Terramycin®).
Resistance to both of these antibiotics has been reported in fish.8-10 Inadequate intakeof medicated feed, whether from poor palatability (Romet)7 or inappropriate pellet type(oxytetracycline),5 has also contributed to the limited efficacy of these products. Clearly, amore palatable and efficacious oral antibiotic is needed for the treatment of ESC in catfish.
Catfish harvested
with seines.

2
Aquaflor® 50% Type A Medicated Article is a feed premix containing florfenicol, a broad-spectrum antibiotic. Florfenicol (FFC) has activity against a wide range of fishpathogens in vitro and in vivo, including E. ictaluri. Treatment with Aquaflor,® incorporatedinto floating catfish feed prior to pelleting and administered at a dose rate of 10 mg FFC/kgbody weight daily for 10 consecutive days, results in a rapid decline in mortality rates due toenteric septicemia of catfish associated with Edwardsiella ictaluri.
Key Characteristics of Aquaflor®:
• Highly palatable
• Administered in floating feed
• Well tolerated by catfish
• Highly effective against E. ictaluri infection
• Effective in a range of water temperatures favored by E. ictaluri
• Effective against multiple antibiotic-resistant organisms
• Minimal environmental effect
• Antibiotic developed exclusively for veterinary medicine
Florfenicol is a synthetically produced antibacterial agent that has been specificallydeveloped for veterinary use. It is a fluorinated analogue of thiamphenicol, a chloramphenicolanalogue, and these structural modifications confer advantages in activity, particularlyagainst bacteria resistant to thiamphenicol and chloramphenicol.11 Florfenicol is chemicallydifferent from chloramphenicol and lacks the functional group responsible for chloramphenicol’shuman toxicity concerns (bone marrow suppression and aplastic anemia).
Studies with florfenicol indicated potent activity against a number of bacterial fishpathogens in vitro and in a variety of fish species in vivo.12 Experimental efficacy has beendemonstrated against E. ictaluri in channel catfish, Photobacterium damselae subsp. piscicida(formerly Pasteurella piscicida) in yellowtail,13 Edwardsiella tarda in eels,12 Vibrio anguillarum ingoldfish,12 Aeromonas salmonicida, Vibrio salmonicida in Atlantic salmon,14 and Yersinia ruckeriand Flavobacterium psychrophilum in trout (data on file).
There is a limited number of products approved for treatment of bacterial disease infish, and antibacterial resistance to some of these products has already become widespread.8-10
Oral administration of antimicrobials is the preferred route of chemotherapy in finfish aquaculture due to the ease of use and lack of any additional stress to the fish during treatment. Reduction in appetite due to clinical disease can be addressed by higher feed inclusion rates of the medication.
Florfenicol was first approved for aquaculture use in Japan in 1990 for treatment of susceptible bacterial diseases, including pasteurellosis and streptococcosis in yellowtail, redsea bream, coho salmon, horse mackerel, rainbow trout, sweetfish, tilapia and eel. Since thenit has been approved for use in Atlantic salmon in Norway, Chile, Canada and in the U.K.Most recently Aquaflor® has been approved in the U.S. for control of mortality in catfishdue to enteric septicemia of catfish associated with Edwardsiella ictaluri.
Aquaflor® was developed by the Research Division of Schering-Plough Animal Health Corporation specifically to provide fish producers with a product that combineshighly effective control of susceptible bacterial diseases with safety for fish, palatability ease of administration and a different mode of action from other antibiotics.
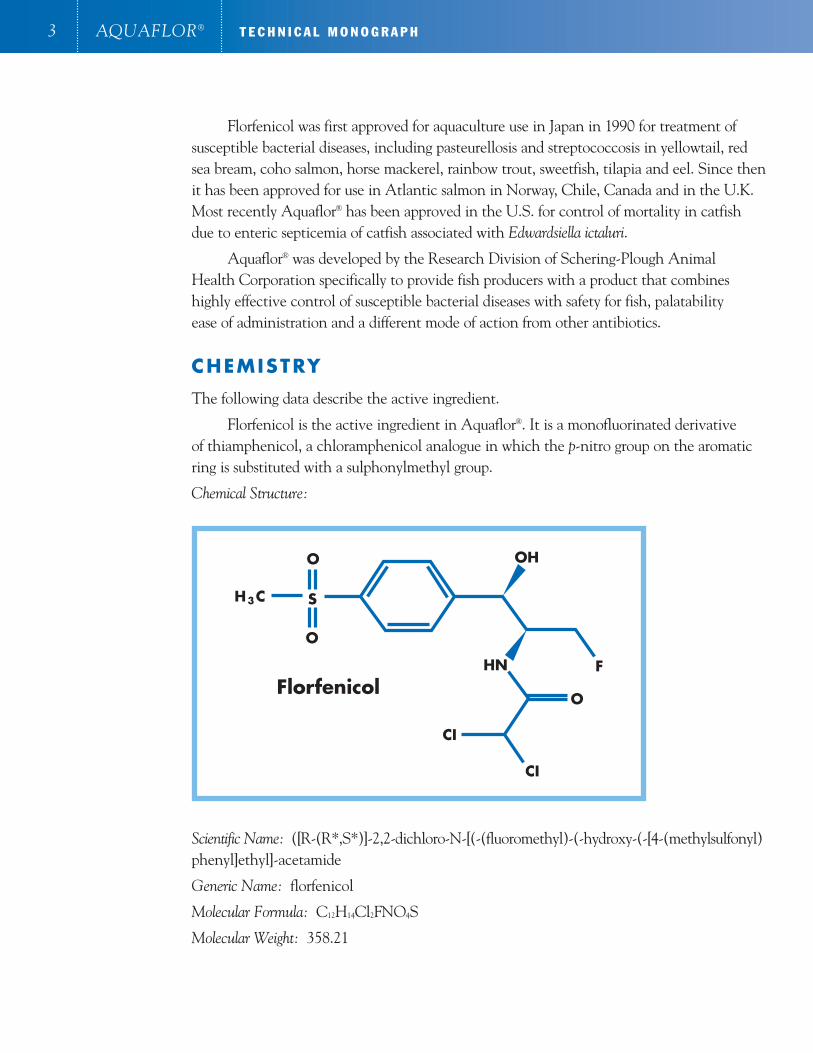
CHEMISTRY
The following data describe the active ingredient.
Florfenicol is the active ingredient in Aquaflor®. It is a monofluorinated derivative of thiamphenicol, a chloramphenicol analogue in which the p-nitro group on the aromatic ring is substituted with a sulphonylmethyl group.
Chemical Structure:
Scientific Name: ([R-(R*,S*)]-2,2-dichloro-N-[(-(fluoromethyl)-(-hydroxy-(-[4-(methylsulfonyl)phenyl]ethyl]-acetamide
Generic Name: florfenicol
Molecular Formula: C12H14Cl2FNO4S
Molecular Weight: 358.21
3 AQUAFLOR® T E C H N I C A L M O N O G R A P H

4
MODE OF ACTION
Florfenicol is a synthetic, broad-spectrum antibiotic active against many Gram-negative andGram-positive bacteria. Florfenicol acts by binding to the 50S ribosomal subunit, thereby preventing bacterial protein synthesis.11
In vitro activity has been demonstrated against commonly isolated bacterial fish pathogens including Edwardsiella ictaluri, Aeromonas salmonicida, Edwardsiella tarda,Flavobacterium psychrophilum, Photobacterium damselae subsp. piscicida, Vibrio anguillarum, V. salmonicida, other Vibrio spp., and Yersinia ruckeri (see Table 1-1).
Bacteria resistant to chloramphenicol, through chloramphenicol acetyltransferase production, are sensitive to florfenicol.11 In vitro tests with fish pathogens and a range ofchemotherapeutants, including chloramphenicol, streptomycin, tetracycline, ampicillin,trimethoprim, furazolidone, kanamycin, naladixic acid, amoxycillin, oxolinic acid and florfenicol, demonstrated that florfenicol had greater antibacterial activity than the othercompounds tested.13,15-17
Table 1-1 In vitro activity (Minimum Inhibitory Concentrations [MIC]) of florfenicol against some common fish pathogens
Organism No. of Isolates MIC Range (µg/mL)
Aeromonas salmonicida 98 0.25 – 1.612,15,16,18,19
Edwardsiella ictaluri 779 0.254,5,20
Edwardsiella tarda 52 0.4 – 1.612
Flavobacterium psychrophilum 48 0.001 – 1621
Photobacterium damselae 225 0.004 – 0.612,13
(formerly Pasteurella piscicida)
Vibrio anguillarum 151 0.2 – 0.812,17
Vibrio salmonicida 10 0.822
Vibrio spp. 3 1.2518
Yersinia ruckeri 5 0.6 – 1019

5 AQUAFLOR® T E C H N I C A L M O N O G R A P H
DOSAGE FORM
Premix: Aquaflor® is a 50% (w/w) Type A Medicated Article for inclusion into fish feed.The composition is 50% florfenicol and 50% inert carriers. Aquaflor® is:
• Supplied in 2-kg (4.4 lb) foil packages, with eight 2-kg packages in a fiber drum
• Has a shelf-life of 3 years
Medicated Feed Production (see label for explanation):
• The product should be mixed in unmedicated fish feed prior to pelleting
• It should be administered in feed to deliver 10 mg florfenicol per kg body weightdaily (See Table 1-2 for recommended Aquaflor® feed inclusion rate).
Dose Rate:
• Recommended dose rate is 10 mg of florfenicol/kg body weight/day for 10 consecutive days
Table 1-2 Recommended Aquaflor® 50% Type A Medicated Article Inclusion Rates for Preparation of Type C Medicated Feed
Feeding Rate Florfenicol Amount of Aquaflor® Biomass of Fish Medicated Concentration Type A Medicated Article per Ton of Feed per 10-day
in Feed per Ton of Feed Treatment Period
(% of biomass) grams/ton lbs lbs
0.5% 1,816 8.00 40,000
1.0% 908 4.00 20,000
2.0% 454 2.00 10,000
3.0% 300 1.32 6,666
5.0% 182 0.80 4,000
Feeding Directions: Aquaflor® Type C medicated feed should only be administered once the disease associated with Edwardsiella ictaluri has been appropriately diagnosed. Feeding fish at a percent of biomass and corresponding florfenicol concentration included in the tableabove will deliver 10 mg florfenicol per kg of fish.

VETERINARY FEED DIRECT IVE DRUG
Aquaflor® Type A Medicated Article is a Veterinary Feed Directive (VFD) drug.
Please note the following cautionary information for sale and use of Aquaflor Type A Medicated Article: Federal law limits this drug to use under the professional supervision of a licensed veterinarian. Animal feed bearing or containing this veterinary feed directive drug shall be fed to animals only by or upon a lawful veterinary feed directive issued by alicensed veterinarian in the course of the veterinarian’s professional practice.
Extra-label use (i.e., use of this VFD feed in a manner other than as provided for theVFD drug approval) is strictly prohibited.
Feed containing Aquaflor® (florfenicol) should not be fed to catfish for more than 10 days. Following administration, fish should be re-evaluated by a licensed veterinarianbefore initiating further therapy. The expiration date for a VFD for Aquaflor® (florfenicol)must not exceed 15 days from the date of issuance. VFDs for Aquaflor® (florfenicol) shouldnot be refilled.
6
7 AQUAFLOR® T E C H N I C A L M O N O G R A P H
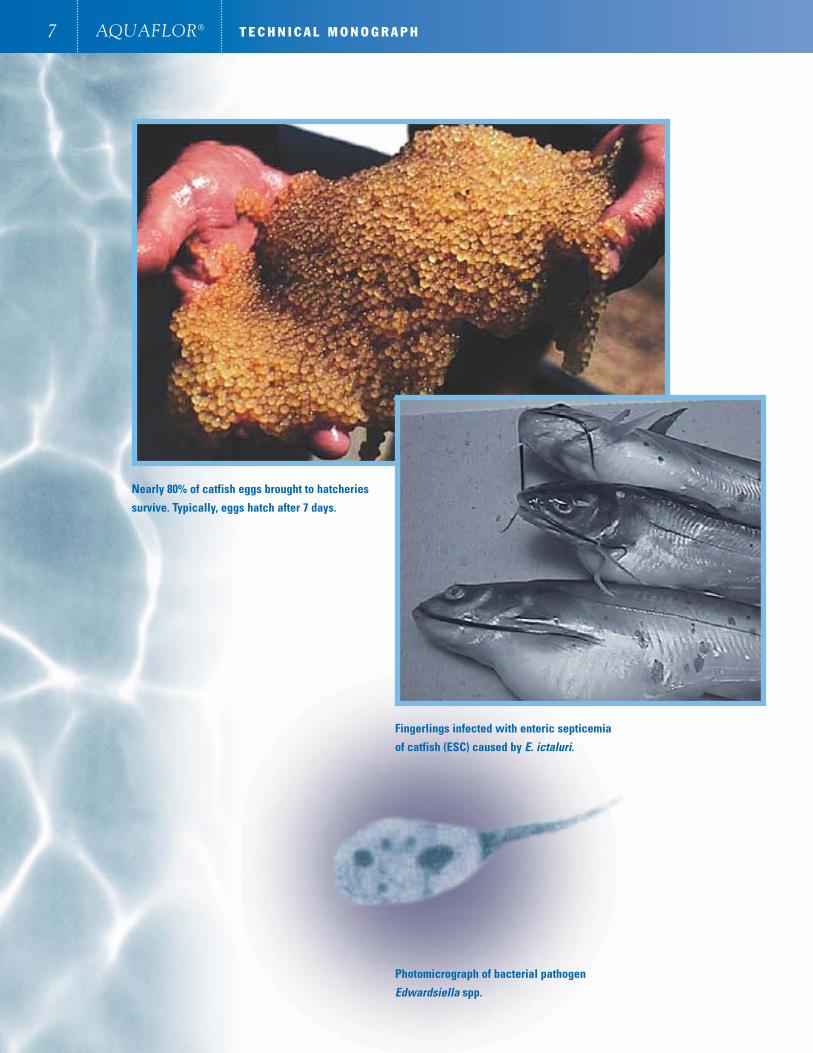
Nearly 80% of catfish eggs brought to hatcheries
survive. Typically, eggs hatch after 7 days.
Fingerlings infected with enteric septicemia
of catfish (ESC) caused by E. ictaluri.
Photomicrograph of bacterial pathogen
Edwardsiella spp.
8
While the pharmacokinetics of florfenicol have not been studied in catfish, the absorption, distribution, metabolism and excretion of florfenicol have been studied innumerous other species, including cattle, pigs, Muscovy ducks, broiler chickens, horses, rainbow trout and Atlantic salmon (in freshwater and seawater).23-31 Conclusions from these studies were consistent for all species: florfenicol is well absorbed, and excreted in bile, feces and urine.
STUDIES IN F ISH
Atlantic salmon (Salmo salar) were used in a number of studies to determine the fate of florfenicol in fish; one study was a whole body autoradiography study with salmon in seawater at 8° – 11°C29; other studies were radiolabeled residue depletion studies conductedwith salmon in seawater at 5°C and 10°C. Results from the whole body autoradiographystudy indicated that florfenicol had the following properties:
• Rapidly absorbed from the intestinal tract and transferred to other tissues
• Widely distributed to tissues, with maximum levels found at 12 hours after the end of treatment with similar concentrations in blood and muscle, but lower levels in fatand brain
• Maximum levels of florfenicol achieved in the muscle exceeded the MinimumInhibitory Concentration (MIC) values reported for most fish pathogenic bacteria29
In radiolabeled residue depletion studies, salmon received either a single dose of feed containing radiolabeled florfenicol or 9 days of florfenicol-medicated feed and 1 day of feed containing radiolabeled florfenicol at 10 mg/kg body weight. Results showed that:
• Maximum radioactivity concentrations in all tissues occurred within 6 – 24 hours after final dose delivery, and the highest levels were observed in the kidneys and liver
• Tissue radioactivity declined faster at 10°C than at 5°C, indicating that florfenicol is cleared from tissues faster at higher temperatures
• Residue concentrations were lower in muscle than in skin and depleted somewhatfaster from muscle than from skin29
2Pharmacokinetics

9 AQUAFLOR® T E C H N I C A L M O N O G R A P H
Nearly 90% of U.S. farm-raised catfish are produced in ponds located within the states of Alabama,
Arkansas, Louisiana and Mississippi. The typical pond covers 10 – 20 acres and is 4 – 6 feet deep.

10
A complete toxicological evaluation has been conducted with florfenicol. This includesextensive published and unpublished studies in the mouse, rat, cattle, dog, swine, poultry,rainbow trout, salmon and bluegill sunfish.32,33 From studies with florfenicol on reproductionin rats, a No Observable Effect Level (NOEL) of 1.0 mg/kg has been established.
FOOD SAFETY AND RESIDUES
The metabolism of florfenicol in fish is qualitatively similar to the metabolism in the rat. With a safety factor of 100, an acceptable daily intake (ADI) has been calculated at 10 µg/kg/day. Thus, based on toxicological assessment, an ADI of 10 µg/kg/day has been set for florfenicol and its metabolites in fish tissues.
Maximum Residue Limit or Safe Concentration
An HPLC assay based on the quantitative conversion of florfenicol and its metabolites toflorfenicol amine has been validated in fish tissues (muscle, skin, and muscle with attachedskin).34 The Maximum Residue Limit (MRL) or equivalent Safe Concentration is based on the marker residue, florfenicol amine. The US has established a Safe Concentration for florfenicol amine in catfish edible tissue (muscle) of 1.0 mg/kg.
Residue Depletion Study in Catfish
The accepted Safe Concentration of florfenicol amine is 1 ppm in catfish muscle. As the following data show, florfenicol amine residues in catfish muscle are well below this levelwithin 7 days after concluding treatment with florfenicol (FFC) at the recommended doserate of 10 mg FFC/kg body weight/day for 10 consecutive days.
Purpose: A study was conducted in market-weight catfish, raised under field conditions, inorder to determine marker residue concentrations in edible catfish tissue (muscle) followingtreatment and, thus, to establish a withdrawal period for FFC in catfish.
Study Design: Market-weight catfish (average weight 2 lb at the start of the study period)were kept in a 0.1-acre test pond under normal aquaculture conditions at a stocking density of 7,000 fish/acre. Medicated, pelleted fish feed was fed for 12 consecutive days* at a nominal dose rate of 10 mg/kg (actual measured dose rate = 9.3 mg/kg body weight/day).The fish were then fed unmedicated feed for the remainder of the study period. The watertemperature remained below 25°C throughout the study, with average daily high and lowwater temperatures during treatment being 21.9°C and 19.4°C, respectively.
*Cold weather reduced initial feed intake for 2 days, so the feeding period was extended to 12 days.
3Toxicology
11 AQUAFLOR® T E C H N I C A L M O N O G R A P H
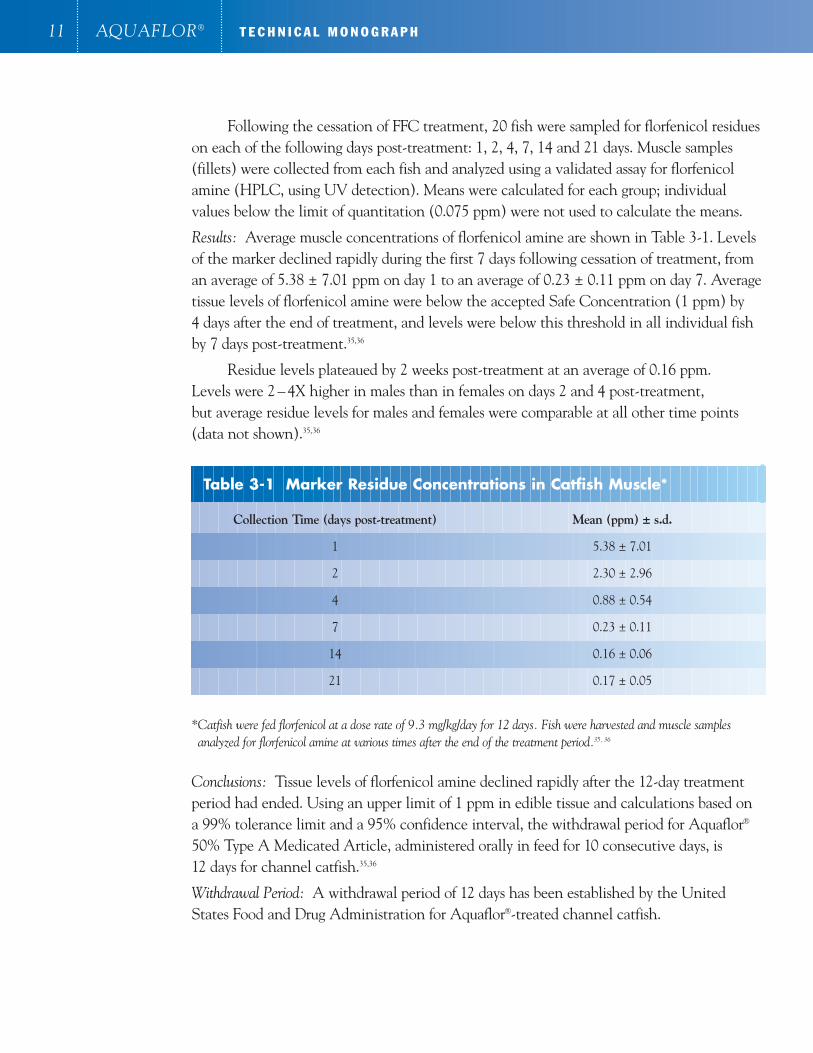
Following the cessation of FFC treatment, 20 fish were sampled for florfenicol residueson each of the following days post-treatment: 1, 2, 4, 7, 14 and 21 days. Muscle samples (fillets) were collected from each fish and analyzed using a validated assay for florfenicolamine (HPLC, using UV detection). Means were calculated for each group; individual values below the limit of quantitation (0.075 ppm) were not used to calculate the means.
Results: Average muscle concentrations of florfenicol amine are shown in Table 3-1. Levelsof the marker declined rapidly during the first 7 days following cessation of treatment, froman average of 5.38 ± 7.01 ppm on day 1 to an average of 0.23 ± 0.11 ppm on day 7. Averagetissue levels of florfenicol amine were below the accepted Safe Concentration (1 ppm) by 4 days after the end of treatment, and levels were below this threshold in all individual fishby 7 days post-treatment.35,36
Residue levels plateaued by 2 weeks post-treatment at an average of 0.16 ppm. Levels were 2 – 4X higher in males than in females on days 2 and 4 post-treatment, but average residue levels for males and females were comparable at all other time points(data not shown).35,36
*Catfish were fed florfenicol at a dose rate of 9.3 mg/kg/day for 12 days. Fish were harvested and muscle samples analyzed for florfenicol amine at various times after the end of the treatment period.35, 36
Conclusions: Tissue levels of florfenicol amine declined rapidly after the 12-day treatmentperiod had ended. Using an upper limit of 1 ppm in edible tissue and calculations based on a 99% tolerance limit and a 95% confidence interval, the withdrawal period for Aquaflor®
50% Type A Medicated Article, administered orally in feed for 10 consecutive days, is 12 days for channel catfish.35,36
Withdrawal Period: A withdrawal period of 12 days has been established by the UnitedStates Food and Drug Administration for Aquaflor®-treated channel catfish.
Table 3-1 Marker Residue Concentrations in Catfish Muscle*
Collection Time (days post-treatment) Mean (ppm) ± s.d.
1 5.38 ± 7.01
2 2.30 ± 2.96
4 0.88 ± 0.54
7 0.23 ± 0.11
14 0.16 ± 0.06
21 0.17 ± 0.05
12
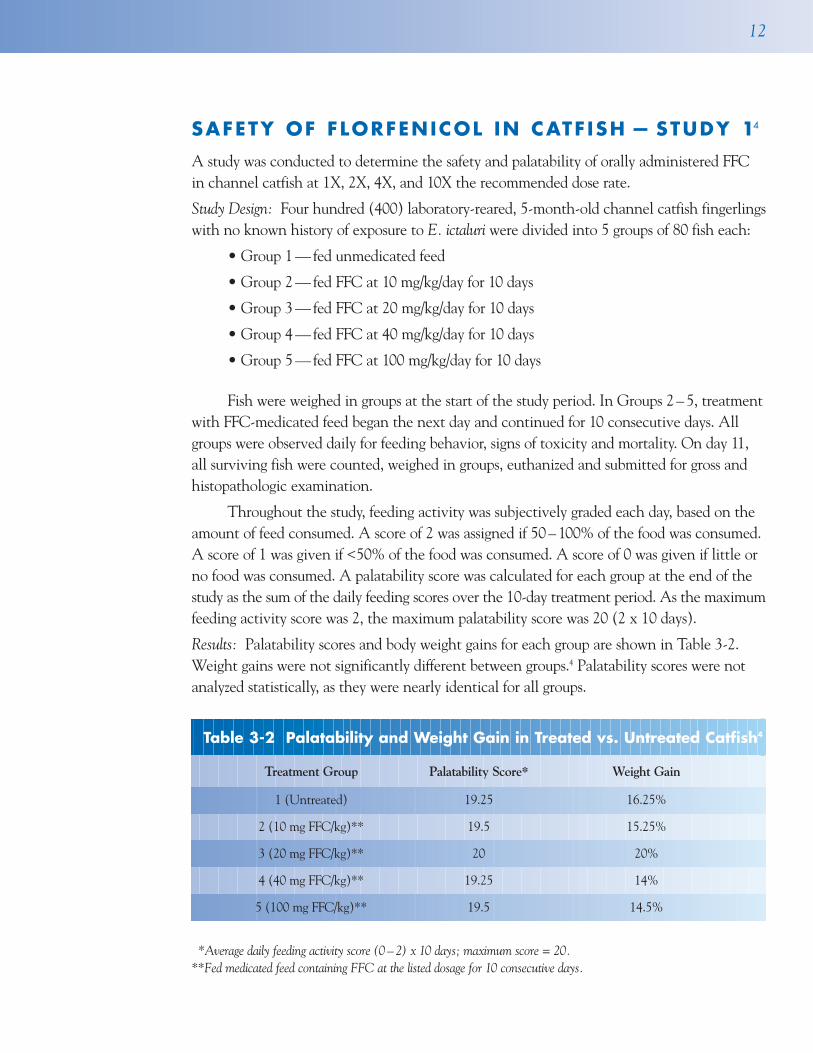
SAFETY OF FLORFENICOL IN CATF ISH — STUDY 14
A study was conducted to determine the safety and palatability of orally administered FFCin channel catfish at 1X, 2X, 4X, and 10X the recommended dose rate.
Study Design: Four hundred (400) laboratory-reared, 5-month-old channel catfish fingerlingswith no known history of exposure to E. ictaluri were divided into 5 groups of 80 fish each:
• Group 1 — fed unmedicated feed
• Group 2 — fed FFC at 10 mg/kg/day for 10 days
• Group 3 — fed FFC at 20 mg/kg/day for 10 days
• Group 4 — fed FFC at 40 mg/kg/day for 10 days
• Group 5 — fed FFC at 100 mg/kg/day for 10 days
Fish were weighed in groups at the start of the study period. In Groups 2 – 5, treatment with FFC-medicated feed began the next day and continued for 10 consecutive days. Allgroups were observed daily for feeding behavior, signs of toxicity and mortality. On day 11,all surviving fish were counted, weighed in groups, euthanized and submitted for gross andhistopathologic examination.
Throughout the study, feeding activity was subjectively graded each day, based on theamount of feed consumed. A score of 2 was assigned if 50 – 100% of the food was consumed.A score of 1 was given if <50% of the food was consumed. A score of 0 was given if little orno food was consumed. A palatability score was calculated for each group at the end of thestudy as the sum of the daily feeding scores over the 10-day treatment period. As the maximumfeeding activity score was 2, the maximum palatability score was 20 (2 x 10 days).
Results: Palatability scores and body weight gains for each group are shown in Table 3-2.Weight gains were not significantly different between groups.4 Palatability scores were notanalyzed statistically, as they were nearly identical for all groups.
Table 3-2 Palatability and Weight Gain in Treated vs. Untreated Catfish4
Treatment Group Palatability Score* Weight Gain
1 (Untreated) 19.25 16.25%
2 (10 mg FFC/kg)** 19.5 15.25%
3 (20 mg FFC/kg)** 20 20%
4 (40 mg FFC/kg)** 19.25 14%
5 (100 mg FFC/kg)** 19.5 14.5%
*Average daily feeding activity score (0 – 2) x 10 days; maximum score = 20.**Fed medicated feed containing FFC at the listed dosage for 10 consecutive days.
13 AQUAFLOR® T E C H N I C A L M O N O G R A P H
No fish died and no signs of morbidity were noted during the study period. Only 6/400 fish (1.5%) examined at necropsy had gross pathologic lesions. Lesions were mild in all 6 fish, consisting only of mild mottling of the liver (3 fish in the 10 mg/kg FFC groupand 1 control fish) or spleen (2 fish in the 20 mg/kg FFC group and 1 fish in the 10 mg/kgFFC group). There were no differences in the histologic appearance of the organs in treatedversus untreated fish.4
Conclusions: Florfenicol, administered at up to 10X the recommended daily dose rate of 10 mg/kg body weight for 10 consecutive days, was palatable to channel catfish fingerlingsand did not cause any treatment-related pathology.
SAFETY OF FLORFENICOL IN CATF ISH — STUDY 237
The following study was conducted to determine the safety and palatability of orally administered FFC in channel catfish at 1X, 3X, and 5X the recommended dose rate for 2X the recommended treatment duration.
Study Design: A total of 240 laboratory-reared channel catfish fingerlings (mean weight 14.7 ± 3.8 g) were divided into 4 groups:
• Group 1 — fed unmedicated feed
• Group 2 — fed FFC at 10 mg/kg/day for 20 days
• Group 3 — fed FFC at 30 mg/kg/day for 20 days
• Group 4 — fed FFC at 50 mg/kg/day for 20 days
Fish were fed either unmedicated feed (Group 1) or medicated feed (Groups 2 – 4) for 20 consecutive days. During that time, all groups were monitored for feeding activity, morbidity and mortality. At the end of the treatment period, all surviving fish were weighed,euthanized, necropsied, and their tissues were examined histopathologically.
Results: No fish died and no signs of morbidity were noted during the study period. Nochanges in behavior were detected in treated fish relative to the controls. Although feedconsumption declined in the latter part of the dosing period at the 30 mg/kg and 50 mg/kgdose rates, there were no significant differences in body weight at the terminal sampling.37
No differences between groups were observed at gross necropsy. A very mild, dose-dependent decrease in hematopoietic/lymphopoietic tissue was observed microscopically inthe kidneys and spleens of treated fish. No other histopathologic changes were noted.37
Conclusions: No significant changes attributable to FFC treatment were observed, even at 5X the recommended dose rate for 2X the recommended duration of treatment. Thus,FFC is considered safe for administration to channel catfish at the recommended dose rate of 10 mg FFC/kg/day for 10 consecutive days.

14
Overview: Aquaflor® 50% Type A Medicated Article is recommended for the control ofmortality in catfish due to enteric septicemia of catfish associated with Edwardsiella ictaluri. Aquaflor® is administered in feed at an oral dose rate of 10 mg FFC/kg body weight/day for 10 consecutive days. The efficacy of Aquaflor® and the validity of this dose regimen is supported by several studies, including in vitro sensitivity data on E. ictaluri and in vivochallenge studies. These studies show the following:
• Aquaflor®-medicated feed is safe in channel catfish at the recommended dose rate
• Aquaflor®-medicated feed is palatable to channel catfish
• Aquaflor® is highly effective in the control of mortality in channel catfish caused by pathogenic strains of E. ictaluri
IN VITRO SUSCEPT IB IL ITY OF E . ICTALURITO FLORFENICOL
The following study demonstrates the in vitro susceptibility of E. ictaluri to florfenicol.
Study Design: Twelve (12) field isolates of E. ictaluri, obtained during natural outbreaks ofESC in commercial catfish ponds in Mississippi, were tested. An additional 767 cultures ofE. ictaluri, obtained from channel catfish experimentally infected with E. ictaluri, were alsotested. Agar disk diffusion susceptibilty testing was performed as outlined in the NationalCommittee for Clinical Laboratory Standards (NCCLS) performance standards guidelines.
Results: Kirby-Bauer zones of inhibition and MIC values for natural and experimental infections are shown in Table 4-1.20
4Efficacy
Table 4-1 In vitro Susceptibility of E. ictaluri to Florfenicol20
Source Kirby-Bauer Zone of Minimum Inhibitory Inhibition Mean (Range) Concentration (µg/mL)
Natural outbreak 46.5 mm (41 – 51 mm) 0.25
Experimental infection 35.3 mm (31 – 50 mm) 0.25

15 AQUAFLOR® T E C H N I C A L M O N O G R A P H
Conclusions: All tested strains of E. ictaluri were highly susceptible to FFC in vitro.Parameters for the zone of inhibition for FFC against E. ictaluri are not formally established.Using preliminary interpretive standards for FFC in cattle, a zone of inhibition >19 mmindicates that the organism is sensitive.20 The zones of inhibition for all isolates of E. ictaluriin this study were >30 mm. Thus, it can be concluded that E. ictaluri is highly susceptible toFFC. The low MIC value for all tested isolates (0.25 µg/mL) supports this conclusion.
IN VIVO EFF ICACY
The following 4 studies confirm the in vivo efficacy of Aquaflor®-medicated feed at the recommended dose rate in channel catfish exposed to pathogenic strains of E. ictaluri.
Dose Titration — Study 1
The following dose titration study was conducted to confirm the safety, palatability and efficacy of FFC-medicated feed and to determine the optimal dose rate in channel catfishexposed to a pathogenic strain of E. ictaluri.
Study Design: Four hundred (400) laboratory-reared, 5-month-old channel catfish fingerlings with no known history of exposure to E. ictaluri were divided into 5 groups of 80 fish:
• Group 1— not challenged with E. ictaluri and fed unmedicated feed
• Group 2 — challenged with E. ictaluri and fed unmedicated feed
• Group 3 — challenged and fed FFC at 10 mg/kg/day for 5 days
• Group 4 — challenged and fed FFC at 20 mg/kg/day for 5 days
• Group 5 — challenged and fed FFC at 40 mg/kg/day for 5 days
Fish were weighed in groups and then exposed for 2 hours to approximately 4.3 x 10⁶ CFU/mL of a confirmed pathogenic isolate of E. ictaluri, obtained from a naturaloutbreak of ESC. Treatment with FFC-medicated feed began in Groups 3 – 5 the day afterexposure and continued for 5 consecutive days. All surviving fish were then observed for an additional 17 days, during which time all groups were fed an unmedicated ration.
Throughout the study, feeding activity was subjectively graded each day, based on theamount of feed consumed. A score of 2 was assigned if 50 – 100% of the food was consumed.A score of 1 was given if <50% of the food was consumed. A score of 0 was given if little orno food was consumed.
The fish were also monitored daily for abnormal behavior indicative of morbidity (e.g., lethargy, abnormal swimming patterns) and for adverse events, such as piping at thewater surface or unexpected deaths.
Any fish that died during the study were necropsied and bacterial culture of E. ictaluri was attempted. At the end of the study period (day 23), all surviving fish were counted, weighed in groups, euthanized and submitted for microbiologic andhistopathologic examination.
16
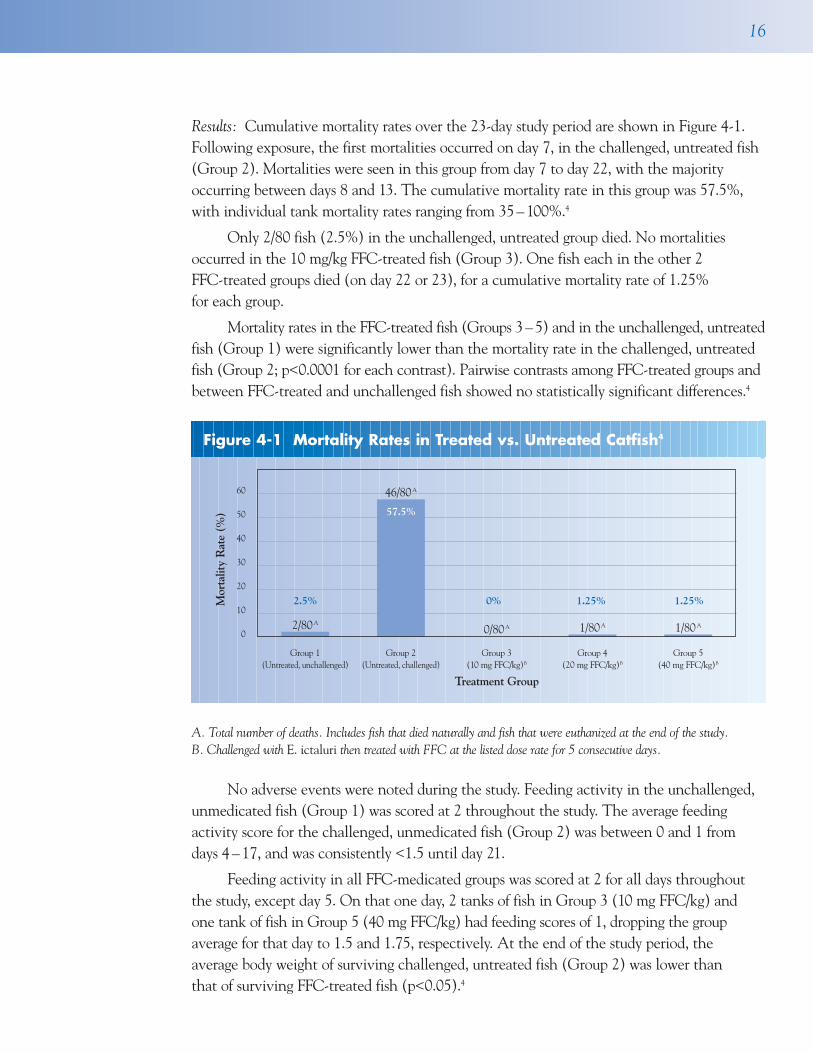
Results: Cumulative mortality rates over the 23-day study period are shown in Figure 4-1.Following exposure, the first mortalities occurred on day 7, in the challenged, untreated fish(Group 2). Mortalities were seen in this group from day 7 to day 22, with the majorityoccurring between days 8 and 13. The cumulative mortality rate in this group was 57.5%,with individual tank mortality rates ranging from 35 – 100%.4
Only 2/80 fish (2.5%) in the unchallenged, untreated group died. No mortalitiesoccurred in the 10 mg/kg FFC-treated fish (Group 3). One fish each in the other 2 FFC-treated groups died (on day 22 or 23), for a cumulative mortality rate of 1.25% for each group.
Mortality rates in the FFC-treated fish (Groups 3–5) and in the unchallenged, untreatedfish (Group 1) were significantly lower than the mortality rate in the challenged, untreatedfish (Group 2; p<0.0001 for each contrast). Pairwise contrasts among FFC-treated groups andbetween FFC-treated and unchallenged fish showed no statistically significant differences.4
A. Total number of deaths. Includes fish that died naturally and fish that were euthanized at the end of the study.B. Challenged with E. ictaluri then treated with FFC at the listed dose rate for 5 consecutive days.
No adverse events were noted during the study. Feeding activity in the unchallenged,unmedicated fish (Group 1) was scored at 2 throughout the study. The average feedingactivity score for the challenged, unmedicated fish (Group 2) was between 0 and 1 fromdays 4 – 17, and was consistently <1.5 until day 21.
Feeding activity in all FFC-medicated groups was scored at 2 for all days throughoutthe study, except day 5. On that one day, 2 tanks of fish in Group 3 (10 mg FFC/kg) and one tank of fish in Group 5 (40 mg FFC/kg) had feeding scores of 1, dropping the group average for that day to 1.5 and 1.75, respectively. At the end of the study period, the average body weight of surviving challenged, untreated fish (Group 2) was lower than that of surviving FFC-treated fish (p<0.05).4
Figure 4-1 Mortality Rates in Treated vs. Untreated Catfish4
Group 1 Group 2 Group 3 Group 4 Group 5(Untreated, unchallenged) (Untreated, challenged) (10 mg FFC/kg)B (20 mg FFC/kg)B (40 mg FFC/kg)B
Treatment Group
60
50
40
30
20
10
0
Mor
talit
y R
ate
(%)
46/80A
2/80A
2.5%
57.5%
0% 1.25% 1.25%
0/80A 1/80A 1/80A
17 AQUAFLOR® T E C H N I C A L M O N O G R A P H
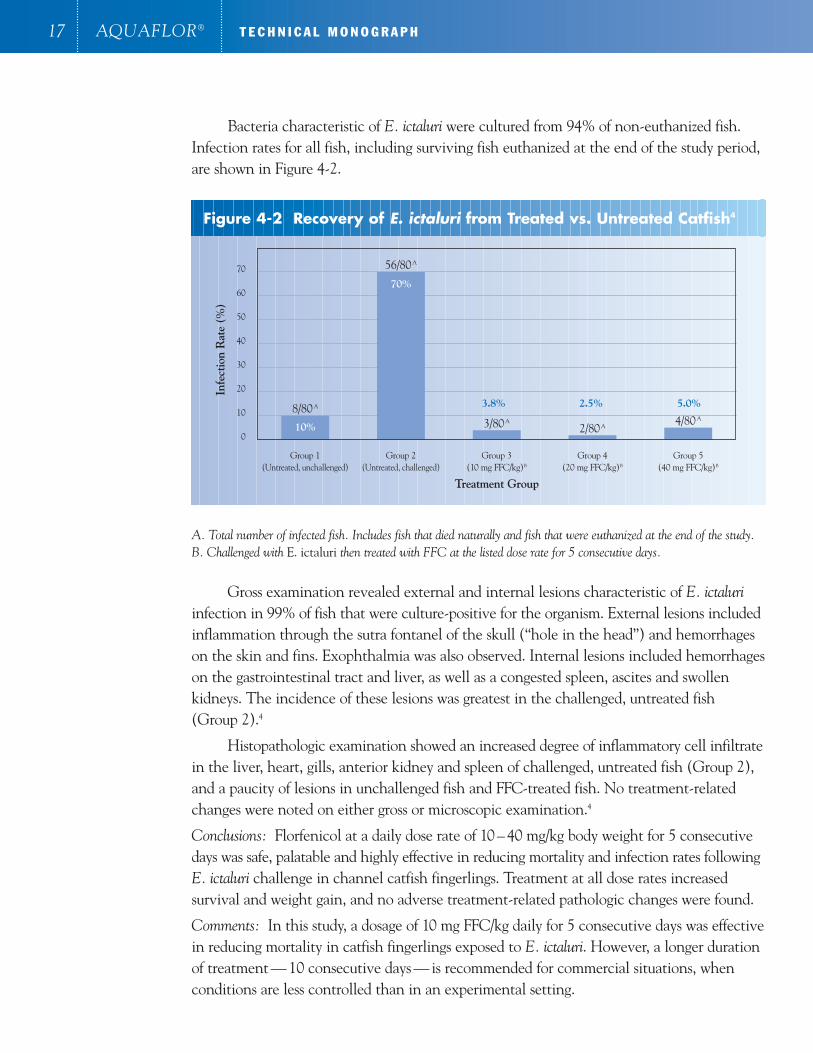
Bacteria characteristic of E. ictaluri were cultured from 94% of non-euthanized fish.Infection rates for all fish, including surviving fish euthanized at the end of the study period,are shown in Figure 4-2.
A. Total number of infected fish. Includes fish that died naturally and fish that were euthanized at the end of the study.B. Challenged with E. ictaluri then treated with FFC at the listed dose rate for 5 consecutive days.
Gross examination revealed external and internal lesions characteristic of E. ictaluriinfection in 99% of fish that were culture-positive for the organism. External lesions includedinflammation through the sutra fontanel of the skull (“hole in the head”) and hemorrhageson the skin and fins. Exophthalmia was also observed. Internal lesions included hemorrhageson the gastrointestinal tract and liver, as well as a congested spleen, ascites and swollen kidneys. The incidence of these lesions was greatest in the challenged, untreated fish (Group 2).4
Histopathologic examination showed an increased degree of inflammatory cell infiltratein the liver, heart, gills, anterior kidney and spleen of challenged, untreated fish (Group 2),and a paucity of lesions in unchallenged fish and FFC-treated fish. No treatment-relatedchanges were noted on either gross or microscopic examination.4
Conclusions: Florfenicol at a daily dose rate of 10 – 40 mg/kg body weight for 5 consecutivedays was safe, palatable and highly effective in reducing mortality and infection rates followingE. ictaluri challenge in channel catfish fingerlings. Treatment at all dose rates increased survival and weight gain, and no adverse treatment-related pathologic changes were found.
Comments: In this study, a dosage of 10 mg FFC/kg daily for 5 consecutive days was effective in reducing mortality in catfish fingerlings exposed to E. ictaluri. However, a longer durationof treatment — 10 consecutive days — is recommended for commercial situations, whenconditions are less controlled than in an experimental setting.
Figure 4-2 Recovery of E. ictaluri from Treated vs. Untreated Catfish4
Group 1 Group 2 Group 3 Group 4 Group 5(Untreated, unchallenged) (Untreated, challenged) (10 mg FFC/kg)B (20 mg FFC/kg)B (40 mg FFC/kg)B
Treatment Group
70
60
50
40
30
20
10
0
Infe
ctio
n R
ate
(%)
56/80A
8/80A
3/80A
2/80A 4/80A
10%
70%
3.8% 2.5% 5.0%

18
Dose Titration — Study 2
The following dose titration study was conducted to assess the safety, palatability, and efficacy of Aquaflor®-medicated feed and to determine the optimal dose rate in channel cat-fish exposed to a pathogenic strain of E. ictaluri.
Study Design: Six hundred (600) laboratory-reared, 4- to 5-month-old channel catfish fingerlings with no known history of exposure to E. ictaluri were divided into 5 groups of 120 fish:
• Group 1 — not challenged with E. ictaluri and fed unmedicated feed
• Group 2 — challenged with E. ictaluri and fed unmedicated feed
• Group 3 — challenged and fed Aquaflor® at 5 mg FFC/kg/day for 10 days
• Group 4 — challenged and fed Aquaflor® at 10 mg FFC/kg/day for 10 days
• Group 5 — challenged and fed Aquaflor® at 15 mg FFC/kg/day for 10 days
Sera from 50 additional fish from the same source were evaluated using a modifiedagglutination assay and found to be negative for antibodies to E. ictaluri.
The study fish were weighed in groups and then exposed by immersion for 2 hours to approximately 8.8 x 10⁵ colony-forming units (CFU)/mL of a confirmed pathogenic isolate of E. ictaluri, obtained from a natural outbreak of ESC. Treatment with Aquaflor®-medicated feed began in Groups 3 – 5 the day after exposure and continued for 10 consecutive days. All surviving fish were then observed for an additional 14 days, duringwhich time all groups were fed an unmedicated ration.
Throughout the study, feeding activity was subjectively graded each day, based on theamount of feed consumed. A score of 2 was assigned if 50 – 100% of the food was consumed.A score of 1 was given if <50% of the food was consumed. A score of 0 was given if little orno food was consumed.
The fish were also monitored daily for abnormal behavior indicative of morbidity (e.g., lethargy, abnormal swimming patterns) and for adverse events, such as piping at thewater surface or unexpected deaths.
Any fish that died during the study were necropsied and isolation of E. ictaluri wasattempted. At the end of the study period (day 25), all surviving fish were counted, weighedin groups, euthanized and submitted for microbiologic and pathologic examination.
Results: Cumulative mortality rates over the 24-day observation period are shown in Figure 4-3. Following exposure, the first mortalities occurred on day 5, in the challenged,unmedicated fish (Group 2). Mortalities were seen in this group from day 5 to day 18, withthe majority occurring on days 6 – 8. The cumulative mortality rate in this group was 60%,with individual tank mortality rates ranging from 45 – 85%.5 One of the unchallenged,unmedicated fish (Group 1) died.

19 AQUAFLOR® T E C H N I C A L M O N O G R A P H
Only 9/360 fish in the Aquaflor®-treated groups died (Figure 4-3). Mortality rates inthe Aquaflor®-treated fish (Groups 3 – 5) and in the unchallenged, untreated fish (Group 1)were significantly lower than the mortality rate in the challenged, untreated fish (Group 2;p<0.0001 for each contrast). There were no statistically significant differences in mortalityrate between Aquaflor®-treated groups or between Aquaflor®-treated and unchallenged fish.5
A. Total number of deaths. Includes fish that died naturally and fish that were euthanized at the end of the study.B. Challenged with E. ictaluri then treated with FFC at the listed dose rate for 10 consecutive days.
No adverse events were noted during the study. Feeding activity in the unchallenged,unmedicated fish (Group 1) was scored at 2 throughout the study. The average feedingactivity score for the challenged, unmedicated fish (Group 2) ranged from 0.33 to 1.67 fromDay 3 to 13. From Day 3 onward, the average feeding score did not return to 2 with theexception of Day 23.
Feeding activity in all Aquaflor®-medicated groups was scored at 2 for all days throughout the study, except day 18, in which one of the tanks in Group 5 (15 mg FFC/kg)had a feeding activity score of 1, dropping the average score for Group 5 on day 19 to 1.83.
Bacteria characteristic of E. ictaluri were cultured from 100% of fish that died naturallyduring the study period. Infection rates for all fish, including surviving fish euthanized at theend of the study period, are shown in Figure 4-4.
Figure 4-3 Mortality Rates in Treated vs. Untreated Catfish5
Group 1 Group 2 Group 3 Group 4 Group 5(Untreated, unchallenged) (Untreated, challenged) (5 mg FFC/kg)B (10 mg FFC/kg)B (15 mg FFC/kg)B
Treatment Group
60
50
40
30
20
10
01/120A 3/120A
72/120A
1/120A
Mor
talit
y R
ate
(%)
0.8%
60%
4.2%0.8% 2.5%
5/120A

20
A. Total number of infected fish. Includes fish that died naturally and fish that were euthanized at the end of the study.B. Challenged with E. ictaluri then treated with FFC at the listed dose rate for 10 consecutive days.
Gross examination revealed external and internal lesions characteristic of E. ictaluriinfection in 81% of fish that were culture-positive for the organism. External lesions includedinflammation through the sutra fontanel of the skull (“hole in the head”), hemorrhages on the skin and fins, and exophthalmia. Internal lesions included hemorrhages on the gastrointestinal tract and liver, as well as a congested spleen, ascites and swollen kidneys.The incidence of these lesions was greatest in the challenged, untreated fish (Group 2).5
Conclusion: Aquaflor® at a daily dose rate of 5 – 15 mg FFC/kg body weight for 10 consecutive days was safe, palatable and highly effective in reducing mortality and infectionrates following E. ictaluri challenge in channel catfish fingerlings. No adverse treatment-related gross pathological effects were found at any dose rate.
Comments: While there were no significant differences in mortality or infection ratesbetween the 5 mg/kg and 10 mg/kg Aquaflor® groups, a dosage of 10 mg FFC/kg/day for 10consecutive days is recommended to ensure adequate intake of FFC by all fish in the tank or pond. Feeding observations indicated excellent consumption of medicated feed at all doserates. However, in other fish species, it has been demonstrated that the more aggressiveeaters receive proportionately more of the medicated feed than the less aggressive eaters.38
Figure 4-4 Recovery of E. ictaluri from Treated vs. Untreated Catfish5
Group 1 Group 2 Group 3 Group 4 Group 5(Untreated, unchallenged) (Untreated, challenged) (5 mg FFC/kg)B (10 mg FFC/kg)B (15 mg FFC/kg)B
Treatment Group
80
70
60
50
40
30
20
10
0
Infe
ctio
n R
ate
(%)
86/119A
0/120A 3/118A 2/120A 4/120A
0%
72.3%
2.5% 1.7% 3.3%
21 AQUAFLOR® T E C H N I C A L M O N O G R A P H
Dose Confirmation Study
The following study was conducted to confirm the efficacy and palatability of Aquaflor®-medicated feed, at a dose rate of 10 mg FFC/kg/day for 10 consecutive days, in channel catfish exposed to a pathogenic strain of E. ictaluri.
Study Design: Six hundred (600) laboratory-reared, 4- to 5-month-old channel catfish fingerlings with no known history of exposure to E. ictaluri were divided into 2 groups of 300 fish:
• Group 1 — challenged with E. ictaluri and fed unmedicated feed
• Group 2 — challenged and fed Aquaflor® 50% Type A Medicated Article at 10 mg FFC/kg/day for 10 days
Sera from 50 additional fish from the same source were evaluated using a modified agglutination assay and found to be negative for antibodies to E. ictaluri.
The study fish were weighed in groups and then exposed to approximately 9.5 x 10⁵
CFU/mL of a confirmed pathogenic isolate of E. ictaluri, obtained from a natural outbreak of ESC. Both treatment groups received commercial unmedicated feed on Day 1. In Group2, treatment with Aquaflor®-medicated feed began 2 days after exposure and continued for10 consecutive days. All surviving fish were then observed for an additional 14 days, duringwhich time both groups were fed an unmedicated ration.
Throughout the study, feeding activity was subjectively graded each day, based on theamount of feed consumed. A score of 2 was assigned if 50 – 100% of the food was consumed.A score of 1 was given if <50% of the food was consumed. A score of 0 was given if little orno food was consumed.
The fish were also monitored daily for abnormal behavior indicative of morbidity (e.g., lethargy, abnormal swimming patterns) and for adverse events, such as piping at thewater surface or unexpected deaths.
Any fish that died during the study were necropsied and isolation of E. ictaluri wasattempted. At the end of the study period (day 25), all surviving fish were counted, weighedin groups, euthanized and submitted for microbiologic and pathologic examination.
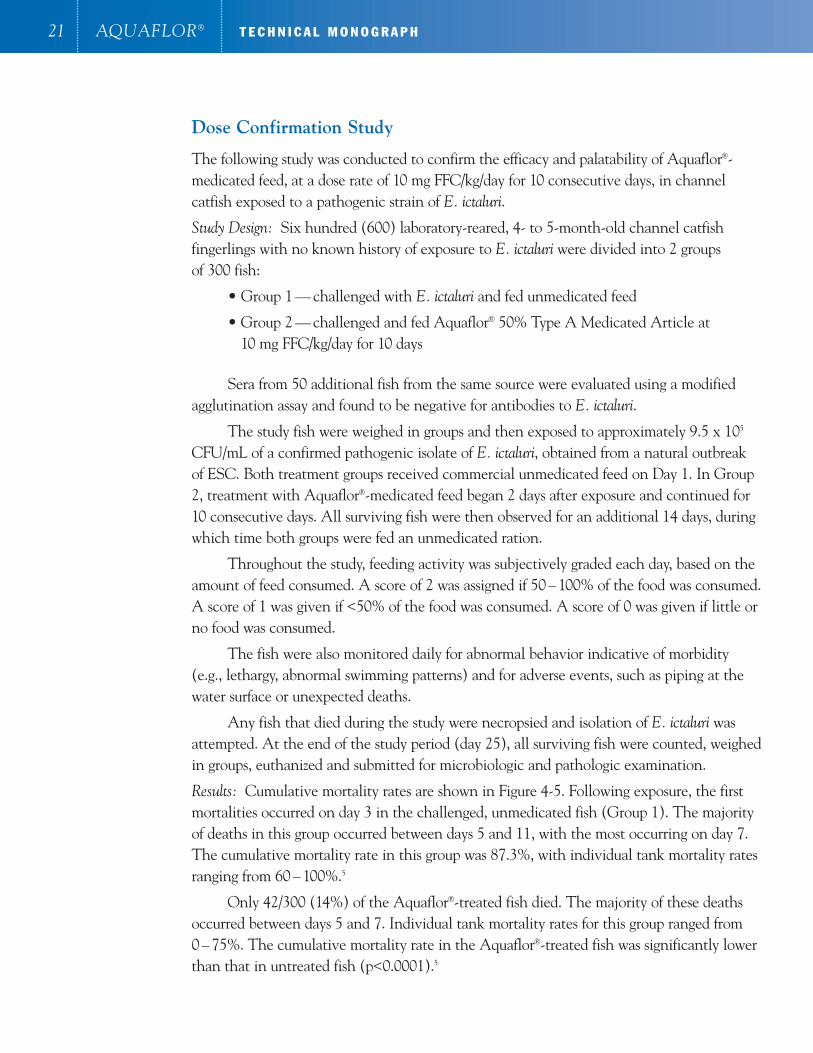
Results: Cumulative mortality rates are shown in Figure 4-5. Following exposure, the first mortalities occurred on day 3 in the challenged, unmedicated fish (Group 1). The majorityof deaths in this group occurred between days 5 and 11, with the most occurring on day 7.The cumulative mortality rate in this group was 87.3%, with individual tank mortality ratesranging from 60 – 100%.5
Only 42/300 (14%) of the Aquaflor®-treated fish died. The majority of these deathsoccurred between days 5 and 7. Individual tank mortality rates for this group ranged from0 – 75%. The cumulative mortality rate in the Aquaflor®-treated fish was significantly lowerthan that in untreated fish (p<0.0001).5
The average feeding activity score in the Aquaflor®-treated fish ranged from 1.7 – 2.The lowest score in this group was recorded on day 4, when 5/15 tanks had a feeding activityscore of 1. The remaining 10 tanks had a feeding score of 2, yielding an average score forthat day of 1.7. From day 6 onward, at least 14/15 tanks of Aquaflor®-treated fish maintained feeding scores of 2.
The lowest score for the untreated fish (Group 1) was also recorded on day 4, whenthe average for the group was 0.13. The average feeding activity score was <1.6 on 12 of 25 study days. The score was <1 on 6 of 25 days. From day 17 onward, the feeding activityscore in surviving fish was 1.8 – 2.
E. ictaluri was cultured from 251/300 fish (83.7%) in the untreated group and only28/300 fish (9.3%) in the Aquaflor®-treated group (Figure 4-5).
22
A. Includes fish that died naturally and fish that were euthanized at the end of the study.B. Challenged with E. ictaluri then treated with FFC at the listed dose rate for 10 consecutive days.
Gross examination revealed external and internal lesions characteristic of E. ictaluriinfection in 88% of fish that were culture-positive for the organism. External lesions includedinflammation through the sutra fontanel of the skull (“hole in the head”), hemorrhages on the skin and fins, and exophthalmia. Internal lesions included hemorrhages on the gastrointestinal tract and liver, as well as a congested spleen, ascites and swollen kidneys.The incidence of these lesions was greatest in the challenged, untreated fish (Group 1).5
Conclusions: Aquaflor® at a daily dose rate of 10 mg FFC/kg body weight for 10 consecutive days was palatable and highly effective in reducing mortality and infection rates following E. ictaluri challenge in channel catfish fingerlings.
Figure 4-5 Mortality and Infection Rates for Treated and Untreated Catfish5
Treatment Group
(10 mg FFC/kg)B(Untreated, challenged) (10 mg FFC/kg)B(Untreated, challenged)Group 1 Group 2 Group 1 Group 2
90
80
70
60
50
40
30
20
10
0
Mor
talit
yA/I
nfec
tion
Rat
es (
%)
87.3%
14.0%
83.7%
9.3%
Mortality Rates Infection Rates
23 AQUAFLOR® T E C H N I C A L M O N O G R A P H
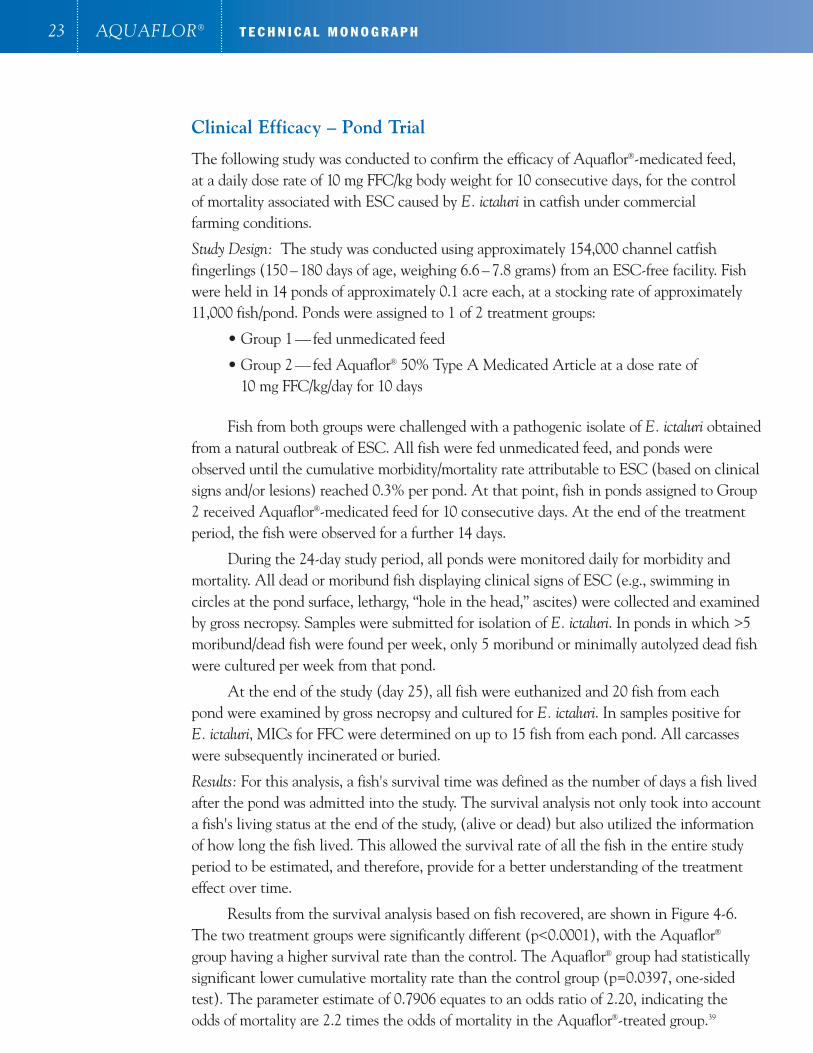
Clinical Efficacy – Pond Trial
The following study was conducted to confirm the efficacy of Aquaflor®-medicated feed, at a daily dose rate of 10 mg FFC/kg body weight for 10 consecutive days, for the control of mortality associated with ESC caused by E. ictaluri in catfish under commercial farming conditions.
Study Design: The study was conducted using approximately 154,000 channel catfish fingerlings (150 – 180 days of age, weighing 6.6 – 7.8 grams) from an ESC-free facility. Fishwere held in 14 ponds of approximately 0.1 acre each, at a stocking rate of approximately11,000 fish/pond. Ponds were assigned to 1 of 2 treatment groups:
• Group 1 — fed unmedicated feed
• Group 2 — fed Aquaflor® 50% Type A Medicated Article at a dose rate of 10 mg FFC/kg/day for 10 days
Fish from both groups were challenged with a pathogenic isolate of E. ictaluri obtainedfrom a natural outbreak of ESC. All fish were fed unmedicated feed, and ponds wereobserved until the cumulative morbidity/mortality rate attributable to ESC (based on clinicalsigns and/or lesions) reached 0.3% per pond. At that point, fish in ponds assigned to Group2 received Aquaflor®-medicated feed for 10 consecutive days. At the end of the treatmentperiod, the fish were observed for a further 14 days.
During the 24-day study period, all ponds were monitored daily for morbidity and mortality. All dead or moribund fish displaying clinical signs of ESC (e.g., swimming in circles at the pond surface, lethargy, “hole in the head,” ascites) were collected and examinedby gross necropsy. Samples were submitted for isolation of E. ictaluri. In ponds in which >5moribund/dead fish were found per week, only 5 moribund or minimally autolyzed dead fishwere cultured per week from that pond.
At the end of the study (day 25), all fish were euthanized and 20 fish from each pond were examined by gross necropsy and cultured for E. ictaluri. In samples positive for E. ictaluri, MICs for FFC were determined on up to 15 fish from each pond. All carcasseswere subsequently incinerated or buried.
Results: For this analysis, a fish's survival time was defined as the number of days a fish livedafter the pond was admitted into the study. The survival analysis not only took into accounta fish's living status at the end of the study, (alive or dead) but also utilized the informationof how long the fish lived. This allowed the survival rate of all the fish in the entire studyperiod to be estimated, and therefore, provide for a better understanding of the treatmenteffect over time.
Results from the survival analysis based on fish recovered, are shown in Figure 4-6.The two treatment groups were significantly different (p<0.0001), with the Aquaflor®
group having a higher survival rate than the control. The Aquaflor® group had statisticallysignificant lower cumulative mortality rate than the control group (p=0.0397, one-sidedtest). The parameter estimate of 0.7906 equates to an odds ratio of 2.20, indicating the odds of mortality are 2.2 times the odds of mortality in the Aquaflor®-treated group.39

A. Vertical bar separates treatment/post-treatment periods.B. Challenged with E. ictaluri then treated with FFC at the listed dose rate for 10 consecutive days.
The MIC for all tested isolates of E. ictaluri was 0.25 µg/mL. The mean Disk DiffusionAssay zone of inhibition was 36.8 mm (range: 32 – 50 mm) for all E. ictaluri isolates.39
Conclusion: Aquaflor® administered to channel catfish under commercial farming conditions at a daily dose rate of 10 mg FFC/kg body weight for 10 consecutive days was effective in reducing mortality associated with infection by E. ictaluri.
24
Harvesting of market-sized catfish.
Figure 4-6 Survival Analysis for Treated and Untreated Catfish39
Kaplan-Meier survival analysis (Treatment group strata) based on fish recovered
0 10 20 30
1.00
0.99
0.98
0.97
0.96
0.95
0.94
0.93
0.92
0.91
0.90
0.89Surv
ival
Dis
trib
utio
n Fu
nctio
nE
stim
ate �
�
�
��
�
�
�
�
��
�� � � � � � � � � � � �
�
Group 1 Group 2(Untreated, challenged) (10 mg FFC/kg)B
Day
A
� � �

25 AQUAFLOR® T E C H N I C A L M O N O G R A P H
An environmental risk assessment has been performed for the use of Aquaflor®
in catfish production. This assessment included evaluation of all available data for florfenicol and its metabolites, and generation of data specific for the use of florfenicol in freshwater environments.
ENVIRONMENTAL EXPOSURE PROFILE
The concentrations of florfenicol and its metabolites in the receiving environment aredependent on the quantities of medicated feed administered and consumed and their fate in the environment.
Florfenicol has a molecular weight of 358.21 daltons, water solubility of 1.32 g/L at pH 7, and a log Kow value (partition coefficient) of 0.37, the latter indicating little potentialfor bioaccumulation. A conservative estimate of biodegradation half-life in aquatic systems is30 days. As the physiochemical characteristics of florfenicol and its major metabolites show,accumulation of florfenicol or its degradation products in sediments or biota is unlikely.
Because nearly all catfish feed is formulated as floating extruded pellets, this type offeed has high water stability and does not sink into sediments where it becomes unavailableto fish. Virtually 100% of dispensed feed is consumed by catfish and little (if any) reachesthe sediments. Thus, florfenicol and its metabolites enter the sediment only via excreta,with the compounds then moving into the water column through leaching from feces andby mixing of the aqueous phase of excreta into the water column.
As an enclosed aquaculture system, catfish ponds do not represent the ambient environment and are not of environmental concern. However, any overflow or release of water (draining) from the ponds into the general environment needs to be assessed.Catfish are typically reared in large ponds approximately 1 m in depth, with the water level maintained below the surrounding soil surface by a perimeter levee. To reduce waterloss via overflow and the release of effluent from the ponds, the water level is maintainedbelow the overflow structure of the pond (i.e., a 20-cm storage capacity below the overflowlevel). This strategy normally prevents rainfall from causing overflow. In addition, clay soil types are often a predominant feature of pond construction, so leakage from ponds isminimal. These factors serve to limit the release of pond water and any florfenicol-relatedresidues into the environment.
5Environment
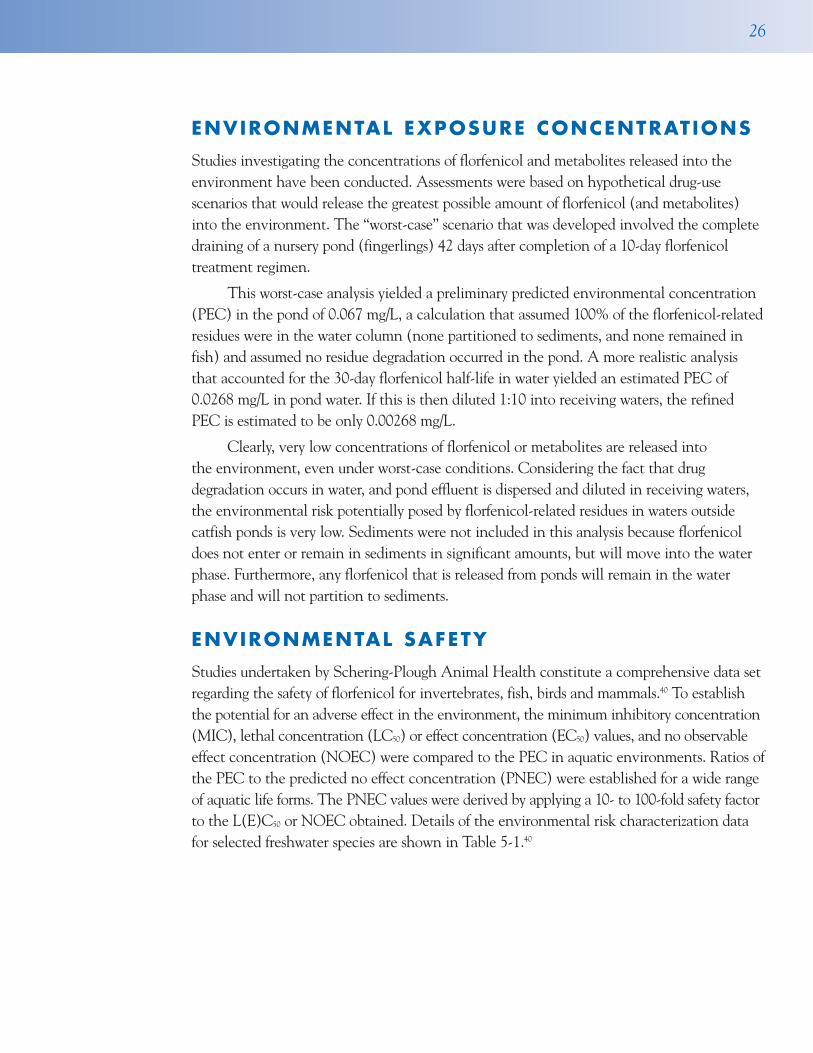
ENVIRONMENTAL EXPOSURE CONCENTRATIONS
Studies investigating the concentrations of florfenicol and metabolites released into theenvironment have been conducted. Assessments were based on hypothetical drug-use scenarios that would release the greatest possible amount of florfenicol (and metabolites)into the environment. The “worst-case” scenario that was developed involved the complete draining of a nursery pond (fingerlings) 42 days after completion of a 10-day florfenicol treatment regimen.
This worst-case analysis yielded a preliminary predicted environmental concentration(PEC) in the pond of 0.067 mg/L, a calculation that assumed 100% of the florfenicol-relatedresidues were in the water column (none partitioned to sediments, and none remained infish) and assumed no residue degradation occurred in the pond. A more realistic analysisthat accounted for the 30-day florfenicol half-life in water yielded an estimated PEC of0.0268 mg/L in pond water. If this is then diluted 1:10 into receiving waters, the refinedPEC is estimated to be only 0.00268 mg/L.
Clearly, very low concentrations of florfenicol or metabolites are released into the environment, even under worst-case conditions. Considering the fact that drug degradation occurs in water, and pond effluent is dispersed and diluted in receiving waters,the environmental risk potentially posed by florfenicol-related residues in waters outside catfish ponds is very low. Sediments were not included in this analysis because florfenicoldoes not enter or remain in sediments in significant amounts, but will move into the waterphase. Furthermore, any florfenicol that is released from ponds will remain in the waterphase and will not partition to sediments.
ENVIRONMENTAL SAFETY
Studies undertaken by Schering-Plough Animal Health constitute a comprehensive data setregarding the safety of florfenicol for invertebrates, fish, birds and mammals.40 To establishthe potential for an adverse effect in the environment, the minimum inhibitory concentration(MIC), lethal concentration (LC50) or effect concentration (EC50) values, and no observableeffect concentration (NOEC) were compared to the PEC in aquatic environments. Ratios ofthe PEC to the predicted no effect concentration (PNEC) were established for a wide rangeof aquatic life forms. The PNEC values were derived by applying a 10- to 100-fold safety factorto the L(E)C50 or NOEC obtained. Details of the environmental risk characterization datafor selected freshwater species are shown in Table 5-1.40
26

27 AQUAFLOR® T E C H N I C A L M O N O G R A P H
The refined PEC is far less than the calculated PNEC values. The very lowPEC/PNEC proportions reflect the lack of toxicity of florfenicol to aquatic organisms. Since only very small amounts of florfenicol can enter the aquatic environment, and thedrug and its metabolites are then rapidly degraded and dissipated, florfenicol poses little ifany risk to aquatic ecosystems. Existing toxicity data indicate that florfenicol is, in general,more active against prokaryotic than eukaryotic organisms. However, the likelihood of environmental effects are very limited given the low PEC:PNEC ratios, the drug’s intendeduse patterns, its fate in the receiving environments and its low toxicity.
These data indicate that florfenicol administration via the feed to catfish reared incommercial production facilities will not adversely affect the aquatic environment.
A. Safety factor of 100 applied (10X to account for intraspecies variation; 10X for extrapolation from acute to chronic data).
B. Refined PEC of 0.00268 mg/L for florfenicol (pond water released into environment).C. MIC (µg/L).
Table 5-1 Environmental Risk Characterization: Predicted No Effect Concentrations (PNEC) of Florfenicol for Freshwater Organisms, and PEC:PNEC Ratio.40
Organism NOEC(mg/L) Safety FactorA PNEC(mg/L) PECB/PNEC
Oncorhynchus mykiss 780 100 7.8 0.000344(rainbow trout)
Lepomis macrochirus 830 100 8.3 0.000323(bluegill sunfish)
Daphnia magna <100 100 1.0 0.000812(water flea)
Selenastrum capricornutum 0.75 10 0.075 0.0357(green algae)
Bacillus subtilis 0.4C 10 0.04 0.067(bacteria)

1. Anon. (2000) Catfish Health and Production Practices, United States Department ofAgriculture (USDA) Animal and Plant Health Inspection Service (APHIS) NationalAnimal Health Monitoring System (NAHMS) Report.
2. MacMillan, J.R. (1985) Infectious diseases. In Channel Catfish Culture. Tucker, CS(ed.), Elsevier, New York, NY, pp. 405–496.
3. Thune, R.L. (1991) Major infectious and parasitic diseases of channel catfish.Veterinary and Human Toxicology, 33 (supplement 1): 14–18.
4. Gaunt, P.S., Endris, R.G., Khoo, L., McGinnis, A., Santucci, T., Leard, T., Jack, S., Katz, T., Radecki, S.V., Simmons, R. (2003) Preliminary assessment of the toleranceand efficacy of florfenicol against Edwardsiella ictaluri administered in feed to channelcatfish. Journal of Aquatic Animal Health, 15: 239–247.
5. Gaunt, P.S., Endris, R.G., Khoo, L., Howard, R., McGinnis, A., Santucci, T., Katz, T.,(2004) Determination of dose rate of florfenicol in feed for control of mortality inchannel catfish, Ictalurus punctatus (Rafinesque), infected with Edwardsiella ictaluri, etiological agent of enteric septicemia. World Aquaculture Society, 35: 257–267.
6. Waltman, W.D., Shotts, E.B. (1986) Antimicrobial susceptibility of Edwardsiellaictaluri. Journal of Wildlife Diseases, 22: 173–177.
7. Poe, W.E., Wilson, R.P. (1989) Palatability of diets containing sulfadimethoxine, ormetoprim, and Romet 30 to channel catfish fingerlings. The Progressive FishCulturalist, 51: 226–228.
8. Johnson, M.R. (1991) Bacterial resistance to antibiotics: A growing problem in thechannel catfish industry. In Proceedings of the Louisiana Aquaculture Conference, ReighRC (ed.), Louisiana State University Agriculture Center, Baton Rouge, LA, pp. 22–23.
9. Plumb, J.A., Sheifinger, C.C., Shryock, T.R., et al. (1995) Susceptibility of six bacterial pathogens of channel catfish to six antibiotics. Journal of Aquatic AnimalHealth, 7: 211–217.
10. Smith, P., Hiney, M.P., Samuelson, O.B. (1994) Bacterial resistance to antimicrobialagents used in fish farming: A critical evaluation of method and meaning. AnnualReview of Fish Diseases, 4: 273–313.
11. Cannon, M., Hartford, S., Davies, J. (1990) A comparative study on the inhibitoryactions of chloramphenicol, thiamphenicol and some fluorinated derivatives. Journal of Antimicrobial Chemotherapy, 26: 307–317.
28
6References

29 AQUAFLOR® T E C H N I C A L M O N O G R A P H
12. Fukui, H., Fujihara, Y., Kano, T. (1987) In vitro and in vivo antibacterial activities of florfenicol, a new fluorinated analog of thiamphenicol, against fish pathogens. FishPathology, 22: 201–207.
13. Kim, E., Aoki, T. (1993) Drug resistance and broad geographical distribution of identical R plasmids of Pasteurella piscicida isolated from cultured yellowtail in Japan.Microbiology and Immunology, 37: 103–109.
14. Inglis, V., Richards, R.H., Varma, K.J., Sutherland, I.H., Brokken, E.S. (1991)Florfenicol in Atlantic salmon, Salmo salar L., parr: tolerance and assessment of efficacy against furunculosis. Journal of Fish Diseases, 14: 343–351.
15. Grant, A.N., Laidler, L.A. (1993) Assessment of the antimicrobial sensitivity ofAeromonas salmonicida isolates from farmed Atlantic salmon in Scotland. VeterinaryRecord, 133: 389–391.
16. Inglis, V., Millar, S.D., Richards, R.H. (1993) Resistance of Aeromonas salmonicida toamoxicillin. Journal of Fish Diseases, 16: 389–395.
17. Zhao, J., Kim, E., Kobayashi, T., Aaoki, T. (1992) Drug resistance of Vibrio anguillarumisolated from Ayu between 1989 and 1991. Nippon Suisan Gakkaishi, 58: 1523–1527.
18. Inglis, V., Richards, R.H. (1991) The in vitro susceptibility of Aeromonas salmonicidaand other fish pathogenic bacteria to 29 antimicrobial agents. Journal Fish Diseases, 14: 641–650.
19. Hastein, T. (1994) In vitro antimicrobial activity of florfenicol against fish pathogenicbacteria. (Data on file). Schering-Plough Animal Health Corp. (unpublished report).
20. McGinnis, A., Gaunt, P., Santucci, T., Simmons, R., Endris, R. 2003. In vitroevaluation of the susceptibility of Edwardsiella ictaluri, etiological agent of enteric septicemia in channel catfish, Ictalurus punctatus (Rafinesque), to florfenicol. Journal of Veterinary Diagnostic Investigation, 15: 76–79.
21. Rangdale, R.E., Richards, R.H., Alderman, D.J. (1997) Minimum inhibitory concentrations of selected antimicrobial compounds against Flavobacterium psychrophilum, the causal agent of rainbow trout fry syndrome (RTFS). Aquaculture,158: 193–201.
22. Hastein, T., Torgersen, Y. (1992) In vitro antimicrobial activity of florfenicol against fish pathogenic bacteria. (Data on file). Schering-Plough Animal Health Corp.(unpublished report).
23. Lobell, R.D., Varma, K.J., Johnson, J.C., Sams, R.A., Gerken, D.F., Ashcraft, S.M.(1994) Pharmacokinetics of florfenicol following intravenous and intramuscular dosesto cattle. Journal of Veterinary Pharmacology and Therapeutics, 17: 253–258.
30
24. Voorspoels, J., D’Haese, E., De Craene, B.A., Vervaet, C., DeRiemaecker, D., Deprez,P., Nelis, H., Remon, J.P. (1999) Pharmacokinetics of florfenicol after treatment of pigswith single oral or intramuscular doses or with medicated feed for three days. VeterinaryRecord, 145: 397–399.
25. El-Banna, H.A. (1998) Pharmacokinetics of florfenicol in normal and Pasteurella-infected Muscovy ducks. British Poultry Science, 39: 492–496.
26. Afifi, N.A., El-Sooud, K.A. (1997) Tissue concentrations and pharmacokinetics of florfenicol in broiler chickens. Deutsche Tierarztliche Wochenschrift, 104: 178–180.
27. McKellar, Q.A., Varma, K.J. (1996) Pharmacokinetics and tolerance of florfenicol inEquidae. Equine Veterinary Journal, 28: 209–213.
28. Pinault, L.P., Millot, L.K., Sanders, P.J. (1997) Absolute oral bioavailability andresidues of florfenicol in the rainbow trout (Oncorhynchus mykiss). Journal of VeterinaryPharmacology and Therapeutics, 20: Supplement 1, 297–298.
29. Horsberg, T.E., Martinsen, B., Varma, K.J. (1994) The disposition of 14 C-florfenicolin Atlantic salmon (Salmo salar). Aquaculture, 122: 97–106.
30. Martinsen, B.T., Horsberg, T.E., Varma, K.J., Sams, R. (1993) Single dose pharmacokinetic study of florfenicol in Atlantic salmon (Salmo salar) in seawater at 11°C. Aquaculture, 112: 1–11.
31. Horsberg, T.E., Hoff, K.A., Nordmo, R. (1996) Pharmacokinetics of florfenicol and itsmetabolite florfenicol amine in Atlantic salmon. Journal of Aquatic Animal Health, 8: 292–301.
32. Nagabhusahan, T., Miller, G.H., Varma, K.J. (1992) Chloramphenicol and analogues. In: Encyclopedia of Chemical Technology, Vol. 2, J. Wiley & Sons, Inc. pp. 961–978.
33. Irvine, L. (2003) Aquaflor: safety expert report. (Data on file). Schering-PloughAnimal Health Corp. (unpublished report).
34. Hormazabal, V., Steffenak, I., Ynestad, M. (1993) Simultaneous determination ofresidues of florfenicol and the metabolite amine in fish tissues by high-performance liquid chromatography. Journal of Chromatography, 616: 161–165.
35. Wrzesinski, C.L., Crouch, L.S., Endris, R.G. (2003) Determination of florfenicolamine in channel catfish muscle by liquid chromatography. Journal of the AOACInternational, 86(3): 515–520.
36. Wrzesinski, C.L., Crouch, L.S., Gaunt, P.A., Holifield, D., Bertrand, N., Endris, R.G.(2004) Florfenicol residue depletion in channel catfish. Aquaculture (in press).
37. Gaikowski, M.P., Wolf, J.C., Endris, R.G., Gingerich, W.H. (2003) Safety of Aquaflor‚(Florfenicol, 50% Type A Medicated Article) administered in feed to channel catfish,Ictalurus punctatus. Toxicologic Pathology, 31(6): 689–697.

31 AQUAFLOR® T E C H N I C A L M O N O G R A P H
38. McCarthy, I.D., Carter, C.G., Houlihan, D.F. (1992) The effect of feeding hierarchy on individual variability in daily feeding of rainbow trout. Journal of Fish Biology, 41: 257-263.
39. Gaunt, P.S., McGinnis, A.L., Santucci, T.D., Cao, J., Waeger, P., Endris, R.G. Field efficacy of florfenicol for control of mortality in channel catfish, Ictalurus punctatus (Rafinesque), caused by infection with Edwardsiella ictaluri. Journal of World Aquaculture Society, Vol. 37, No. 1. (In print).
40. Hobson, J.F. (2004) Environmental assessment for Aqauflor® 50% Type A MedicatedArticle for catfish. (Data on file). Schering-Plough Animal Health Corp. (unpublished report).

32
SUMMIT, NJ 07901
Copyright ©2005. Schering-Plough Animal Health Corporation. All rights reserved. Aquaflor is a registered trademark of Schering-Plough Veterinary Corporation
SPAH-AQF-06
Caution: Federal law limits this drug to use under the professional supervision of a licensed veterinarian. Animal feedbearing or containing this veterinary feed directive drug shall be fed to animals only by or upon a lawful veterinary feed directive issued by a licensed veterinarian in the course of the veterinarian’s professional practice.