Catfield Fen Water Abstraction Report by Senior Ecologist · Catfield Fen Water Abstraction ....
25
Broads Authority 16 May 2014 Agenda Item No 11 Catfield Fen Water Abstraction Report by Senior Ecologist Summary: This report summarises the position regarding the Environment Agency’s consideration of applications for the renewal of water abstraction licences in the Catfield area. It highlights the importance of Catfield Fen and the concerns officers have raised. The Authority’s engagement in this process has underlined the value of an on-going research programme and the regular Fen Ecological Survey. Recommendations: (i) To note the key points in the technical response submitted by officers and summarised in paragraph 3.7. (ii) To recognise the value of the Fen Ecological Survey and the need to repeat the work starting in 2017 (iii) To support the convening of a research seminar in the autumn in order to facilitate greater understanding on fen hydrology and ecology. 1 Water Abstraction at Catfield an Overview 1.1 The Broads Authority is a statutory consultee for water abstractions renewals in and around the Broads Authority executive area. The Water Act 2003 requires all new abstractions to be time limited, most licenses are set to a common end date stated in the Catchment Abstraction Management Strategy (CAMS). Two agricultural licences in the Catfield area are currently being considered by the Environment Agency. The applicant is seeking to renew the abstraction licences on the same terms. Their location is shown on Figure 1. 1.2 Other existing abstractions, such as Anglian Water’s abstraction at Ludham, will be considered as part of the Environment Agency’s Restoring Sustainable Abstraction process. 1.3 Catfield Fen is a particularly important site in the Broads. It is both a Site of Special Scientific Interest (SSSI) and Broads Special Area of Conservation (Natura 2000 – European designation). The most sensitive designated features at Catfield include fen orchid which has its stronghold in the Broads with only one other site in the UK and the following communities: ‘Calcareous Fen with saw sedge’ (a European Union priority habitat), ‘Molina Meadow on calcareous, peaty or clayey-silt-laden soils’ and ‘Transition Mire and Quaking Bogs’. These communities have evolved with a supply of base-rich groundwater and their presence supports many rare invertebrates, including moths, beetles and spiders. The Broads Biodiversity Audit quantified fens as AK/RG BA160514 Item 11 Page 1 of 25
-
Upload
truongxuyen -
Category
Documents
-
view
214 -
download
1
Transcript of Catfield Fen Water Abstraction Report by Senior Ecologist · Catfield Fen Water Abstraction ....

Broads Authority 16 May 2014 Agenda Item No 11
Catfield Fen Water Abstraction Report by Senior Ecologist
Summary: This report summarises the position regarding the Environment Agency’s consideration of applications for the renewal of water abstraction licences in the Catfield area. It highlights the importance of Catfield Fen and the concerns officers have raised. The Authority’s engagement in this process has underlined the value of an on-going research programme and the regular Fen Ecological Survey.
Recommendations: (i) To note the key points in the technical response submitted by officers and
summarised in paragraph 3.7. (ii) To recognise the value of the Fen Ecological Survey and the need to repeat
the work starting in 2017 (iii) To support the convening of a research seminar in the autumn in order to
facilitate greater understanding on fen hydrology and ecology.
1 Water Abstraction at Catfield an Overview 1.1 The Broads Authority is a statutory consultee for water abstractions renewals
in and around the Broads Authority executive area. The Water Act 2003 requires all new abstractions to be time limited, most licenses are set to a common end date stated in the Catchment Abstraction Management Strategy (CAMS). Two agricultural licences in the Catfield area are currently being considered by the Environment Agency. The applicant is seeking to renew the abstraction licences on the same terms. Their location is shown on Figure 1.
1.2 Other existing abstractions, such as Anglian Water’s abstraction at Ludham,
will be considered as part of the Environment Agency’s Restoring Sustainable Abstraction process.
1.3 Catfield Fen is a particularly important site in the Broads. It is both a Site of
Special Scientific Interest (SSSI) and Broads Special Area of Conservation (Natura 2000 – European designation). The most sensitive designated features at Catfield include fen orchid which has its stronghold in the Broads with only one other site in the UK and the following communities: ‘Calcareous Fen with saw sedge’ (a European Union priority habitat), ‘Molina Meadow on calcareous, peaty or clayey-silt-laden soils’ and ‘Transition Mire and Quaking Bogs’. These communities have evolved with a supply of base-rich groundwater and their presence supports many rare invertebrates, including moths, beetles and spiders. The Broads Biodiversity Audit quantified fens as
AK/RG BA160514
Item 11 Page 1 of 25
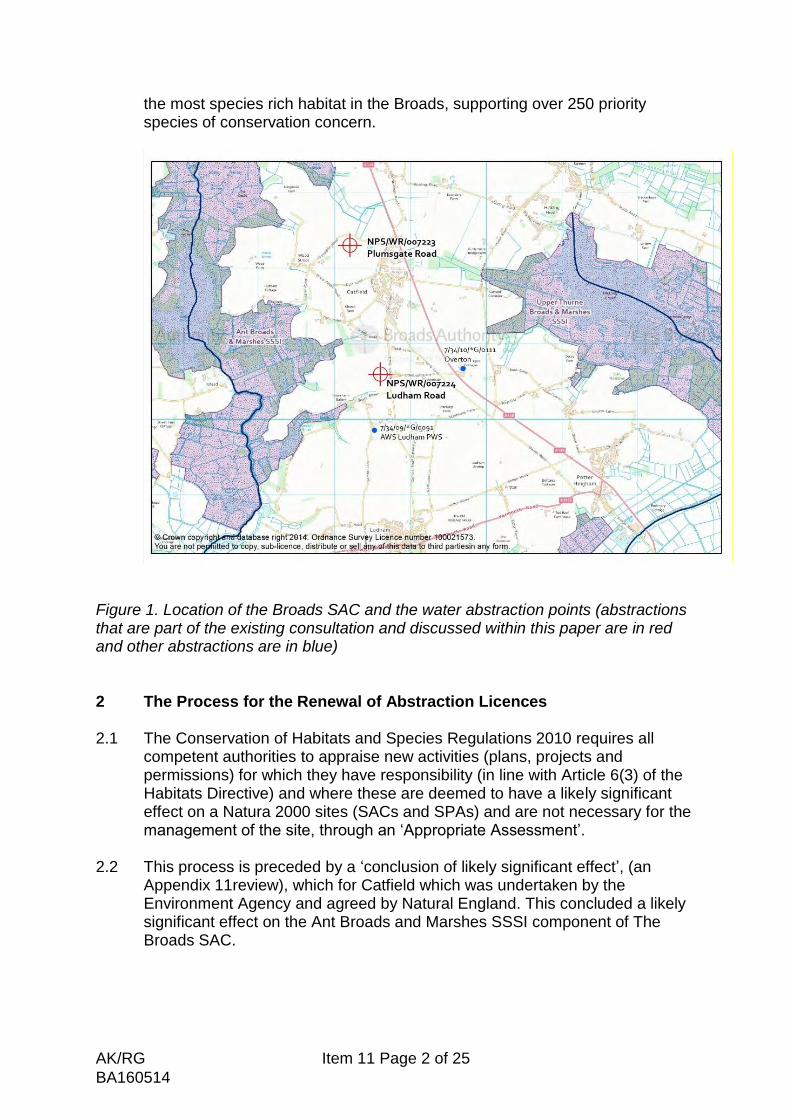
the most species rich habitat in the Broads, supporting over 250 priority species of conservation concern.
Figure 1. Location of the Broads SAC and the water abstraction points (abstractions that are part of the existing consultation and discussed within this paper are in red and other abstractions are in blue) 2 The Process for the Renewal of Abstraction Licences 2.1 The Conservation of Habitats and Species Regulations 2010 requires all
competent authorities to appraise new activities (plans, projects and permissions) for which they have responsibility (in line with Article 6(3) of the Habitats Directive) and where these are deemed to have a likely significant effect on a Natura 2000 sites (SACs and SPAs) and are not necessary for the management of the site, through an ‘Appropriate Assessment’.
2.2 This process is preceded by a ‘conclusion of likely significant effect’, (an
Appendix 11review), which for Catfield which was undertaken by the Environment Agency and agreed by Natural England. This concluded a likely significant effect on the Ant Broads and Marshes SSSI component of The Broads SAC.
AK/RG BA160514
Item 11 Page 2 of 25
2.3 Key steps include:
Review information about the site and identify any likely significant effect associated with the application
Establish the effects of the abstraction by matching predicted (modelled) effects with the distribution of the most sensitive and vulnerable features1
Establish the risk to these features by predicting the most likely changes, if any, in extent and distribution of the features, based on best available scientific knowledge
Determine if any predicted changes would compromise the conservation status of the features
Ensure that the judgement takes full account of the effects of other activities already acting on the site and likely anticipated changes in the prevailing environmental conditions (either natural or influenced by humans)
Conclude, beyond all reasonable scientific doubt and taking account of uncertainties and assumptions made, whether or not the effects of the proposed permitted activity, acting alone or in-combination with others, would adversely affect the integrity of the site i.e. the structure and ecological functioning of the site
2.4 Thus the overall conclusion can be based on a sequential and systematic
assessment of the predicted effects and the likely ecological response.
1 ‘Features’ are the specific species or habitats identified in the designation citation of being of particular importance
AK/RG BA160514
Item 11 Page 3 of 25
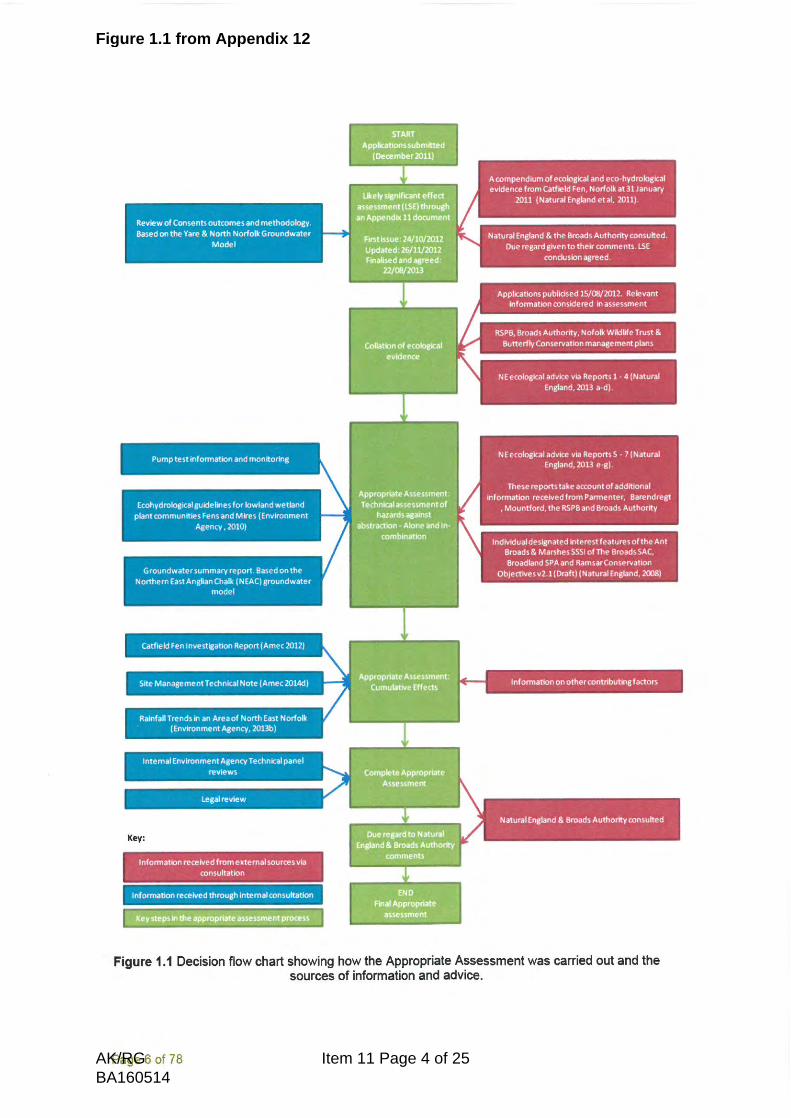
Figure 1.1 from Appendix 12
AK/RG BA160514
Item 11 Page 4 of 25

2.5 The Environment Agency has completed the following stages: Agreed the decision matrix with Natural England Considered Natural England’s report about site ecological condition Run the predictive hydrological model (North East Anglian Chalk
Groundwater Model) Completed the ground water report Completed Appendix 11, 12 and 4 as required by the Habitats Regulation
Assessment Consulted with Natural England and the Broads Authority (completing
30/04/14)
2.6 The Environment Agency has the following stages ahead: Determination Report (following the consultation with Natural England and
Broads Authority) Minded to (public consultation stage) Decision finalisation Publish final documents
2.7 The timescale for a ‘decision finalisation’ has not been confirmed, although is
likely to be between July and September. 3 Broads Authority Consultation Response to the Technical Information 3.1 The process of sequential and systematic assessment has meant that over
the past two years many reports and some new evidence has been considered and the advice given by Natural England and the Broads Authority understanding has evolved. The evidence from the Fen Ecological Survey has played a crucial role in the attempt to understand what is happening at the site.
3.2 The Environment Agency, Natural England and the Broads Authority agree
that the site is drying based on the evidence presented. Also that ground water is important for the summer water supply and designated features of the site and there is connection of water in the crag with the surface.
3.3 The Environment Agency, in its March 2014 Groundwater Summary report
and Appendix 12 documents, has concluded no adverse effect from the two abstraction licences (AN/034/0009/008 Plumsgate Road and AN/034/009/009 Ludham Road) on the Ant Broads and Marshes SSSI – a component of The Broads SAC and Broadland Ramsar.
3.4 The Broads Plan (2011) provides the context for the response in
acknowledging the importance of the Habitat Regulations Assessment, required to protect designated sites, as well as recognising that maintaining sound environmental management to protect resources and life sustaining systems is essential for sustainable and viable agriculture and a healthy and good quality environment.
AK/RG BA160514
Item 11 Page 5 of 25

3.5 The most recent Broads Authority officer response on the Catfield water abstractions provided to the Environment Agency is in response to the March 2014 Groundwater Summary report and Appendix 12 documents. The full Broads Authority response is in Appendix 1, with the key points set out in 3.7 below.
3.6 In addition to internal review, Professor Ken Rushton, formerly of the
University of Birmingham, has been commissioned by the Broads Authority to provide an expert and independent review of the complex hydrological information. Likewise Professor David Gowing, at the Open University, has been commissioned by the RSPB. In addition Mr and Mrs Harris of Catfield Fen, have commissioned hydrological and ecological advice from, Dr Chris Bradley, at the University of Birmingham, Dr Dave Gilvear and Dr Owen Mountford at the Centre of Ecology and Hydrology, and Dr. Aat Barendregt at the Utrecht University. The applicant, Mr Andrew Alston, has also collected evidence to aid understanding.
3.7 The key points raised by Broads Authority officers, informed by independent
advice from Professor Ken Rushton, are summarised below;
(a) An inadequate groundwater model development process has been followed, failing to use the Environment Agency modelling guidelines;
(b) More detailed conceptual models are required, especially for the fens; (c) Inappropriate mesh spacing of groundwater model – a Technical Note
prepared for the Environment Agency indirectly demonstrates that the 200m mesh spacing model cannot reproduce important processes within fens;
(d) Lack of sufficient suitable observed groundwater level data to confirm the reliability of the model;
(e) Need to develop a computational methodology for representing actual groundwater and surface water conditions in the fens;
(f) Given the shortcomings of the conceptual models and computational modelling, the results from the modelling are not reliable and should not be used for licence determination;
(g) Errors and assumptions about site hydrology of Sharpe Street Fen; (h) Anecdotal assessment of the role of site management without
reference to Broads literature; (i) Gaps and lack of consideration of water level and Ellenburg values; (j) Lack of ecological evidence to base the 1986 abstraction as
acceptable. 3.8 The next stage will be a further meeting involving officers from the
Environment Agency, Natural England and the Broads Authority to discuss their responses to the groundwater report and Appendix 12 during May, prior to the issuing of the determination report.
4 Work Areas for Further Development 4.1 Greater understanding is required of longer term ecological and hydrological
functioning. This will involve a repeat of the Fen Ecological Survey. This three
AK/RG BA160514
Item 11 Page 6 of 25

year survey from 2007 to 2010 cost £238,859 (£105,900 invertebrate and £132,959 vegetation). This intention behind the survey is to track and understand changes in this important vegetation type. Ideally the exercise should be repeated every ten years which would mean commencing a new survey in 2017. The Environment Agency and Natural England agree that this survey is required and finding funding for this work is a priority to underpin understanding and causes of change within the Broadland fens.
4.2 Understanding the hydrology of the Catfield area and its impact on the fen
species has been difficult, both in terms on water quality and quantity. As other areas of fens may be subject to similar pressures, it is suggested that the Authority should take the lead in this area of work by holding a research seminar on fen hydrology in the autumn of this year and use the outcome from that to work with partners to agree a research programme into the hydrology and ecology of the fens by the end of the year.
Author: Andrea Kelly Date of report: 24/04/14 Broads Plan Objectives: AL2 – Agriculture
BD1, BD2, BD3, BD4 – Biodiversity Appendices: Appendix 1: Broads Authority response to the Environment
Agency’s Groundwater report and Appendix 12
AK/RG BA160514
Item 11 Page 7 of 25
Appendix 1
Broads Authority response to the Environment Agency’s Groundwater report and
Appendix 12
17/04/14
Summary of Areas of Concern
A. An inadequate groundwater model development process has been followed,
failing to use the Environment Agency modelling guidelines;
B. More detailed conceptual models required, especially for the fens;
C. Inappropriate mesh spacing of groundwater model – Technical Note prepared
for the Environment Agency indirectly demonstrates that the 200m mesh
spacing model cannot reproduce important processes within fens;
D. Lack of sufficient suitable observed groundwater level data to confirm the
reliability of the model;
E. Need to develop a computational methodology for representing actual
groundwater and surface water conditions in the fens;
F. Given the shortcomings of the conceptual models and computational
modelling, the results from the modelling are not reliable and should not be
used for licence determination;
G. Errors and assumptions about site hydrology of Sharpe Street Fen;
H. Anecdotal assessment of the role of site management without reference to
Broads literature;
I. Gaps and lack of consideration of water level and Ellenburg values;
J. Lack of ecological evidence to base the 1986 abstraction as acceptable.
Sections within this response:
1. Conceptual groundwater model 2. Community change and recognition of site complexity in ecological and hydrological
terms 3. Management 4. Lack of modelling and omitted data 5. Use of 1986 as date for defining acceptable abstraction 6. Levels of certainty 7. Decision tables
AK/RG BA160514
Item 11 Page 8 of 25
1. Conceptual groundwater model
1.1 An independent review of the Environment Agency groundwater summary report has been commissioned by the Broads Authority. The comments in the review have been prepared in discussion with the Broads Authority and this review should be considered as part of the Broads Authority response in full. The main points of concern are summarised above and also provided in detail within the file named ‘BA review by Ken Rushton Apr 2014’. In summary the Broads Authority considers that the Environment Agency has further work to do in preparing quantified and conceptual models which will address the complex hydrological conditions in the Broadland fens and provide confidence in decision making.
1.2 In addition to these comments we add that the model does not identify the influence of surface water and exchange via drain networks which are essential aspects of the ecohydrology of the designated features of the area (such as oxygen concentrations in flowing ground water on the characteristic species of the key vegetation types and of fen orchid in particular).
1.3 Furthermore, the drainage network not being considered in the model, the substrate is also been proven to be more complex than the model is able to represent. Evidence presented in Dr Parmenter’s stratigraphy report to Mr Harris (May 2013) details the complexity of the substrate underlying the fen. We note that this research shows Unit 11 has some semi-floating vegetation on former turberies but also areas of solid peat and Unit 3 is characterised by semi-floating vegetation located on former turberies. Given that the surface layers are complex and this complexity is important to water transfer and vegetation community, the ground water report is oversimplified. We believe it is incorrect to assume that the site is dominantly impacted by clay layers.
2. Community change and recognition of site complexity in ecological and
hydrological terms
2.1 The report contains errors and assumptions of the hydrological regime found at Sharp Street Fen and Sutton Broad. Both these sites are influenced by the river and are not fully comparable with Catfield and the report requires amendment to correct these errors and assumptions. Using the lack of presence of sphagnum growth at Sharp Street to indicate a lack of impact from water abstraction, despite the model demonstrating that there is a modelled impact from decreased groundwater recharge at this site, is an oversimplification. We support the comments made by Natural England 1-6, particularly in regards to the lack of information on the role of rainwater and groundwater interaction which is critical for fen sites. Further exploration of this is needed to increase confidence in decision making.
AK/RG BA160514
Item 11 Page 9 of 25
3. Management
3.1 The way that management treatment affects fens is described in some detail in Rodwell (1991b, 1995, 2000), Wheeler and Shaw (1987), Shaw and Wheeler (1990), and in terms of species-richness, Wheeler and Shaw (1991). More of a Broadland context is provided in Lambert (1965), George (1992), Tolhurst (1997) and Moss (2001). Only one of these references is cited in the AMEC report on Practical Management March 2014.
3.2 There has been an increase in long rotation conservation management at both Reedham Marshes (and many other sites in the Broads) along with Catfield Fen over the past twenty years. Both Reedham and Catfield have long had acid Sphagnum areas; however this species is only recorded as actively expanding at Catfield. Thus it would appear that if current conservation management practice were a contributory factor in the expansion of Sphagnum over fen areas (as stated in the AMEC report on Practical Management March 2014) this would be replicated in other areas, such as Reedham Marsh.
3.3 If current conservation management practices under ESA and HLS were resulting in Sphagnum increase or community change this may be evident in the Fen Ecological Survey (2005-2009). The Broads Authority commissioned an assessment of ‘Vegetation Responses to Management at Five Broadland Fen Sites’ in 2010. Data collected for this survey was compared with previous data sets. From this report firm conclusions were difficult, since the earlier data sets were too sparse and samples inaccurately located. In addition, management records were often insufficient or too inaccurate to interpret the change that was recorded. In short, wider scientific evidence for community change as a result of management is lacking a scientific basis and only anecdotal information is available.
4. Lack of modelling and omitted data
4.1 There is no hydrological data provided on the groundwater fed SAC, SSSI fen
closest to the abstraction. Snipe Marsh and Cromes Broad area were raised as being of concern by the Broads Authority in a letter to Environment Agency in response to the AMEC report (March 2012). Both sites are either managed or managed and owned by the Broads Authority. This omission in the groundwater report for both sites, and in the case of Snipe Marsh the Appendix 12, is concerning. This concern is relevant as Broads Authority site managers have noted that the site has a problem with water levels and is often too dry to maintain the S24 vegetation community on much of the site.
AK/RG BA160514
Item 11 Page 10 of 25
4.2 Snipe Marsh supports mainly S24(d) the unique and characteristic Broadland community (Phragmites australis-Peucedanum palustre reed fen,Typical sub-
community) and M22(d) a base rich fen meadow (Juncus subnodulosus-Cirsium
palustre fen meadow, Iris pseudacorus sub-community), with small areas of S5 (Glyceria maxima swamp, no assigned sub-community) and MG10(b) (Holcus
lanatus-Juncus effusus rush pasture, Juncus inflexus sub-community). We advise that hydrological and ecological assessment is required or if this has already been completed that this is made available to the Broads Authority.
4.3 The AMEC report refers to 7cm drawdown at Snipe Marsh, although subsequent
assessments showed that this was not always to do with abstraction it is not clear what is the cause of the drawdowns.
4.4 Transmissivity of the crag was shown to be greater to the north, towards Catfield. If this is the case we are unclear why Sharpe Street, which is also to the south and west of the abstractions, has been considered in such detail in the Environment Agency ground water report, yet Snipe Marsh has no mention.
4.5 There is no reference to the long-term water level data provided by the RSPB, this
evidence should be considered and clearly referenced within the hydrological report as a key piece of data, particularly considering the lack of field data for this area.
4.6 It is essential that the latest data is used and referred to in the hydrological report.
The hydro-chemical data used in the report is dated and Broads Authority supports the Natural England recommendation that the Environment Agency considers whether this evidence is likely to have changed. Dr Barendregt’s report (June 5
2013) to Mr Harris includes some hydro-chemical information. 4.7 To date there has not been consideration of the Broads Authority and RSPB
submitted evidence of Ellenberg value change, and there is scant information within the Appropriate Assessment.
5. Use of 1986 as date for defining acceptable abstraction
5.1 The Broads Authority agrees with Natural England in being unable to support a statement that says that the hydrological regime was acceptable in 1986. We consider the grounds on which former conditions are judged to be ecologically acceptable both scant and flawed.
5.2 The change in vegetation composition to a less valued/drier community and in some places a more acidic community (shown by some areas of Sphagnum growth) and assuming that this occurred at a measurable point in time that would coincide with the hydrology: i.e. the vegetation composition in relation to the hydrology and
AK/RG BA160514
Item 11 Page 11 of 25
response lag times. Given this, comparison of the licenced scenarios to the naturalised model scenario are essential.
6. Levels of certainty
6.1 Broads Authority is concerned about the use of words such as just, slight and minor. While these may give a feel for relative impact they are not meaningful. There is no quantification of either the range of variation from the thresholds that might be deemed acceptable or the error within the model, so it is simply not possible to assess the risk of departure from the species requirements. It would be more meaningful to provide quantitative measures.
6.2 Relating to ‘Uncertainty and error’ is the following text from the Environment
Agency’s own Ecohydrological guidelines document which needs to be considered in detail:
“Only with these two components (Hydrological Impact and Ecological effect)
together can a predicted hydrological impact be translated into a direct
ecohydrological effect. It is at this link stage that extreme care is needed. It is vital
that hydrologists and ecologists communicate at the same scale (Hunt and Wilcox,
2003). For example, it is of little use having models which cannot be linked to the
same scale at which ecological impact may be occurring (i.e. the surface zone of the
wetland itself). A groundwater model may be considered accurate if predicted water
table levels are within 10 cms of observed values, whereas a 10 cm difference in
water levels may mark a difference between the condition required by quite different
vegetation communities.
We must ask the real question; whether hydrological modelling can be undertaken
with sufficient resolution as to provide valuable information to link with ecological
thresholds. The value of the groundwater model in this case is likely to be in
predicting the size of changes in water levels rather than absolute levels. This is a
particularly crucial issue when the hydrological cause and ecological response are at
different scales. For example, to model the impact of abstraction on water table level
in a large aquifer requires a broad scale groundwater model. The wetland may be
very small in comparison, and local changes in water level within the wetland may be
influenced by local conditions, such as soil structure that cannot be modelled to a
sufficient degree of accuracy with a regional model. Temporal variability is a key
issue in modelling. Many factors influencing the hydrological regime of a wetland,
including rainfall, river flow, groundwater levels and evaporation are continually
changing; on a minute by minute to a year to year basis. Indeed, it is widely
accepted that this variability maintains diversity with the ecosystem. It also suggests
that the vegetation may not necessarily be in equilibrium with hydrological regime,
but may be recovering from a recent drought or flood. Temporal variability also
makes it difficult to identify a “representative period” over which to assess the
AK/RG BA160514
Item 11 Page 12 of 25

hydrological regime. Even data collected over several years may not capture
frequently experienced conditions.”
7. Decision tables
7.1 The decision risk tables are qualitative and designed to compare risk across a large number of sites investigated under RoC. However the Habitats Regulation Assessment method should be robust and stand alone for each site and provide quantitative data and certainty given the sensitivity of the sites.
AK/RG BA160514
Item 11 Page 13 of 25

Independent review completed for the Broads Authority by Professor Ken Rushton on the
Environment Agency Summary Groundwater Report: Assessment of the Acceptable Level of Abstraction
within the Ludham-Catfield Area in the Vicinity of the Ant Broads and Marshes SSSI
In reviewing the Groundwater Summary Report on behalf of the Broads Authority, the objectives are to
critically examine the groundwater model:
to ascertain whether there is sufficient information provided to be able to assess the reliability of the
model,
to consider whether the representation of the complex hydrological and hydrogeological conditions in
the fens are replicated adequately by the model.
In preparing this review, reference has also been made to the four separate Technical Notes identified on page
3 of the Groundwater “Summary Report”. Reference has also been made to the “Catfield Fen Investigation
Final Report, AMEC (2012)”
This review is mainly concerned with Sections 4 to 8 of the Summary Report. The following discussion is
supported by ‘Comments’ which can be found on pages 5 to 12.
Section 1. Introduction. I note the definition of the ‘acceptable level of abstraction’ as the level of total or
‘in combination’ abstraction which does not significantly alter the hydrological functioning of a water
feature, and which the Environment Agency is confident would not adversely affect the ecology of the wetland
site (last paragraph of Section 1.2). I also note the end of the penultimate paragraph of Section 1.2, “to make
sure that gaps in knowledge are filled, and that decisions on acceptable level of abstraction are supported by
adequate data and rigorous modelling.” The adequacy of the data and the rigour of the modelling will be
considered in this review.
Section 4 Water Level and Water Chemistry Data In the Conclusions and Recommendations of the report
on the Catfield Fen Investigation (AMEC 2012), there are recommendations for the installation of additional
dip wells and piezometers to depths of about 11 m bgl. I believe that it is essential that there is a least one site
with a dipwell and piezometer within the Fen. It is remarkable that the only comparison between field and
modelled results within the fen is at the University of Birmingham site for which data are only available from
1988 to 1990. I have not examined the chemical data.
Section 5 Pumping Test Results and Response to Operational Pumping. The analysis of the pumping test
data from the AWS Ludham source, which is reported in the Technical Note AMEC (2013a), is critically
reviewed in Comment PT Questions are raised about the suitability of a radial flow model when the
hydrogeology, topography and especially the extent of the fens are not radially distributed about the AWS
source. Furthermore, a physically unrealistic assumption at Layer 1 is introduced to reproduce the response of
a shallow piezometer. There is no explanation of how the interpretation of the pumping tests (using a 6 layer
radial flow model) has led to refinements in the way that the Crag aquifer is represented (using 3 layers) in
the NEAC model.
Section 6 Conceptual Understanding of the Area of Interest. The hydrogeological cross-sections are
informative, especially Fig. 6.4, 6.5 and 6.6. One process that is missing from the diagrams of interfluve areas
is runoff which can be significant on the Corton formation. Runoff can also occur on the exposed Crag.
In the conceptual cross-sections many drains and surface water bodies are shown on the fens with complex
interaction with the peat layers. From these cross-sections it is apparent that the peat layers need to be
included in the computational model with detailed representation of the interaction with drains and other
surface water bodies. The green arrows should be labelled evaporation and evapotranspiration. The extensive
areas of waterlogging or ponding in the fens during wet periods in the winter are not shown on the
hydrogeological cross-sections.
The complex flow processes in the interfluve areas and Ant Broads and Marshes are comprehensibly
described in the text and indicate the need for detailed models of the near surface conditions. However there
is no indication in the Summary Report that they are incorporated in the NEAC model.
Section 7 Numerical Model Representation of the Area of Interest. This section is severely lacking in
detailed information. The paragraph at the bottom of page 23 claims “that the NEAC model provides the most
appropriate tool which can be used to assess the hydrological impacts of abstraction. The EA believes that
AK/RG BA160514
Item 11 Page 14 of 25

the level of detail built into the model in terms of the layering and the grid size is adequate for predicting the
changes in water levels that occur in response to abstraction.”
The important question is not primarily whether the model can reproduce a limited number of changes in
water levels (which I presume means groundwater heads measured in boreholes or dip wells) but whether it
adequately represents both the groundwater flows in the aquifer system towards and into the fens and also the
detailed flow processes within the fens. The contrast between the detailed description of conceptual models in
Section 6 and the lack of information about the 200 m grid NEAC model in Section 7 is an issue of
considerable concern.
Comparison between model results and field data for three locations are presented in Figs 7.1 to 7.3; they are
discussed in detail in Comment C below. In the vicinity of and within the Fen, modelled groundwater heads
are constrained to be close to field values because a stream cell condition is applied at each of the fen cells
(this is deduced from the Technical Note Demonstration of the Effect of Grid Size). For each stream cell a
surface water elevation is imposed, with the result that the groundwater head in Layer 1 cannot be very
different from the enforced surface water elevation. Without a thorough examination, the field and modelled
results appear to be similar. However, a careful scrutiny shows significant differences as identified in
Comment C. None of the three examples exhibit a sufficiently close agreement between field and modelled
results to have confidence that the model does reproduce the important flow processes. Consequently, the
statement that “the model successfully captures the main features of the water table behaviour” is not
justified; especially in the fens.
Far more information is needed about how the components of conceptual models are idealised and included in
the computational model. What are the horizontal and vertical hydraulic conductivities and the storage
coefficients of the individual layers? How are the Phragmites peat and the Brushwood peat represented (see
Fig. 6.4). How is the recharge through the Corton formation estimated (it is not sufficient to say that the 4R
model is used, real information is required). From information in the Technical Note on the effect of the grid
size, I assume that the cells in the fens are all connected to stream cells. How are the stream coefficient
estimated for areas of 200 m by 200 m in the light of the complexity of the water features in the fens? These
are some of the issues which need to be explained.
The Technical Note on the “Demonstration of effect of grid size” shows that the representation of a river
using a smaller grid spacing does have a substantial effect on both groundwater heads and flows within the
aquifer system; a more detailed discussion can be found in Comment GS. In the Technical Note a
representative problem is introduced which includes features typical of the Catfield Fen area. Solutions are
obtained for grid spacings including 200 m and 10 m. For each 200 m cell in the fen area a stream condition
is enforced. When the 10 m grid is used, similar results to the 200 m grid spacing can only be obtained if the
entire area is covered with stream cells, which is equivalent to 20 streams at 10 m spacing. When a single
stream is included in the 10 m mesh model with the stream bed conductances providing the same overall
resistance to the transfer of water, groundwater heads are substantially higher. This confirms that the
numerical model with a grid spacing of 200 m is unable to represent features such as individual streams (or
ditches); consequently the 200 m grid does not provide an adequate representation of conditions in the fens.
The Technical Note on the Soil Moisture Calculation Method presents an interesting approach for including
the effect of a capillary rise of water; it is reviewed in Comment SM below. However, capillary rise is only
one of the processes which need to be included; ponding of water is likely to be more significant. In one of
the examples used to illustrate the results, Fig. 5.3 of the Technical Note, information about the ground level
at that dipwell is ignored. In subsequent diagrams of groundwater levels and soil moisture conditions, the
base of the root zone in the calculations appears to be set at approximately the actual ground elevation. An
appropriate procedure for representing hydrological and hydrogeological conditions within the fens must be
developed and explained clearly.
Section 8 Overall Understanding of Hydrological Behaviour
My comments on this section will be brief because I do not consider that the groundwater model, and
especially the representation of conditions in the fens, warrants the use of the model for detailed analyses of
hydrological conditions in the fens. Within a cell in the groundwater model there are many features, each
with a hydrological response; an average response over a cell 200 m by 200 m cannot represent the detailed
processes occurring in the fens and influencing habitat features. In Fig 8.6 etc., what are the units of “Vertical
AK/RG BA160514
Item 11 Page 15 of 25

Flow between Layers”; I will assume that they are the same as for Fig. 8.1, “Flow to L1; Assessment Cell G”
i.e. m3/d. They have more meaning if expressed as mm/d. For a 200 m by 200 m grid, 10 m
3/d is equivalent
to 0.25 mm/d.
With reference to Figs 8.1 to 8.5, the Discharge to Stream is presumably the flow through a stream cell; in the
context of the fens, it does not appear to have a clear physical meaning. A stream cell is a ‘computational
device’ which provides a modelled transfer of water between an aquifer and a surface water body. In using a
stream cell, is the surface water level always held at a constant value with time (this is not what occurs in the
field)? For a comprehensive water balance, information must be provided about the recharge. A diagram of
the components of the water balances used to prepare Figs 8.1 to 8.5 would help in the interpretation of the
results. As explained in Comment SM, the lowest graph in these figures, concerning the soil moisture, is
unlikely to be correct since it does not appear to include the effect of ponding which occurs most winters. I
have not reviewed Section 8.2.
I have not reviewed Section 9 or Section 10 although I did note in Section 10.1 Abstraction at 50% long term
average recharge. To estimate 50% of long term recharge, it is necessary to define a catchment area which
provides water to the pumping stations and the fens; how has this area been selected? A recharge estimate
involves identifying how much water actually reaches the aquifer in locations where the Corton and Breydon
formations overlie the Crag.
My Conclusions
The purpose of this review is to consider whether the models referred to in the Summary Report adequately
represent both groundwater conditions in the Crag aquifer and the hydrology of the fens. The Summary
Report, the associated Technical Notes and the Catfield Fen Report (AMEC 2012) have all been considered.
Due to a lack of detailed information about the NEAC model in the area of interest, I have made some
assumptions about the modelling which may not be strictly correct, but they are unlikely to effect the overall
conclusions of this review.
There are several limitations in the approach adopted including:
an unsatisfactory analysis of test pumping and a failure to explain how the radial flow model results
are incorporated in the NEAC model,
failure to take note of field information, for example ground surface elevations and the elevation of
the base of the rooting zone,
conceptual models which fail to take account of certain conditions in the fens such as ponding,
unsatisfactory representation in the numerical model of hydrological conditions at the surface of the
fen including ponding,
failure to critically compare field and modelled hydrographs to identify reasons for differences,
in certain locations there are insufficient groundwater head hydrographs to asses the ability of the
model to reproduce field conditions. Piezometers into the Crag underneath the fens are essential for a
check on the adequacy of the model responses and also for identifying changing field conditions.
failure to appreciate the implications of the results for different grid sizes which show that it is
necessary to have a fine grid to represent features such as individual drains in the fens and their effect
on groundwater levels within marsh blocks.
The conceptual models in Section 6 are helpful. However they need to be developed further with parameter
values for the different strata, an indication of how drains function and an explanation of all the surface water
processes. The preparation of quantified conceptual models should be followed by a consideration of what
approximations and idealisations can be made in formulating computational models which represent all the
important hydrogeological and hydrological processes. This will also involve identifying a grid spacing
which can represent, in sufficient detail, the complex features in the fens including the spatio-temporal
variability in soil-water regimes that influence species and habitat suitability. The final step is to consider
how the outline computational model can be included in existing packages or whether modifications need to
be made. This proposed modelling process is a summary of the approach that is recommended in
Environment Agency W213 (2002).
AK/RG BA160514
Item 11 Page 16 of 25

Since the above approach has not been followed, results from the modelling are not reliable. Some of the
limitations of the groundwater model described in the Summary Report are discussed above; the Comments
which follow the References explain these issues in more detail.
This issue of regional groundwater modelling and associated detailed studies of smaller areas is not unusual.
One standard reference is Ward et al. (1987) where a telescopic mesh refinement technique is introduced.
Information can also be found in Anderson and Woesssner (1992) and Rushton (2003). An alternative
approach is the ZOOM model (Spink et al. 2003). Valuable insights including grid refinement and the
representation of wetlands can be found in Gellatly et al. (2012). Information about the representation of fens
containing drains can be obtained from a study of the neighbouring Upper Thurne catchment (Simpson et al.
2010, 2011).
References
Anderson MP, Woessner WW. 1992. Applied Groundwater Modelling, Academic Press.
de Silva CS, Rushton KR. 2008. Representation of rainfed valley ricefields using a soil–water balance model.
Agricultural Water Management 95:271–282.
Environment Agency (2002) Groundwater Resources Modelling: Guidance Notes and Template Project Brief.
R&D W213.
Gellatly SC, Raynor ME, Gren CJE, Neve PS. 2012. Using and refining an existing regional groundwater
model to assess the impacts of an abstraction on a nearby wetland. In: Shipley, M.G., Whiteman, M.I.,
Hulme, P.J. & Grout, M.W.(eds) Groundwater Resources Modelling: A case study from the UK. Geological
Society, London, Special Publications 364:333-351.
Rushton KR. 2003. Groundwater Hydrology: Conceptual and Computational Models, Wiley, Chichester.
Simpson TB, Holman IP, Rushton KR. 2010. Understanding and modelling spatial drain-aquifer interactions
in a low-lying coastal aquifer – the Thurne catchment, Norfolk, UK. Hydrological Processes, 25(4):580-592.
DOI: 10.1002/hyp.7845.
Simpson TB, Holman IP, Rushton KR. 2011. Drainage ditch-aquifer interaction with special reference to
surface water salinity in the Thurne catchment, Norfolk, UK. Water and Environmental Journal, 25:116-128.
doi:10.1111/j.1747-6593.2009.00195.x
Spink AEF, Jackson CR, Hughes AG, Hulme PJ. 2003. The benefits of object oriented modelling
demonstrated through the development of a regional groundwater model. in Poeter E, Zheng C, Hill M,
Doherty J (eds) MODFLOW and More, Understanding through Modelling – Conference Proceedings, 336-
340.
Ward DS, Buss DR, Mercer JW, Hughes SS. 1987. Evaluation of a groundwater corrective action of the
Chem-Dyne Hazardous Waste site using a telescopic mesh refinement modeling approach, Water Resources
Research, 23(4):603-617.
AK/RG BA160514
Item 11 Page 17 of 25
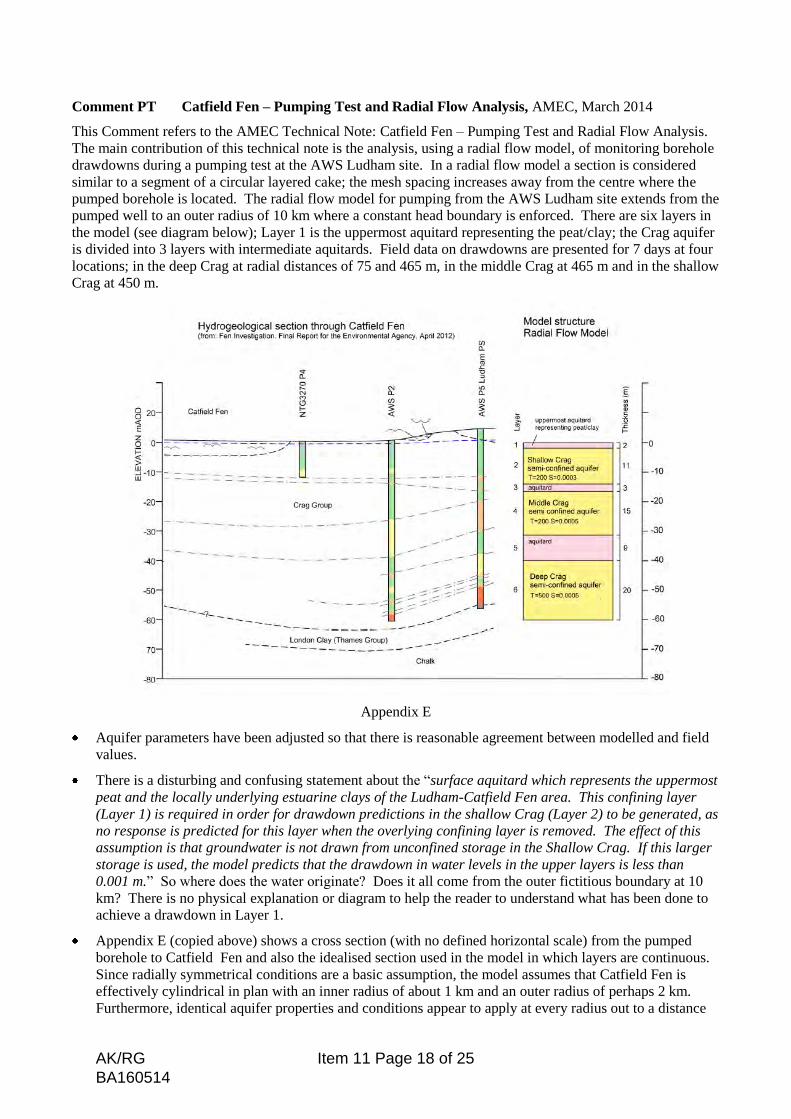
Comment PT Catfield Fen – Pumping Test and Radial Flow Analysis, AMEC, March 2014
This Comment refers to the AMEC Technical Note: Catfield Fen – Pumping Test and Radial Flow Analysis.
The main contribution of this technical note is the analysis, using a radial flow model, of monitoring borehole
drawdowns during a pumping test at the AWS Ludham site. In a radial flow model a section is considered
similar to a segment of a circular layered cake; the mesh spacing increases away from the centre where the
pumped borehole is located. The radial flow model for pumping from the AWS Ludham site extends from the
pumped well to an outer radius of 10 km where a constant head boundary is enforced. There are six layers in
the model (see diagram below); Layer 1 is the uppermost aquitard representing the peat/clay; the Crag aquifer
is divided into 3 layers with intermediate aquitards. Field data on drawdowns are presented for 7 days at four
locations; in the deep Crag at radial distances of 75 and 465 m, in the middle Crag at 465 m and in the shallow
Crag at 450 m.
Appendix E
Aquifer parameters have been adjusted so that there is reasonable agreement between modelled and field
values.
There is a disturbing and confusing statement about the “surface aquitard which represents the uppermost
peat and the locally underlying estuarine clays of the Ludham-Catfield Fen area. This confining layer
(Layer 1) is required in order for drawdown predictions in the shallow Crag (Layer 2) to be generated, as
no response is predicted for this layer when the overlying confining layer is removed. The effect of this
assumption is that groundwater is not drawn from unconfined storage in the Shallow Crag. If this larger
storage is used, the model predicts that the drawdown in water levels in the upper layers is less than
0.001 m.” So where does the water originate? Does it all come from the outer fictitious boundary at 10
km? There is no physical explanation or diagram to help the reader to understand what has been done to
achieve a drawdown in Layer 1.
Appendix E (copied above) shows a cross section (with no defined horizontal scale) from the pumped
borehole to Catfield Fen and also the idealised section used in the model in which layers are continuous.
Since radially symmetrical conditions are a basic assumption, the model assumes that Catfield Fen is
effectively cylindrical in plan with an inner radius of about 1 km and an outer radius of perhaps 2 km.
Furthermore, identical aquifer properties and conditions appear to apply at every radius out to a distance
AK/RG BA160514
Item 11 Page 18 of 25
of 10 km. An examination of Figure B2 of the AMEC Catfield Fen Investigation Final Report (April
2012) shows that the assumption of radial symmetry is far from correct. Also Section 4.2 of that report
indicates that the layering may be discontinuous.
It is unclear what condition is applied in the model at the uppermost aquitard which represents peat/clay
There are two aquitards within the Crag, the upper one 3 m thick with a vertical permeability of 0.0008
m/d, the lower aquitard is 9 m thick with a vertical permeability of 0.004 m/d. These vertical
permeabilities used in the radial flow model are very low, especially the upper aquitard. With horizontal
hydraulic conductivities of the aquifer in excess of 10 m/d, this very low permeability aquitard forces the
effect of pumping to spread to significant radial distances.
A more reliable and informative analysis of this pumping test could be carried out with a three-
dimensional model, similar to that used for the NEAC model, with a finer mesh spacing in the vicinity of
the pumped borehole, with a radial flow correction at the cell containing the pumped well and with
boundary conditions deduced from the regional model. This approach would allow a far more realistic
representation of ground surface/water table conditions.
AK/RG BA160514
Item 11 Page 19 of 25

Comment C Comparison between simulated and field data for the three locations.
This Comment critically examines the three figures in Section 7 which compare simulated and field data.
Fig. 7.1 of the Summary Report refers to groundwater heads recorded in piezometers at depths of 3.0 and
9.0 mbgl in Middle Marsh from August 1988 to October 1990; these results are compared with NEAC
results for Layer 1 and Layer 3. A note on Fig.7.1 suggests that observed and simulated groundwater
levels show an upward vertical gradient of approximately equal magnitudes (information is not provided
about the difference in elevations of Layer 1 and 3). However, a careful examination of the results in Fig.
7.1 (especially for 1990) indicates that the differences between shallow and deep piezometers are often
not replicated by the differences in the corresponding model results. Consequently the model does not
accurately reproduce the observed head differences in the piezometers.
Fig 7.2 is concerned with a dip well on the Butterfly Conservation Reserve. The figure fails to indicate
that ground level is 0.371 mAOD (Table E22, AMEC 2012); for several months each year the water level
in this dipwell is above ground surface indicating ponding of water. Does the numerical model simulate
ponding; are capillary rises simulated? The general form of the fluctuations for field and computational
model are roughly similar, but for certain periods there are significant differences with the modelled
fluctuations substantially larger than those observed in the field.
In Fig. 7.3 comparisons are made between three piezometers in Sharp Street at depths of 10, 27 and 61 m
below ground level. As explained in the box below the figure, the field results indicate downwards flow
due to abstraction from AWS Ludham at a distance of about 400 m. However the downward flow
throughout the upper part of the Crag is not reproduced in the numerical model. From the model results
there is an upward flow from Layer 2 which is the upper part of the Crag to the water table in Layer 1
AK/RG BA160514
Item 11 Page 20 of 25

which is located in a sand layer with some gravel (Layer 1 from Appendix I AMEC 2012). On the other
hand, the model does shows a downwards flow from the upper (Layer 2) to the lower Crag, Layer 3. The
note on Fig. 7.3 explains that in the numerical model, Layer 1 simulates the shallow peat deposits on the
arm of the fen leading to Crome’s Broad (also called Snipe Marsh) and therefore fails to represent the true
physical situation for the piezometers (in fact an examination of Fig. 1.2 suggests that the shallow peat
deposits are only a small part of that grid square). If a closer grid spacing was used it would be possible
to represent the actual field conditions at the location of these piezometers.
AK/RG BA160514
Item 11 Page 21 of 25

Comment GS: Catfield Fen – Demonstration of the Effect of Grid Size on Model Predictions, AMEC
(2014).
This Comment refers to the AMEC Technical Note: Catfield Fen – Demonstration of the Effect of Grid Size
on Model Predictions. The Introduction to this Technical Note states that “the NEAC groundwater model has
been used to estimate the effects of abstraction on the hydrological functioning of Catfield Fen. A query has
been raised suggesting that the estimated effect may be partly dependent on the grid size of the NEAC model
(which is set to 200 m by 200m), and that the estimates might be different if a smaller grid size had been used.
This Technical Note describes an investigation into the effects of refining spatial discretisation on
groundwater model predictions.” In summary, results from a 200 m by 200 m grid demonstration model are
rerun with finer grid models of 100 m by 100 m and 10 m by 10 m.
Unfortunately the author fails to grasp the widespread concern that the complex hydrological and
hydrogeological conditions of Catfield Fen cannot be represented by a model which assumes that only one set
of conditions apply over the whole of each 200 m by 200 m plan area. The 200 m by 200 m grid does not
allow the representation of individual drains, ponds, sluices etc.
Since this Technical Note fail to address the questions raised, most of the findings are of little value.
However, there is one aspect which provides insights into the ability of the 10 m by 10m grid to represent the
detailed behaviour within the fens. In the 200 m by 200 m grid model, groundwater–surface water interaction
is controlled by stream cells in which the flow between the aquifer and surface water equals the stream bed
conductance multiplied by the difference between the groundwater head and the surface water elevation.
Consequently the entire surface area of the cell is a stream. However, with the 10 m by 10 m grid, streams
can be located along a line of individual cells with the remaining area without streams. With the finer grid,
stream bed conductances are adjusted so that the overall resistance to the transfer of water between
groundwater and surface water is the same as for the 200 m by 200 m grid..
For the fine grid model, if every cell is a river cell, there is little difference between the groundwater head
distribution for the fine and coarse grid models. If, however, streams are positioned on every 20th row (i.e.
one stream, 200 m long, for each of the original 200 m by 200 m cells) with the stream bed conductances
providing the same overall resistance to the transfer of water (run 13 in Fig. 6 which is copied above)
groundwater heads are 3 to 4 m higher than the reference (run 7). In the Technical Note, attempts are
AK/RG BA160514
Item 11 Page 22 of 25

described of adjusting aquifer parameters in the fine grid model with the single stream, to reproduce the 200 m
by 200 m groundwater heads; this can almost be achieved (run 18.5), but only by increasing the hydraulic
conductivity one-hundred fold!
It is difficult to understand why the author of this Technical Note does not acknowledge that the 200 m by 200
m grid model cannot represent the detailed responses when there are individual streams (the realistic field
situation). It is only when twenty streams are located at 10 m intervals over the entire area of the Fen that the
same results as the 200 m by 200 m model are obtained.
In the Conclusions the author is correct in recognising that for the 10 m grid size, realistic representation of
fen compartments can be achieved “A feature of the 10 m grid size model with stream cells 200 m apart,
which provides the most realistic representation of fen compartments bounded by watercourses, is that it had
to be adjusted to compare with the water levels generated from the reference model.” However the second
half of that sentence and the next sentence are misleading and unsafe; “This is acceptable and reflects the
process of calibration that would be undertaken in the development of a bespoke fine grid model for the
Ludham-Catfield area.”
I consider that there is sufficient field information for a fine grid model of the Ludham-Catfield area to be
developed; it would not involve the unrealistic model calibration described in this Technical Note. A
methodology for including features of drained fens in regional groundwater models has been developed for an
investigation into drain-aquifer interaction in the adjacent Upper Thurne catchment (Simpson et al. 2010,
2011). There are differences from Catfield Fen, the study area of the Upper Thurne is larger and the drains
are more widely spaced. Nevertheless, the Upper Thurne study highlights the need to represent individual
features of drained fens in groundwater models.
AK/RG BA160514
Item 11 Page 23 of 25

Comment SM Review of Soil Moisture Calculation Method, AMEC (2013).
This Comment refers to the AMEC Technical Note: Review of Soil Moisture Calculation Method; although
the methodology is said to be prepared for the Environment Agency Anglian Region, the examples quoted in
the Technical Note refer to Catfield Fen. In the Groundwater Summary Report this Technical Note is
described as “Soil moisture assessment which builds on the water level and flow results generated from the
groundwater model”. The Technical Note describes processes which might be of significance in the fens
when the water table is some distance below the ground surface. However, it is not clear whether the
technique can be used when the water table is at or above the ground surface when ponding occurs.
Fig. 2.1 of the Technical Note illustrates the capillary rise of water from a water table (which is below the root
zone) upwards to the root zone. Is this the only condition for which this approach is applicable? Alternative
approaches in the literature for estimating the capillary rise are quoted.
A conceptual diagram is urgently required which illustrates the real conditions on the surface of a fens
showing all the component processes including precipitation, evapotranspiration or evaporation from ponded
water, the transfer of water laterally including to drains and variations in the extent of the saturated zone.
Returning to the approach described in this Technical Note, Fig. 5.3, copied below, shows both the field and
modelled hydrographs for TG32/617b. However, in Fig. E22 of AMEC (2012), ground level at this location
is quoted as 0.371 mAOD; I have added this ground level elevation to Fig. 5.3. Both the field and modelled
results indicate that the water level is above the ground surface for many months each winter. Consequently I
cannot understand how, in Fig. 5.7 of the Technical Note (also copied below), the moisture content does not
equal 100% for these periods. Is the ground surface elevation included in the calculation method of Section
4? From a comparison of the vertical scales of Fig 5.3 and the upper diagram of Fig. 5.7, it appears that the
base of the root zone in the computational model is mistakenly set close to the actual ground level in the fen.
AK/RG BA160514
Item 11 Page 24 of 25

Ponding of water occurs regularly in certain parts of the fen; is it represented in the NEAC model? de Silva
and Rushton (2008) describe a study of flooded ricefields using a soil water balance model which incorporates
ponding. In ricefields, ponding occurs because downward movement of water out of the bottom of the soil
layer is restricted due to the presence of a puddled layer. In the water balance calculation, negative soil
moisture deficits represent ponding. A limit is placed on the negative soil moisture value; if it becomes too
high, this is equivalent to overtopping the bund.
My conclusion about this Technical Note is that, although the inclusion of capillary effects in a soil moisture
calculation may be important when water tables are lower, the methodology in this Technical Note fails to
represent conditions in fens which often become waterlogged.
AK/RG BA160514
Item 11 Page 25 of 25