Categorical perception of facial expressions of emotion...
26
Categorical perception of facial expressions of emotion: Evidence from multidimensional scaling David Bimler and John Kirkland Massey University, New Zealand Recent studies have shown that the perception of facial expressions of emotion fits the criteria of categorical perception (CP). The present paper tests whether a pattern of categories emerges when facial expressions are examined within the framework of multidimensional scaling. Blends of five ‘‘pure’’ expressions (Angry, Sad, Surprised, Happy , Neutral) were created using computerised ‘‘morphing’’, providing the stimuli for four experiments. Instead of attempting to identify these stimuli, subjects described the proximities between them, using two quite different forms of data: similarity comparisons, and sorting partitions. Multidimensional scaling techniques were applied to integrate the resulting ordi- nal-level data into models which represent the interstimulus similarities at ratio level. All four experiments yielded strong evidence that the expressions were perceived in distinct categories. Adjacent pairs in the models were not spaced at equal intervals, but were clustered together as if drawn towards a ‘‘perceptual magnet’’ within each category. We argue that spatial representations are compa- tible with CP effects, and indeed are a useful tool for investigating them. One attempt to systematise the diversity of human facial expressivity centres on prototype expressions corresponding to a small number of discrete basic- emotion categories. These prototypes are configurations of facial-feature displacements, produced by well-defined combinations of muscle contractions. Tomkins (1962) argued that certain facial behaviours have evolved to meet different survival needs and warrant the status of ‘‘primary affects’’. Evidence has since accumulated that these configurations maximise the rate of correct responses in forced-choice identification (Izard, 1971; Ekman, Friesen, & COGNITION AND EMOTION, 2001, 15 (5), 633–658 Correspondenc e should be addressed to John Kirkland, PhD, Department of Health and Human Development, Massey University, Private Bag 11-222 Palmerston North, New Zealand. We are especially grateful to Professor P. Ekman who granted permission for use of facial expression photographs, and who generousl y performed the FACS analyses described in the text. Robyn Surville and Sheryn Lane performed the arduous task of morphing the stimuli. We are grateful for the cooperation of the local high schools which allowed their students to participate in Experi- ment 4, and of course to the participants themselves. We would also like to thank David Matsumoto for his very helpful comments on previous versions of this article. # 2001 Psychology Press Ltd http://www.tandf.co.uk/journals/pp/02699931.html DOI:10.1080/02699930143000077
Transcript of Categorical perception of facial expressions of emotion...
Categorical perception of facial expressions ofemotion: Evidence from multidimensional scaling
David Bimler and John KirklandMassey University, New Zealand
Recent studies have shown that the perception of facial expressions of emotion fitsthe criteria of categorical perception (CP). The present paper tests whether apattern of categories emerges when facial expressions are examined within theframework of multidimensional scaling. Blends of five ‘‘pure’’ expressions(Angry, Sad, Surprised, Happy, Neutral) were created using computerised‘‘morphing’’, providing the stimuli for four experiments. Instead of attempting toidentify these stimuli, subjects described the proximities between them, using twoquite different forms of data: similarity comparisons, and sorting partitions.Multidimensional scaling techniques were applied to integrate the resulting ordi-nal-level data into models which represent the interstimulus similarities at ratiolevel. All four experiments yielded strong evidence that the expressions wereperceived in distinct categories. Adjacent pairs in the models were not spaced atequal intervals, but were clustered together as if drawn towards a ‘‘perceptualmagnet’’ within each category. We argue that spatial representations are compa-tible with CP effects, and indeed are a useful tool for investigating them.
One attempt to systematise the diversity of human facial expressivity centres onprototype expressions corresponding to a small number of discrete basic-emotion categories. These prototypes are configurations of facial-featuredisplacements, produced by well-defined combinations of muscle contractions.Tomkins (1962) argued that certain facial behaviours have evolved to meetdifferent survival needs and warrant the status of ‘‘primary affects’’. Evidencehas since accumulated that these configurations maximise the rate of correctresponses in forced-choice identification (Izard, 1971; Ekman, Friesen, &
COGNITION AND EMOTION, 2001, 15 (5), 633–658
Correspondence should be addressed to John Kirkland, PhD, Department of Health and HumanDevelopment , Massey University, Private Bag 11-222 Palmerston North, New Zealand.
We are especially grateful to Professor P. Ekman who granted permission for use of facialexpression photographs, and who generously performed the FACS analyses described in the text.Robyn Surville and Sheryn Lane performed the arduous task of morphing the stimuli. We are gratefulfor the cooperation of the local high schools which allowed their students to participate in Experi-ment 4, and of course to the participants themselves. We would also like to thank David Matsumotofor his very helpful comments on previous versions of this article.
# 2001 Psychology Press Ltdhttp://www.tandf.co.uk/journals/pp/02699931.html DOI:10.1080/02699930143000077

Ellsworth, 1972). They convey similar emotions in a range of cultures, sup-porting the thesis that they are innate (Ekman, 1994). These widely replicatedfindings suggest a categorical structure to the domain of facial expressions(FEs). Neurological conditions that selectively disrupt recognition of differentFEs suggest that the neural pathways subserving FE recognition are not the samefor all emotion categories (Adolphs, Tranel, Damasio, & Damasio, 1994), so onemight speak of detection mechanisms ‘‘tuned’’ to each prototype.
There is also evidence for an alternative approach, in which the affectivecontent of FEs are analysed into continuously varying attributes that can betreated as the dimensions of a spatial model (e.g., Nummenmaa, 1992; Russell &Bullock, 1986). Woodworth (1938) located expression categories along a con-tinuum to reflect the systematic nature of the misidentifications among them.The techniques of factor analysis and multidimensional scaling (MDS) are oftenused to reconstruct such models from the pattern of similarities among FEstimuli, with misidentifications (Osgood, 1966), dissimilarity judgements(Paramey, Schneider, Josephs, & Slusarek, 1994), or triadic ‘‘odd-one-out ’’judgements (Alvarado, 1996; Gladstones, 1962) providing the information. Thisdimensional account is compatible with ‘‘relativity effects’’, in which the way astimulus is perceived changes when viewed in the context of expressions fromdifferent categories (Russell & Fehr, 1987). Such effects can also be accom-modated within the categorical framework as adaptation or fatigue of specificdetection mechanisms (Prkachin & Prkachin, 1994). In another context effect,significant changes to the emotion seen in a FE are brought about by a briefdescription of what the poser has just experienced (Carroll & Russell, 1996).This is hard to reconcile with a strongly categorical model in which stimuli areassigned to categories at an early stage of perception.
Much of the evidence for the categorical perspective was acquired withforced-choice identification, in which subjects use a restricted list of emotionterms (for instance, Anger, Sadness, Surprise, Happiness, Fear, Disgust, andperhaps Contempt) to identify FEs. The procedure is open to methodologicalcriticism (Russell, 1994). For instance, the apparent universality of the cate-gories across cultures may merely demonstrate that equivalents for the emotionterms can be found in different languages, and that informants concur in the useof those equivalents; it does not show them to be universally ‘‘basic’’. Theprocedure has been defended (Ekman, 1994) and extended (Haidt & Keltner,1999). However, it would be helpful to test the claims of the categorical per-spective using the MDS technique more familiar within the dimensional tradi-tion, and that is the approach taken in the research reported here.
The debate reflects a parallel disagreement whether human affective statesare better characterised in terms of certain irreducible ‘‘basic emotions’’, or asmaller number of affective dimensions. For our purposes it is enough to notethe striking resemblance between MDS models of expressions, and the analo-gous maps of ‘‘emotion space’’ derived from the semantic similarities among
634 BIMLER AND KIRKLAND

emotion terms (Roberts & Wedell, 1994) and from the correlations within moodself-reports (Feldman, 1995). One way to account for this correspondence is toregard FEs as a communication channel, encoding information about the sig-naller’s emotional state (Osgood, 1966). Much of the interest in FEs is as ‘‘themind’s construction in the face’’: they are a way to study by proxy the domain ofemotions, the latter being less tractable to examination, for it is hard to presentobservers with standardised emotion stimuli. Any evidence as to whether thedifferences among expression categories are qualitative or quantitative carries acorollary that the situation among emotions is similar.
There is no doubt that we categorise FEs; the moot point is whetherassignment to categories is a feature of perception, or of conceptual processing.A natural extension of the categorical perspective is to search for categoricalperception (CP) effects in the perception of FEs. The normal definitions ofcategorical perception entail two criteria: ‘‘A CP effect occurs when (1) a set ofstimuli ranging along a physical continuum is given one label on one side of acategory boundary and another label on the other side and (2) the subject candiscriminate smaller physical differences between pairs of stimuli that straddlethat boundary than between pairs which are within one category or the other’’(Harnad, 1987). As a corollary, a pair of stimuli that lie near the middle of acategory is harder to discriminate than another pair (objectively differing by thesame amount) near the boundary. In particular, imperfect instances of a per-ceptual category are perceived as better than they are, because of their similarityto a good instance. One can imagine a ‘‘focus’’ in each category—a prototypal,best-possible stimulus; less-good stimuli are displaced in its direction in theperceptual space. This is the concept of a ‘‘perceptual magnet’’ (Iverson &Kuhl, 1995), which differs from the CP formulation in placing more emphasison this reduced within-category discrimination, and less on the boundariesbetween categories.
The classic examples of categorical perception involve auditory domains:musical intervals, and phonemic stimuli such as vowels and consonants (Harnad,1987). The feature they have in common is a continuous perceptual ‘‘space’’which listeners perceive as a discontinuous series of categories. In musicalintervals and stop consonants, each stimulus is described by a single para-meter—the ratio between two tones, and the voice-onset time, respectively—defining a one-dimensional space, in which better or worse category membersare easily synthesised. In particular, one can create within-category and cross-category pairs, separated by the same interval.
The techniques of computerised ‘‘morphing’’ allow researchers the same finecontrol over facial expressions of emotion. Any two photographs of different‘‘pure’’ facial expressions (i.e., ones that viewers consistently identify asrepresenting a specific emotion) define a continuum: one can interpolatebetween them, creating a sequence of intermediate steps, each one differing bythe same amount from the adjacent step. If CP applies to facial expressions, then
CATEGORICAL PERCEPTION OF FACIAL EXPRESSIONS 635

a blended stimulus (e.g., 30% of one expression plus 70% of the other) will beprimarily perceived as one or the other extreme. The dominant category willobscure the contribution of the minor component, reducing the perceiveddifferences between adjacent steps at the ends of the sequence as the stimulibunch up towards the endpoints, and increasing the differences across thecategory boundary.
To test the above criteria of CP, two types of tasks are typically applied:identifying each stimulus with an appropriate label, and making Same/Differentor forced-choice ABX judgements about pairs of items to measure theirdiscriminability. Some studies have carried over from auditory precedents theprocedure of presenting in sequence the stimuli to be discriminated, or judged as‘‘same’’ or ‘‘different’’. This leaves open the possibility that the appearance ofcategories is a feature of short-term memory load rather than of perception:Sequential presentation strengthens CP, by forcing subjects to encode stimulibefore comparing them, losing potential intra-category distinctions in the pro-cess. Thus, Iverson and Kuhl (1995) found that CP effects for vowels increasedwhen longer intervals separated the stimuli. Parallel presentation allows strongerconclusions to be drawn.
Etcoff and Magee (1992) applied this approach to line drawings of expres-sions. Eight continua were used, each continuum comprising 11 stimuli (twopure expressions plus blends interpolated at 10% intervals). Labelling and ABXtasks provided evidence for greater discrimination across category boundaries.Subsequent studies have used photographic-quality computer-manipulated(morphed) images for stimuli, and measured reaction times as well as accuracyfor discrimination of each pair. Calder, Young, Perrett, Etcoff, and Rowland(1996) replicated those results with six continua. In their Experiment 4, Calder etal. used a same/different judgement task in which pairs of stimuli were presentedsimultaneously. De Gelder, Teunisse, and Benson (1997) took additionalprecautions to exclude non-CP explanations. For children as well as adultobservers, stimuli were most easily discriminated around category boundaries(i.e., the point on each continuum where identification reached 50%). Finally,Young et al. (1997) collected data for an exhaustive set of 21 continua.
In a departure from those meticulous studies, the present study tests for CPeffects by importing quite different procedures for data collection and analysis,from a different research tradition. Morphed facial expressions were examinedusing MDS to analyse the relative similarities of different pairs of stimuli.1 MDSprovides a spatial model of the data in which each stimulus is represented by a
1 For an earlier application of MDS to impure, blended expressions, see Nummenmaa (1992).That study tested whether more than one emotion could be expressed simultaneously, and whichcombinations are mutually compatible. It is not clear whether the actors’ expressions could bedescribed as interpolations between extremes (in the sense that an increase in the contribution ofexpression A was accompanied by a decrease in the intensity of expression B).
636 BIMLER AND KIRKLAND

point xi. If CP effects contribute to the perception of facial affect, then thesubjective distances reconstructed between morphed expressions in the MDSsolution will differ from the objective differences used in creating them, with thexi corresponding to the i-th morphed expression displaced towards the focus ofthe category it belongs to; this would manifest as a clumping of points aroundthe prototypes.2
In four experiments, we collected data about the dissimilarities perceivedamong expressions. If the values of dij (the perceived dissimilarities) weremeasured to sufficient accuracy, they could be compared directly with theunderlying objective differences. But in these experiments the observationswere: (a) ordinal-level; (b) incomplete (not every comparison between onedissimilarity and another was made); and (c) limited in reliability by the dis-cernment of the observers. A triadic procedure was followed in Experiment 1,and a ‘‘quartet’’ procedure in Experiment 2, using two separate sets of stimuli,31 in each. In Experiment 3, data were collected in a different form: a sortingprocedure was applied to both sets of stimuli. Experiment 4 extended the sortingprocedure by applying it to the two sets together.
The role of MDS is to integrate these imperfect data. Each dij (we write dij forthe reconstructed distance between the i-th and j-th stimulus points) is a ratio-level estimate of the subjective dij for those stimuli, determined by all theproximity data, not just the judgements for that particular pair of i, j. MDS rulesout combinations of dij which are consistent with the data but cannot beembedded within a space of the specified dimensionality. As well as spatialmodels, the data were modelled with hierarchical ‘‘trees’’. A tree representationof similarity data consists of nodes corresponding to the stimuli Ei (thesecomprising the ‘‘leaves’’ of the tree), and a branching structure of links. Thedistance dij is defined as the total length of the links one traverses in movingbetween the nodes for Ei and Ej. A tree model is evidence for CP if the nodes arearranged in a structure of distinct branches, corresponding to the categories.
If CP effects do emerge within the multidimensional framework, this isstrong evidence that categories play a key roà le at some stage in the processing ofFE stimuli. It is worth emphasising that the existence of categories or perceptualmagnets is fully compatible with an analysis of expressions in dimensionalterms. An analogy is often drawn with the domain of colour perception (Etcoff& Magee, 1992; Young et al., 1997), and here the evidence for CP effects(Davies & Corbett, 1997; Kay & Kempton, 1984) and the existence acrosscultures of consistent ‘‘focal colours’’ supplement rather than supplant the
2 The category foci do not necessarily coincide with the ‘‘pure’’ expressions used here as proto-types. It may be that a ‘‘pure’’ stimulus can only approximate the focus of its category with the latterlying outside the range which actors can express. Calder, Young, Rowland, and Perrett (1997) foundthat computer-exaggerate d exemplars of expressions were recognised more rapidly, and rated asmore intense, than the unexaggerated images.
CATEGORICAL PERCEPTION OF FACIAL EXPRESSIONS 637

widely accepted opponent-process theory (featuring a red/green and a blue/yellow dimension).
Morphed stimuli offer the potential to improve models of ‘‘expressionspace’’, and a secondary purpose of this research is to exploit that potential.When observers compare expression prototypes (Paramey et al., 1994), theaccuracy of their judgements is arguably limited by the size of the dissimilaritiesinvolved. Here, they judge the small dissimilarities between adjacent morphs aswell. Note also that these stimuli can rule out models of insufficient dimen-sionality, for two-dimensional spatial models make the specific, falsifiableprediction (Young et al., 1997) that at least one continuum exists, such thatparticular morphs along it fall into some third category, rather than the cate-gories of either of the end-point ‘‘pure’’ FEs.
EXPERIMENT 1: F-SERIES. TRIADIC DATA
Subjects
Thirteen subjects were recruited informally (eight women, five men). All wereaged 30 to 45.
Stimuli
Five ‘‘pure’’ expressions were selected: items e57, e58, e61, e63, e65 fromEkman and Friesen (1976). These expressions exemplify the emotional statesHappy, Surprised, Angry, Sad—providing two each with a positive and anegative valence—and Neutral (we are in the process of adding Afraid andDisgusted to this assortment). The five exemplars are portrayed by the samewoman. In addition, the items are similar in terms of lighting, angle, etc., leavingthe expressions themselves (in the form of displacements of easily located faciallandmarks) as the only way they differ.
These pure stimuli can be paired in ten ways. Equally spaced sequences,comprising 26 morphs in total, were interpolated between these pairs of end-points. Using Em to indicate a morphed stimulus, composed from pure stimuli Ea
and Eb, we can write
Em = pm Ea + (17pm) Eb. (1)
Labels were given to each Em , indicating the respective Ea, Eb, (17pm) (seeTable 1). Figure 1 illustrates six of these stimuli: the pure expressions for Sadand Surprised, and four images interpolated between them. An independentdescription of the images (P. Ekman, personal communication) using the FACSsystem of Facial Action Units is as follows:
638 BIMLER AND KIRKLAND

Sa 1b+15a sadSaSu20 1b+5a sad/surprisedSaSu40 1a+5a+25 surprised/sadSaSu60 1+2+5a+26 surprisedSaSu80 1+2+5b+26 surprised, stronger than previousSu 1+2+5c+26 surprised, even stronger than previous.
The pure and morphed images together, 31 stimuli in total, comprise the F-series. The same procedure was followed with a second set of five exemplarsfrom Ekman and Friesen, portrayed by a man (items e105, e101, e103, e110,e107). This yielded the M-series of images, which have the same values for Ea,Eb, pm as the F-series.
The morphing procedure described by Calder et al. (1996) was followed as aguideline. Morphing was undertaken by first scanning to digitise monochromeslide images and subsequently applying suitable image-interpolation software(‘‘Design Studio’’), applying as many corresponding points as necessary tomake smooth transitions. Each printed image measured 5 6 8 cm.
Table 1 shows that the number of intermediate blends varies betweensequences. Only a single blend was interpolated for three pairs of pureexpressions: Happy-Neutral , Surprised-Happy , Angry-Surprised . When theexpression prototypes are arranged according to the circumplex model (Russell,Lewicka, & Niit, 1989), as a first approximation to an ‘‘expression space’’, thesepairs are immediate neighbours around a circle. They are known to be relativelysimilar, in the sense that an example of one member of a pair is likely to bemisidentified as the other. These three sequences are unhelpful for testing CP,although the single intermediate helps triangulate the MDS solution and con-tributes to the reliability of the measured dissimilarities for the other sequences.More intermediates were created for pairs of pure expressions that lie furtherapart in the circumplex: The Sad-Happy , Sad-Surprise, and Angry-Neutralsequences each contain four.
Figure 1. Example of the continua used in these experiments: Sad expression (L), Surprised (R),and four images interpolated at intervals of 20%.
CATEGORICAL PERCEPTION OF FACIAL EXPRESSIONS 639

Method
Subjects used a form of the triadic method (previously applied to facialexpressions by Alvarado, 1996; Gladstones, 1962). Subjects viewed items ingroups of three and indicated which of each three was the ‘‘odd-one-out ’’: ‘‘Foreach set, choose the photograph which is least similar to the other two photos’’.The items were described as ‘‘photographs’’ throughout, to disarm any suspi-cions as to their artificial nature. The wording of the instructions was designed toencourage subjects to reach a judgement on the basis of underlying emotion:‘‘ ‘Similarity’ in this case has the sense of ‘How similar are the emotionsexpressed in the photos?’ or ‘How similar are the person’s feelings?’ ’’
Triads were selected randomly. The subject created and judged 10 triads at atime, by shuffling the items and dealing them out into piles of 3 (leaving a singlecard, to be held over until the next shuffle). This procedure was repeated 12times so each subject made 120 judgements. Ignoring duplicated triads, the datathus consist of 13 6 120 triadic comparisons, out of the 31.30.29 / 6 = 4995possible combinations of 3 out of 31 items. A series of pilot studies revealed nodifference between random selection of triads, versus a Balanced IncompleteDesign, this being the usual procedure when a large number of items generatestoo many triads for each subject to view exhaustively.
Subjects found the task fatiguing. Some reported that dissimilarities soonbecame difficult to assess, so that their odd-one-out judgements became aprocess of assigning emotion labels to each item and choosing the cogni-tively least-similar emotion. They were encouraged to take as many breaksas they required for unstereotyped responses. The self-randomising proce-dure allowed subjects to take the items home where they could respond to
TABLE 1Codes for five pure expressions and 26 morphs, showing number of morphs in eachsequence (above diagonal) and descriptive codes for each morph (below diagonal)
A Sa Su H N
Angry (A) – 2 1 3 4
Sad (Sa) ASa33, ASa66 – 4 4 3
Surprised (Su) ASu50 SaSu20, SaSu40,SaSu60, SaSu80
– 1 3
Happy (Ha) AH25, AH50,AH75
SaH20, SaH40,SaH60, SaH80
SuH50 – 1
Neutral (N) AN20, AN40,AN60, AN80
SaN25, SaN50,SaN75
SuN25, SuN50,SuN75
HN50 –
640 BIMLER AND KIRKLAND
the triads at their own pace. Some took weeks before returning the com-pleted data-entry forms, while others performed the task in a single session(taking about 45 minutes).
In addition, the same subjects went through a ‘‘pairing-up’’ procedure. Theobject here was to provide similarity information by arranging the items intomost-similar pairs.3 To achieve the most-similar pairs, the subject shuffled theitems and dealt them out into two rows of 15, one row above the other (again,with a single item left over). Then the subject matched each item in the toprow with the one most similar to it in the bottom row, by rearranging itemswithin the rows (and by exchanging them between rows if this improved thematching).
Analysis. The triadic judgements can be regarded as relationships betweensimilarities: Choosing Ei as the odd-one-out of items Ei, Ej, Ek is equivalent toasserting that Ej and Ek are the most similar pair, that is, the subject informs usthat dij > djk, dik > djk (where dij is the perceived dissimilarity between Ei and Ej).To recover the actual dissimilarities, we subjected these ordinal-level data tonon-metric multidimensional scaling.
The MDS program used is an implementation of a Maximum Likelihoodalgorithm (ML), very similar to MAXSCAL (Takane, 1978). It calculates thelikelihood that those particular comparisons between similarities, applied to agiven configuration, would result in the greater-than/less-than judgements whichwere in fact observed. The essence of the ML approach is to iteratively adjustthe configuration until this likelihood reaches a maximum.
Subjects reported that some triads were problematical: The dissimilaritieswere all of comparable magnitude, so none of the expressions stood out as leastsimilar. We interpret such reports as ‘‘equidistance’’ judgements—dij = djk =dik—and incorporate them by expanding each equality into a pair of relation-ships: dij ¶ djk and djk ¶ dij, etc. In effect, any departure from equality betweenthe reconstructed inter-point distances dij, djk, dik is penalised (by reducing theoverall likelihood of the configuration); the corresponding points xi, xj, xk arepushed towards forming an equilateral triangle.
In addition, estimated dissimilarities d*ij were obtained. Each d*ij is bij/cij,where cij is the total number of comparisons between dij and another dissim-ilarity dik or djk (involving some third stimulus Ek), and bij is the number of suchcomparisons in which dij was larger. In other words, d*ij is the fraction of triadsin which Ei or Ej was the odd-one-out. Processing these estimates with thegroup-mean hierarchical-clustering algorithm arranged items in a tree model.
3 This is similar to the ‘‘nonserial matching’’ or Pick 1/N procedure applied to the Frois–Wittmanfacial expression photographs by Andrews and Muldoon (1954).
CATEGORICAL PERCEPTION OF FACIAL EXPRESSIONS 641

Results
A three-dimensional solution was chosen. This requires 88 parameters (com-pared to 59 for a two-dimensional solution). Adding a third dimension leads toan improvement in the overall log-likelihood from 71344 to 71214. A verysimilar solution results from following the more usual approach of applyingMDS to the d*ij, rather than directly to the comparisons. However, that approachdoes not allow the use of the likelihood-ratio test. When comparing rivalsolutions, twice the difference in their log-likelihoods (i.e., 2 6 130) follows anasymptotic w2 distribution with 29 degrees of freedom: The difference in thenumbers of parameters (Takane, 1978). This is significant at the p < .001 level.
To bring order to the scatter of points, constrained MDS was then applied.Specifically, we imposed the constraint that the points corresponding to pure andblended expressions should be aligned so that each morphed point lies some-where along a line connecting its pure-expression points: xm = qm xa + (17qm)xb. This requires a single parameter qm to locate each morphed item, saving 52degrees of freedom. Any distortions introduced by the constraint are minor. Theimproved visual clarity and the reduction in the number of parameters comes atthe cost of decreasing the log-likelihood from 71214 to 71252: according to alikelihood-ratio test, this is not significant. Figure 2 is the result.
Only the points corresponding to pure expressions need to be labelled, sincethe identity of each morphed item is obvious from the position of xm on linesbetween its respective xa, xb; the Em are represented by symbols. The symbolsindicate which branch each Em belongs to in the tree described below.
A salient feature of Figure 2 is the ‘‘clumping’’ of the morph points xm. Theyare not spaced out at even intervals; they have gravitated towards one endpointor the other, as predicted by the CP hypothesis. To illustrate this, crosses aremarked at even intervals along the dotted lines between pairs of pure-expressionendpoints, each cross linked to the corresponding xm by a solid line. Clumping isalso present in unconstrained and in two-dimensional solutions. A simple way totest whether the effect is more than a coincidence is to constrain the solutionfurther, setting qm = pm so that each xm is anchored in place between xa and xb;no longer free to slide back and forth like a bead on a wire. This saves a further26 degrees of freedom but it reduces the log-likelihood to 71376: sufficientdeterioration to reject the hypothesis (at the p < .001 level) that the subjectiveintervals between the morphs in each continuum are equal.
The horizontal axis appears to be a happy-sad dimension, distinguishingpositively valenced expressions from negative ones. The vertical axis lends itselfto a description such as ‘‘intensity’’ or ‘‘arousal’’: Interpreted in this way,Figure 2 has much in common with the circumplex found in a number ofprevious MDS studies of facial expression (Nummenmaa, 1992; Russell &Bullock, 1986; Russell, Lewicka, & Niit, 1989) and emotion (Feldman, 1995;Roberts & Wedell, 1994).
642 BIMLER AND KIRKLAND

However, the third dimension is required to accommodate the large perceivedseparations between pairs of pure expressions around the circumplex perimeter(Happy-Neutral , Surprised-Happy , Angry-Surprised , Angry-Sad). Each pair istoo dissimilar to be flattened into two dimensions without distortion (equiva-lently: the dissimilarities between Neutral and the ‘‘active’’ pure expressions aretoo small). Unblended Anger lies at one extreme of this third dimension, andunblended Surprise at the other. A previous MDS study of facial affect (Parameyet al., 1994) found a similar axis, distinguishing pure expressions of Anger andDisgust at one extreme from Surprise and Fear at the other. Paramey et al.suggested the interpretation ‘‘active-reactive’’, but attaching a label to eachdimension is not essential: Here, the MDS solutions are merely means to an end.
Deriving a tree from the triads confirms that the clumping is not an artefact ofa spatial model. One cannot speak of items being spaced between two extremes
Figure 2. Two-dimensional projection of constrained three-dimensiona l configuration for 31 facialexpression items (F-series), derived from triadic data from 13 observers. Each morphed expression isanchored to a line drawn between its constituent pure expressions, and labelled according to thebranch it belongs to in a dendrogram, as follows: *, Angry; ~, Sad; ~, Neutral; ^, Surprised; &,Happy. The branches in turn are identified by the pure expression each contains.
CATEGORICAL PERCEPTION OF FACIAL EXPRESSIONS 643

at intervals, equal or unequal, for the spatial concept of ‘‘continua’’ has noequivalent in a tree structure. However, the crucial claim of CP can be tested: ifintra-category similarities do indeed exceed similarities between categories, thetree should consist of relatively discrete subtrees or branches.
There are five subtrees, each consisting of a pure-expression stimulus plus themorphed items clustered around it. The members of each subtree are listed inTable 2, and shown in Figure 2 by the symbols representing the items. Note fromFigure 2 that Neutral and Sad expressions are not as spatially distant as webelieved when deciding to interpolate three morphs between them. An anon-ymous reviewer has reminded us that neutral expressions are often labelled as‘‘Sad’’ when ‘‘Neutral’’ is not among the response options (Ekman & Friesen,1976). This amounts to a higher sampling density in this region of expressionspace, producing very similar items, which act as a ‘‘bridge’’ between the twoclusters and cause them to merge. In consequence, the subtrees for Neutral andSad join at a relatively low dissimilarity.
Pairing-up data. MDS was applied to the subjects’ pairing-up decisions bytreating them as comparisons between similarities. Specifically, we interpretedthem as Pick 1/15 data: by matching Ei from the top row with Ej from the bottomrow—rather than matching Ei with some other bottom-row Ek or Ej with someother top-row El —the subject informs us that dij < dik, dij < djl for all k, l = i or j.
A deficiency of pairing-up judgements is that they provide information aboutthe configuration’s short-range details, but not about its global structure. Thiscreates a possibility that the MDS analysis may become stuck in a local max-imum, and fail to find the solution with the best possible goodness-of-fit . Theinitial configuration becomes a factor. To remedy this, we used the configurationderived from triadic data to initialise the MDS process. Items appear to beclumped in the result, but it is not possible to ascribe a significance to this, sincea condition for applying the likelihood-ratio test is that all the comparisons areindependent. This is not the case for pairing-up judgements: once Ei, Ej arepaired, neither are available for pairing with another item Ek, even if dik < dkl forall other El.
The configuration from constrained MDS is similar to Figure 2. For reasonsof space it is not shown here, but the product-moment correlation between therespective dij is r = .72. A tree (summarised in Table 2) shows the itemsclustering in the same fashion as in that produced from triadic data, with minordifferences.
EXPERIMENT 2: M-SERIES. QUARTET DATA
Although unlikely, the possibility remains that the observed clustering of itemsis an objective feature of the particular stimuli used, rather than a CPphenomenon. Perhaps the morphs were not spaced equally along the 10
644 BIMLER AND KIRKLAND

TABLE 2Summary of six hierarchical trees produced for the two series of 31
stimuli, in four experiments
F-series M-series
1a 1b 3 4 2 3 4
A A A A A A A AAH25 A A A A A A AASa33 A A A A A A AAN20 A A A A A A AAN40 A A A A A A A
Sa Sa Sa Sa Sa Sa Sa SaSaN25 Sa Sa Sa Sa Sa Sa SaSaN50 N Sa Sa N Sa Sa NSaH20 Sa Sa Sa Sa Sa Sa SaASa66 Sa N Sa Sa Sa Sa SaSa20Su Sa Sa Sa Sa Sa Sa SaSa40Su Su Su Sa Sa Sa Sa Sa
N N N N N N N NAN60 N N N N N N NAN80 N N N N N N NSa75N N N N N N N NSuN75 N N N N Su N N
F-series M-series
1a 1b 3 4 2 3 4
Su Su Su Su Su Su Su SuSuN25 Su Su Su Su Su Su SuSuN50 Su Su Su Su Su Su SuSaSu60 Su Su Su Su Su Su SuSaSu80 Su Su Su Su Su Su SuASu50 Su Su Su Su Su Su Su
H H H H H H H HAH50 H A H H H H HAH75 H H H H H H HSuH50 H H H H H H HSaH40 Sa Sa H H H H HSaH60 H H H H H H HSaH80 H H H H H H HHN50 H H H H H H H
Note: Each column represents a tree. Each stimulus (row) is labelled A, Sa,N, Su, H, according to the branch it belongs to in that tree, where each branchiin turn is identified by the pure expression it contains. Columns 1a, 1b for theF-series stimuli refer to the trees derived from triadic and pairing-up data fromExperiment 1. For Experiment 4, combining both stimulus series in a singletree, each stimulus is labelled according to the nearest pure expression fromthe same series as itself.
Six stimuli are borderline cases (SaN50, ASa66, Sa40Su, SuN75, AH50,SaH40), not grouped in the same category in every tree.
CATEGORICAL PERCEPTION OF FACIAL EXPRESSIONS 645

continua, despite the best efforts of the morphing-software operator. To guardagainst this, a second stimulus set was generated (the M-series), as described inExperiment 1 above, under ‘‘Stimuli’’. Moreover, a different procedure wasapplied: a ‘‘quartet task’’.
Subjects
Ten adult informants were recruited informally (two men, four women, fourunrecorded).
Method
In this procedure the subjects were instructed to shuffle the items and deal themout into 7 groups of four ‘‘quartets’’, plus a leftover group of three. The task wasto indicate the pattern of similarities within each quartet by grouping it as (a)two pairs of similar items, or as (b) a group of three similar items, plus an odd-one-out. Subjects were free to apply (a) or (b), depending on which arrangementfitted each quartet best.4 ‘‘Similarity’’ was explained in the same way as inExperiment 1. The leftover group of three was treated as a triad. Subjects werealso invited to make supplementary decisions: for case (a), they could indicatewhich pair was more similar; for case (b), they could provide a triadic odd-one-out judgement for the relatively similar group of three.
This whole process of creating and analysing quartets was repeated 10 times.As before, the task was designed to be taken home and completed at the sub-ject’s own pace. To compensate for the greater complexity of the task, thenumber of quartets is less than the number of triads in Experiment 1.
Analysis. Quartet judgements can be understood and analysed in terms ofcomparisons between pairs of distances. Consider a quartet Ei, Ej, Ek, El: if asubject pairs up the items as Ei, Ej and Ek, El, we interpret this as a judgementthat the sum of dissimilarities dij + dkl is less than the sums that correspond to thetwo alternative ways of pairing the quartet (dik + djl, and dil + djk). If the subjectselects an odd one out, El, this is equivalent to asserting that Ei, Ej, Ek form atighter cluster (i.e. are more similar to each other) than the clusters left by thealternative choice of Ei or Ej or Ek as odd one out. This simplifies to thejudgements that:
dik + dij < dkl + djl, dij + djk < dil + dkl, dik + djk < dil + djl.
4 Quartet data were collected by Isaac (1970), and by Tantam, Monaghan, Nicholson, and Stirling(1989), respectively using subsets of Frois–Wittman facial expressions and of Ekman–Friesenphotographs . In both studies, the data were used for assessing the accuracy of the subject’s per-ception, rather than for MDS purposes.
646 BIMLER AND KIRKLAND

Scaling quartet data is an iterative process of changing the modelled distancesdij (by moving points xi) to progressively improve the fit between the obser-vations and the model, at each stage comparing these judgements against thecorresponding sums of distances (dij + dkl, etc.). For purposes of constructing atree, the estimated dissimilarities are d*ij = bij / cij, where cij is the number ofcomparisons (involving other items Ek, El) between dij + dkl and some other sumof dissimilarities, and bi is the number of such comparisons in which dij + dkl
was the larger.
Results
For a spatial solution, three dimensions gave a significantly better fit than twodimensions—87 degrees of freedom instead of 59—the difference in log-likelihood being 134 (p < .001). Constraining the xm to lie on lines between theirrespective xa, xb reduced the log-likelihood by 61 while saving 52 degrees offreedom. The difference borders on significance, but for the sake of clarity, thisconstrained solution—highlighting the displacement of morphs towards pureexpressions—is the one shown in Figure 3. Imposing the additional constraintthat qm = pm (saving 26 degrees of freedom) reduced the log-likelihood by afurther 45; this is significant (p < .05), demonstrating that the clumping of itemsis not merely coincidental.
The contrast between Figures 2 and 3 is intriguing. Repeating the MDS usingsorting data produces solutions which differ in the same way (Experiments 3 and4, below). Within each category, there seems to be considerable latitude forexpressions to vary while still considered to be good exemplars of that emotion.For example, the pure expression of Anger in the F-series of stimuli (e61) can bedescribed in the FACS system as composed of Action Units 4+5+23; while itscounterpart in the M-series (e103) is composed of AUs 4+5+7+2+26 (P. Ekman,personal communication): The latter incorporates two AUs absent in the former,‘‘lids tight [squint]’’ and ‘‘jaw drop’’. This agrees with the finding (Alvarado,1996) that more than one distinguishable expression can come under the rubricof a single verbal label. In that study, three expressions which differed in termsof facial action (i.e. the contraction of particular muscles), and were seen asdissimilar in triadic comparisons, were consistently identified as Surprised (or asAngry, for another three). It becomes possible to ask whether the ‘‘focalexpression’’ in such cases is a single point in expression space, or a set of points.Any attempt at a general model of facial expressions in spatial terms must allowfor these ‘‘actor differences’’.
The location of unblended Neutral in Figure 3 deviates from the expectedcircumplex. The third dimension again serves to distinguish Anger from Sur-prise, but in this case the Neutral expressions are displaced towards the Surpriseextreme of the axis. This renders any identification of the dimensions in Figure 3problematical, apart from the ‘‘pleasant-unpleasant’’ valence of D1.
CATEGORICAL PERCEPTION OF FACIAL EXPRESSIONS 647
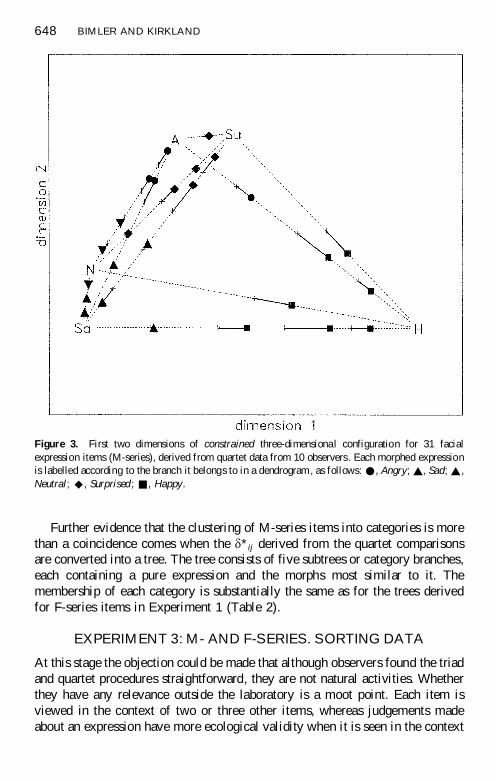
Further evidence that the clustering of M-series items into categories is morethan a coincidence comes when the d*ij derived from the quartet comparisonsare converted into a tree. The tree consists of five subtrees or category branches,each containing a pure expression and the morphs most similar to it. Themembership of each category is substantially the same as for the trees derivedfor F-series items in Experiment 1 (Table 2).
EXPERIMENT 3: M- AND F-SERIES. SORTING DATA
At this stage the objection could be made that although observers found the triadand quartet procedures straightforward, they are not natural activities. Whetherthey have any relevance outside the laboratory is a moot point. Each item isviewed in the context of two or three other items, whereas judgements madeabout an expression have more ecological validity when it is seen in the context
Figure 3. First two dimensions of constrained three-dimensiona l configuration for 31 facialexpression items (M-series), derived from quartet data from 10 observers. Each morphed expressionis labelled according to the branch it belongs to in a dendrogram, as follows: *, Angry; ~, Sad; ~,Neutral; ^, Surprised ; &, Happy.
648 BIMLER AND KIRKLAND
of the portrayer’s entire expressive gamut (Ekman, O’Sullivan, & Matsumoto,1991). This objection can be countered by applying the Method of Sorting.
This procedure has a long history in the study of facial expressions ofemotion, starting with Hulin and Katz (1935), who asked 22 observers to arrangethe 72 Frois–Wittman pictures into groups representing distinct expressions. Tocite but a few examples, it has been applied to pure and mixed expressions(Nummenmaa, 1992), and to pure expressions, sorted by preschool children(Russell & Bullock, 1986), and by adults of several cultures (Russell et al.,1989). However, sorting data are unspecific about the global structure of aconfiguration: If all or most subjects agree in placing Ei and Ej in separategroups, we know that they are dissimilar—but not how dissimilar. To elicit moreinformation, this study uses ‘‘Additive sorting’’, an extension of the basicprocedure (Bimler, Kirkland, & Chen, 1998).
Subjects and stimuli
The stimuli were the two sets used in Experiments 1 and 2, each containing 31items. Twenty-three adult subjects (sexes not recorded) sorted the F-series and23 sorted the M-series.
Procedure
Additive sorting involves several steps. In the first step, each subject wasrequested to group together items which ‘‘belonged together’’ or were mostsimilar. The number of groups and the number of items in each group were leftup to the subjects (single-item groups were permitted). Subjects were also left tomake their own interpretation of ‘‘similarity’’. If clarification was requested,‘‘similarity’’ was explained as in Experiment 1 (i.e., ‘‘ ‘How similar are theemotions expressed in the photos?’ or ‘How similar are the person’s feel-ings?’ ’’).
In the following steps, subjects were invited to reduce the number of groups,by selecting the two ‘‘most similar’’ groups and merging them into one. Theyrepeated this merging until only two groups remained, or until the remaininggroups had so little in common that nominating two of them as most similar wasnot possible.
Results
In the first stage of sorting, subjects created an average of 8.8 groups (F-series)and 8.5 groups (M-series). This is large enough to make it unlikely that subjectswere simply grouping the items into familiar expression categories.
We applied ‘‘reconstructed dyads analysis’’ to the data. Essentially this is away of rendering each subject’s sorting decisions into a form amenable toMaximum Likelihood MDS, by decomposing them into a sequence of
CATEGORICAL PERCEPTION OF FACIAL EXPRESSIONS 649

comparisons between similarities. This approach has previously been applied tosorting data for photographs of facial affect (Bimler & Kirkland, 1997; Bimler etal., 1998) and found to have advantages over the standard approach of applyingMDS to the aggregated sorting ‘‘co-occurrences’’.
Again, blended expressions become polarised, gravitating towards thedominant component. Tree models for the F-series and M-series both containfive clearly resolved branches, each containing a ‘‘pure’’ expression and thusidentifiable as an emotion category. The membership of these branches is thesame as in the trees from Experiments 1 and 2 (Table 2).
Spatial solutions for these data exhibited a comparable degree of clumping.Three-dimensional configurations were chosen, on the basis of the thirddimension agreeing with those derived for the triadic and quartet data. For bothstimulus sets, saving 52 degrees of freedom by constraining the morphed itemsto lie on lines between the prototype items reduced the total log-likelihood by arelatively small amount, while saving a further 26 degrees of freedom by settingqm = pm produced a larger reduction. However, sorting data do not meet thecondition of independence of comparisons, so it is not possible to apply the w2-test to these differences. The positions of the prototype points in the constrainedthree-dimensional solutions are very similar to those shown in Figures 2 and 3,as is the general extent of clumping. Comparing the dij of the F-series solutionwith those derived from triadic data, the product-moment correlation r = .90.Comparing the dij of the M-series solution with those derived from quartet data,r = .89.
EXPERIMENT 4: M- AND F-SERIES COMBINED.SORTING DATA
Alternative explanations, not involving CP, can be offered for the clumpingobserved in Experiment 3. It is possible that the five original items stood out insome way, providing the subjects with natural nuclei to cluster the 26 synthe-sised items around (the large number of groups made in the Grouping stage ofsorting militates against this). For instance, it may be that despite the skill andbest efforts of the software operator, artefacts appear in the morphed expressionswhich distinguish them from the pure ones. It is also worth remembering thateach pure item lies at the end of four continua, with several slight variations inits neighbourhood , whereas each morph lies somewhere on a single continuum,with two neighbours. One can imagine the slight variants calling attention to thepure item, which epitomises their shared qualities.
A test of this explanation would be to repeat Experiment 3—without all of thepure items. Even when absent, do the perceptual magnets still exert an attractiveforce? We applied a test along similar lines. The stimulus sets for the subjectswere randomised, so that some pure expressions were not available for sortingfor half the subjects. Moreover, each subject saw a different selection of each
650 BIMLER AND KIRKLAND

pure item’s immediate neighbours. This was done by combining the Male andFemale stimuli, shuffling them, and splitting the deck, repeating this process forevery pair of subjects.
Subjects
One group of subjects consisted of 21 adults. A second group consisted of 70students (36 males, 32 females, two unrecorded; aged 13 to 15) recruited fromlocal high schools. Observers in this age range have matured enough to performclose to adult level in tasks of facial expression recognition (Kolb, Wilson, &Taylor, 1992). De Gelder et al. (1997) found that 9- to 10-year-old childrenidentified and discriminated morphed FE stimuli in a manner qualitativelysimilar to adults.
Procedure
The additive sorting method was used. Before applying it to the facial expres-sion items, the students practised sorting a set of 21 animal names (analysis ofthese data, and comparison with previous MDS studies of the animal-namedomain, confirmed that they understood the task). The instructions to subjectsurged them to overlook (as far as possible) any differences in facial appearancebetween the male and female poser, and to sort the pictures into groups on thebasis of similarities between the emotions they portrayed. Observers are capableof distinguishing these two sources of overall dissimilarity as the recognition offaces and facial affect are processed separately in the brain (Etcoff, 1984). Adultsubjects created an average of 9.9 groups in the first stage of sorting. Thestudents arranged the items in an average of 6.1 groups, suggesting that theywere applying looser criteria of similarity.
Results
For the purposes of reconstructed dyad analysis, the split-deck incompletedesign is useful. It ensures that a given item appears in different contexts, andthat every subject is forced to make different sorting decisions, providinginformation which might not be available if everyone had sorted the entire 62items of the combined sets (Bimler & Kirkland, 1997).
Many observers found that the male and female posers’ portrayals of someexpression categories were sufficiently dissimilar to be sorted into separategroups. For example, of the 26 observers who were presented with both por-trayals of pure Angry, only 11 grouped them together at step 1. This was not amatter of ignoring instructions and sorting by gender, as subjects showed noreluctance about grouping both portrayals of Happy together; some of theexpressions genuinely differ between posers, in intensity or quality. This isshown quite clearly in the dendrogram from these data (Figure 4). The expected
CATEGORICAL PERCEPTION OF FACIAL EXPRESSIONS 651

652

five-way branching of the tree is present: the strength of the perceptual magneteffect was not diminished by the split-deck manipulation of the items. However,the F-series and M-series members of the Angry cluster (five each) are suffi-ciently dissimilar to form distinct subclusters. In contrast, the F-series and M-series members of the Happy cluster (five each) are mingled together. Otherclusters show intermediate degrees of subclustering.
Spatial MDS was also performed, and a three-dimensional solution waschosen. As before, the constraint was imposed that each point indicating amorphed stimulus should lie somewhere on a line between the appropriateendpoints: 10 endpoints in this case, and 20 continua. The items congregate intoclumps to a comparable extent as in Figures 2 and 3. Unfortunately, the numberof points and lines detract from the clarity of a two-dimensional projection of thesolution, so it is not included here.
DISCUSSION
The techniques of multidimensional scaling (MDS) were used to produce spatialmodels (incorporating constraints) and nonspatial models (trees), summarisingthe similarities perceived among expressions of facial affect. At least threedimensions were required for an adequate representation of the data. Temptingthough it is, we are loath to speculate about the interpretation of these axes,given the extent of ‘‘actor variation’’ between the F-series and M-series stimuli.And as with any MDS application, it is important to remember that the axes arisefrom geometrical assumptions impinging on the data; they may or may notcorrelate with phenomena outside the models.
Every effort has been made to avoid the possible artefacts of MDS. Inparticular, the common procedure of estimating d*ij from triadic data by ‘‘vote-counting’’ the triads (e.g., Alvarado, 1996) can produce spurious circumplexsolutions in which items which belong near the centre are displaced outwardtoward the periphery of the perceptual space (Gladstones, 1962)—a kind ofcentrifugal force. Similar distortions appear when estimating dissimilarities fromsorting data. ‘‘Scaling methods [. . .] seem often to give circular models, possiblyin the form of a ring. This happens whatever the stimuli are’’ (Nummenmaa,1992). In the constrained solution, this would have been enough to force themorphed items towards the pure items, which occupy extremal positions in theconfiguration, marking the vertices of a polyhedron (but note that clumping isalso present in the unconstrained solution). As well as the centrifugal effect,aggregated sorting data (co-occurrences) have a propensity to exaggerate anyclustering of the items (Bimler & Kirkland, 1997). To counter this, the
Figure 4 (opposite). Hierarchical tree derived from sorting data for 62 facial expression items.Codes in bold (A50H) indicate M-series expressions; underlined (A50H) indicates F-series.
CATEGORICAL PERCEPTION OF FACIAL EXPRESSIONS 653

intermediate vote-counting stage is bypassed by the MDS algorithm we applied,which operates directly on the comparisons.
To summarise the Results sections above: Perceived dissimilarities aredecreased in the neighbourhoods of the unblended expressions, in an analogousmanner to the ‘‘perceptual magnet’’ effect. The data are too scanty to try pin-pointing the focus of each category—the prototypal, most representativeexpression—or to tell whether these foci coincide with the unblended items. Theevidence for this within-category shrinkage of dissimilarities persists across fourdifferent forms of data, and across spatial versus tree representations. Subject tothe following caveats, it seems that categorical perception (CP) effects are notmerely artefacts of the particular procedures used in previous experiments withmorphed expressions.
We have concentrated on the within-category shrinkage, placing lessemphasis on the discontinuities between categories. Judging from the agreementabout the membership of each categories (Table 2), the boundaries remain stablefor two sets of stimuli, and across different forms of data. However, the spacingof the interpolated morphs is too coarse to locate these boundaries precisely;they may vary between subjects (indeed, if there is a projective component, theymay vary for a single subject, depending on mood and circumstances). Note thata boundary is a region of quite specific uncertainty. One might expect that anitem midway between Happy and Angry (for instance)—making it ambiguous orhard to categorise—would therefore cross over to the Neutral cluster, but thereis no evidence of this happening (in agreement with Calder et al., 1996). Younget al. (1997) noted that this absence of FE ‘‘metamers’’ is enough to exclude atwo-dimensional spatial model: Normally, MDS applications rely on goodness-of-fit measures to decide on the appropriate dimensionality.
Criteria for membership of the Neutral cluster appear to be more specific thanthat. We have replicated earlier findings (Etcoff & Magee, 1992) that a neutralexpression has the properties of a category. When blended with an ‘‘active’’expression, the proportion of the latter must reach some threshold before thecombination loses its neutral status. In addition, Surprised acts as a perceptualmagnet, along the Surprised-Neutral and Sad-Surprised continua. This was alsoobserved by Young et al. (1997). This raises the interesting possibility that acategorical status for Surprised expressions relies on certain features of shadingor skin texture which are lost in line drawings, as Etcoff and Magee (1992) whoused such stimuli, found no peaks in discrimination that would indicate categoryboundaries when they compared Surprised with Angry and Afraid.
Note that instead of measuring subjects’ discrimination between stimuli (just-noticeable differences)—the second criterion for CP (Harnad, 1987)—we havefocused on the perceived dissimilarities between stimuli with larger differences.MDS looks for structure in the relationships between stimuli, as opposed tolabelling each stimulus or analysing its qualities in isolation. Thus, this studyignores the first criterion. These caveats mean that our data do not prove the
654 BIMLER AND KIRKLAND

existence of CP for facial expressions; they can more modestly be described ascompatible with it. Our results should ideally be repeated with a larger pool ofindividuals displaying the expressions.
Data from four experiments displayed the signs of CP when tree models werederived from them, but these signs remained when dimensional models werederived instead. Etcoff and Magee (1992) state that the CP effects theydemonstrated rule out a spatial representation of expressions of affect; (i.e., thatCP is inherently tree-like and nonspatial). We argue, to the contrary, that the twoare compatible (see also Ekman et al., 1972, chapter 12), and that CP can beeasily accommodated within the framework of spatial models: Although it mightbe more appropriate to talk of ‘‘perceptual magnets’’ in this situation.
The analysis with MDS is one point of difference between this study andearlier research with morphed faces. Another is the parallel presentation ofstimuli. Here, subjects had the entire gamut of expressions in front of them asthey sorted the items or matched them into pairs. Setting an expression in thiskind of context increases the ecological validity of judgements made about it(Ekman et al., 1991): Expressions are categorised more accurately when subjectshave prior experience of that actor’s expressive range. In the case of the triadicdata (direct comparisons of dissimilarities), subjects viewed each three stimuliconcurrently. After the first 10 triads, they were acquainted with the full range ofstimuli (many felt overacquainted with it, after 120 triads).
It is possible that subjects were mentally pigeon-holing the expressions—attaching verbal labels to them and grouping items which they had labelled thesame. If this was the case then the tasks used here were still identification tasksand their results confound CP with the necessarily categorical nature of thoseverbal labels. Unlike sequential-presentation tasks, the triadic and sorting pro-cedures do not enforce the use of an encoding strategy, but they do not exclude iteither. Verbal encoding has been shown to contribute to CP of colours. In across-cultural comparison, using a triadic method to measure the dissimilaritiesbetween coloured chips, Kay and Kempton (1984) found evidence for a categoryboundary between blue and green for English-speaking informants, whereas nosuch boundary emerged for observers whose native language does not verbalisea blue-green distinction (replicated by Davies, Sowden, Jerrett, Jerrett, &Corbett, 1998). This category boundary dissolved when the experiment designwas manipulated to discourage observers from basing their decisions on a ver-bal-encoding strategy. However, the large average number of groups in thesorting tasks of Experiments 3 and 4 militates against a verbal-encodingexplanation for the present results, as does the distinction found in Experiment 4between F- and M-series exemplars of some pure emotions. Alvarado (1996)presents similar contrary evidence from multiple exemplars.
Recall that the instructions in all four experiments were worded so as to focusthe attention of the observers on the emotions expressed in the stimuli, and awayfrom physical characteristics, such as the identity of the poser, in Experiment 4.
CATEGORICAL PERCEPTION OF FACIAL EXPRESSIONS 655

This leaves open the possibility that the evidence for categoricity relates spe-cifically to emotion concepts, rather than to the visual representation of stimuli(we are indebted to two anonymous reviewers for pointing this out). Differentresults and a shift in the balance between dimensional and categorical perceptionmight arise from differently worded instructions (for instance, inviting observersto judge similarity by comparing stimuli as abstract patterns of light and shade,or as abstract combinations of displacements of facial landmarks).
The wider context of this study is the perennial issue of whether the varia-tions among facial-affect expressions are categorical or dimensional. Thequestion is of interest, not merely in itself, but also for the implications it carriesfor the structure of emotions. Research within the categorical approach has longbeen dominated by the use of prototypal stimuli, and forced-choice identifica-tion. The advent of morphing techniques allow the possible limitations in thisprocedure to be avoided. Our observation of CP effects implies that the categoryto which a FE belongs is an important element in its description, at least.
There are limits, however, in how far this can be extrapolated to emotions.The latter seem to co-occur in various combinations—indeed, such co-occurrence is presupposed for studies of mood structure using self-report data(Feldman, 1995). It must be remembered that FEs, as a channel for commu-nicating emotional signals, have a limited capacity: A single bit, according toOsgood’s (1966) information-theory analysis. Under normal conditions thechannel is combined with information from situation and tone of voice. Ourability to extract emotional content from degraded signals such as line drawings(Etcoff & Magee, 1992; Paramey et al., 1994), or static, monochrome photo-graphs speaks of a system evolved to maximise redundancy and robustnessrather than information capacity, and it may be that the categories are a productof these communication constraints.
Manuscript received 10 September 1999Revised manuscript received 7 February 2001
REFERENCES
Adolphs, R., Tranel, D., Damasio, H., & Damasio, A. (1994). Impaired recognition of emotion infacial expressions following bilateral damage to the human amygdala. Nature, 372, 669–672.
Alvarado, N. (1996). Congruence of meaning between facial expressions of emotion and selectedemotion terms. Motivation and Emotion, 20, 33–61.
Andrews, T.G., & Muldoon, J. F. (1954). Factorial study of Schlosberg’s analysis of facialexpressions. American Psychologist [Abstract], 9, 321.
Bimler, D.L., & Kirkland, J. (1997). Multidimensional scaling of hierarchical sorting data applied tofacial expressions. Scandinavian Journal of Psychology, 38, 349–357.
Bimler, D.L., Kirkland, J., & Chen, S.-J. (1998). A cross-cultural study of facial expressions ofemotion using multidimensional scaling. Annual Report, Research and Clinical Center for ChildDevelopment (Hokkaido University), 21, 35–42.
656 BIMLER AND KIRKLAND

Calder, A.J., Young, A.W., Perrett, D. I., Etcoff, N. L., & Rowland, D. (1996). Categoricalperception of morphed facial expressions. Visual Cognition, 3, 81–117.
Calder, A.J., Young, A.W., Rowland, D., & Perrett, D.I. (1997). Computer-enhance d emotion infacial expressions. Proceedings of the Royal Society of London B, 264, 919–925.
Carroll, J.M., & Russell, J.A. (1996). Do facial expressions signal specific emotions? Judgingemotion from the face in context. Journal of Personality and Social Psychology, 70, 205–218.
Davies, I.R.L., & Corbett, G. G. (1997). A cross-cultural study of colour-grouping : Evidence forweak linguistic relativity. British Journal of Psychology, 88, 493–517.
Davies, I.R.L., Sowden, P.T., Jerrett, D.T., Jerrett, T., & Corbett, G.G. (1998). A cross-cultural studyof English and Setswana speakers on a colour-triads task: A test of the Sapir-Whorf hypothesis.British Journal of Psychology, 89, 1–15.
de Gelder, B., Teunisse, J.-P., & Benson, P. J. (1997). Categorical perception of facial expressions:Categories and their internal structure. Cognition and Emotion, 11, 1–23.
Ekman, P. (1994). Strong evidence for universals in facial expressions: A reply to Russell’s mistakencritique. Psychological Bulletin, 115, 268–287.
Ekman, P., & Friesen, W.V. (1976). Pictures of facial affect. Palo Alto, CA: Consulting Psychol-ogists Press.
Ekman, P., Friesen, W.V., & Ellsworth, P. (1972). Emotion in the human face. New York: Pergamon.Ekman, P., O’Sullivan, M., & Matsumoto, D. (1991). Confusions about context in the judgment of
facial expression: A reply to ‘The contempt expression and the relativity thesis’. Motivation andEmotion, 15, 169–176.
Etcoff, N.L. (1984). Selective attention to facial identity and facial emotion. Neuropsychologia, 22,281–295.
Etcoff, N.L., & Magee, J.J. (1992). Categorical perception of facial expressions. Cognition, 44, 227–240.
Feldman, L.A. (1995). Variations in the circumplex structure of mood. Personality and SocialPsychology Bulletin, 21, 806–817.
Gladstones, W.H. (1962). Empirical comparisons of three multidimensional scaling methods. Aus-tralian Journal of Psychology, 14, 197–201.
Haidt, J., & Keltner, D. (1999). Culture and facial expression: Open-ended methods find moreexpressions and a gradient of recognition. Cognition and Emotion, 13, 225–266.
Harnad, S. (1987). Categorical perception. Cambridge, UK: Cambridge University Press.Hulin, W.S., & Katz, D. (1935). The Frois–Wittmann pictures of facial expression. Journal of
Experimental Psychology, 18, 482–498.Isaac, P.D. (1970). Dissimilarities as indices of individual perceptual structure. Perception and
Psychophysics, 7, 229–233.Iverson, P., & Kuhl, P.K. (1995). Mapping the perceptual magnet effect for speech using signal
detection theory and multidimensional scaling. Journal of the Acoustical Society of America, 97,553–562.
Izard, C.E. (1971). The face of emotion. New York: Appleton-Century-Crofts .Kay, P., & Kempton, W. (1984). What is the Sapir-Whorf hypothesis? American Anthropologis t, 86,
65–79.Kolb, B., Wilson, B., & Taylor, L. (1992). Developmenta l changes in the recognition and com-
prehension of facial expressions: Implications for frontal lobe function. Brain and Cognition, 20,74–84.
Nummenmaa, T. (1992). Pure and blended emotion in the human face. Helsinki: SuomaleinenTiedakatemia.
Osgood, C.E. (1966). Dimensionality of the semantic space for communication via facial expres-sions. Scandinavian Journal of Psychology, 7, 1–30.
Paramey, G.V., Schneider, K., Josephs, I., & Slusarek, M. (1994). Identification of emotionalmeaning in line drawings of faces. Report 44, Faculty of Psychology, Ruhr-University Bochum.
CATEGORICAL PERCEPTION OF FACIAL EXPRESSIONS 657

Prkachin, G.C., & Prkachin, K.M. (1994). Adaption to facial expressions of emotion. Cognition andEmotion, 8, 55–64.
Roberts, J.S., & Wedell, D.H. (1994). Context effects on similarity judgments on multidimensionalstimuli: Inferring the structure of the emotion space. Journal of Experimental Social Psychology,30, 1–38.
Russell, J.A. (1994). Is there universal recognition of emotions from facial expressions? A review ofthe cross-cultural studies. Psychological Bulletin, 115, 102–141.
Russell, J.A., & Bullock, M. (1986). On the dimensional pre-schoolers use to interpret facialexpressions of emotion. Developmental Psychology, 22, 97–102.
Russell, J.A., & Fehr, B. (1987). Relativity in the perception of emotion in facial expressions.Journal of Experimental Psychology: General, 116 (3), 223–237.
Russell, J.A., Lewicka, M., & Niit, M. (1989). A cross-cultural study of a circumplex model of affect.Journal of Personality and Social Research, 57, 848–856.
Takane, Y. (1978). A Maximum Likelihood method for nonmetric multidimensional scaling: I. Thecase in which all empirical pairwise orderings are independent—Theory. Japanese PsychologicalResearch, 20, 7–17.
Tantam, D., Monaghan, L., Nicholson, H., & Stirling, J. (1989). Autistic children’s ability to interpretfaces: A research note. Journal of Child Psychology and Psychiatry, 30, 623–630.
Tomkins, S.S. (1962). Consciousness , imagery and affect: Vol. 1. New York: Springer.Woodworth, R.S. (1938). Experimental psychology. New York: Holt.Young, A.W., Rowland, D., Calder, A.J., Etcoff, N.L., Seth A., & Perrett, D.I. (1997). Facial
expression megamix: Tests of dimensional and category accounts of emotion recognition.Cognition, 63, 271–313.
658 BIMLER AND KIRKLAND