Catchment Summary for the Test and Itchen catchment · environment but also address other concerns...
51
The Test and Itchen Catchment Figure 1 - A summary of information about the water environment in the Test and Itchen management catchment. A summary of information about the water environment in the Test and Itchen management catchment
Transcript of Catchment Summary for the Test and Itchen catchment · environment but also address other concerns...

The Test and Itchen Catchment
Figure 1 - A summary of information about the water environment in the Test and Itchen management catchment.
A summary of information about the water environment in the Test and Itchen management catchment

2
We are the Environment Agency. We protect and improve the environment and make it a better place for people and wildlife. We operate at the place where environmental change has its greatest impact on people’s lives. We reduce the risks to people and properties from flooding; make sure there is enough water for people and wildlife; protect and improve air, land and water quality and apply the environmental standards within which industry can operate. Acting to reduce climate change and helping people and wildlife adapt to its consequences are at the heart of all that we do. We cannot do this alone. We work closely with a wide range of partners including government, business, local councils, other agencies, civil society groups and the communities we serve.
Published by:
Environment Agency Horizon House, Deanery Road, Bristol BS1 5AH Email: [email protected] www.gov.uk/environment-agency
© Environment Agency 2014
All rights reserved. This document may be reproduced with prior permission of the Environment Agency.
Further copies of this report are available on the e-consultation tool:
www.gov.uk/government/consultations/update-to-the-draft-river-basin-management-plans and via our National Customer Contact Centre: T: 03708 506506
Email: [email protected].

3
Contents The Test and Itchen Catchment ................................................................................. 1
Contents ..................................................................................................................... 3
1 Your views count ................................................................................................. 5
2 The Test and Itchen Management Catchment .................................................... 7
2.1 Protected areas ............................................................................................ 8
2.2 Status of waters ........................................................................................... 9
2.3 Improvements to how water bodies are assessed ..................................... 11
2.4 Investigating the water environment in the Test and Itchen management catchment ............................................................................................................. 13
2.5 Challenges and choices consultation 2013 ................................................ 13
2.6 Taking action in partnership ....................................................................... 14
2.7 Measures that could improve the water environment ................................. 16
2.8 Economic appraisal and environmental assessment of measures to improve the water environment .......................................................................................... 16
2.9 Proposed long term objectives ................................................................... 17
2.10 Links to other management plans .............................................................. 18
3 Operational catchments .................................................................................... 18
3.1 Itchen Operational Catchment ................................................................... 19
3.2 Upper and Middle Test Operational Catchment ......................................... 28
3.3 Lower Test and Southampton Streams Operational Catchment ................ 36
3.4 River Test Chalk Operational Catchment ................................................... 44
4 What do you think? ........................................................................................... 49
4.1 How to respond .......................................................................................... 49
4.2 What the Environment Agency will use the responses for ......................... 50
4.3 How the Environment Agency will use your information ............................ 50
Figure 1 - A summary of information about the water environment in the Test and Itchen management catchment. ................................................................................. 1 Figure 2 - Map of the South East river basin district and the management catchments within it .................................................................................................... 6 Figure 3 - Map of the Test and Itchen management catchment and the operational catchments within it .................................................................................................... 7 Figure 4 - Chart showing the classification of all water bodies in the Test and Itchen catchment in cycle 1 ................................................................................................. 10 Figure 5 - Chart showing the reasons for not achieving good status of water bodies in the Test and Itchen catchment by type and source sector (latest position on cycle 1 water body network) .............................................................................................. 13 Figure 6 - Picture of the River Itchen at Winnall ...................................................... 19 Figure 7 - Map of the Itchen operational catchment ................................................ 19 Figure 8 - Chart showing the classification of all water bodies in the Itchen catchment in cycle 1 ................................................................................................. 20 Figure 9 - Classification and long term objectives of all water bodies in the Itchen catchment in cycle 2 ................................................................................................. 21

4
Figure 10 - Chart showing the reasons for not achieving good status of water bodies in the Itchen catchment by type and source sector (latest position on cycle 1 water body network) ........................................................................................................... 22 Figure 11 - Example of cattle poaching of the bank on the River Test .................... 28 Figure 12 - Map of the Upper and Middle Test operational catchment .................... 28 Figure 13 - Chart showing the classification of all water bodies in the Upper and Middle Test catchment in cycle 1 ............................................................................. 29 Figure 14 - Classification and long term objectives of all water bodies in the Upper and Middle Test catchment in cycle 2 ...................................................................... 30 Figure 15 - This image highlights the visual impacts of sediment on entering the River Dun at times of high flow ................................................................................. 36 Figure 16 - Map of the Lower Test and Southampton Streams operational catchment ................................................................................................................. 36 Figure 17 - Chart showing the classification of all water bodies in the Lower Test and Southampton Streams catchment in cycle 1 ..................................................... 37 Figure 18 - Classification and long term objectives of all water bodies in the Lower Test and Southampton Streams catchment in cycle 2 ............................................. 38 Figure 19 - Chart showing the reasons for not achieving good status of water bodies in the Lower Test and Southampton Streams catchment by type and source sector38 Figure 20 - Overflowing borehole in the Test and Itchen catchment ....................... 44 Figure 21 - Map of the River Test Chalk groundwater water body within the operational catchment .............................................................................................. 44

5
1 Your views count Water is essential for life. It allows the natural environment to flourish, and businesses, agriculture and the economy to grow and prosper. The water environment provides many different benefits to society - from supplying drinking water and supporting fisheries to providing an essential resource for business and agriculture, transport routes and a source of recreation that promotes wellbeing. It is critical that this precious resource is managed properly to ensure that the needs of society, the economy and wildlife can be met and maintained in the long-term. Building on years of progress, the Environment Agency has worked with a range of partners over the past two years to agree what the main problems are, that are stopping there being a healthy water environment in the Test and Itchen, and how it should work with others to address them. The consultations, Working Together and Challenges and choices, have helped inform this final step in updating the river basin management plan for the South East River Basin District. The ‘Challenges and choices’ consultation set out what the Environment Agency had identified as the significant issues facing the water environment. The significant issues were identified using a broad range of information, including the results of investigations, the agreed “reasons for not achieving good status” (previously called reasons for failure) across each catchment and more. We asked if you agreed with these significant issues. The majority of you did but you also raised additional local issues, which will take time to work through with catchment partnerships, to help shape the final river basin management plan. This catchment summary is a support document for the consultation on the draft update to the river basin management plan and for the Catchment Partnerships. It will help you to understand progress with the river basin management planning process so far, at a more local scale. This includes some initial economic appraisal to identify what actions are most cost beneficial. By understanding this information and letting the Environment Agency know what you think, you have an opportunity to influence the decisions about what actions will be taken over the next six years, to improve the health of your water environment. The Catchment Based Approach (CaBA) is a Government policy framework that empowers local action to improve the water environment through community partnerships. A renewed focus on the catchment based approach has led to new Catchment Partnerships being set up to drive local delivery. More information is available in the “Taking action in partnership” section or you can contact the CaBA National Support Group:
• www.catchmentbasedapproach.org • Email: [email protected]
The partnerships are working on a wide range of issues, including the water environment but also address other concerns that are not directly related to river basin management planning. The information in this document will inform the work of the Test and Itchen Catchment Partnership Catchment Partnership in developing their vision, aims and priorities; it is not intended to duplicate or overarch the important local work.

6
To view the consultation on the update to the South East river basin management plan, please visit: https://consult.environment-agency.gov.uk/portal/ho/wfd/draft_plans/consult?pointId=s1405418101234#section-s1405418101234 Figure 2 (overleaf) shows the location of the Test and Itchen management catchment within the South East River Basin District. To help you get the most out of the information provided within this catchment summary, we have provided a glossary to explain some of the terms that are used. The glossary can be found on the e-consultation web pages. There are many ways to respond to this consultation (see ‘How to respond for more details’), but if you have any difficulties please call our National Customer Contact Centre on 03708 506 506 or email [email protected]. This consultation runs October 2014 to April 2015. We will issue a response document in summer 2015. This will summarise the comments we received and what will happen as a result. The updated South East River Basin Management Plan will be published in December 2015, following approval by the Secretary of State.
Figure 2 - Map of the South East river basin district and the management catchments within it

7
2 The Test and Itchen Management Catchment
Figure 3 - Map of the Test and Itchen management catchment and the operational catchments within it
This predominantly rural catchment covers an area of approximately 1,760 square kilometres, and contains two rivers popularly regarded as two of the finest chalk streams in the world with their crystal clear waters supporting a rich diversity of mammal, bird, fish, and invertebrate and plant communities. Both rivers are classified as Sites of Special Scientific Interest throughout their courses, with the Itchen additionally designated as a Special Area of Conservation. They are both internationally famous for their trout and salmon fishing, and support local watercress

8
and commercial fish farming, which rely on the high water quality resulting from the groundwater. The Test and Itchen are ‘Priority Rivers’ for salmon, with the Test salmon population assessed as being ‘At risk’ and the Itchen as ‘Probably At Risk’. The geology of the catchment is dominated in the north by chalk, which provides the groundwater upon which both rivers are dependent. The major urban locations in this part of the catchment are Andover, Romsey and Winchester. In contrast, the geology of the southern part of the catchment is dominated by clay, and demonstrates very different stream characteristics. Major urban areas here are predominantly concentrated along the coast, such as Southampton, Totton and Eastleigh. The Test and Itchen catchments supply much of Hampshire’s public water needs, as well as a significant proportion of the Isle of Wight’s public water requirements. Both rivers have been modified in many ways, and now have many structures and multiple or braided channels along their lengths, supporting mills, navigation and water meadows, which have led to alterations in the flow of these watercourses. Both of these rivers drain into Southampton Water, and in turn, into the Solent. The estuarine and coastal water bodies of Southampton Water and the Solent cover a combined area in excess of 290 square kilometres. Southampton holds the 15th busiest port in Europe and, outside of London, is one of the most populated areas in the South East. The Test and Itchen river network puts nitrates and phosphates into the estuary and out to sea. Impacts of these chemicals are typically evidenced by heavy macro algal blooms (made more prevalent in hot summers). Until such time that appropriate measures are implemented changes to status may be difficult to achieve before 2021 or 2027. The ongoing ‘Sea View 2027’ partnership project aims to get a greater understanding of the Solent marine environment. Numbers of water bodies shown in the Classification graphs / Reasons For Not Achieving Good Status graphs are not the same. The reason for this is that whilst we are still in Cycle 1 of the Water Framework Directive, we are currently working on a new water body network for Cycle 2. This new network has been used to create the consultation documents; however we are still reviewing these relationships and expect these to change between now and the final updated river basin management plan for Cycle 2. The Test and Itchen management catchment has been divided into 4 operational catchments. The operational catchments have distinct characteristics and pressures, and require a different mix of measures to achieve long-term objectives for the water environment and reduce the risks of flooding.
2.1 Protected areas There are areas in the catchment where the water environment is recognised as being of particular importance because of the benefits they provide to society. These benefits include rare wildlife habitats, bathing waters or areas around drinking water sources. These areas are known collectively as ‘Protected areas’. Protected areas are a priority for action and protection to make sure we can all continue to enjoy the benefits they provide into the future, and that the investment that has already been made in protecting them is not wasted.

9
Whether a particular part of the water environment is protected or not, we still assess its status every year to understand whether it is healthy or not and whether it’s getting better or worse. Some areas require special protection under European legislation. These designations are designed to manage water, nutrients, chemicals, economically significant species, and wildlife. The management of these areas has been integrated into the overall framework of river basin planning. The table below shows the number of the different types of protected areas in the Test and Itchen catchment, and whether they are complying with the standards that are set out for their protection. Protected area type
Numbers Number compliant
Bathing Waters* 0 0 Surface Drinking Waters 3 2 Groundwater Drinking Waters 4 2 Special Areas of Conservation (SAC)** 2 N/A Special Protection Area (SPA)** 1 N/A Shellfish Waters*** 3 0 Urban Wastewater Treatment 2 2 * There are no Bathing Waters in Southampton Water. Bathing Waters located in the Solent Coastal Water body are noted within the other Hampshire based management catchments. **These comprise the Itchen and the Solent Maritime SAC only and the Solent and Southampton SPA. Natural England is responsible for assessing the status of Natura 2000 protected areas (N2KPAs). Information is not gathered at the catchment level; instead they collate information about the Sites of Special Scientific Interest (SSSIs) that make up all N2KPAs. Information about the status of SSSIs in this catchment can be accessed via: http://www.sssi.naturalengland.org.uk/Special/sssi/search. cfm and through: http://www.magic.gov.uk. *** Specifically, this figure relates to those Shellfish Waters within Southampton Water. More information can be found about protected areas, including how compliance is assessed, in the river basin management planning annex: http://ea.objective.co.uk/file/3078877
2.2 Status of waters In 2009 this catchment was divided up into 53 river water bodies, 3 lakes, 1 canal, 1 estuary, 1 coastal water and 4 groundwater bodies. We are proposing some changes to the way the catchment is divided up, which are described in more detail below. In 2009 38% of water bodies were classified at Good Ecological Status (GES) or better. Additional classification information by water body type can be found here: http://environment.data.gov.uk/catchment-planning/ Figure 4 (below) shows the classification for the catchment’s surface waters and groundwaters in 2009, when the first river basin management plan was published, and the most recent (2013) status.

10
Figure 4 - Chart showing the classification of all water bodies in the Test and Itchen catchment in cycle 1
Since 2009, progress has been made towards addressing environmental problems for those water bodies below good status and those at risk of deteriorating below good status. Overall compliance has not improved in surface waters or in the marine environment, and there has been slight deterioration. Significant improvements have been made with regards to habitat improvements, improvements to flow and removal of impacting structures. However our evidence gathering and understanding of the evidence has improved resulting in some water body classifications (based on more accurate and better quality biological and chemical monitoring data) being reported as being in poorer condition than originally stated. There has been no improvement to failures in groundwaters. Initially, efforts focussed on assessing and reviewing pressures on the water environment and working on why environmental problems are occurring. Subsequently, targeted efforts moved towards addressing: physical modifications, habitat improvements and tackling diffuse and point source pollution issues in both rural and urban locations and across surface waters and groundwater. Since 2009, the Environment Agency and its partners have worked to understand reasons for not achieving good ecological status. Partnership work continues to progress with habitat improvement projects and removal of in-channel structures having taken place. Review and modification of abstraction permit limits and water quality discharge consents has also been undertaken. We are now waiting for the water environment to respond to these efforts, which will be checked through routine monitoring. Many rivers and streams have been changed to help better support: agriculture, aquaculture, allow urban development and help manage flood risk. These (often historical) changes can damage habitats and make it harder for flora and fauna to flourish. Pollutants often contain nutrient enriching substances (phosphate, nitrate
0
5
10
15
20
25
30
35
2009 2013
Num
ber o
f wat
er b
odie
s
Year
Classification of all water bodies in the Test & Itchen catchment in cycle 1
High Good Moderate Poor Bad Not assessed

11
and ammonia) which affect the waters' oxygen levels and its ability to support plants and wildlife. Due to the extent of channel modification, pressures on water use and diffuse pollution sources, the main challenges to improving the water environment have been to:
• implement measures which “re-naturalise” modified channels, improve river flows,
• remove obstructions to fish passage, poor refuge and spawning locations, • pinpoint sources of rural (for example road and field water “runoff”) and urban
pollution (such as urban drainage and wastewater), • address high levels of chemicals such as nitrates in groundwaters which
impact upon much of the spring-fed river network, and, in turn flow into the sea.
This consultation is concerned with the health of all the water in the Test and Itchen catchment, surface water and groundwater, freshwater and marine. The four groundwater water bodies in this catchment are designated as drinking water protected areas. This is due to rising trends of nitrates. Two groundwater bodies are at poor chemical status. One also has water quality issues associated with solvent pollution and the other is at poor status for water quantity. These groundwater bodies are used extensively for public and private water supplies and provide baseflow to the rivers in the catchment. Nutrients have a significant influence on both river and marine water quality. There is a risk of further deterioration in the catchment from point and diffuse pollution sources (urban and rural), and abstraction. Measures in these catchments will be focused on preventing and limiting inputs to improve long term trends in quality. This will be achieved by priority and continued investigations in the six safeguard zones. These are zones where raw drinking water supplies (for examples, rivers, reservoirs and aquifers) are at risk of deterioration due to the use of substances like pesticides or nitrates for land management within this management catchment in order to assess risks, target regulation and develop pollution prevention campaigns and partnership working.
Nutrients are also a significant pressure affecting the estuarine and coastal water bodies in this management catchment and other adjacent catchments. They impact on Natura 2000 sites (for example the Solent Maritime SAC) by causing excessive seaweed growth which impacts habitats. These TRaC waters recorded moderate ecological status in 2009. Both are classified as “heavily modified” meaning they have been artificially altered to meet human needs. Nitrogen levels, Tributyltin (TBT) and failing Protected Areas (EU Bathing, Shellfish Waters and Natura 2000 sites) are key failing components. Continued investigations aim to establish reasons for failure and solutions to improve the marine environment.
2.3 Improvements to how water bodies are assessed Improvements have been made to the way water bodies are defined and classified since the plans were published in 2009. Subject to consultation, the changes will be

12
adopted when the updated plans are published in 2015. You can find more information about these improvements in the ‘river basin management planning Annex’ at: http://ea.objective.co.uk/file/3078877. The table below shows the status of the different kinds of water bodies (in 2nd cycle) in the management catchment based on these new approaches. Management Catchment Numbers of water bodies at each status or potential in
2013 (using new building blocks)
Water body type
High Good Moderate Poor Bad
Rivers & Canals (including Surface Water Transfers)
0 14 17 0 0
Lakes
0 0 1 0 0
Estuaries and Coastal waters
0 0 2 0 0
Ground waters
- 2 - 2 -
For more information on the changes since cycle 1, please see section 4.3 ‘Changes since first cycle (new building blocks)’ within Part 2 (technical annex) of the RBMPs. (http://ea.objective.co.uk/file/3078877) The Test and Itchen Catchment Partnership welcomed the Water Framework Directive (WFD) process and recent WFD status-improvements within the catchment, although queried whether fish-classification improvements are robust. Water quality monitoring indicates high levels of phosphorus in the upper Itchen and elsewhere. Observational evidence on macrophyte and invertebrate decline from the headwaters of both rivers supports this observation. Various studies are investigating the source of these phosphates and how they enter rivers and streams. Wider stakeholders have raised concerns about water clarity on the middle Test; thought to be related to high nutrient levels. This is also perceived as an issue across both rivers. Water quality and ecology can be affected by sedimentation, soil runoff, highways inputs, erosion of banks (e.g. the Itchen Navigation) and sewerage inputs (e.g. the Bourne and Pillhill Brook). These effects are exacerbated during flooding, potentially masking any underlying changes in water quality. There are opportunities for natural flood risk management approaches (e.g. wetland creation) providing multiple benefits and more sustainable solutions than traditional hard-engineered measures. Relevant to Sites of Specific Scientific Interest (SSSI) and Special Areas of Conservation (SAC) objectives, non-native invasive species are present on both rivers (e.g. Himalayan and Orange Balsam, Signal Crayfish, American Mink and Top-mouth Gudgeon).

13
Although mitigation measures are in place, nutrients and dredging impacts are still a concern in the estuarine and coastal waters.
2.4 Investigating the water environment in the Test and Itchen management catchment
Since the initial assessment of status was made, the Environment Agency and its partners have been working to understand the reasons for not achieving good status. Since 2009, the Environment Agency has carried out over 200 investigations in the Test and Itchen catchment. These have helped to determine the reasons why water bodies are failing and the likely causes.
Figure 5 - Chart showing the reasons for not achieving good status of water bodies in the Test and Itchen catchment by type and source sector (latest position on cycle 1 water body network)
All reasons for not achieving good status data are available on the catchment data explorer at: http://environment.data.gov.uk/catchment-planning/.
2.5 Challenges and choices consultation 2013 In 2013, through the ‘Challenges and choices’ consultation, the Environment Agency asked for your views on:
• the significant issues that are limiting the benefits society obtains from the water environment (the challenges), and
• the best way to address these issues and what should be done first (the choices).
The responses received largely agreed with the issues identified, acknowledging the main challenges as relating to water quality, physical modification, and abstraction and low flows. Some consultees raised the importance of considering the whole water network including the value of smaller streams, and that water bodies in this
0 5 10 15 20 25 30
Agriculture and rural land management
Other (not in list)
Unable to assign to a sector
Not applicable
Water Industry
Number of Reasons
Sour
ce S
ecto
rs
Reasons for not achieving good status of water bodies in the Test and Itchen catchment
Changes to the natural flow and levels of water Natural Conditions/Suspect Data Negative effects of non-native species Other pressures Physical modifications Pollution from mines Pollution from rural areas Pollution from towns, cities and transport Pollution from waste waters

14
catchment should strive to attain High status, reflecting the significance of protected habitats in this catchment. There was considerable attention drawn to the inputs of sediment and nutrients, particularly phosphorus, and the value of Catchment Sensitive Farming (CSF) work in helping address this. Water quality impacts arising from highways were noted, and those associated with wastewater treatment works and septic tanks, particularly during flood events. Physical modifications were raised as an important issue, along with the presence of invasive non-native species. Concern was expressed about the pressure the catchment is under to provide potable water and the potential for fracking. Catchment partnerships were considered invaluable for sharing evidence and acting as a delivery body which can co-ordinate action across the catchment in both the short and long-term. Money is essential to help deliver the necessary improvements, alongside adopting a Paid Ecosystem Services approach, and awareness raising initiatives, which were valued as complementing on-the-ground work. For further information on the responses submitted during the ‘Challenges and choices’ consultation, please see the consultation response document here: https://consult.environment-agency.gov.uk/portal/ho/wfd/water/choices.
2.6 Taking action in partnership In June 2013, the Department for Environment, Food and Rural Affairs (Defra) published a policy framework to encourage the wider adoption of an integrated Catchment Based Approach to improving the quality of the water environment, which incorporated findings from the pilot phase. The objectives for the Catchment Based Approach are:
• to deliver positive and sustained outcomes for the water environment by promoting a better understanding of the environment at a local level; and
• to encourage local collaboration and more transparent decision-making when both planning and delivering activities to improve the water environment.
Adopting the approach will promote the development of more appropriate river basin management plans (which underpin the delivery of the objectives of the Water Framework Directive) but will also provide a platform for engagement, discussion and decisions of much wider benefits including tackling diffuse agricultural and urban pollution, and widespread, historical alterations to the natural form of channels. The Environment Agency is a member of the Test and Itchen Catchment Partnership, who are developing a plan to enhance the catchment. This summary has been informed by the partnership, both formally through the ‘Challenges and choices’ consultation and through the ongoing work to develop measures to protect and improve the water environment. As well as shaping the updates to the river basin management plan, the results of this consultation will be used to inform the work of the partnership. The Test and Itchen Catchment has a strong history of collaborative working to take action for our rivers and wetlands. Organisations active in the catchment have championed taking a catchment based approach, undertaking extensive

15
programmes of research, habitat management, restoration and awareness-raising. Hosted by Wessex Chalk Stream and Rivers Trust (WCSRT) and Hampshire and Isle of Wight Wildlife Trust (HIWWT), the Test and Itchen Catchment Partnership formed in 2012. It brings together the Environment Agency, Natural England, Catchment Sensitive Farming, Hampshire County Council, Test and Itchen Association, South Downs National Park Authority, National Farmers Union, the Watercress Growers Association, and Southern Water. The members share a vision for high water quality and sustainable flows, abundant wildlife, and resilient functioning ecosystems. They will steer the work of the Partnership Officers on behalf of the wider stakeholders, who are kept informed and involved via workshops, events, a newsletter and website, and opportunities to help develop and deliver projects in line with the partnership’s vision. A Test and Itchen Catchment Action Plan guides this process, bringing together issues identified by data and evidence, existing plans and strategies, and stakeholder input. It will be a live plan which evolves as the work of the partnership develops. It is summarised at www.ticp.org.uk. The TRaC specific ‘Sea View 2027’ partnership project aims to work with the marine stakeholders in the Solent so we can better describe the estuary and coast. This work will inform our targets and our actions. During the first cycle of the river basin management plan, a range of partners have been working to improve and protect the water environment. For example, Southern Water, working closely with the Environment Agency, has delivered schemes to improve water quality downstream of its waste water treatment works. Projects may cover multiple water bodies; therefore whole project costs within each catchment will be counted for each catchment, and not the proportion within the catchment. Projects already undertaken or underway and described in the Test and Itchen draft Catchment Action Plan include:
• The Itchen Navigation Project (led by Hampshire and Isle of Wight Wildlife Trust) which stabilised the banks and enhanced the habitats of this historic waterway;
• The Winnall Moors Restoration Project (led by Hampshire and Isle of Wight Wildlife Trust) which restored significant reaches of the river and floodplain at Winchester;
• The River Anton Enhancement Strategy (Test Valley Borough Council) which sees staff and volunteers delivering habitat management and enhancements in Andover;
• The Romsey Waterways and Wetlands Environment Strategy (Test Valley Borough Council) which directs habitat enhancements and opportunities for access and engagement around Romsey's waterways; and
• The River Catchment Invertebrate Fingerprinting Programme (Wessex Chalk Stream and Rivers Trust) which will help to pin-point sources of diffuse and point source pollution across the Test and Itchen catchment.

16
2.7 Measures that could improve the water environment Where a failure has been identified, a range of measures have been assessed that would be needed to improve the status of water bodies. The Environment Agency has made an assessment of the measures needed to achieve positive benefits for the water environment and society. The measures have been grouped together to ensure the cumulative ‘catchment’ effect is considered. Where possible, climate resilient measures have been chosen. However it is considered unlikely that the measures will be sufficient to address all impacts of climate change and we will be assessing the likely gaps before the publication of the final river basin management plans: https://www.gov.uk/government/consultations/update-to-the-draft-river-basin-management-plans As well as the measures needed to improve the status of water bodies, other measures are needed to:
• protect or improve ‘Protected Areas’ within the operational catchment • prevent water bodies deteriorating from their current status.
Some of these measures will benefit more than one water body or catchment and some are very specific. The cumulative effect and benefits of measures for the operational catchment have been considered. The measures proposed for this catchment are:
Improve modified physical habitats • Removal or easement of barriers to fish migration • Removal or modification of engineering structure • Improvement to condition of channel/bed and/or banks/shoreline • Improvement to condition of riparian zone and /or wetland habitats • Vegetation management
Manage pollution from towns, cities and transport • Reduce diffuse pollution pathways (i.e. control entry to the water environment)
Improve the natural flow and level of water • Improvement to condition of channel/bed and/or banks/shoreline
Manage invasive non-native species • Building awareness and understanding (to slow the spread)
Manage pollution from rural areas • Reduce diffuse pollution at source • Mitigate/remediate diffuse pollution impacts on the receptor
2.8 Economic appraisal and environmental assessment of measures to improve the water environment
The benefits that measures will bring to society, along with the cost and any disbenefits (negative impacts) of implementing them, have been assessed in economic appraisals. The appraisals aim to identify whether the measures needed to improve the water environment are cost beneficial, in other words, the benefits are greater than the costs. The effects of the measures on the wider environment are also considered, which helps to inform the environmental assessment. The results of the appraisals will help to decide if it is economically, environmentally and socially worthwhile to implement the measures.

17
Environmental and socio-economic benefits and disbenefits (negative impacts) are considered in the economic appraisals. A monetary value has been assigned to some benefits. For surface waters, this is based on society’s willingness to pay for improvements in the water environment1. For ground waters, values used have been ‘transferred’ from other detailed economic studies2. Other benefits and disbenefits which have not been monetised have been identified and form part of the overall appraisal results. The majority of the costs of measures, assessed in the economic appraisals carried out, are estimates. Costs are from local and national sources, and are based on previous experience of implementing similar measures. Where more accurate, local cost information is available, this has been used in place of national estimates. The economic appraisals have been carried out at the operational catchment scale. If the group of measures to improve all water bodies in the catchment to good status is not considered to be cost beneficial (so the cost outweighs the benefits), or would have significant adverse effects on the wider environment, an alternative group of measures to achieve the most for the water environment has been appraised. Assessing the costs and benefits of improving our water environment is an ongoing process and economic appraisals will need to be updated as new and better information becomes available. Your responses to this consultation will help us gather more and better information about the costs and benefits of the measures needed. The economic appraisals we’ve carried out will be refined before the updated South East River Basin Management Plan is published. For more information on the approach taken for catchment economic appraisals and environmental assessment, please see the draft update to the South East River Basin Management Plan: https://consult.environment-agency.gov.uk/portal/ho/wfd/draft_plans/consult?pointId=s1405418101234#section-s1405418101234
2.9 Proposed long term objectives In the consultation, we ask for your views on the proposed long term objectives for the water environment, based on preventing a drop in status and delivering all improvements which are technically feasible and worthwhile, based on economic appraisal. In the following operational catchment sections, we look at the possible scale of improvement which could happen in the second cycle, based on current knowledge of plans and actions.
1Willingness to pay values used are from The Environment Agency’s National Water Environment Benefits Survey (2007, updated 2012). 2 ‘Benefits transfer’ is a recognised way of using benefit values from existing academic studies and surveys. Other benefits which have not been monetised have been identified and form part of the overall economic appraisal results.

18
2.10 Links to other management plans Achieving the long term objectives for the water environment will require a coordinated approach to making improvements across a number of different planning processes. The Strategic Environmental Assessment Environment Report considers the full range of plans that are relevant to the South East River Basin District and its catchments. To see this report go to: http://ea.objective.co.uk/file/3078974. One of the most important links relates to the way flood risks are managed in the catchment. Over the next two years, the Environment Agency will be undertaking considerable planning work, culminating in the publication of the updated river basin management plans (RBMPs) and the flood risk management plans (FRMPs). Together, these plans will shape important decisions, direct considerable investment and action, and deliver significant benefits to society and the environment. The two planning processes are working to common river basin district (RBD) boundaries and many key stakeholders have an interest in both. As the plans themselves and the supporting documents/data-sets are complex, we have decided not to integrate them into a single set of consultation documents. Instead we will coordinate the engagement around the planning processes, promoting them together, cross-referencing, and explaining how they relate to each other. We believe this is the best way to make it easy for you to participate in either, or both, consultations. The flood risk management plan consultation coincides with the launch of this consultation. It includes the measures proposed to manage flood risk, and can be found at: www.gov.uk/government/consultations/draft-flood-risk-management-plans. Sources of flood risk in the Test and Itchen area include river, sea, surface and ground water flooding. Flood risk is concentrated within the urban areas such as Southampton, Petersfield, Emsworth, Romsey, Winchester and Andover. Proposed actions in the flood risk management plan for the catchment implementation of the coastal and erosion strategy, implementation of surface water management schemes in Southampton, Calmore Canal Fluvial Flood Alleviation Scheme (FAS), Winchester FAS, Romsey FAS, Petersfield FAS, and Emsworth Property Level Protection. These proposed schemes all aim to reduce flood risk to properties in the area and, where feasible, enhance the environment.
3 Operational catchments The following sections give an overview of the current state of the water environment in each of the operational catchments; the reasons for not achieving good status; and the measures being proposed to protect and improve the health of the water.

19
3.1 Itchen Operational Catchment
Figure 6 - Picture of the River Itchen at Winnall
The River Itchen is fed by three major tributaries in its upper reaches; the Candover Stream, River Alre and the Cheriton Stream. The river flows through many Hampshire villages before entering the city of Winchester, from where it heads south, through a series of water meadows, before reaching the northern suburbs of Southampton at Mansbridge. Here it is joined by the Monks Brook just above its tidal limit before flowing into Southampton Water at Woodmill. The section between Winchester and Southampton also includes the Itchen Navigation - a disused 18th century canal system linking Winchester to the sea.
Figure 7 - Map of the Itchen operational catchment
There are two forms of classification referred to in the text and graphs below: cycle 1 and cycle 2. Cycle 1 classification was the system used for the first river basin

20
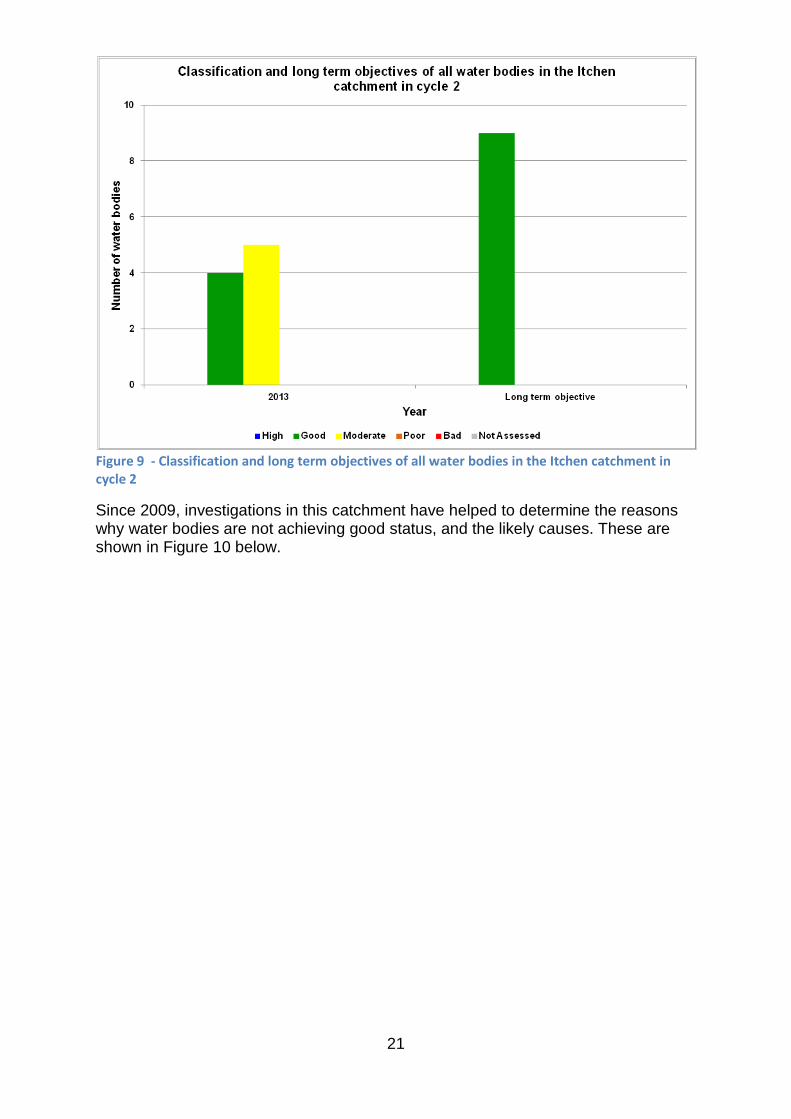
management plan and cycle 2 is being used for the updated river basin management plan. Cycle 2 uses upgraded classification tools and environmental standards, and has led to a change in water body boundaries to ensure that the catchment is best represented. In the Itchen Operational Catchment this has resulted in changes to the number of water bodies and changes in classification which are shown in Figure 8 and 9 (overleaf). For the second river basin management plan (cycle 2), there are 7 rivers, 1 canal and 1 lake in this catchment. The status (health) of the water environment in 2009 (using cycle 1 water body network) was assessed as being generally moderate overall, please see Figure 8 below. In 2013, the status of the water environment had deteriorated. It can take five to ten years for the positive benefits of actions to be reflected in the ecological status. Our current analysis suggests that 100% of the water bodies in the Itchen catchment should have a long term objective of achieving good ecological status or potential (by 2027), as shown in Figure 9 (overleaf).
Figure 8 - Chart showing the classification of all water bodies in the Itchen catchment in cycle 1
For more information on the changes since cycle 1, please see section 4.3 ‘Changes since first cycle (new building blocks)’ within Part 2 (technical annex) of the RBMPs. (http://ea.objective.co.uk/file/3078877)
0
2
4
6
8
10
12
2009 2013
Num
ber o
f wat
er b
odie
s
Year
Classification of all water bodies in the Itchen catchment in cycle 1
High Good Moderate Poor Bad Not assessed
21
Figure 9 - Classification and long term objectives of all water bodies in the Itchen catchment in cycle 2
Since 2009, investigations in this catchment have helped to determine the reasons why water bodies are not achieving good status, and the likely causes. These are shown in Figure 10 below.

22
Figure 10 - Chart showing the reasons for not achieving good status of water bodies in the Itchen catchment by type and source sector (latest position on cycle 1 water body network)
Measures to improve the water environment have been assessed. Some of these measures will benefit more than one water body or catchment and some are very specific. The cumulative effect and benefits of measures for the operational catchment have been considered. The measures proposed for this catchment are shown in the table below
Improve modified physical habitats • Improvement to condition of channel/bed and/or banks/shoreline
• Improvement to condition of riparian zone and /or wetland habitats
Manage pollution from rural areas • Mitigate/remediate diffuse pollution impacts on the receptor
All of these measures are considered to be needed to improve the water environment to as near to good status as practicable. The costs and benefits of the measures have been considered in the catchment economic appraisal, results of which are shown below. You can find out more detail on the status and long term objectives by using the Catchment Data Explorer tool at: http://environment.data.gov.uk/catchment-planning/.
3.1.1 Itchen catchment economic appraisal and environmental assessment
3.1.2 Results and recommendation Measures proposed to improve the water environment to good status in this catchment are cost beneficial; the benefits are greater than the costs.
0 5 10 15 20 25 30
Agriculture and rural land management
Industry, Manufacturing and other Business
Unknown (not ascertainable)
Urban and Transport
Water Industry
Number of Reasons
Sour
ce S
ecto
rs
Reasons for not achieving good status of water bodies in the Itchen catchment
Changes to the natural flow and levels of water Natural Conditions/Suspect Data
Negative effects of non-native species Other pressures
Physical modifications Pollution from mines
Pollution from rural areas Pollution from towns, cities and transport
Pollution from waste waters

23
Net present value
£4 million
Benefit cost ratio
3.4
Present value benefits
£5.6 million
Present value costs
£1.6 million
The results of the economic appraisal are shown below.
3.1.3 Monetised costs and benefits of implementing the measures proposed for this catchment3
This means that for every pound that is spent towards improving the water environment in this catchment, you could expect to receive £3.40 of benefits.
3.1.4 Benefits and costs of implementing the measures proposed for this catchment4 5
Ecosystem Service Benefits and disbenefits to society
Description
Positive or negative impact ˄˄: very positive ˄: positive 0: neutral ˅: negative ˅˅: very negative
Fresh water
Re-naturalising watercourses (focussing on channel beds, margins and enhanced habitats and structure removal/modification) and other incentives (such as tree shading) can assist in sustaining or improving flows, mitigate against impacts of climate change (e.g. drought) along the length of this sub-catchment (covering approximately 140.3 Kms and 0.08 Km2). Overall, the suite of measures will have a positive impact on flow, form and ecology, and can be considered unlikely to negatively impact on freshwater provision.
˄˄
Food (e.g. crops, fruit, fish etc.)
There is real drive and enthusiasm through collaborative working (and the actions identified) that this catchment could attain good ecological
˄˄
3 The benefits and costs are shown in ‘Present Value’ terms, which is a way of expressing the value of costs and benefits that will happen in the future in today’s money. We apply a ‘discount’ rate and benefits to reflect people’s preference for receiving goods and services now rather than later.
4Improving the water environment has wider benefits than those we have been able to monetise in the appraisals. We have
identified these using ecosystem services. An ecosystem service is a ‘service’ that the natural environment provides that improves our quality of life. 5Improving the water environment has wider benefits than those we have been able to monetise in the appraisals. We have
identified these using ecosystem services. An ecosystem service is a ‘service’ that the natural environment provides that improves our quality of life.

24
Ecosystem Service Benefits and disbenefits to society
Description
Positive or negative impact ˄˄: very positive ˄: positive 0: neutral ˅: negative ˅˅: very negative
status or good ecological potential for the 4 water bodies with what the current suite of actions currently plans to focus on. At the time of writing, 8 out of 15 (53%) of (cycle 1) water bodies were currently categorised as good ecological status/potential or expected to be at good status/potential. Potentially significant beneficial effects include: habitat creation and adjustment to help halt or reverse hydromorphology issues identified within the Water Framework Directive monitoring results. Better flows can improve "scouring" (or cleansing) of river systems thus reducing sediment deposition, increasing clarity and improving water quality. In addition, better fish refuge and more diverse habitat may lead to improved fish stocks. Furthermore improved flow and water quality can improve conditions within which to commercially farm fish. Particularly on "on-line" stocking ponds. Potentially significant beneficial effect through reduced fish culls and improved fish stocks. This is specifically relevant to the commercial fish farms and commercial angling interests. The net effect of applying those actions identified will be positive. This means that significant ecological improvements to both habitats and water quality could be expected, alongside measures delivering benefit to commercial angling and fisheries (including fish stocking ponds for human consumption). Over 20 structures have been suggested for removal or modification and suggested environmental enhancements (habitat management/ creation/ improvement) could be realised. The length of river improved could stretch from the headwaters to the sea. The length of river opened up to fish passage could be as much as 110km.
Water for non-consumptive use
Potentially significant long term impact due to increased efficiency of hydropower plant, if present on water body. Non-delivery or delivery of the actions derived for this sub-catchment would not have adverse
˄
25
Ecosystem Service Benefits and disbenefits to society
Description
Positive or negative impact ˄˄: very positive ˄: positive 0: neutral ˅: negative ˅˅: very negative
consequences on this provisioning service. As at the time of writing, at least four applications for hydropower were in transit. The cumulative effect could cause significant impacts upon aspects such as flow, fish passage, geomorphology and ecology if not managed correctly.
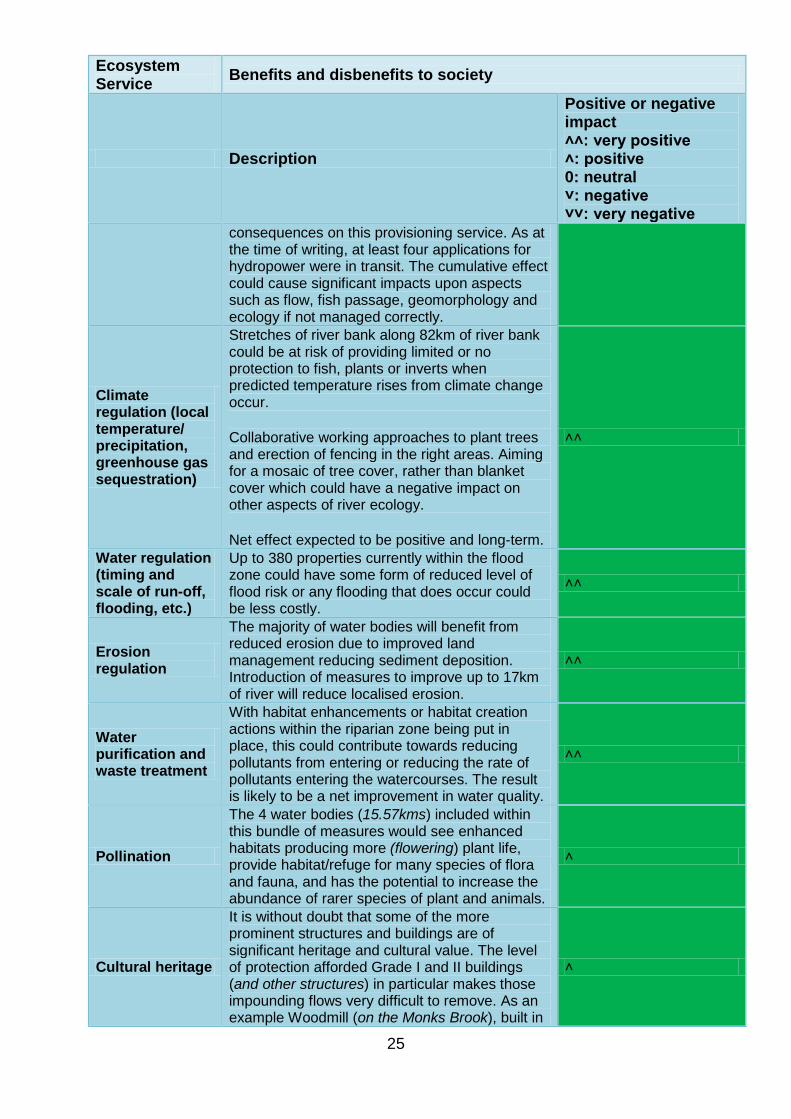
Climate regulation (local temperature/ precipitation, greenhouse gas sequestration)
Stretches of river bank along 82km of river bank could be at risk of providing limited or no protection to fish, plants or inverts when predicted temperature rises from climate change occur. Collaborative working approaches to plant trees and erection of fencing in the right areas. Aiming for a mosaic of tree cover, rather than blanket cover which could have a negative impact on other aspects of river ecology. Net effect expected to be positive and long-term.
˄˄
Water regulation (timing and scale of run-off, flooding, etc.)
Up to 380 properties currently within the flood zone could have some form of reduced level of flood risk or any flooding that does occur could be less costly.
˄˄
Erosion regulation
The majority of water bodies will benefit from reduced erosion due to improved land management reducing sediment deposition. Introduction of measures to improve up to 17km of river will reduce localised erosion.
˄˄
Water purification and waste treatment
With habitat enhancements or habitat creation actions within the riparian zone being put in place, this could contribute towards reducing pollutants from entering or reducing the rate of pollutants entering the watercourses. The result is likely to be a net improvement in water quality.
˄˄
Pollination
The 4 water bodies (15.57kms) included within this bundle of measures would see enhanced habitats producing more (flowering) plant life, provide habitat/refuge for many species of flora and fauna, and has the potential to increase the abundance of rarer species of plant and animals.
˄
Cultural heritage
It is without doubt that some of the more prominent structures and buildings are of significant heritage and cultural value. The level of protection afforded Grade I and II buildings (and other structures) in particular makes those impounding flows very difficult to remove. As an example Woodmill (on the Monks Brook), built in
˄
26
Ecosystem Service Benefits and disbenefits to society
Description
Positive or negative impact ˄˄: very positive ˄: positive 0: neutral ˅: negative ˅˅: very negative
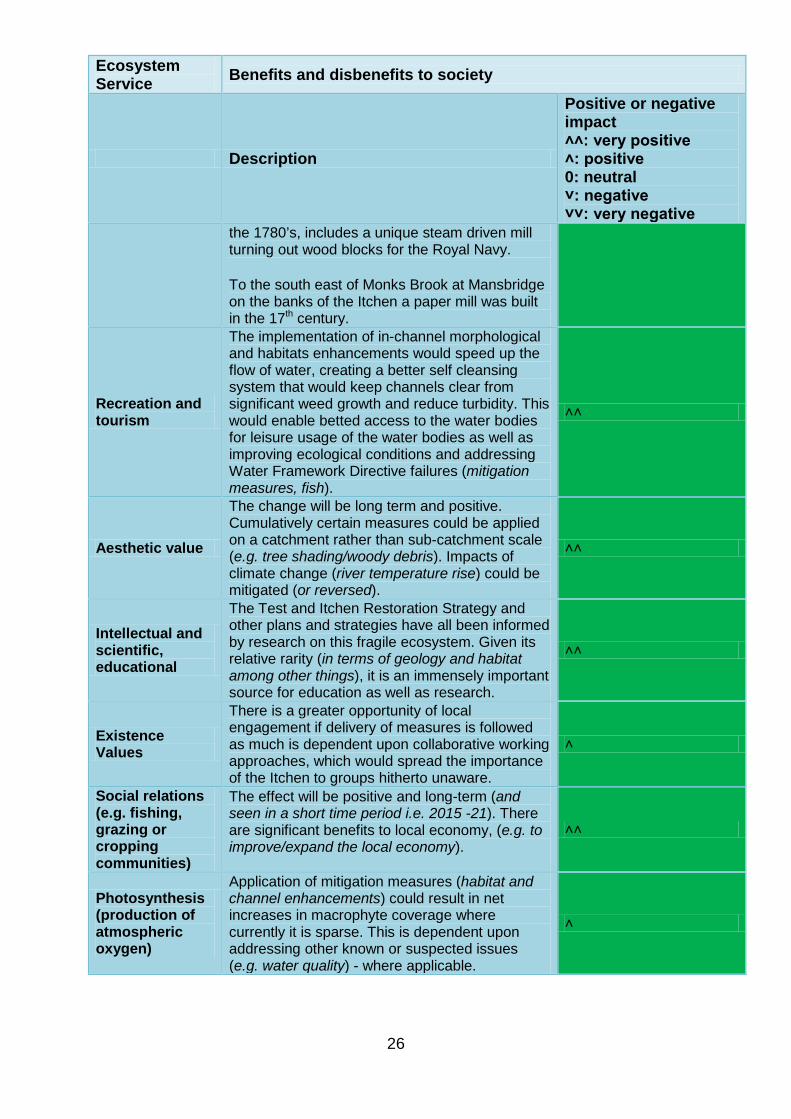
the 1780’s, includes a unique steam driven mill turning out wood blocks for the Royal Navy. To the south east of Monks Brook at Mansbridge on the banks of the Itchen a paper mill was built in the 17th century.
Recreation and tourism
The implementation of in-channel morphological and habitats enhancements would speed up the flow of water, creating a better self cleansing system that would keep channels clear from significant weed growth and reduce turbidity. This would enable betted access to the water bodies for leisure usage of the water bodies as well as improving ecological conditions and addressing Water Framework Directive failures (mitigation measures, fish).
˄˄
Aesthetic value
The change will be long term and positive. Cumulatively certain measures could be applied on a catchment rather than sub-catchment scale (e.g. tree shading/woody debris). Impacts of climate change (river temperature rise) could be mitigated (or reversed).
˄˄
Intellectual and scientific, educational
The Test and Itchen Restoration Strategy and other plans and strategies have all been informed by research on this fragile ecosystem. Given its relative rarity (in terms of geology and habitat among other things), it is an immensely important source for education as well as research.
˄˄
Existence Values
There is a greater opportunity of local engagement if delivery of measures is followed as much is dependent upon collaborative working approaches, which would spread the importance of the Itchen to groups hitherto unaware.
˄
Social relations (e.g. fishing, grazing or cropping communities)
The effect will be positive and long-term (and seen in a short time period i.e. 2015 -21). There are significant benefits to local economy, (e.g. to improve/expand the local economy).
˄˄
Photosynthesis (production of atmospheric oxygen)
Application of mitigation measures (habitat and channel enhancements) could result in net increases in macrophyte coverage where currently it is sparse. This is dependent upon addressing other known or suspected issues (e.g. water quality) - where applicable.
˄
27
The Final Appraisal Report and associated documents provide a more detailed summary of these results. This can be requested at [email protected].
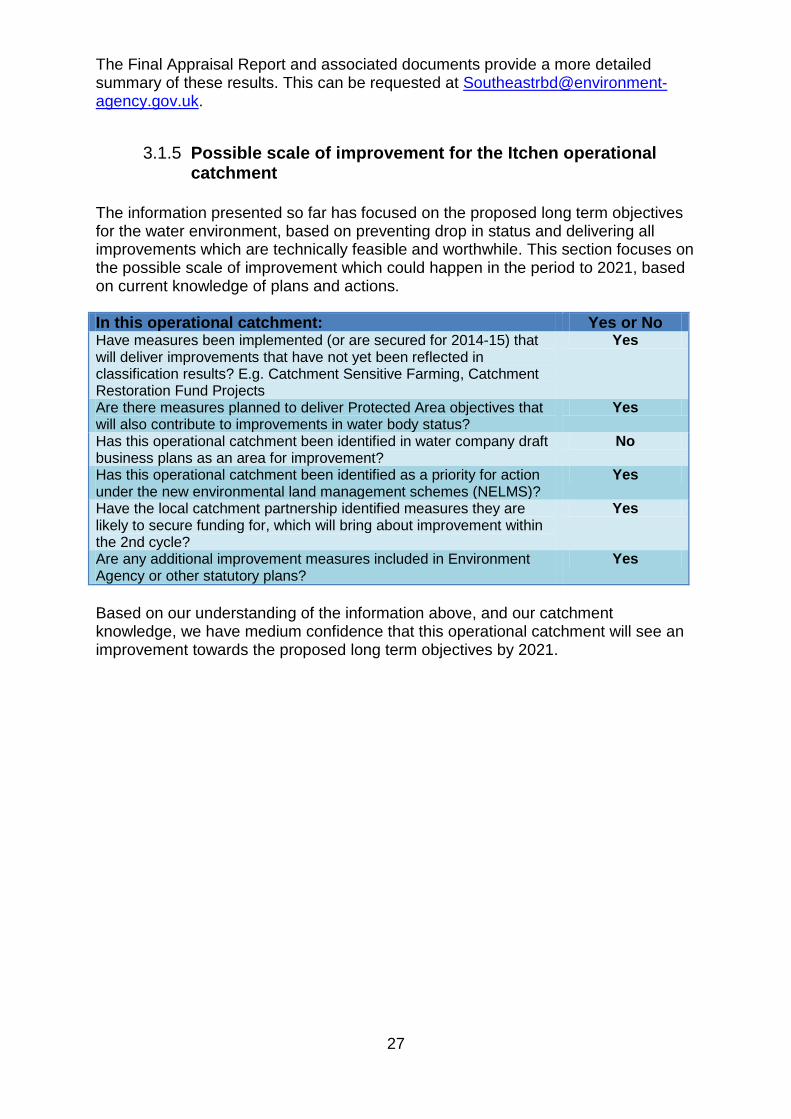
3.1.5 Possible scale of improvement for the Itchen operational catchment
The information presented so far has focused on the proposed long term objectives for the water environment, based on preventing drop in status and delivering all improvements which are technically feasible and worthwhile. This section focuses on the possible scale of improvement which could happen in the period to 2021, based on current knowledge of plans and actions. In this operational catchment: Yes or No Have measures been implemented (or are secured for 2014-15) that will deliver improvements that have not yet been reflected in classification results? E.g. Catchment Sensitive Farming, Catchment Restoration Fund Projects
Yes
Are there measures planned to deliver Protected Area objectives that will also contribute to improvements in water body status?
Yes
Has this operational catchment been identified in water company draft business plans as an area for improvement?
No
Has this operational catchment been identified as a priority for action under the new environmental land management schemes (NELMS)?
Yes
Have the local catchment partnership identified measures they are likely to secure funding for, which will bring about improvement within the 2nd cycle?
Yes
Are any additional improvement measures included in Environment Agency or other statutory plans?
Yes
Based on our understanding of the information above, and our catchment knowledge, we have medium confidence that this operational catchment will see an improvement towards the proposed long term objectives by 2021.

28
3.2 Upper and Middle Test Operational Catchment
Figure 11 - Example of cattle poaching of the bank on the River Test
This catchment covers the Test from its source at Ashe, down-stream to Mottisfont, before the confluence with the Dun. Throughout its length, it flows down a gentle gradient through a broad flood plain flanked by mainly arable farmland with some grazing on the valley floor. The Test gains water from the underlying chalk and several ephemeral tributaries. It is designated a Site of Special Scientific Interest (SSSI), along with a section of the Dever, and is a highly managed and modified system, with many sections divided into main river and carriers, which historically served a network of mills and water meadow systems.
Figure 12 - Map of the Upper and Middle Test operational catchment
There are two forms of classification referred to in the text and graphs overleaf, cycle 1 and cycle 2. Cycle 1 classification was the system used for the first river basin management plan and cycle 2 is being used for the updated river basin management

29
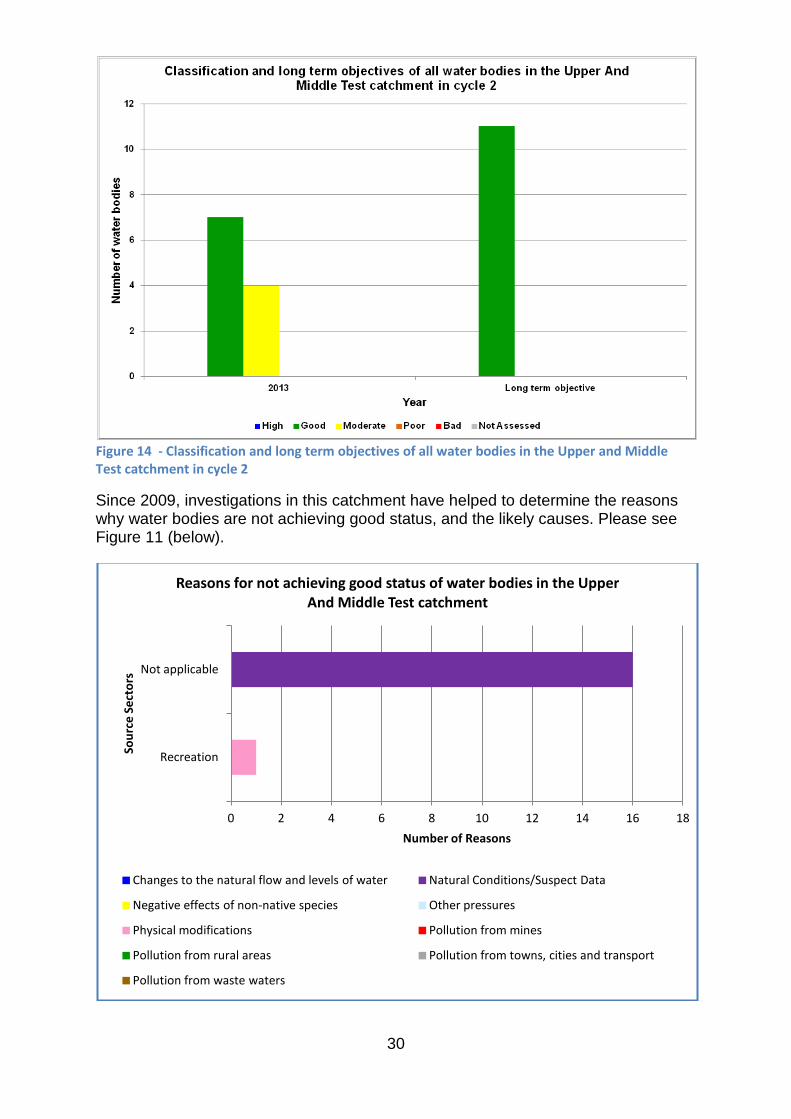
plan. Cycle 2 uses upgraded classification tools and environmental standards, and has led to a change in water body boundaries to ensure that the catchment is best represented. In the Upper and Middle Test Operational Catchment this has resulted in changes to the number of water bodies and changes in classification which are shown in Figure 13 and 14 (below and overleaf). For the second river basin management plan (cycle 2), there are 11 rivers in this catchment. The status (health) of the water environment in 2009 was assessed (using cycle 1 water body network) as being generally moderate see Figure 13 (below). In 2013, the status of the water environment had deteriorated. Two water bodies at the top of this catchment could not be assessed due to inopportune weather resulting in inconclusive monitoring results. These two water bodies will be provided with a renewed classification in the next round of monitoring. It can take five to ten years for the positive benefits of actions to be reflected in the ecological status. Our current analysis suggests that 100% of the water bodies in the Upper and Middle Test catchment should have a long term objective of achieving good status, as shown in Figure 14 (overleaf).
Figure 13 - Chart showing the classification of all water bodies in the Upper and Middle Test catchment in cycle 1
For more information on the changes since cycle 1, please see section 4.3 ‘Changes since first cycle (new building blocks)’ within Part 2 (technical annex) of the RBMPs. (http://ea.objective.co.uk/file/3078877)
0
1
2
3
4
5
6
7
8
9
10
2009 2013
Num
ber o
f wat
er b
odie
s
Year
Classification of all water bodies in the Upper and Middle Test catchment in cycle 1
High Good Moderate Poor Bad Not assessed
30
Figure 14 - Classification and long term objectives of all water bodies in the Upper and Middle Test catchment in cycle 2
Since 2009, investigations in this catchment have helped to determine the reasons why water bodies are not achieving good status, and the likely causes. Please see Figure 11 (below).
0 2 4 6 8 10 12 14 16 18
Recreation
Not applicable
Number of Reasons
Sour
ce S
ecto
rs
Reasons for not achieving good status of water bodies in the Upper And Middle Test catchment
Changes to the natural flow and levels of water Natural Conditions/Suspect Data
Negative effects of non-native species Other pressures
Physical modifications Pollution from mines
Pollution from rural areas Pollution from towns, cities and transport
Pollution from waste waters

31
Net present value
£3.8 million
Benefit cost ratio
3.9
Present value benefits
£5.2 million
Present value costs
£1.3 million
Figure 11 - Chart showing the reasons for not achieving good status of water bodies in the Itchen catchment by type and source sector (latest position on cycle 1 water body network)
Measures to improve the water environment have been assessed. These also include undertaking actions towards achieving agreed common standards monitoring targets on flow and water quality and achieve the equivalent interim goals for the River Test Site of Specific Scientific Interest (SSSI). Some of these measures will benefit more than one water body or catchment and some are very specific. The cumulative effect and benefits of measures for the operational catchment have been considered. The measures proposed for this catchment are shown in the table below.
All of these measures are considered to be needed to improve the water environment to as near to good status as practicable. The costs and benefits of the measures have been considered in the catchment economic appraisal, results of which are shown below. You can find out more detail on the status and long term objectives by using the Catchment Data Explorer tool at: http://environment.data.gov.uk/catchment-planning/.
3.2.1 Upper and Middle Test catchment economic appraisal and environmental assessment
3.2.2 Results and recommendation Measures proposed to improve the water environment to good status in this catchment are cost beneficial; the benefits are greater than the costs. The results of the economic appraisal are shown below.
3.2.3 Monetised costs and benefits of implementing the measures proposed for this catchment6
This means that for every pound that is spent towards improving the water environment in this catchment, you could expect to receive £3.90 of benefits.
6 The benefits and costs are shown in ‘Present Value’ terms, which is a way of expressing the value of costs and benefits that will happen in the future in today’s money. We apply a ‘discount’ rate and benefits to reflect people’s preference for receiving goods and services now rather than later.
Improve modified physical habitats Improvement to condition of channel/bed and/or banks/shoreline Improvement to condition of riparian zone and /or wetland habitats Manage pollution from rural areas Mitigate/remediate diffuse pollution impacts on the receptor

32
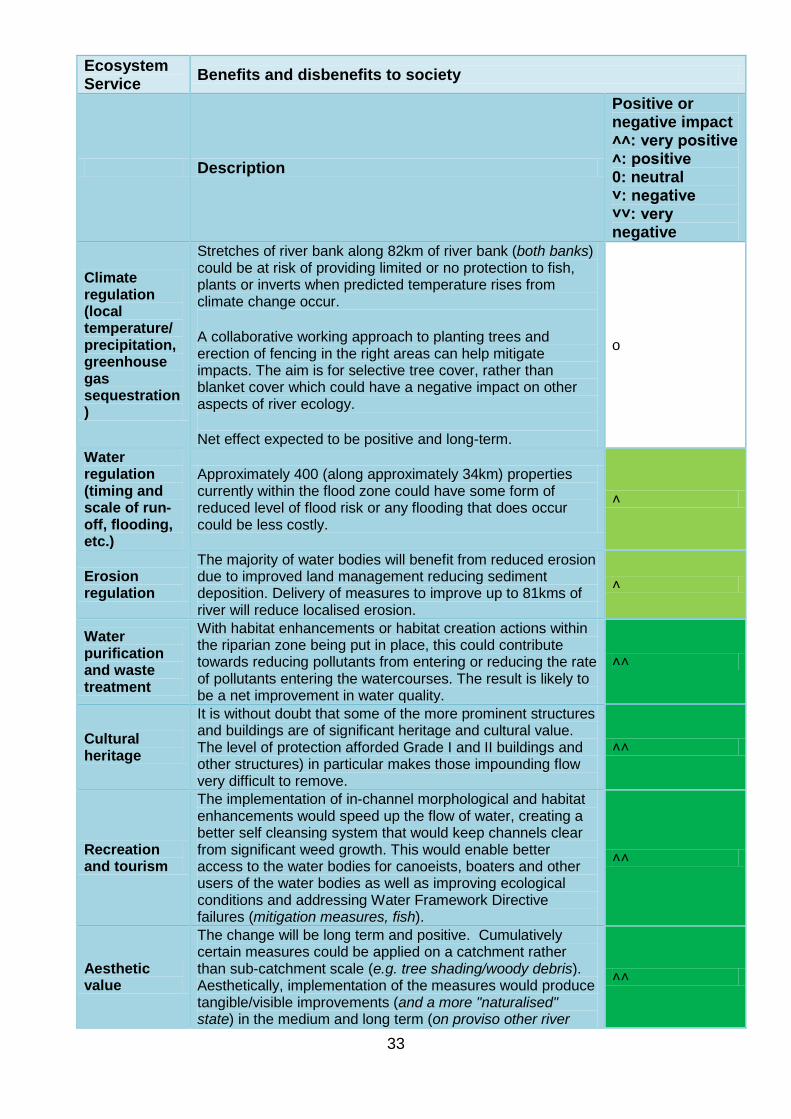
3.2.4 Benefits and costs of implementing the measures proposed for this catchment7 8
Ecosystem Service Benefits and disbenefits to society
Description
Positive or negative impact ˄˄: very positive ˄: positive 0: neutral ˅: negative ˅˅: very negative
Fresh water
Re-naturalising watercourses (e.g. focussing on improvements to channel beds, margins and enhanced habitats, structure removal/modification) and other incentives (such as tree shading) can assist in sustaining or improving flows and mitigate against impacts of climate change (e.g. drought). Overall, the suite of measures will have a positive impact on flow, form and ecology, and can be considered unlikely to negatively impact on freshwater provision.
˄
Food (e.g. crops, fruit, fish etc.)
Potentially significant beneficial effect if measures result in greater amount of habitat and more fish. Fish are farmed in this catchment and they can be considered as a valuable food resource. Potentially significant beneficial effect - improve fish stocks with more nursery (and spawning) areas. Potentially significant beneficial effect through reduced fish culls and improved and more diverse fish stocks. Potentially significant negative impacts due to increased efficiency of hydropower plant, if present on water body. Long stretches of the Test (and its tributaries) have SSSI designations. The measures suggested to improve ecological conditions could see an improvement in Water Framework Directive failing elements (predominantly fish and other fauna). Change will be positive in the long term as changes to agricultural/aquaculture take place and water quality issues are addressed promptly to enable quicker recovery of the water environment. Comparatively, habitats improvements and removal or change to structures (e.g. weirs) could bring about quick changes to the river systems. The effect of enabling fish passage could see both quick returns and long term changes in the context of fish species present (and spawning) and improvements where slow flows currently contribute to ecological issues.
˄˄
7Improving the water environment has wider benefits than those we have been able to monetise in the appraisals. We have
identified these using ecosystem services. An ecosystem service is a ‘service’ that the natural environment provides that improves our quality of life. 8Improving the water environment has wider benefits than those we have been able to monetise in the appraisals. We have
identified these using ecosystem services. An ecosystem service is a ‘service’ that the natural environment provides that improves our quality of life.
33
Ecosystem Service Benefits and disbenefits to society
Description
Positive or negative impact ˄˄: very positive ˄: positive 0: neutral ˅: negative ˅˅: very negative
Climate regulation (local temperature/ precipitation, greenhouse gas sequestration)
Stretches of river bank along 82km of river bank (both banks) could be at risk of providing limited or no protection to fish, plants or inverts when predicted temperature rises from climate change occur. A collaborative working approach to planting trees and erection of fencing in the right areas can help mitigate impacts. The aim is for selective tree cover, rather than blanket cover which could have a negative impact on other aspects of river ecology. Net effect expected to be positive and long-term.
o
Water regulation (timing and scale of run-off, flooding, etc.)
Approximately 400 (along approximately 34km) properties currently within the flood zone could have some form of reduced level of flood risk or any flooding that does occur could be less costly.
˄
Erosion regulation
The majority of water bodies will benefit from reduced erosion due to improved land management reducing sediment deposition. Delivery of measures to improve up to 81kms of river will reduce localised erosion.
˄
Water purification and waste treatment
With habitat enhancements or habitat creation actions within the riparian zone being put in place, this could contribute towards reducing pollutants from entering or reducing the rate of pollutants entering the watercourses. The result is likely to be a net improvement in water quality.
˄˄
Cultural heritage
It is without doubt that some of the more prominent structures and buildings are of significant heritage and cultural value. The level of protection afforded Grade I and II buildings and other structures) in particular makes those impounding flow very difficult to remove.
˄˄
Recreation and tourism
The implementation of in-channel morphological and habitat enhancements would speed up the flow of water, creating a better self cleansing system that would keep channels clear from significant weed growth. This would enable better access to the water bodies for canoeists, boaters and other users of the water bodies as well as improving ecological conditions and addressing Water Framework Directive failures (mitigation measures, fish).
˄˄
Aesthetic value
The change will be long term and positive. Cumulatively certain measures could be applied on a catchment rather than sub-catchment scale (e.g. tree shading/woody debris). Aesthetically, implementation of the measures would produce tangible/visible improvements (and a more "naturalised" state) in the medium and long term (on proviso other river
˄˄

34
Ecosystem Service Benefits and disbenefits to society
Description
Positive or negative impact ˄˄: very positive ˄: positive 0: neutral ˅: negative ˅˅: very negative
management criteria are applied). If, aesthetically, the river (or tributaries) look natural, clear, clean, beautiful and full of flora and fauna, these visible signs will be indicative of healthy ecosystems in the short/medium/long term with the added benefits that more people will want to visit, use and appreciate the water environment.
Existence Values
There is a greater opportunity of local engagement if delivery of measures is followed as much is dependent upon collaborative working approaches, which would spread the importance of the Itchen to groups hitherto unaware.
˄˄
Social relations (e.g. fishing, grazing or cropping communities)
The effect will be positive and long-term (and seen in a short time period i.e. 2015 -21). There are significant benefits to local economy, (e.g. to improve/expand the local economy).
˄˄
Provision of habitat
Safeguarding habitats (key species in priority habitats) will have a long-term positive impact affected by comparatively quick changes. Ecological response time would see improvements within 2nd cycle.
˄˄
Impacts on each of the relevant ecosystem services are particularly important in the results of this economic appraisal. The impacts will significantly benefit society and although they have not been valued and monetised as part of this economic appraisal, further support the proposed measures for this catchment. The Final Appraisal Report (FAR) and associated documents provide a more detailed summary of these results. This can be requested at [email protected].
3.2.5 Possible scale of improvement for the Upper and Middle Test operational catchment
The information presented so far has focused on the proposed long term objectives for the water environment, based on preventing drop in status and delivering all improvements which are technically feasible and worthwhile. This section focuses on the possible scale of improvement which could happen in the period to 2021, based on current knowledge of plans and actions.

35
In this operational catchment: Yes or No Have measures been implemented (or are secured for 2014-15) that will deliver improvements that have not yet been reflected in classification results? E.g. Catchment Sensitive Farming, Catchment Restoration Fund Projects
Yes
Are there measures planned to deliver Protected Area objectives that will also contribute to improvements in water body status?
Yes
Has this operational catchment been identified in water company draft business plans as an area for improvement?
No
Has this operational catchment been identified as a priority for action under the new environmental land management schemes (NELMS)?
Yes
Have the local catchment partnership identified measures they are likely to secure funding for, which will bring about improvement within the 2nd cycle?
Yes
Are any additional improvement measures included in Environment Agency or other statutory plans?
Yes
Based on our understanding of the information above, and our catchment knowledge, we have high confidence that this operational catchment will see an improvement towards the proposed long term objectives by 2021.

36
3.3 Lower Test and Southampton Streams Operational Catchment
Figure 15 - This image highlights the visual impacts of sediment on entering the River Dun at times of high flow
This catchment includes sections of the River Test upstream of Romsey (confluence of the Dun), down to Southampton Water at Redbridge. The majority of this catchment lies on clays rather than chalk. Downstream of Romsey, historical channel modifications of the Test have resulted in flows being shared between several channels. There is a large public water supply abstraction at Testwood, near where the Test is joined by the River Blackwater. The main river then flows through the Lower Test Nature Reserve and joined by Luzborough Lane Stream. Tanners Brook, an 8.5km river running from North Baddesley, discharges into Southampton Water.
Figure 16 - Map of the Lower Test and Southampton Streams operational catchment

37
There are two forms of classification referred to in the text and graphs below: cycle 1 and cycle 2. Cycle 1 classification was the system used for the first river basin management plan and cycle 2 is being used for the updated river basin management plan. Cycle 2 uses upgraded classification tools and environmental standards, and has led to a change in water body boundaries to ensure that the catchment is best represented. In the Lower Test and Southampton Streams Operational Catchment this has resulted in changes to the number of water bodies and changes in classification which are shown in Figure 17 and 18 (overleaf). For the second river basin management plan (cycle 2), there are 12 rivers in this catchment. The status (health) of the water environment in 2009 was assessed (using cycle 1 water body network) as being generally moderate. In 2013, the status of the water environment had not deteriorated significantly. It can take five to ten years for the positive benefits of actions to be reflected in the ecological status (see Figure 17 overleaf). Our current analysis suggests that 78% of the water bodies in the Lower Test and Southampton Streams catchment should have a long term objective of achieving good status, as shown in Figure 18 below.
Figure 17 - Chart showing the classification of all water bodies in the Lower Test and Southampton Streams catchment in cycle 1
For more information on the changes since cycle 1, please see section 4.3 ‘Changes since first cycle (new building blocks)’ within Part 2 (technical annex) of the RBMPs. (http://ea.objective.co.uk/file/3078877)

38
Figure 18 - Classification and long term objectives of all water bodies in the Lower Test and Southampton Streams catchment in cycle 2
Since 2009, investigations in this catchment have helped to determine the reasons why water bodies are not achieving good status, and the likely causes. These are shown in Figure 19 below.
Figure 19 - Chart showing the reasons for not achieving good status of water bodies in the Lower Test and Southampton Streams catchment by type and source sector
0 5 10 15
Agriculture and rural land management
Unable to assign to a sector
Other (not in list)
Urban and Transport
Water Industry
Number of Reasons
Sour
ce S
ecto
rs
Reasons for not achieving good status of water bodies in the Lower Test and Southampton Streams catchment
Changes to the natural flow and levels of water Natural Conditions/Suspect Data Negative effects of non-native species Other pressures Physical modifications Pollution from mines Pollution from rural areas Pollution from towns, cities and transport Pollution from waste waters

39
Measures to improve the water environment have been assessed. Some of these measures will benefit more than one water body or catchment and some are very specific. The cumulative effect and benefits of measures for the operational catchment have been considered. The measures proposed for this catchment are shown in the table below.
Improve modified physical habitats • Removal or easement of barriers to fish migration
• Removal or modification of engineering structure
• Improvement to condition of channel/bed and/or banks/shoreline
• Improvement to condition of riparian zone and /or wetland habitats
Manage pollution from towns, cities and transport • Reduce diffuse pollution pathways (i.e. control entry to the water environment)
Improve the natural flow and level of water • Improvement to condition of channel/bed and/or banks/shoreline
Manage pollution from rural areas • Reduce diffuse pollution at source
All of these measures are considered to be needed to improve the water environment to as near to good status as practicable. The costs and benefits of the measures have been considered in the catchment economic appraisal, results of which are shown overleaf. You can find out more detail on the status and long term objectives by using the Catchment Data Explorer tool at: http://environment.data.gov.uk/catchment-planning/.
3.3.1 Lower Test and Southampton Streams catchment economic appraisal and environmental assessment
3.3.2 Results and recommendation Different combinations of measures were appraised where improvement to good status for all water bodies in the catchment was not cost beneficial. The results presented here are for a combination of measures which do improve some water bodies in the catchment and that are economically worthwhile. A small number of measures were removed from this appraisal. It was considered that the costs were relatively high compared to the benefits expected to be delivered and the risk of not delivering the expected benefits may be considered too great. These measures relate to actions on the Tadburn Lake, the River Blackwater and the Whiteparish Tributary. They are water quality and mitigation measures. There are other reasons that these measures may still be proposed and funding set aside to implement them. Specifically, these relate to other ongoing plans and strategies, such as the Test and Itchen River Restoration Strategy. The costs and benefits of these measures are not presented in the economic results here. These measures may not remain in business plans if more appropriate, cost beneficial and affordable solutions are recommended. The results of the economic appraisal are shown below.

40
Net present value
£1.9 million
Benefit cost ratio
1.2
Present value benefits
£10.7 million
Present value costs
£8.9 million
Monetised costs and benefits of implementing the measures proposed for this catchment9
This means that for every pound that is spent towards improving the water environment in this catchment, you could expect to receive £1.20 of benefits.
Benefits and costs of implementing the measures proposed for this catchment10
Ecosystem Service Benefits and disbenefits to society
Description
Positive or negative impact ˄˄: very positive ˄: positive 0: neutral ˅: negative ˅˅: very negative
Fresh water
Actions focussed on re-naturalising watercourses (focussing on channel beds, margins and enhanced habitats, structure removal/modification) and other incentives (such as tree shading) can assist in sustaining or improving flows, mitigate against impacts of climate change (e.g. drought). Overall, the suite of measures used for this operational catchment will have a positive impact on flow, form and ecology, and can be considered unlikely to negatively impact on freshwater provision.
˄
Food (e.g. crops, fruit, fish etc.)
Long stretches of the Test (and its tributaries) have Site of Specific Scientific Interest designations. The measures suggested to improve ecological conditions could see an improvement in Water Framework Directive failing elements (predominantly for fish and other fauna). Change will be positive in the long term as changes to agricultural/aquacultural practices take place, and any water quality related issues are addressed promptly to enable a
˄˄
9 The benefits and costs are shown in ‘Present Value’ terms, which is a way of expressing the value of costs and benefits that will happen in the future in today’s money. We apply a ‘discount’ rate and benefits to reflect people’s preference for receiving goods and services now rather than later.
10Improving the water environment has wider benefits than those we have been able to monetise in the appraisals. We have
identified these using ecosystem services. An ecosystem service is a ‘service’ that the natural environment provides that improves our quality of life.

41
Ecosystem Service Benefits and disbenefits to society
Description
Positive or negative impact ˄˄: very positive ˄: positive 0: neutral ˅: negative ˅˅: very negative
quicker ecological response time. Comparatively, habitats improvements and removal or changes to structures (such as weirs) could bring about quick changes to the river systems. The effect of enabling fish passage could see both quick returns and long term changes in the context of fish species present (and spawning) and where slow flows currently contribute to ecological issues.
Water for non-consumptive use
To carry out the measures put forward would enhance flows, improve habitats and re-naturalise modified channels. Non-delivery of the actions for this operational catchment would not necessarily have adverse consequences on this provisioning service. However, the cumulative effect could cause significant impacts on: flow, fish passage, geomorphology and ecology if not managed correctly.
˄
Climate regulation (local temperature/ precipitation, greenhouse gas sequestration)
Stretches of river bank along 148kms of river could be at risk of providing limited or no protection to fish, plants or invertebrates when predicted temperature rises from climate change occur (expert judgement). Collaborative working approaches to planting trees and putting up fencing in the right areas (e.g. protect bankside habitats). Aiming for a mosaic of tree cover, rather than blanket cover which could have a negative impact on other aspects of river ecology. Net effect expected to be positive and long-term.
˄˄
Water regulation (timing and scale of run-off, flooding, etc.)
There are approximately 400 properties (along approximately 34km of river) currently within the flood zone which could have some form of reduced level of flood risk or any flooding that does occur, and it could be less costly to maintain.
˄
Erosion regulation
The majority of water bodies will benefit from reduced erosion due to improved land management reducing sediment deposition. Delivery of measures could improve up to 81kms of river and could reduce localised erosion (erosion can exacerbate flooding impacts).
˄
Water purification and waste treatment
With habitat enhancements or habitat creation actions within the riparian zone being put in place, this could contribute towards reducing pollutants from entering or reducing the rate of pollutants entering the watercourses. The result is likely to be a net improvement in water quality.
˄˄
Cultural heritage
It is without doubt that some of the more prominent structures and buildings are of significant heritage and cultural value. The level of protection afforded Grade I and II buildings and other structures in particular makes those impounding flow very difficult to remove or modify.
o

42
Ecosystem Service Benefits and disbenefits to society
Description
Positive or negative impact ˄˄: very positive ˄: positive 0: neutral ˅: negative ˅˅: very negative
Recreation and tourism
The implementation of in-channel morphological and habitats enhancements would speed up the flow of water, creating a better self cleansing system that would keep channels clear from significant weed growth. This would enable betted access to the water bodies for canoeists, boaters and other users of the water bodies as well as improving ecological conditions and addressing Water Framework Directive failures (particularly mitigation measures and fish).
˄˄
Aesthetic value
The change will be long term and positive. Cumulatively certain measures could be applied on a catchment rather than sub-catchment scale (e.g. tree shading/woody debris). Aesthetically, implementation of the measures would produce tangible/visible improvements (and a more "naturalised" state) in the medium and long term (on the proviso other river management criteria are applied). If, aesthetically, the river (or tributaries) look natural, clear, clean, beautiful and full of flora and fauna, these visible signs will be indicative of healthier ecosystems in the short/medium/long term with the added benefits that more people will want to visit, use and appreciate the water environment.
˄˄
Provision of habitat
Safeguard habitats (key species in priority habitats). Long-term positive impact affected by comparatively quick changes. Ecological response time would see improvements within 2nd cycle (2015 to 2021) period.
˄˄
Impacts on each of the ecosystem services are particularly important in the results of this economic appraisal. The impacts will significantly benefit society and although not all of them have been valued and monetised as part of this economic appraisal, further support the proposed measures for this catchment. The benefits listed may seem numerous, however, given the uniqueness and rarity of this operational catchment, and the responses received from technical staff, these appear feasible with evidence to support assumptions made. If monetised, these benefits could further increase the benefit cost ratio, perhaps considerably, and particularly around tourism, cultural heritage, social relations and provision of habitat. The Final Appraisal Report and associated documents provide a more detailed summary of these results. This can be requested at [email protected].

43
3.3.3 Possible scale of improvement for the Lower Test and Southampton Streams operational catchment
The information presented so far has focused on the proposed long term objectives for the water environment, based on preventing drop in status and delivering all improvements which are technically feasible and worthwhile. This section focuses on the possible scale of improvement which could happen in the period to 2021, based on current knowledge of plans and actions. In this operational catchment: Yes or No Have measures been implemented (or are secured for 2014-15) that will deliver improvements that have not yet been reflected in classification results? E.g. Catchment Sensitive Farming, Catchment Restoration Fund Projects
Yes
Are there measures planned to deliver Protected Area objectives that will also contribute to improvements in water body status?
No
Has this operational catchment been identified in water company draft business plans as an area for improvement?
Yes
Has this operational catchment been identified as a priority for action under the new environmental land management schemes (NELMS)?
Yes
Have the local catchment partnership identified measures they are likely to secure funding for, which will bring about improvement within the 2nd cycle?
Yes
Are any additional improvement measures included in Environment Agency or other statutory plans?
Yes
Based on our understanding of the information above, and our catchment knowledge, we have medium confidence that this operational catchment will see an improvement towards the proposed long term objectives by 2021.

44
3.4 River Test Chalk Operational Catchment
Figure 20 - Overflowing borehole in the Test and Itchen catchment
This operational catchment consists of the River Test Chalk which is at poor status and required a cost benefit assessment (CBA). The CBA proposed measures to address rising trends of nitrates focusing on agricultural nitrate loss and sewage at the seven public water supplies with groundwater safeguard zones. Although solvents didn’t cause a failure they are a significant water quality problem. Therefore one solvent investigation was added, and another has already been completed by the local landowner. Further measures to ensure no drop in status focus on regulation and partnerships to reduce pollution by pesticides, oils and solvents.
Figure 21 - Map of the River Test Chalk groundwater water body within the operational catchment

45
There are a total 4 groundwater water bodies housed within this operational catchment. These are: River Test Chalk, River Itchen Chalk and Central Hampshire Lambeth and Bracklesham Group. The latter two passed required standards and are considered at good status. River Test Chalk was the only water body requiring a cost benefit assessment. The River Itchen Chalk underwent a cost benefit assessment by proxy. This means that the water body was aggregated under a number of other groundwaters within the South East River Basin District. The status (health) of the water environment in 2009 was assessed as being generally poor for both the Test Chalk and Itchen Chalk. In 2014, the status of the water environment had remained the same. It can take many years for the positive benefits of actions to be reflected in the ecological status. Our current analysis suggests that 50% of the water bodies in the River Test Chalk catchment should have a long term objective of achieving good status. Measures to improve the water environment have been assessed. Some of these measures will benefit more than one water body or catchment and some are very specific. The cumulative effect and benefits of measures for the operational catchment have been considered. The measures proposed for this catchment are shown in the table below:
Manage pollution from rural areas • Reduce diffuse pollution at source
These measures are considered to be needed to improve the water environment to as near to good status as practicable. The costs and benefits of the measures have been considered in the catchment economic appraisal, results of which are shown below. You can find out more detail on the status and long term objectives by using the Catchment Data Explorer tool at: http://environment.data.gov.uk/catchment-planning/.
3.4.1 River Test Chalk groundwater catchment economic appraisal and environmental assessment
3.4.2 Results and recommendation Measures proposed to improve this groundwater to good status are cost beneficial; the benefits are greater than the costs. The results of the economic appraisal are shown below.

46
Net present value
£20.259 million
Benefit cost ratio
3.25
Present value benefits
£29.283 million
Present value costs
£9.023 million
3.4.3 Monetised costs and benefits of implementing the measures proposed for this catchment11
This means that for every pound that is spent towards improving the water environment in this catchment, you could expect to receive £3.25 of benefits.
3.4.4 Benefits and costs of implementing the measures proposed for this catchment12
Ecosystem Service Benefits and disbenefits to society
Description
Positive or negative impact: ˄˄: very positive ˄: positive 0: neutral ˅: negative ˅˅: very negative
Fresh water
In the short term (5 years), no change in status is expected. In the medium term (5 to 15 years), reduced treatment may be required as nitrate and pesticide concentrations sustain downward trends and long term (15 years or more) no or significantly reduced treatment may be required as concentrations fall below relevant drinking water standard.
Medium term negative impact of costs to upgrade sewers affects local communities and relevant sewerage works undertaken. Long term positive impacts include reduced sewer leaks, improved water quality and greater reliability.
Private sewage systems upgraded and permitted may have a short term negative effect on communities due to costs.
˄˄
Water regulation (timing and scale of run-off, flooding,
Potential positive effects over the medium term period. There is a likelihood that providing repeated advice and guidance in the long term may be required. The true extent of this requirement is not known.
˄
11 The benefits and costs are shown in ‘Present Value’ terms, which is a way of expressing the value of costs and benefits that will happen in the future in today’s money. We apply a ‘discount’ rate and benefits to reflect people’s preference for receiving goods and services now rather than later.
12Improving the water environment has wider benefits than those we have been able to monetise in the appraisals. We have
identified these using ecosystem services. An ecosystem service is a ‘service’ that the natural environment provides that improves our quality of life.

47
Ecosystem Service Benefits and disbenefits to society
Description
Positive or negative impact: ˄˄: very positive ˄: positive 0: neutral ˅: negative ˅˅: very negative
etc.)
Erosion regulation
Positive effect over the medium term, however similar to ‘Water regulation’ above, repeating advice and guidance in the long term may be required. Currently difficult to measure.
˄
Water purification and waste treatment
In the short term, no change is forecast. In the medium term reduced treatment (and costs) anticipated. In the long term – no or minimal treatment required.
As with the ‘Fresh water’ section above, medium term negative impacts of costs to upgrade sewers may affect local communities. Long term positive impacts include reduced sewer leaks, improved water quality and greater reliability.
Private sewage systems upgraded and permitted short term negative effect on communities due to costs. Medium term and long term positive impact from greater water quality and reliability.
˄˄
Soil formation Positive effect over the medium term however may need to repeat advice and guidance in the long term. ˄
Nutrient cycling
Information will be available to carry out mass balance calculations to quantify this from proposed future investigations. ˄
This groundwater economic appraisal summary report and the Final Appraisal Report for this groundwater economic appraisal provide more detail for these results. This can be requested at [email protected]. Other associated documents are also available upon request.
3.4.5 Possible scale of improvement for the River Test Chalk operational catchment
The information presented so far has focused on the proposed long term objectives for the water environment, based on preventing drop in status and delivering all improvements which are technically feasible and worthwhile. This section focuses on the possible scale of improvement which could happen in the period to 2021, based on current knowledge of plans and actions.

48
In this operational catchment: Yes or No Have measures been implemented (or are secured for 2014-15) that will deliver improvements that have not yet been reflected in classification results? E.g. Catchment Sensitive Farming, Catchment Restoration Fund Projects
Yes
Are there measures planned to deliver Protected Area objectives that will also contribute to improvements in water body status?
Yes
Has this operational catchment been identified in water company draft business plans as an area for improvement?
No
Has this operational catchment been identified as a priority for action under the new environmental land management schemes (NELMS)?
Yes
Have the local catchment partnership identified measures they are likely to secure funding for, which will bring about improvement within the 2nd cycle?
No
Are any additional improvement measures included in Environment Agency or other statutory plans?
Not Applicable
Based on our understanding of the information above, and our catchment knowledge, we have low confidence that this operational catchment will see an improvement towards the proposed long term objectives by 2021.

49
4 What do you think? In order to produce a river basin management plan and a flood risk management plan, it is important that the people who understand the local area are able to contribute to these plans. The draft update to the river basin management plan provides information on the river basin district and then asks you to consider a number of questions. To help you provide feedback at the level that is most relevant to you, the catchment summaries summarise the river basin planning information at a more local scale.
• To see the full set of consultation questions, please go to: https://consult.environment-agency.gov.uk/portal/ho/wfd/draft_plans/consult?pointId=s1405418101234#section-s1405418101234
• To see the flood risk management plan questions, please go to
www.gov.uk/government/consultations/draft-flood-risk-management-plans Your answers to the questions above will help inform the final plans and ensure that the objectives they contain will help drive the protection, enhancement and improvement of the water environment for all its users. For further information on how to provide your answers to these questions, please go to the “How to respond” section below.
4.1 How to respond The Environment Agency would prefer you to respond online at: https://consult.environment-agency.gov.uk/portal/ho/wfd/draft_plans/consult?pointId=s1405418101234#section-s1405418101234. This will allow you to manage your comments more effectively, while helping us to gather and summarise responses quickly and accurately.
Finding out more
• http://www.ticp.org.uk. • Joint Nature Conservation Committee • Natural England
50
Alternatively, there is a Word response form available for each river basin district which you can download and use to write your response before you submit it online, or you can email it to [email protected] . You can view the consultation documents and consultation questions online. But, if you would prefer a printed version of the document, please call the Environment Agency's National Customer Contact Centre on 03708 506 506 (local rate). Please return written responses by 10 April 2015.
4.2 What the Environment Agency will use the responses for The Environment Agency will use the responses from this consultation to update the South East River Basin Management Plan. Environment Agency staff dealing with this consultation will see all responses in full. Other Environment Agency staff may also see the responses to help them plan future consultations. A full summary of the responses will be published on the Environment Agency website.
4.3 How the Environment Agency will use your information The Environment Agency will make all comments (apart from personal information) publicly available on the Environment Agency website. This includes comments received online, by email, post and by fax, unless you have specifically requested that your response be kept confidential. Only names of organisations that respond and not individuals will be published. If you respond online or provide an email address, you will receive an acknowledgement of your response. After the consultation has closed a summary of the responses will be published on the Environment Agency website. You will be contacted to let you know when this is available. You will also be notified of any forthcoming river basin consultations unless you request otherwise. Under the Freedom of Information Act 2000, the Environment Agency may be required to publish your response to this consultation, but will not include any personal information. If you have requested your response be kept confidential, it may still be required to provide a summary. If you have any questions or complaints about the way this consultation has been carried out, please contact: Cath Beaver, Consultation Co-ordinator Environment Agency, Horizon House, Deanery Road, Bristol, BS1 5AH [email protected].

51