Catching the Gazelle: Antecedents and Outcomes of High ...
162
Cleveland State University Cleveland State University EngagedScholarship@CSU EngagedScholarship@CSU ETD Archive 2018 Catching the Gazelle: Antecedents and Outcomes of High Growth Catching the Gazelle: Antecedents and Outcomes of High Growth Firms Firms Merissa C. Piazza Cleveland State University Follow this and additional works at: https://engagedscholarship.csuohio.edu/etdarchive Part of the Other Arts and Humanities Commons How does access to this work benefit you? Let us know! How does access to this work benefit you? Let us know! Recommended Citation Recommended Citation Piazza, Merissa C., "Catching the Gazelle: Antecedents and Outcomes of High Growth Firms" (2018). ETD Archive. 1080. https://engagedscholarship.csuohio.edu/etdarchive/1080 This Dissertation is brought to you for free and open access by EngagedScholarship@CSU. It has been accepted for inclusion in ETD Archive by an authorized administrator of EngagedScholarship@CSU. For more information, please contact [email protected].
Transcript of Catching the Gazelle: Antecedents and Outcomes of High ...

Cleveland State University Cleveland State University
EngagedScholarship@CSU EngagedScholarship@CSU
ETD Archive
2018
Catching the Gazelle: Antecedents and Outcomes of High Growth Catching the Gazelle: Antecedents and Outcomes of High Growth
Firms Firms
Merissa C. Piazza Cleveland State University
Follow this and additional works at: https://engagedscholarship.csuohio.edu/etdarchive
Part of the Other Arts and Humanities Commons
How does access to this work benefit you? Let us know! How does access to this work benefit you? Let us know!
Recommended Citation Recommended Citation Piazza, Merissa C., "Catching the Gazelle: Antecedents and Outcomes of High Growth Firms" (2018). ETD Archive. 1080. https://engagedscholarship.csuohio.edu/etdarchive/1080
This Dissertation is brought to you for free and open access by EngagedScholarship@CSU. It has been accepted for inclusion in ETD Archive by an authorized administrator of EngagedScholarship@CSU. For more information, please contact [email protected].

CATCHING THE GAZELLE: ANTECEDENTS AND OUTCOMES OF
HIGH GROWTH FIRMS
MERISSA C. PIAZZA
Bachelor of Arts in Political Science & Spanish Language and Literature
Oakland University
May 2002
Master of Public and International Affairs
University of Pittsburgh
May 2004
Submitted in partial fulfillment of requirements for the degree
DOCTOR OF PHILOSOPHY IN URBAN STUDIES AND PUBLIC AFFAIRS
at the
CLEVELAND STATE UNIVERSITY
August 2018

We hereby approve this dissertation for
Merissa Cusenza Piazza
Candidate for the Doctor of Philosophy degree for the
Department of Urban Studies
And the CLEVELAND STATE UNIVERSITY
College of Graduate Studies by
Committee Chairperson, Edward Hill, Ph.D.
Department & Date
Committee Member, Rajshekhar G. Javalgi, Ph.D.
Department & Date
Committee Member, Haifeng Qian, Ph.D.
Department & Date
Student’s Date of Defense: June 18, 2018

DEDICATION
This dissertation is dedicated to hard-workers from humble beginnings; you can do it.

ACKNOWLEDGMENT
I would like to thank my dissertation committee for their support and guidance to
examine this multidisciplinary topic. I would like to thank my chair, Dr. Edward Hill, for
challenging me to look beyond the ordinary and find what is unique and interesting in all
things; and for ingraining in me to ask the question, “So what?” I would like to thank my
committee member Dr. Rajshekhar G. Javalgi, whose enthusiasm for all things
entrepreneurship is infectious and whose kindness is unparalleled. Also, I would like to
thank Dr. Haifeng Qian, who’s unmatched drive pushed me never to give up.
I would like to thank all the faculty at the Levin College of Urban Affairs and the
Center for Economic Development at the Levin College. Dr. Bowen has helped me (and
all Ph.D. students) grow our minds as scholars and shepherd us through the turbulent of
the road of obtaining a Ph.D.; thank you for your steadfast faith and support. To Dr.
Ziona Austrian and Dr. Iryna Lendel at the Center for Economic Development who have
served as mentors, sounding boards, comfort, and encouragement; without their
leadership and inspiration, I would not be the thinker I am today. Also, my dearest friend
and colleague, Dr. Candice Clouse, whose personal strength is unmatched by any human
being on this planet – you are an inspiration to us all – being around you makes me shine
brighter. In addition, I would like to thank Ellen Cyran for her technical assistance for
this dissertation.
To my friends who support me; thank you; I love you. To the “A-Team” – Alanna
Langlois, Adrienne Smith, and Dr. Allison Harris – how our friendship has transcended
thirty years is beyond me. Each of you has always made me in awe of your intelligence,
strength, and wisdom; I am truly proud to call you my friends. To my dearest friend
Alexis Haakensen, you are always the most interesting person in a room; I thank you for

challenging me to think and express my opinions – I am a better person for knowing you.
To my little sister Jessica Helfand, you are always a comfort and delight, thank you. To
Tiffany Paine-Cirrincione, although we may have had turbulent time thought this
dissertation, you will always be my dearest friend. To my fellow CSU doctoral cohort and
especially, Dr. Serena Alexander, Dr. Kelly Kinahan, and Dr. Fran Stewart thank you for
your engagement, friendship, and fun times at Becky’s – I am proud to be your colleague.
I would like to thank my family, without their love nothing is possible. To my
wonderful, hard-working parents, Merry Anne and Leonard Piazza. These two, strong,
loving people transcended the divide of humble working-class immigrant families to
achieve the American Dream. They have always fostered my intellectual curiosity with
acceptance, love, and care. To Diane, Jim, Lucy, and Toby Durbin, I am so lucky to have
you. To Andrew Piazza, Julie Piazza, Andrew Abad, Emma Abad, and Grace Piazza,
thank you for your love and support. To Dr. Watson D. Dog, your warm belly, puppy
kisses, and happy smiles make everything better.
Finally, thank you to my husband James M. Durbin. No words can adequately
convey my awe of your intellect, constant love, and patience. You are my love, my rock,
and my life.

vi
CATCHING THE GAZELLE: ANTECEDENTS AND OUTCOMES OF HIGH
GROWTH FIRMS
MERISSA C. PIAZZA
ABSTRACT
This three-essay dissertation seeks to resolve some of the unanswered questions
that exist about high-growth firms (HGFs). Paper I identifies the antecedents and
outcomes of HGFs to better inform economic development policy. In explaining the
theoretical and operational constructs of these concepts, a model of the situation of high-
growth firms is developed, dubbed the Model of High Growth Firm Antecedents and
Outputs. Antecedents to HGFs include an entrepreneurial mindset, firm strategic
resources, and firm structural characteristics, while outputs of HGFs include regional
innovation outcomes and regional economic outcomes. Paper II investigated the
quantitative association between antecedents and outputs of HGFs. This paper used path
analysis to test hypotheses within the Regional High-Growth Firm Antecedents and
Outcomes Framework, and finds a strong positive association between most antecedents
(human capital, startup capital, and business costs) and HGFs, a positive relationship
between most antecedents and outcomes (employment and per capita income), and an
association between HGFs and employment. Paper III establishes a typology of HGFs
using cluster-discriminate analysis. Using a sample of 26,104 firms in the state of Ohio
from the Quarterly Census of Employment and Wages, this paper finds that only a small
portion of HGFs display high-growth characteristics described in the literature.
vii
TABLE OF CONTENTS
Page
ABSTRACT ....................................................................................................................... vi
LIST OF TABLES ............................................................................................................. ix
LIST OF FIGURES ............................................................................................................ x
CHAPTER
I. INTRODUCTION ............................................................................................... 1
II. HIGH-GROWTH FIRMS: UNDERSTANDING ANTECEDENTS AND
OUTPUTS..........................................................................................................6
Introduction ................................................................................................. 6
Background ................................................................................................. 8
Entrepreneurial Ventures vs. Routine Firms ............................................. 10
Theoretical Perspective ............................................................................. 17
Model of High-Growth Firm Antecedents and Outputs ........................... 19
Conclusions ............................................................................................... 35
III. HIGH-GROWTH FIRMS AND REGIONAL ECONOMIC OUTCOMES:
ANTECEDENTS AND OUTCOMES............................................................38
Introduction ............................................................................................... 38
Theoretical Background ............................................................................ 40
Conceptual Framework ............................................................................. 47
Research Hypotheses ................................................................................ 50
Method ...................................................................................................... 53
Research Design........................................................................................ 53
Direct and Indirect Antecedents of Regional Economic Outcomes ......... 54
Direct Antecedents on Regional Economic Outcomes ............................. 61

viii
Descriptive Statistics ................................................................................. 63
Analysis and Results ................................................................................. 65
Discussion ................................................................................................. 71
IV. ESTABLISHING A TYPOLOGY OF HIGH-GROWTH FIRMS: LESSONS
FROM THE STATE OF OHIO.......................................................................74
Introduction ............................................................................................... 74
Theoretical Background ............................................................................ 76
Measurement of Growth ........................................................................... 77
HGFs and Industries ................................................................................. 80
Toward a Typology of High-Growth ........................................................ 83
Research Design and Data ........................................................................ 86
Results ....................................................................................................... 92
Discussion and Conclusion ..................................................................... 108
V. CONCLUSION .............................................................................................. 112
REFERENCES ............................................................................................................... 118
APPENDIX ..................................................................................................................... 149

ix
LIST OF TABLES
Table Page
I. Variables and Variable Definitions ........................................................................ 54
II. Descriptive Statistics .............................................................................................. 63
III. Correlation Matrix .................................................................................................. 64
IV. Summary of Standardized Effects on One-Year Growth Rates in Employment and
Per Capita Income .................................................................................................. 70
V. Variables for Cluster Analysis & Discriminate Analysis ....................................... 91
VI. Hierarchal Cluster Analysis Agglomeration Schedule ........................................... 93
VII. Correlations between the Discriminating Variables and the Discriminate
Functions ................................................................................................................ 99
VIII. Dependent Variable Group Means for each Discriminant Function ..................... 100
IX. HGFs by Industry Grouping ................................................................................. 106
X. High-Tech HGFs by Cluster Grouping ................................................................. 108
XI. Establishment Counts by Industry Category, 2013-2015 ..................................... 149
XII. High-Tech NAICS Codes and Descriptions .......................................................... 150

x
LIST OF FIGURES
Figure Page
I. The Model of High-Growth Firm Antecedents and Outputs .................................. 21
II. Propositions of the Model of High-Growth Firm Antecedents and Outputs ......... 22
III. Regional High-Growth Firm Antecedents and Outcomes Framework.................. 50
IV. Hypotheses of the Regional High-Growth Firm Antecedents and Outcomes
Framework ............................................................................................................ 52
V. Path Coefficients of Regional High-Growth Firm Antecedents and Outcomes
Framework ............................................................................................................ 66
VI. Cluster Map ........................................................................................................... 94

1
CHAPTER I
INTRODUCTION
In 2017, AOL Co-Founder Steve Case established a $150 million fund that he
named "Rise of the Rest." The purpose of this fund was to help foster entrepreneurship
and innovation in the middle of the United States, within cities including Nashville, TN,
Columbus, OH, and Charleston, SC (American entrepreneurship, 2017; Ross-Sorkin,
2017). The quest to move innovation and entrepreneurship to locations away from the
coasts has been an economic development challenge for the last few decades. It was only
in the last ten years that economic development professionals have started to embrace
entrepreneurship as a means of job growth and prosperity.
The discussion surrounding the importance of entrepreneurship and small
businesses as job generators began with Birch (1979) in the late 1970s, whose research
indicated that small businesses are the most effective engine of growth in the United
States. He reported that small firms created 66 percent of all new jobs from 1969 to
1976. Birch and Medoff (1994) found that it was not only small firms but a subset of
these firms that were the engines of job growth. They called these job-generating firms
“gazelles,” another name for a high-growth firm. Birch, Haggerty, and Parsons (1993)
found that these high-growth firms comprised 4 percent of total firms, but accounted for
70 percent of the new jobs created.
2
Investigating high-growth firms (HGFs) by scholars is valuable for two main
reasons. First, a significant amount of resources is spent on entrepreneurship and small
business development programs, therefore, studying high-growth firms will aid in public
policy decision making and allow for better allocation of these resources. Second, as
research shows, only a small percentage of firms are high-growth (Delmar, Davidson, &
Gartner, 2003). Studying HGFs will help inform managerial policy to better guide
entrepreneurs and small business owners’ strategic decision making (Hitt, Ireland, Camp,
& Sexton, 2001, 2002; Ireland, Hitt, Camp, & Sexton, 2001; Ireland, Hitt, & Sirmon,
2003). A considerable amount of energy and money is expended in the name of job
creation to foster entrepreneurship and small business development. There is a vast
amount of literature on firm growth, small business growth, determinates of firm growth
(Dunne, Roberts, and Samuelson, 1989; Gabe and Kraybill, 2002; Hall, 1987; Hart &
Prais, 1956; Mansfield, 1962; Samuels, 1965; Simon & Bonnini, 1958), and quantifying
HGFs (Birch, et al., 1993; Birch & Medoff, 1994; Davidsson & Henrekson, 2002), but
scant literature focused on fostering HGFs as a mechanism of economic development.
There have been qualitative attempts to examine public policies directed at fostering
HGFs (Mason & Brown, 2013; Shane, 2009). However, there have been fewer
quantitative analyses of HGFs that investigate their distinct development paths and
potential interventions that facilitate their growth.
This three-essay dissertation seeks to resolve some of the unanswered questions
that exist about HGFs. Paper I seeks to identify the hypothesized antecedents and
outcomes of HGFs from the literature to better inform economic development policy.
Questions in Paper I center around: What are the antecedents and outputs of HGFs? How

3
can these antecedents and outputs be assembled into a system model? Paper II
investigates the quantitative association between antecedents and outputs of HGFs and
asks the question: What are the direct and indirect of effects of HGFs on regional
economic outcomes? Paper III seeks to answer the question: How do HGFs grow,
knowing that their growth is heterogeneous? What variables (and indirectly mechanisms)
are drivers of high-growth?
The foundational understandings of HGFs are grounded in economics, regional
science, business, and management theory. Economics and regional science see HGFs as
agents of employment and wealth creation for the macroeconomy and as outcomes of
regional resources and markets, while the business and management literature seek to
identify the personal characteristics and strategic decisions of the entrepreneur as an
actor. This paper uses the foundation of the management theory of the Resource-Based
View (RBV) of the firm to ground its investigation across Paper I and Paper II. RBV
posits that resources are heterogeneous and that firms strategically manage these
resources to achieve competitive advantage (Ireland, et al., 2003; Rumelt, 1995;
Wernerfelt, 1995). Resources can be tangible (i.e., capital) or intangible (i.e., knowledge),
but it is the strategic use of these resources that help obtain their high-growth (Barney,
1991).
Chapter 2 (Paper I) adds to the entrepreneurship and management literature by
examining the concept of high-growth firms (HGFs) and the system in which they
operate. This paper seeks to identify the antecedents and outcomes of HGFs while
examining the relationship of these elements to HGFs. These examinations can be found
through grounding the investigation in the management theory of the Resource-Based

4
View (RBV) of the firm. In explaining the theoretical and operational constructs of these
concepts, a model of HGFs is developed, dubbed the Model of High Growth Firm
Antecedents and Outputs. Antecedents to HGF formation include an entrepreneurial
mindset, firm strategic resources, and firm structural characteristics, while non-business
outputs of HGFs include regional innovation outcomes and regional economic outcomes.
Embedded at the center of this model is the HGF, acting as the economic agent between
these antecedents and outcomes. This model encompasses the inputs and outputs of
HGFs in the hope of better understanding and facilitating high-growth firm development.
Chapter 3 (Paper II) explores the essential resources that serve as antecedents of
HGFs and then quantitatively tests the contributions of these antecedents and HGFs on
regional economic outcomes. The goal of this chapter is to provide a quantitative
framework for economic development directed at supporting the likelihood that HGFs will
take hold and stay in a region. This paper uses path analysis to test hypotheses within the
Regional High-Growth Firm Antecedents and Outcomes Framework. This chapter seeks
to explore if elevated levels of regional entrepreneurial density, startup capital, and human
capital result in greater levels of employment, high-growth firms, and per capita income.
A goal of this chapter is also to examine if, as proposed, regional business costs are a
control variable and if they vary based on product cycle and regional assets. This chapter
also seeks to examine if, as proposed, a higher percentage of high-growth firms in a
regional economy results in higher employment levels and per capita income.
Chapter 4 (Paper III) establishes a typology of HGFs. This chapter employs
cluster-discriminate analysis similar to Hill and Brennan (2000) to identify like clusters
of HGFs and overlay discriminate analysis on these clusters. This process was utilized to

5
help better see their functions and name them. This paper examines a universe of 26,104
HGFs in the state of Ohio from the Quarterly Census of Employment and Wages. This
analysis seeks to identify patterns in growth, the method of growth, timeline of growth,
and industry to see common identifiers in HGF clusters.
Finally, Chapter 5 provides a conclusion that summarizes the findings from the
three papers (Chapters 2, 3, and 4). This chapter discusses how this dissertation is related
to and contributes to the current academic literature. Moreover, this chapter proposes
future directions for research in the area of HGFs.
Overall, this dissertation connects related literature from multiple disciplines to
investigate the drivers and outcomes of HGFs to inform policy better. Although each
essay explores different research questions and hypotheses, they are connected by the
roles that HGFs play in regional in economic development. Academics and economic
development specialists resoundingly call for public policies focused on HGFs; however,
there are no policies at the state or national level focused on individual HGFs (Lerner,
2010; Mason & Brown, 2013). This dissertation seeks to understand all of the essential
aspects of fostering HGFs and how economic development practitioners should consider
HGFs in their portfolio approach (business acquisition, retention, attraction, and
entrepreneurship) to foster prosperous regions.
6
CHAPTER II
HIGH-GROWTH FIRMS: UNDERSTANDING ANTECEDENTS AND OUTPUTS
Introduction
Over the last 25 years, the research of entrepreneurship has grown and has
emerged as a field of study. Although business and economic literature have discussed
the role of entrepreneurs within the context of the firm and firm growth for centuries,
many scholars still struggle to identify whether entrepreneurship is a stand-alone area of
inquiry. Within the last 25 years, however, entrepreneurship articles have had a more
significant presence in ‘A’ journals (Busenitz, Plummer, Klotz, Shahzad, & Rhoads,
2014). Moreover, the subject of entrepreneurship is not restricted to one academic
discipline; it has multidisciplinary roots in business, economics, and management theory.
The multidisciplinary nature of entrepreneurship has led some researchers to label
it as a “hodgepodge” of research (Shane & Venkataraman, 2000, p. 217), and the lack of
precise definitions has led to conceptual flexibility to suit various authors’ interests
(Coad, Daunfeldt, Holzl, Johansson, & Nightingale, 2014). Authors agree that there is a
difference between entrepreneurship and owning a small business, but how to delineate
the distinction between the two has proven problematic in the literature. Even though
there is a significant range of opinion on how to classify entrepreneurship, there is a high

7
degree of consensus that high-growth firms (HGFs) – firms that have a high rate of
growth over a specific period – should be labeled as entrepreneurial firms.
The business, management, economics and regional science literatures have
developed different about HGFs, based on disciplinary traditions, methods, and lines of
inquiry. The business and management literature examines firm-level decisions and
traces their implications for business success and organization (Hitt & Ireland, 2000). The
economics and regional science literatures focusing on the national and regional supply
of HGFs emphasizing the role that factor inputs play in shaping the aggregate
performance of HGFs. Of particular interest is the aggregate impact of these firms on
regional economic outcomes—especially employment and income. (Birch & Medoff,
1994; Davidsson & Henrekson, 2002; Kirchoff, 1994).
Beyond examining HGFs for their contribution to the economy, no study has
undertaken a theoretical examination of HGFs’ benefit to the environment in which firms
reside. This paper stands alone in its use of the management theory of Resource-Based
View (RBV) of the firm, which posits that resources are heterogeneous and that firms
strategically manage these resources to achieve competitive advantage. RBV suggests
that HGFs take exceptional advantage of their resources to obtain their exceptionally high
growth rates.
This paper addresses two critical questions: 1) What are the antecedents to the
economic performance of HGFs in the aggregate and 2) what are the regional economic
outcomes from HGFs? By grounding the theoretical examination of these research
questions in RBV and explaining the operational constructs of these concepts, a model of
high-growth firms in a regional economic context is developed and is titled the Model of
8
High Growth Firm Antecedents and Outputs. This model encompasses the inputs and
outputs of HGFs.
Background
The foundational understandings of high-growth firms are grounded in business,
economics, and management theory. These disciplines have examined the definitional
constructs and differentiated these phenomena from other types of business activity.
Early theorists reflected on who entrepreneurs are and what role they play in society.
Ricketts (2006) examined the entrepreneur in economic history, finding that the image
we now associate with an entrepreneur began to emerge in the 18th and 19th centuries
when the constitutional powers of the monarchy and upper class began to be constrained
and property rights enforced. Cantillon (1730) was one of the earliest philosophers to
argue that entrepreneurs were rational decision makers who took the risk upon
themselves to bring goods to the market. Marshall (1912) claimed that entrepreneurs
were – at the core – business managers. Knight (1921), on the other hand, rejected
Marshall and believed profit was related to uncertainty, not risk; probabilities could not
be assigned to these uncertainties. It was not until Schumpeter (1942) that entrepreneurs
began to be differentiated by the fact that they sought out and used innovation to bring
products to market.
Before the early 2000s, most of the entrepreneurial literature defined the
entrepreneurship field regarding who entrepreneurs were and what they did.
Venkataraman (1997) showed that this limited the field because it ignored opportunity
and individuals’ enterprising nature. Beyond this, Shane and Venkataraman (2000)
expanded their definition of entrepreneurship to include the creation of new organizations
9
(a.k.a. startups). From this expansion, the entrepreneur came to be defined not only as an
individual acting in the market but also as a firm acting on behalf of an individual in the
market. This definitional change allowed for the fact that the entrepreneur’s knowledge
was involved in creating the commercial venture (Venkataraman, 1997). Furthermore,
“entrepreneurial opportunities” came to be defined “as situations in which new goods,
services, raw materials, markets and organizing methods can be introduced through the
formation of new means, ends, or means-ends relationships” (Eckhardt & Shane, 2003, p.
336). Through their framework, they identify that decision-making is an essential activity
of entrepreneurs.
The management field integrated the disciplines of strategic management and
entrepreneurship to evolve the concept of strategic entrepreneurship (SE), meaning
strategic entrepreneurial endeavors (Hitt, et al., 2001, 2002; Ireland, et al., 2003; Ireland,
et al., 2001). Within the SE literature, Ireland, et al. (2001) defined entrepreneurship
“…as a context-dependent social process through which individuals and teams create
wealth by bringing together unique packages of resources to exploit marketplace
opportunities.” They emphasize wealth creation as an essential component to the success
of SE: “Wealth is created only when firms combine effective opportunity-seeking
behavior (i.e., entrepreneurship) with effective advantage-seeking behavior (i.e., strategic
management).” (Ireland, et al., 2003, p. 966).
The foundations for and development of the modern understanding of
entrepreneurship is essential, but how to identify it when experienced? Acknowledging
that the difference between entrepreneurs and small business owners falls into the
categorization of a “fuzzy concept,” or “one which posits an entity, phenomenon or

10
process which possesses two or more alternative meanings and thus cannot be reliably
identified or applied by different readers or scholars” (Markusen, 1999, p. 870).
According to Markusen, one way to know whether a phenomenon is a fuzzy concept is
“by asking the question over and over, ‘how do we know it when we see it?’” (1999, p.
870). Within the context of entrepreneurial research, the challenge is, thus, translating
“fuzzy” understandings into a conceptual framework. Currently, there are vague
abstractions of what an entrepreneur is. The media often foster these amorphous
depictions. For example, an article in Forbes magazine explained the difference between
an entrepreneur and a small business owner as based on different traits of the individual:
Namely, “entrepreneurs are never satisfied with the status quo” (Marks, 2012). However,
examining personal traits only contributes to “fuzziness.” Examining the distinctive goals
and characteristics of entrepreneurial firms and small businesses is a more objective
approach for establishing a physical, outcome-based construct. The following section
delineates differences between entrepreneurial ventures and small businesses, which will
be referred to for the remainder of this article as “routine firms.”
Entrepreneurial Ventures vs. Routine Firms
Schumpeter (1934, 1942) was the first to differentiate between entrepreneurial
ventures and routine firms. His work identified innovation as essential to differentiating
entrepreneurs from managers and distinguishing entrepreneurial ventures from routine
firms. Schumpeter (1934) recognized that entrepreneurs were challenged to find and use
new ideas in the market, and he identified five ways they could profitably promote
innovation: 1) develop a new product or service; 2) develop a new method of production;
3) identify a new market; 4) discover a new source of supply, or 5) reorganize firms or

11
industries. From these five dimensions, a distinction can be drawn between those firms
that employ such strategies and those that do not. Liebenstein (1968) built on the
Schumpeterian framework to establish that the difference between entrepreneurial
ventures and routine firms lay within the production function. Arguing that routine firms
serve mainly a management function (where their primary activities and duties are
routine within the industry, and the firm operates within well-established markets),
Liebenstein contrasted this routine activity with entrepreneurial firms to identify an
enterprise function (where not all of the activities are recognized or established, or the
firm may be operating in new markets).
Carland, Hoy, Boulton, and Carland (1984) adhered to the Schumpeterian view of
innovation as a component of entrepreneurial firms and echoed Liebenstein (1968) in
asserting that management and routine functions characterize small businesses. Carland,
et al. (1984) outlined definitional differences between small businesses and entrepreneurs
to advance the discourse in the literature. The authors defined a small business as “any
business that is independently owned and operated, not dominant in its field, and does not
engage in any new marketing or innovative practices” (p. 358). In contrast, they defined
an entrepreneurial venture as “one that engages in at least one of Schumpeter’s four
categories of behaviors: that is, the principal goals of an entrepreneurial venture are
profitability and growth and the business is characterized by innovative strategic
practices” (Carland, et al., 1984, p. 358). The authors removed “discover a new source of
supply” from the Schumpeterian list since it is ambiguous and reflected the reality of turn
on the 19th Century imperial empire building as an extension of mercantilism when
Schumpeter began writing The Theory of Economic Development.

12
Kirchhoff’s (1994) Typology of Dynamic Capitalism provides a way of
differentiating routine firm functions from innovative firm functions in the literature. He
identified four groups of firms based on differences in business growth and innovation
rates: 1) economic core (low innovation rate, low growth rate), 2) ambitious (low
innovation rate, high growth rate), 3) constrained growth (high innovation rate, low
growth rate), and 4) glamorous (high innovation rate, high growth rate). Kirchhoff’s
theory offers a typology that helps clarify what entrepreneurial and routine firms look
like and, more importantly, what the mechanisms of growth and stagnation are for each
type.
Many firms start small and stay small (Haltiwanger, Jarmin, & Miranda, 2010).
Moreover, Hurst and Pugsley (2011) noted that small and medium-sized enterprises
behave very differently: Many firms that start small and stay small, for example, are
concentrated within industrial sectors made up of service providers. In addition, Hurst
and Pugsley (2011) found that, unlike entrepreneurs, small business owners often start
their enterprises for non-pecuniary reasons. On the other hand, entrepreneurial ventures,
which are characterized by innovation and growth, are found within almost all industries
of the economy (Birch, 1979; Clayton, Sadeghi, Spletzer, & Talan, 2013; Davidsson &
Henrekson, 2002; Woodward, Guimaraes, & Watson, 2011). It is easy to see the
distinction between a growth-oriented entrepreneur who establishes and standardizes a
new fast-food restaurant concept and sells franchises and the small business owner who
purchases one of the franchisees.
More recently, Morris, Neumeyer, and Kuratko (2015) provided a typology of
start-ups that is relevant to this conversation. They identified four categories of start-ups

13
based on their emphasis on growth, innovation, and reinvestment in the business. From
this, they found that there are 1) survival, 2) lifestyle, 3) managed-growth, and 4)
aggressive/high-growth ventures. As they characterized it, survival ventures are firms that
live month-to-month and are necessity-driven. Lifestyle ventures are more stable and
provide modest reinvestment in the firm but traditionally operate as sole proprietorships.
Managed-growth ventures have steady growth over time with the periodic introduction of
new products, continual reinvestment, and consistent business development.
Aggressive/high-growth ventures have strong, innovative capacities with a national or
international market focus (Morris, et al., 2015).
High-Growth Firms
The discussion surrounding the importance of entrepreneurship and small
businesses as job generators began in the late 1970s when Birch (1979) declared that
small businesses were the most active engine of growth in the United States. He reported
that small firms created 66% of all new jobs from 1969 to 1976. Zeroing in on the crucial
differentiating factor in growth rates, Birch, et al. (1993) found that high-growth firms
comprised only 4% of total firms but accounted for 70% of new jobs created. Moreover,
high-growth firms appear in all industries. Birch and Medoff (1994) found that not all
small firms were the engines of job growth, but rather a specific subset of fast-growing
small firms, they labeled “gazelles.” As researchers began to investigate Birch’s gazelle
phenomenon, definitions began to change based on new theories and data sources. The
name for these firms varies in the literature depending on the whims and muse of authors.
Terms include “gazelles,” “ambitious firms,” “high-impact firms,” and “high-growth
firms.”

14
The most-used high-growth firm (HGF) definitions are derived from Birch. He
defined a gazelle firm as any business that grew 20% or more in sales for four
consecutive years with initial base-year revenue greater than $100,000 (Birch, et al.,
1993; Birch & Medoff, 1994; Davidsson & Henrekson, 2002). Boston & Boston (2007)
used Birch’s definition to examine African-American HGFs and determined through a
survey that their cohort of owners was more likely to start businesses out of choice, rather
than unemployment, and were more likely to take their company public than their non-
HGF peers. Acs, Parsons, & Tracy (2008) defined HGFs as enterprises that double sales
over a 4-year period and have an employment growth quantifier (EGQ) of at least two.
Using this different definition of HGFs, Acs et al. (2008) concurred with Birch & Medoff
(1994) that HGFs create almost all jobs in the economy, even though they account for a
small percentage of all firms. Woodward, et al. (2011) examined HGFs in South Carolina
using the Acs et al. (2008) definition, only making modifications due to data
irregularities, and revealed – like other studies – that HGFs accounted for only a small
percentage of the total firms from 2004 to 2008 (2.7%) but contributed to 67% of
employment gains.
To provide a unified definition from a statistical agency, Eurostat and the
Organization for Economic Cooperation and Development (OECD) in 2007 established
their definition for high-growth firms. The Eurostat-OECD delineated an HGF as an
enterprise with an average annualized growth rate higher than 20% per year over a 3-year
period, with an initial employment level of 10 employees. (OECD, 2007) Establishing
this definition has been helpful for analysis across OECD countries. Bravo-Biosca (2010)
used this definition and found that Europe lagged behind the United States concerning the

15
ratio of HGFs to total firms; in European countries, 4.3% of firms were HGFs, on
average, compared to 5.9% of all firms in the United States. Clayton, et al. (2013)
followed the Eurostat-OECD definition for firms with ten employees or more but
established a separate methodology for firms under ten employees. The authors used a
“kink-point” approach, whereby any firm with fewer than ten employees that grew by
eight employees, or 72.8% over three years (the equivalent of the 20% average
annualized growth over a 3-year period), was classified as high-growth. Clayton et al.
(2013) found that HGFs are equally concentrated in younger/smaller establishments and
older/larger establishments. In addition, they discovered that the most substantial amount
of gross job gains was due to firm births or older/larger establishments. The Federal
Reserve Bank of Atlanta examined HGFs in Georgia using Clayton et al.’s (2013)
definition, making minor modifications to address irregularities in their data, and found
that only a small number of firms qualified as high growth in any year, but that these
firms created a disproportionately large number of jobs in the state (Choi, Roberson, &
Rspasingha, 2013).
A significant portion of the literature uses annual growth rates to classify HGFs.
Kirchhoff (1994) delineated HGFs (a.k.a. glamorous firms) as those firms that grew
within the top 10% of all firms each year. Stangler (2010) also defined HGFs as top
annual performers, dividing them into the top 5% and top 1%. Besides considering top
performers, other authors classify HGFs using the Inc. 500 list. Firms on the Inc. 500
apply for the designation and are ranked by annual revenue over a 3-year period (Inc.,
2015). Drawing from Inc. 500 companies, Motoyama and Danley (2012b) examined
HGFs at the state and metropolitan level and discovered that HGFs are spread across the

16
country; they are not just located in Silicon Valley and Boston. The location of HGF
clusters in cities in the Rust Belt region indicates that regional population growth is not a
necessary precondition to firm growth (Motoyama & Danley, 2012a, 2012b). On the
other hand, Moreno and Casillas (2007) characterized HGFs as firms with growth rates
that are higher than 100% over a relatively short period (typically 3 to 4 years). Using
discriminant analysis, they established that HGFs have different characteristics than
moderate-growth or declining firms (Moreno & Casillas, 2007).
Other researchers have offered additional dimensions of HGFs. Siegel, Siegel,
and Macmillian (1993) performed a discriminant analysis on two pools of data. The first
was survey data from 1,600 Pennsylvania companies who were relatively small and
young companies. The second was a grouping of Price Waterhouse clients (now part of
Price Waterhouse Coopers) (PWC) who were mostly larger than those from the
Pennsylvania sample. Overall, the authors found four major findings: first, the overall
discriminate analysis of both samples showed that the main discriminating factor between
high- and low- growth companies was industry experience by senior management.
Second, the high-growth Pennsylvania companies were more focused on revenue
generation from a single product than their low-growth counterparts were; while the
PWC high-growth companies sought to diversify their markets and products over their
low-growth counterparts. Third, the Pennsylvania high-growth firms had fewer managers
than their low-growth firms; the PWC high-growth sample, on the other hand, was more
likely to have a balanced management team of a variety of talents. Lastly, the PWC high-
growth sample identified fast market growth and the ability to identify sales leads and
contacts as a discriminating factor from low-growth PWC counterparts.

17
Delmar, et al. (2003), used cluster analysis on a sample of Swedish high-growth
firms from 1987 to 1996 to build a typology of HGFs. They had a seven-cluster solution
and found firm growth was both multidimensional and heterogeneous. The sample split
into those firms that grew internal employment and/or sales steadily (calling this “organic
growth”), those that grew through mergers and acquisitions (termed “acquisition
growth”), and combinations of the two (Delmar, et al., 2003).
Not only are there debates in the HGF literature regarding how to define the
concept, but there are also debates as to which metrics are best to use to operationalize,
define, and measure these definitions of high growth. Using a relative measure (e.g.,
percent change) can inflate the performance of smaller firms while using an absolute
measure (e.g., level of employment) can over-represent the performance of larger firms.
In addition, how a company grows is an equally important distinction. For example, a
company can experience organic growth (by hiring employees to satisfy internal sales
growth) or acquired growth (through mergers and acquisitions) (see Coad, et al., 2014;
Delmar, et al., 2003). These variables and the measures used are significant because the
way firms grow may indicate which policy mechanisms can best help facilitate job
creation (Coad, et al., 2014).
Theoretical Perspective
Before assessing the framework of HGFs, it is essential to understand the
framework’s theoretical underpinnings. This paper starts with the assumption that, as
firms distinguish themselves in the market, it is vital for them to find their competitive
advantage. Moreover, firms generate sustained competitive advantage through

18
strategically utilizing their resources (Barney, 1991). From this perspective, this paper is
grounded in the management theory of the Resource-Based View (RBV) of the firm.
RBV originated out of the failure of Ricardian economics to examine
management as a force of competitive advantage, Penrose’s examination of firm growth,
and the birth of anti-trust legislation (Barney & Arikan, 2001). Most important for this
examination was the work of Penrose (1959). Diverging from neoclassical economists,
Penrose (1959) did not seek to identify the determinants of firm growth; instead, she
assumed that firms would grow and sought instead to discover which principals governed
growth. By asking this slightly different question, she unknowingly pioneered the RBV
of the firm as a research strategy.
Wernerfelt (1984, 1995) was the first to articulate RBV as a way to understand
and theorize what he saw as “business policy” (Wernerfelt, 1995, p. 172). RBV has been
academics who study entrepreneurship and strategic management to frame research on
firm performance (Alvarez & Buseniz, 2001; Barney & Arikan, 2001; Ireland, et al.,
2003). In the context of this paper, RBV provides the theoretical grounding for the
concept of entrepreneurship since the unit of analysis is the resource itself (Alvarez &
Buseniz, 2001).
RBV makes several assumptions about the operating environment of businesses.
RBV assumes that firms have access to heterogeneous resource pools and employ
different resource portfolios (Ireland, et al., 2003; Rumelt, 1995; Wernerfelt, 1995). RBV
examines the tangible and intangible resources needed for firm growth – whether–
including all assets, information, and knowledge the firm possesses (Barney, 1991;
Penrose, 1959). Firm resources can be classified into three categories: physical capital

19
resources (concepts such as technology, plant and equipment, geographic location, and
raw materials); human capital resources (such as training, experience, relationships,
managers, and workers); and organizational capital resources (firm organizations such as
formal and informal planning, coordination systems, and inter- and intra-firm
relationships) (Barney, 1991, p. 101). Meanwhile, Ireland, et al. (2003) examined RBV in
the context of strategic entrepreneurship and showed that there are three resources for an
entrepreneur to strategically manage -- financial capital, human capital, and social capital
(defined as the relationships between individuals and organizations). This paper takes the
stance that firm resources can be categorized as either physical capital, financing, human
capital, organizational capital, or social capital. RBV provides a perspective of what
entrepreneurs and firms value regarding their strategic business resources. It is these
resources, and the strategic management of them, that provide a competitive advantage
and results in wealth creation.
Model of High-Growth Firm Antecedents and Outputs
Exploring the theoretical and operational constructs of entrepreneurship, small
businesses, and HGFs demonstrates that there are common threads between the academic
literature of each, even if it is not acknowledged. Overall, the common thread
distinguishing the difference between an entrepreneurial venture and a routine firm is
rooted in Schumpeter’s (1934) four behaviors of disruptive firms. Those firms that do not
engage in some form of these behaviors are categorized as routine firms. Under this
definition, routine firms are defined as small businesses.
This distinction serves as the basis for the model of high-growth firms within the
entrepreneurship system: The Model of High Growth Firm Antecedents and Outputs

20
(Figure I). This model encompasses the inputs necessary for the development of HGFs
and the typical outputs of interest present in the literature. The model considers
entrepreneurs, small businesses, and high-growth firms as its research domain. Moreover,
this model only applies to the HGF literature in advanced industrial economies, with
specific emphasis on the U.S. economy. The antecedents to HGF success include an
entrepreneurial mindset, firm-based strategic resources, and the firm’s structural
characteristics. Non-business-related outcomes of HGFs include regional innovation and
regional economic performance. The section that follows puts forth seven propositions
concerning the Model of High-Growth Firm Antecedents and Outputs and presents each
using the literature to validate each one (Figure II).

21
Figure I. The Model of High-Growth Firm Antecedents and Outputs

22
Figure II. Propositions of the Model of High-Growth Firm Antecedents and Outputs

23
Firm Antecedents and Outputs
This paper offers seven propositions overall and these propositions cluster into
three different group. The first group of propositions concerns the antecedents of HGFs
(firm characteristics, firm resources, and firms structural characteristics) and their
relationship to HGFs success (Propositions 1 to 3). The second group of propositions is
tied to regional competitive assets that contribute to HGF performance (Proposition 4).
Lastly, the third group is propositions related to the association between HGF
performance and regional economic outcomes, and the relation between regional
economic outcomes. (Proposition 5 to 7).
Influence of Business Characteristics, Proposition 1: An entrepreneurial mindset
distinguishes the leadership of HGFs from the leadership of traditional
businesses, resulting in differences in the growth rates of the two types of
business. An entrepreneurial mindset distinguishes business leaders in HGFs
from that of routine firms, or small businesses.
Many academic researchers have come to believe that high-growth entrepreneurs hold
specific qualities or traits that differentiate them from standard business owners.
McClelland (1961) developed one of the first psychological profiles of entrepreneurs and
suggested that the need for achievement was their driving force. Brockhhaus and Horwitz
(1986) echoed some of these sentiments and identified three main factors associated with
the decision to become an entrepreneur: individual psychological factors (i.e., need for
achievement, locus of control, propensity for taking risks, problem solving and
innovative skills, and values), previous experiences (i.e., prior job dissatisfaction and role
models), and personal characteristics (i.e., education, sex, and racial background). The

24
literature has pointed to other unique characteristics of entrepreneurs, such as a
preference for autonomy (Hurst & Pugsley, 2011; Sexton & Bowman, 1985; Shane,
Klovereid, & Westhead, 1991), access to large networks to leverage for information
(Aldrich & Zimmer, 1986), and wealth (i.e., income differentials, personal income tax
rates) (Parker, 2009). Overall, in a literature review on personality traits of entrepreneurs,
Kerr, Kerr, & Xu (2017) found that most studies focus on the Big-5 traits (openness to
experience, conscientiousness, extraversion, agreeableness, and narcissism), need for
achievement, locus of control, pro-activeness, innovativeness, uncertainty, and the need
for autonomy.
Translating entrepreneurial traits into the entrepreneurial process can help
integrate the issue of relying solely on ex-ante expectations of what might happen during
this process. Bygrave (1989ab) argued that the changing nature of the field of
entrepreneurship should shift away from focusing solely on entrepreneurs’ traits to
include the entrepreneurial process, which is an ever-changing environment and system.
Birley and Westhead (1994) categorized entrepreneurs into seven different types
(insecure, followers, status avoiders, confused, tax avoiders, community, and unfocused)
(p. 7), but these groups were not found to be an indicator of subsequent firm size or
growth. The authors concluded that, although entrepreneurs’ traits are important,
incentivizing individual entrepreneurs based solely on their characteristics is bad public
policy. This is similar to Shane’s (2009) argument that it is terrible public policy to
encourage individuals to become entrepreneurs because there is a low probability of any
one specific venture generating jobs.
25
Entrepreneurs’ traits and the entrepreneurial process are two distinct mechanisms
that often operate in conjunction with each other, but they can also operate
independently. An individual can have entrepreneurial characteristics without ever
starting the entrepreneurial process, and an individual can begin the entrepreneurial
process without having entrepreneurial traits. Gartner (1990) surveyed entrepreneurship
scholars, business leaders, and politicians as to their definitions of entrepreneurship and
performed a cluster analysis on the responses. Two main clusters formed: One group
consisted of responses focusing on the characteristics of successful entrepreneurship (i.e.,
entrepreneur, innovation, growth, etc.). The second focused on the outcomes from
entrepreneurship (i.e., creating value, profit/non-profit, etc.). Entrepreneurship for some
is only about individual characteristics, while for others it is rooted in outcomes that
provide societal benefits. Moreover, there is research that shows a strong connection
between the mindset of individuals who create and develop HGFs (Boston & Boston,
2007; Siegel, et al., 1993).
Influence of Business Characteristics, Proposition 2: There is a significant
relationship between firm strategic resources and HGF success.
Entrepreneurs can play the role of information managers within an organization,
doing the vital work of strategic management gatekeepers (Casson, 2005). Alvarez and
Barney (2007) determined that the role of strategy can vary significantly for
entrepreneurs depending on the business opportunity, and this variation can influence the
discovery of, or the creation of, a business idea. According to the authors, Discovery
Theory implies a risky decision-making context where opportunities exist independent of
the entrepreneur. In other words, the opportunity exists and has to be discovered by an

26
entrepreneur. The alternative is Creation Theory, where opportunities will not exist
independent of the entrepreneur. That is, the entrepreneur invents something that did not
exist before, and the opportunity had to be created (Alvarez & Barney, 2007). In the
context of decision and strategy, Discovery Theory makes for a risk-based data collection
and decision-making process, while the Creation Theory leads to an iterative and
inductive decision-making process that relies on emergent and changing events.
The literature on the RBV of the firm is currently struggling with the implications
of assumptions about the heterogeneity of entrepreneurs, particularly related to
differences between novice entrepreneurs and habitual entrepreneurs, (Barney, Wright, &
Ketchen, Jr., 2001). Research on entrepreneurship has demonstrated links to the process
of starting and growing firms (Alvarez & Buseniz, 2001; Barney, 1991; Busentiz &
Barney, 1997). Jovanovic (1982) demonstrated in the economic literature that as
entrepreneurs learn they lower their chance of exit, RBV within management theory
shows that entrepreneurs gain a competitive advantage as their knowledge creation and
decision-making capacities evolve (Alvarez & Buseniz, 2001; Jovanovic, 1982).
Knowledge and human capital are strategic resources that enhance and foster the
probability of success in high-growth firms (Siegel et al., 1993).
In addition to information and human capital, RBV emphasizes the value of the
strategic allocation of financial capital. However, many entrepreneurs find it extremely
difficult to even access financial capital because of the perceived risks potential investors
associate with new ventures, making conventional financing (i.e., bank loans) challenging
to obtain (Keuschnigga & Nielsen, 2002). The U.S. Small Business Administration
(SBA), an independent agency of the federal government, offers loans, grants, research

27
grants, venture capital awards, and other funding opportunities (U.S. Small Business
Administration, 2016). Some states also offer loan guarantee programs. From these
programs, the public assumes risks that private banks would consider inordinately high;
in many instances, public employees make decisions on these loans and then work with
local bankers to assemble offer packages (Marlin & Wurster, 1997).
There have been many public efforts to encourage entrepreneurship as a
component of economic development. Lerner (2002, 2009, 2010), argued the importance
of governments’ use of venture capital as a policy mechanism to encourage
entrepreneurship. Changing the mechanism by which individuals are encouraged to
participate in entrepreneurship from “picking a winner” (Shane, 2009, p. 141) to a
market-driven approach changes the way government is involved in entrepreneurship and
small business policy. Two U.S. government programs that successfully help
entrepreneurial ventures and small businesses raise capital are the Small Business
Innovation Research (SBIR) and the Small Business Technology Transfer Program
(STTR). SBA administers the SBIR/STTR programs. Much has been written on the
effectiveness of the SBIR/STTR programs in helping to create high-technology firms and
foster innovation and competitiveness (Audretsch, 2003); generating a positive net
economic benefit (Allen, Layson, & Link, 2012); and transferring the risk of investment
to the government (Link & Scott, 2010). Additionally, public funding for research in the
private sector more likely leads to commercialization (Link & Scott, 2012), and SBIR
awardees are more likely to obtain follow-on funding than their peers (Lerner, 1999).
More importantly, Qian and Haynes (2013) found that, even though the SBIR program’s
objective is to enhance commercialization, it is also an entrepreneurship policy because it

28
increases the rate of firm formation in the technology sector. Moreover, the authors
concluded that the SBIR program is an essential program for small business capital
infusion and that providing technical assistance to firms increases innovation and
business growth.
The social and organizational capital of firms will influence competitive strategy
and can become a source of competitive advantage, resulting in growth. Malecki (2012)
argues that social capital is tied to the development of entrepreneurship and innovation
because of these processes’ reliance on proximity (through agglomeration and supply-
chain networks). Moreover, learning (individual or regional) is interactive and may be
informally transmitted involving many stakeholders. There are many ways to
conceptualize social capital on a regional or organizational level, but operationalizing
social capital poses a significant challenge. Malecki offered no variable of choice but
stated that “…social capital is a concept that embodies how people function productively
with other people, primarily locally but also at a distance.” (2012, p. 1033). Strategic
entrepreneurship suggests that entrepreneurs who manage their portfolios of resources to
enhance their competitive advantage will achieve firm growth and financial reward; thus,
strategic management of resources can be tied to HGF success.
Influence of Business Characteristics, Proposition 3: There is a significant
relationship between firm structure and the growth rates of HGFs.
A significant amount of research has examined the relationship between firm
structure and growth. Strides have been made in research exploring several facets of firm
survival: Entrants only have a small amount of time to prove their worth (Geroski, 1995);
efficient firms survive and inefficient firms fail (Jovanovic, 1982); survival of smaller

29
firms is heavily dependent on technology and firm age (Argwal, 1998); ownership
structure and start-up size can shape survival (Audretsch & Mahmood, 1995); firm entry
size is vital for low-tech products, but not significant in the high-tech arena (Agarwal &
Audretsch, 2001); and survival of start-ups is enhanced through agglomeration because of
skilled labor pools, larger numbers of suppliers, and customers attracted to the cluster
(Pe'er & Keil, 2013).
The HGF literature has demonstrated strong ties to firm structure and positive
HGF outcomes. Clayton et al. (2013) found that HGFs were either young and small firms
or older firms, indicating that age and size of the firm are indicators of growth potential.
Moreover, they noted that job creation emanated mainly from older firms. As noted
earlier, firm location matters, too. Bravo-Biosca (2010) indicated that there were fewer
HGFs in Europe than in the United States, a difference that may be due, at least in part, to
Europe’s regulatory environment (Haltiwanger, 2011).
Influence of Regional Competitive Assets, Proposition 4: Co-locations of HGFs
generate positive knowledge and workforce externalities that benefit existing
firms and new entrants and result in enhanced regional employment growth rates.
There is a significant discussion in the business, management, economics, and
regional science literature regarding the importance of HGFs. The business and
management literature seeks to investigate firm-level decisions and implications (Hitt &
Ireland, 2000), while the regional science and economics literature focuses on the
national and regional supply of HGFs and the amount jobs they create as an aggregate
effect on the overall economy (Birch & Medoff, 1994; Davidsson & Henrekson, 2002;
Kirchoff, 1994). Although these two literatures have different unit of analyses (the HGF

30
itself in the business literature versus HGF in aggregate in the regional science literature),
they both reflect decisions and actions of individual firms (Baum & Wally, 2003;
Hambrick & Crozier, 1985) and in the overall economy on firm performance (Hansen
&Wernerfelt, 1989). This leads to the consideration of regional agglomerations and
associated knowledge spillovers on regional economic performance.
Where firms locate is linked to the knowledge externalities, also known as the
knowledge spillover effect. Knowledge spillovers are positive externalities that can give
rise to new firms (Audretsch, 1995). The location of existing HGFs firms can generate
knowledge spillovers that result in either firm births or attraction to take advantage of the
spillovers. Moreover, existing firms can also benefit from spillovers from new entrants.
Combining the concept of industrial innovation clusters with the product (and industrial)
life cycle theory Audretsch and Feldman (1996) found that firms tend to co-locate at
either end of the product lifecycle (the introduction and the declining stages). More
importantly, they see that:
Perhaps most striking is the finding the greater geographic concentration of
production lends to more, and not less, dispersion of innovative activity.
Apparently innovative activity is promoted by knowledge spillovers that occur
within a distinct geographic region, particularly in the early stages of the industry
life cycle, but as the industry evolves towards maturity and decline may be
dispersed by additional increases in concentration of production that have been
built up within the same region (Audretsch & Feldman, 1996, p. 271).
Therefore, as firms co-locate, they disperse innovative activity throughout them,
and this is especially prevalent during the latter stages of an industry’s life because the
monopolistic concentration of production has been concentrated within the same firms
within the same areas.

31
What Audretsch and Feldman (1996) identified regarding the industry life cycle
and industry clusters is supported by findings from Porter (2000) regarding industry
clusters. Firms co-locate in clusters because of competitive advantage, and this co-
location feeds a more competitive environment (Porter, 2000). Moreover, specific firms
act as anchors and industrial leaders, drawing other firms to them through their
innovations; other firms will relocate to be closer to these more substantial, more
innovative firms (Porter, 2000). Glaeser, Kerr, and Ponzetto (2010) sought to examine
clusters of entrepreneurship and explore why employment growth is often strongly
predicted by smaller establishment size. They concluded that entrepreneurship is higher
when there are lower fixed costs, while still maintaining Chinitz's (1961) hypothesis that
some areas have more entrepreneurs.
Influence on Regional Economic Outcomes, Proposition 5: There is a significant
relationship between HGFs and regional innovation outcomes.
As noted earlier, HGFs occur in all sectors of the economy (Birch, Haggerty, &
Parsons, 1993; Clayton, et al., 2013). Therefore, HGFs can be assumed to exist as both
entrepreneurial ventures and routine firms. Since the literature has proven that HGFs are
employment generators, I hypothesize that they, in turn, create value and influence
regional economic outcomes. Entrepreneurs can gain information for innovative activity
from three sources: other firms engaged in a similar industry (i.e., imitation), the outside
world, and inside the firm (Winter, 1984). In addition, firms are always looking to
maximize their functions of profit and utility with their consumers and the broader
market (Audretsch, Coad, & Segarra, 2014).

32
One major by-product of HGFs is innovation. Innovation lies at the heart of
economic development, facilitates aggregate economic growth, and requires
entrepreneurship (Audretsch, et al., 2014). Innovation through technology investments is
a direct way that HGFs can add value to both the firm and the regional economy. Scherer
(1965) showed that inventive output increases with firm sales, while Jaffe (1986) found
that research and development investment made by private companies and universities
generates positive economic externalities for third-party firms. Many authors have found
associations between larger firm sizes and considerably larger amounts of innovative
activity. Plehn-Dujowich (2013) found that young firms are more innovative per R&D
dollar than older firms.
Beyond contributing to their own and regional innovation, another positive
outcome is knowledge externalities that benefit individuals both internal and external to
the firm. The Knowledge Spillover Theory of Entrepreneurship establishes that
knowledge creation produces externalities, and those spillovers create new ideas both
within the business and among other businesses and potential entrepreneurs (Audretsch,
1995). Muller (2007) found that existing firms do not fully take advantage of new
knowledge and that start-ups are more effective at capturing innovations derived from
new knowledge. Qian and Acs (2013) showed that the absorptive capacity of knowledge
spillovers has an indirect effect on entrepreneurship through knowledge creation.
Moreover, entrepreneurial absorptive capacity allows entrepreneurs to understand new
knowledge, appreciate its value, and take advantage of it by starting a business (Qian &
Acs, 2013). Absorptive capacity is an essential element within a region’s entrepreneurial
system (Qian, Acs, & Stough, 2013). In addition, Colombelli, Krafft, and Quataro (2013)

33
found that publicly traded HGFs firms in France, Germany, Italy, the Netherlands,
Sweden, and the United Kingdom contributed to knowledge creation via a demand-pull
framework. According to the authors, this type of framework differs in that sales growth
creates an incentive for the firms to commit resources to activities associated with
knowledge creation.
Influence on Regional Economic Outcomes, Proposition 6: There is a significant
positive relationship between HGFs and regional economic outcomes (i.e., per
capita income, productivity, employment, and gross regional product).
Beyond the economic outputs mentioned in Proposition 5, HGFs have been
shown to contribute to regional economic outcomes – namely, per capita income, gross
regional product, employment, and productivity. Researchers agree that these outcomes
are essential to economic development, but there is far less agreement regarding the
mechanism by which they are influenced by entrepreneurship and HGFs (Feld, 2012).
The economics literature posits that individual knowledge accumulation is not subject to
diminishing returns (Romer, 1990) and that spillovers can occur between firms
(Marshall-Arrow-Romer [MAR] spillovers), within specialized industries (Porter
spillovers), between citizens and businesses in urban areas due to density and diversity
(Jane Jacobs spillovers), and from entrepreneurs exiting existing jobs and forming new
firms (knowledge spillovers) (Acs, Brunerhjelm, Audretsch, & Carlsson, 2009; Glaeser,
Kallal, Scheinkman, & Shleifer, 1992). The sociology literature, meanwhile, examines
the horizontal networks across and between organizations (Saxenian, 1994), and the
geography literature looks to the contributions made to positive economic outcomes due

34
to the attributes of the community and the way they growth and density of HGFs (Florida,
2005).
Examining the economic outcomes of productivity and per capita income
demonstrates the importance of entrepreneurship within regional production possibility
frontiers. As new businesses, products, and processes make industries more productive,
there will be a shift in the production frontier. As Leibenstein explains, “part of the
process is the interaction between the creation of economic capacity and the related
creation of demand so that some rough balance between capacity growth and demand
growth takes place” (1968, p. 77). Economic activity can be measured using gross
product, as well as employment. Moreover, Mason, Bishop, and Robinson (2009) found
that HGFs are more productive than more traditional businesses. They suggest that HGFs
influence economies through “the positive impact of high-growth firms on aggregate
productivity growth which occurs by displacing weaker firms and speeding up the
reallocation of their resources to stronger firms” (p.28).
Influence on Regional Economic Outcomes, Proposition 7: There is a significant
relationship between regional innovation outcomes and regional economic outcomes.
The innovative capacity of entrepreneurs and the firms they command has shifted
focus away from the standard neoclassical economic explanation of economic growth is
dependent on capital deepening or increasing amounts of labor into what Wennekers and
Thurik (1999) call an “entrepreneurial paradigm.” This paradigmatic shift is geared
toward understanding the impact of new technology industries on economic growth rates.
Capitalist economic growth is based on the efforts of Schumpeterian entrepreneurs; those
35
who are responsible for creative destruction where innovative new firms replace
antiquated old ones. (Schumpeter, 1942; Wennekers & Thurik, 1999).
Regions can play an essential role in competitive innovative processes, chiefly
when the traded products of a regional economy depends on intangible and non-tradable
assets (knowledge, and specific technical competencies) that become the source of
competitive advantage (Boschma, 2004).
Over the last 50 years, science and technology policy created to foster science and
innovation has had a dual purpose – to facilitate the creation of new goods and services
and to counteract market failures that inhibit spillovers associated with innovation, and
knowledge transfer (Bartik, 1990). The rationale behind government intervention in the
innovation process has been described as three-fold: “Innovation results in technological
advance; technological advance is the prime driver of economic growth, and the
government has a responsibility to encourage economic growth.” (Audretsch et al., 2002,
p. 173) R&D conducted by universities and industries “spills over” for other firms to
exploit due to their proximity to the source, and these R&D investments made by private
companies and universities, therefore, become positive economic externalities for third-
party firms (Jaffe, 1986, 1989).
Conclusions
This paper has sought to integrate inputs, outputs, and exogenous factors relevant
to understanding and to support the creation of high-growth firms. The Model of High-
Growth Firm Antecedents and Outputs (Figure I) presented assembles a multidisciplinary
approach to examining the antecedents of HGFs that contribute to their success, as well
as the regional economic outcomes to which HGFs contribute. This paper used the

36
management theory of Resource-Based View (RBV) of the firm to ground its framework.
RBV holds that resources are heterogeneous and that firms strategically manage
resources to achieve competitive advantage.
Overall, seven different propositions were discussed to expand the understanding
of the interaction between HGFs and antecedents and outcomes. The first grouping of
propositions examined the antecedents of HGFs (Propositions 1 to 3). The antecedents of
HGFs have a positive association with HGF outcomes. These antecedents
(entrepreneurial mindset, physical capital, human capital, social capital, and firm
structural characteristics), which are also essential resources under RBV, are important to
HGF and should be strategically managed by firms to maintain a competitive advantage
in the market.
The second and third groupings examined the relationship between HGFs and the
regional environment. The second grouping is a single proposition that examined the
relationship between regional competitive assets in an economy and HGFs. Regional
assets such as agglomeration and spillovers can be important for HGF growth.
Agglomeration economies can be vital for firm growth since the clustering of businesses
can increase overall efficiency since firms benefit from agglomeration externalities
garnered from production and consumption (purchasing) (Porter, 2000). In addition,
regions play an integral process of business competition and innovation, mainly if the
business depends on intangible resources, and interregional differentiation creates a
competitive economy where regions seek to expand and improve their asset portfolio
(Boschma, 2004). The last grouping of propositions examined the positive association
between HGF growth and regional economic outcomes of HGFs (regional innovation

37
outcomes and regional economic outcomes). HGFs have been shown to contribute to
regional economic outcomes and innovation since these firms not only helps grow the
organization and increase wealth but harness new ideas to bring new products and
processes to market.
It is important to acknowledge that although academics and economic
development specialists resoundingly call for public policies focused on HGFs, there are
no policies at the state, or national level focused on individual high-growth firms (Lerner,
2010; Mason & Brown, 2013). Brown and Mawson (2013) examined 49 HGFs in
Scotland and determined that these firms often encounter what they coined “trigger
points,” times when strategic decision-making can influence a business' trajectory
regarding growth and change. Their research demonstrates that the more public policy
actors understand HGFs and their business processes, the more proper incentives can be
offered to assist firms when they need it. However, as Mason and Brown (2013) note,
there are very few policies enacted by governments to promote HGFs outside of
innovation support and access to financing. In their literature review, Amit, Glosten, and
Mueller (1993) examined the challenges to theory development in entrepreneurship
studies. They noted that:
There is no doubt that a theory of entrepreneurship should, indeed, reflect a range
of economic, psychological, sociologic dimensions. It is unclear, however, what
core aspects of entrepreneurship should be reflected in such theory, and how the
various perspectives can be effectively integrated. One of the main challenges we
face is that of identifying ex-ante, those aspects that can explain, ex-post, most of
the variations in the performance of entrepreneurs and their ventures. (p. 824)
This paper assembled a model to foster entrepreneurship theory that encompasses the
economic, management, psychological, and multidimensionality of entrepreneurship so
that academics and practitioners can better reflect the ecosystems of HGFs.

38
CHAPTER III
HIGH-GROWTH FIRMS AND REGIONAL ECONOMIC OUTCOMES:
ANTECEDENTS AND OUTCOMES
Introduction
Firms that grow at a rapid pace have intrigued economic development researchers
and practitioners for more than 30 years. Early studies found that these “high-growth
firms” represented only 4% of all U.S. firms but accounted for 70% of job creation
(Birch, Haggerty & Parsons, 1993). This outsized impact on employment has spurred
interest in ways to accurately identify potential high-growth firms (HGFs) at early stages
and direct interventions toward removing risks associated with early-stage investment.
There have been qualitative attempts to examine public policies directed at fostering
HGFs (Mason & Brown, 2013; Shane, 2009). However, there have been fewer
quantitative analysis of HGFs, their distinct development paths and potential
interventions that facilitate their growth. This research seeks to expand the quantitative
understanding of HGFs. Specifically, this inquiry examines the inputs and outputs of
HGFs to improve understanding of how HGFs contribute to regional economic outcomes,
focusing mainly on identifying inputs that contribute to HGF success.

39
The literature on HGFs sits within the business, economics, management, and
regional studies literature. Most of the regional studies and economics literature focus on
the regional impact of HGFs and seek to understand how aggregate HGF counts grow
and decline over time, as well as the market forces that surround these changes. Studies
have concentrated on the contributions of HGFs to employment and job growth in the
U.S. economy (Choi, et al., 2013; Clayton, et al., 2013; Kirchhoff, 1994; Motoyama,
2014; Stangler, 2010), and there is a parallel literature stream examining the economy-
wide contribution of HGFs in Europe (Bravo-Biosca, 2010; Delmar, et al., 2003; Moreno
& Casillas, 2007; Organisation for Economic Co-operation and Development, 2007). The
European studies tend to differ from the U.S.-centered literature in that they do not
indicate the internal and external forces that influence HGF development. The business
literature, on the other hand, focuses mostly on examining the microeconomic aspects of
how individuals and businesses enter the market and the paths firms take to high growth
(Brown & Mawson, 2013; Dubini, 1989). The business literature concentrates on
individuals and how their strategic decision-making propels their firms to high growth;
these individuals have often been shown to be motivated by a goal of wealth creation.
These separate literatures provide the foundation for efforts directed at fostering regional
entrepreneurial factor endowments (regional science/economics) and developing firm-
level resources that foster successful high-growth firms (business/management).
This paper identifies the essential resources that serve as antecedents of HGF
success and then tests the contributions of these antecedents on regional economic
outcomes. The goal of this work is to provide a quantitative framework for economic
development directed at supporting the likelihood that HGFs will take hold and stay in a
40
region. The literature argues that investing in HGFs is poor public policy because it is
difficult to identify these firms early enough to provide for adequate intervention to
influence the performance of either the firm or of its regional economy (Shane, 2009).
This paper contributes to the academic and policy literature by identifying, quantifying,
and testing antecedents to HGFs and their impact on regional economic outcomes.
The first section of this paper presents the theoretical background for
investigating the contributions of HGFs to regional economic outcomes. This paper
begins with a discussion of the regional studies literature on regional factor endowments
and the business literature on the Resource-Based View (RBV) of the firm. The second
section puts forth a conceptual framework that attempts to specify elements in the
regional business environment that contribute to increasing HGFs and fostering regional
job creation and prosperity through HGFs. The third section presents multiple hypotheses
that testing this conceptual framework. These hypotheses help build a regional systems
model of the contributions of HGFs to regional economic growth. This system model is
tested using path analyses. The fourth section discusses the research design and methods.
The final section presents results and connects them to the ongoing debate among
scholars and practitioners surrounding the importance of HGFs in economic development
practice.
Theoretical Background
Regional Studies Literature
Examinations of HGFs in the regional studies and economics literature tend to
center on the regional economic impact of HGFs and the market forces that determine
their aggregate behavior. These studies focus on the national and regional stock of HGFs

41
and their influence on the economy, particularly their contribution to employment (for a
survey of the U.S. literature, see: Acs, et al., 2008; Birch, et al., 1993; Birch & Medoff,
1994; Choi, et al., 2013; Clayton, et al., 2013; Davidsson & Henrekson, 2002; Kirchoff,
1994; Motoyama & Danley, 2012a; Stangler, 2010; Woodward, et al., 2011). In a survey
of the HGF literature, Henrikson & Johnanson (2010) examined 20 studies in the United
States, Canada, and Europe and affirmed the previous findings that “a few rapidly
growing firms generate a disproportionate share of all new net jobs compared with non-
high-growth firms” (Henrikson & Johnanson, p. 240). There is also a thick European and
international literature that examines HGFs’ impact on employment, demonstrating that
HGFs are job generators regardless of geography (Bravo-Biosca, 2010; Moreno &
Casillas, 2007; Organisation for Economic Cooperation and Development, 2007).
Nightingale and Coad (2014) point out that data quality is a problem within HGF
research and this, in turn, creates a significant amount of “definitional flexibility” since
researchers have defined HGFs based upon what data they could obtain (p. 121). This
inconsistency creates widely different definitions of entrepreneurship, startups, and
HGFs. Overall, there is a consistent message in the HGF literature that HGFs tend to be
one of the following: entrepreneurial (Goedhuys, & Sleuwaegen 2010; Saxenian, 2002),
small and young (Czarnitzki & Delanote, 2013; Stangler, 2010), or innovative (Segaurra
& Teruel, 2014). It is from this understanding that this paper defines HGFs to be
entrepreneurial organizations, which tend to be startups.
HGFs not only contribute to jobs in regional economies, they also contribute to
regional innovation because they tend to be centers of intense research and development
activity and patent generation (Acs, et al., 2004; Acs, et al., 2009; Czarnitzki &

42
Delanote, 2013; Daunfeldt, Elert, & Johansson, 2016; Hölzl, & Friesenbichler, 2010).
Eckhart and Shane (2011) examined HGFs at the industry level to determine why some
industries have more HGFs than do others. They found a positive association between
employment of scientists and engineers within an industry and HGFs. This finding
reinforces observations of other researchers that innovation is an “important determinate
of entrepreneurial opportunity” (p. 412). This emphasizes that the entrepreneur, and the
decision maker within a HGF, are at the nexus of regional growth and innovation
(Feldman & Francis, 2006; Feldman, Francis, & Bercovitz, 2005; Qian & Acs, 2013;
Qian, Acs, & Stough, 2013).
Other studies examined the typology and dimensions of HGFs. Delmar, et al.
(2003) used cluster analysis of Swedish HGFs from 1987 to 1996 to demonstrate that not
all HGFs grow at the same rate or in the same ways. A seven cluster solution was found
to characterize the various subsets of HGFs in the sample. Of the seven clusters, two
displayed consistent growth patterns that are typically associated with the concept of
HGFs in the literature. However, this research demonstrates that firm growth is
multidimensional and heterogeneous.
Other studies have established typologies of HGFs using discriminant analysis,
finding that HGFs have distinct characteristics separating them from non-HGFs. Siegel,
Siegel, and Macmillian (1993) performed a discriminant analysis on two pools of data.
The first was survey data from 1,600 Pennsylvania companies who were relatively small
and young companies. The second was a grouping of Price Waterhouse clients (now part
of Price Waterhouse Coopers) (PWC) who were mostly larger than those from the
Pennsylvania sample. Overall, the authors found four primary findings from their study.

43
First, the overall discriminate analysis of both samples showed that the main
discriminating factor between high- and low- growth companies was industry experience
by senior management. Second, the high-growth Pennsylvania companies were more
focused on revenue generation from a single product than their low-growth counterparts
were; while the PWC high-growth companies sought to diversify their markets and
products over their low-growth counterparts. Third, the Pennsylvania high-growth firms
had fewer managers than their low-growth firms; the PWC high-growth sample, on the
other hand, was more likely to have a balanced management team of a variety of talents.
Lastly, the PWC high-growth sample identified fast market growth and the ability to
identify sales leads and contacts as a discriminating factor from low-growth PWC
counterparts.
Moreno and Casillas (2007) studied 6,814 small and medium-sized enterprises
from a database of firms in Andalusia, Spain, and examined their economic and financial
information for the years 1998, 1999, 2000 and 2001. They performed a discriminant
analysis to identify firm characteristics and to classify businesses as being HGFs or not.
In all, they found that HGFs are different from moderate-growers because HGFs are
smaller in size, higher in resources, and in some cases, lower in financial resources.
Overall, the regional studies and economics literature builds a solid foundation for
understanding HGFs in the aggregate and offers depth to the understanding of the
economic contribution of HGFs. These studies also highlight the fact that HGFs can grow
in a variety of ways. However, this literature only looks at the contribution of HGFs in
national or regional economic contexts. These studies mostly neglect to examine the

44
forces that influence the growth paths of individual firms. In other words, they do not test
what drives individual businesses to high growth rates.
Resourced-Based View of the Firm
The business and management literature on HGFs is dedicated to examining the
personal characteristics of entrepreneurs and the characteristics of their businesses
(Baum, Frese, Baron, & Katz, 2006; Brockhhaus & Horwitz, 1986; McClelland, 1961;
Shepherd, 1999; Zopounidis, 1994), how and why individuals became entrepreneurs
(Gartner, 1985; 1990; Hurst & Pugsley, 2011; Klovereid, 1992; Sexton & Bowman,
1985; Venkataraman, 1997), and the path firms take to achieve high growth (Baum &
Bird, 2010; Shane, et al., 1991). Strategic management theory’s Resource-Based View of
the Firm examines the sources of competitive advantage that apply to regional economic
development.
Over the past 20 years, a body of research has explored the influence of strategic
management on entrepreneurship and firm growth. As Hitt and Ireland (2000) suggest,
the interaction between entrepreneurship and strategic management occurs in six different
domains: innovation; organizational networks; internationalization; organizational
learning; top management teams and governance; and growth, flexibility, and change.
The intersection of these domains has come to be known as strategic entrepreneurship
(SE), a body of literature investigating how strategic management theory can further
entrepreneurship and small business development (Hitt, et al., 2001, 2002; Ireland, et al.,
2001; Ireland, et al., 2003).
The Resource-Based View of the Firm (RBV), derived from the strategic
management literature, seeks to understand how firms develop and maintain competitive

45
advantages over others. Entrepreneurship and strategic management scholars have used
the RBV lens to help differentiate firm performance and explore how certain firms
succeed (Alvarez & Buseniz, 2001; Barney & Arikan, 2001; Ireland, et al., 2003). RBV
posits that resources, whether tangible or intangible, are vital differentiators of firm
advantage (Barney, 1991; Penrose, 1959). Barney (1991) identifies three categories of
resources that can be strategically developed and managed for firm competitive –
physical capital resources, human capital resources, and organizational capital resources.
Kellermanns, Walter, Crook, Kemmer, and Narayanan (2016) use content analysis to
catalog the resources cited most frequently in the academic literature and by
entrepreneurs themselves. Overall, researchers and entrepreneurs identified the need for
both tangible and intangible resources; however, entrepreneurs placed significantly less
importance on human, organizational, and physical capital, while emphasizing the need
for firms to build relationships and social networks.
It is important to note that strategic management focuses on larger, more
established firms, while the entrepreneurship literature focuses on start-ups and smaller
firms (Kellermans, et al., 2016). Strategic entrepreneurship is aligned with the HGF
management literature because many researchers have tied HGF success to strategy. Kim
and Mauborgne (1997) concluded that business strategy sets HGFs apart from their low-
growth peers. Feeser and Willard (1990) conducted a matched-pairs analysis of firms in
the computing industry to demonstrate that strategic decision-making differentiated HGF
performance from low growth performance. Gundry and Welsch (2001) quantitatively
examined attributes of women-owned HGFs and found six dimensions: 1) stronger
entrepreneurial intensity, 2) greater willingness to incur opportunity costs, 3) a more

46
comprehensive range of financing, 4) strategic success factors (i.e., reputation, product
quality, cash, and leadership), 5) emphasis on team organizational structure, and 6)
strategy focus.
However, solely investigating entrepreneurs or HGFs ignores the interplay
between the actions of entrepreneurs and managers of HGFs and the environment in
which they operate. Recent literature has investigated the “ecosystem” of social, political,
and capital constraints in which entrepreneurs manage (Spigel, 2017). Bruno and Tyebjee
(1982) examined the “most frequently cited ‘essential’ factors” entrepreneurs require.
These include venture capital availability, skilled labor, access to suppliers and
customers, availability of land and support services. Dubini (1988) and Spilling (1996)
investigated the components of the broader ecosystem in which entrepreneurs navigate,
such as culture, family, economic influences, infrastructure, and capital, as they work to
launch their new ventures.
There is one place where the HGF regional studies literature and the business
literature intersect; this is in the use of social network theory to map and describe
entrepreneurial networks. Social network theory examines the overall environment in
which an entrepreneur exists (regional studies) and the individual entrepreneur’s
relationship to his or her ecosystem from the business/management perspective. Social
network theory is derived from biology and maps the ties, structures, and mechanisms of
organizations and their networks (Borgatti, Mehra, Brass, Labianca, 2009). Aldrich and
Zimmer (1986) argued that an entrepreneur’s network plays a vital role in the
development of her or his business. Individuals leverage their networks for advice after
their firms’ startup phase (Johannisson, Alexanderson, Nowicki, & Senneseth, 1994).

47
Much of this literature operationalizes the vibrancy of entrepreneurial communities
through measures of entrepreneur density, the roles of specific types of actors, the role of
social connections among actors, and how these components result in positive
entrepreneurial outcomes (Feldman & Zoller, 2012; Hoang & Antoncic, 2003).
How entrepreneurs connect to their social networks is vital to both their business
success and positive regional economic outcomes. The co-working literature examines
the phenomenon of entrepreneurs working in shared spaces, and how this shared
workspace translates into shared social space, cooperation, and “knowledge leakage”
between entrepreneurs (Bouncken & Reuschel, 2018). As entrepreneurs connect with
each other and to a region’s entrepreneurial ecosystem, they can offset information
asymmetries by sharing best and worst practices as well as providing operating advice.
Mentors are particularly helpful to novice entrepreneurs in garnering more resources, no
matter the type, for firm success (St-Jean & Audet, 2012). As entrepreneurs connect with
each other and the entrepreneurial ecosystem, they can discover and share resources that
may contribute to positive outcomes.
Conceptual Framework
This study draws on models created by Gundry and Welsch (2001) and Davidson
and Henrekson (2002) that use RBV to test a hypothesis about the relationship between
firm inputs and outputs. The RBV assumes that firms utilize a wide variety of resources
(physical capital resources, human capital resources, and organizational capital resources)
and have different resource portfolios (Barney, 1991; Ireland, et al., 2003; Rumelt, 1995;
Wernerfelt, 1995). RBV provides a framework to study how HGFs operate within the
context of the economy and examine how HGFs employ these resources to produce

48
regional economic outcomes. Combining resources as specified by RBV, HGFs produce
regional economic outcomes as the byproduct of their business operations and therefore
influence their regional economies.
Grounding the model in RBV emphasizes the importance of resources to HGFs,
especially physical capital and human capital (Audretsch, 2003), social capital (Florian,
Lubatkin, & Schulze, 2003; Malecki, 2012), and startup capital (Lerner, 2002, 2009,
2010). However, the performance of HGFs is strongly tied to firm structure and regional
endowments, which, for this model, are proxied as business costs (Bravo-Biosca, 2010;
Clayton, et al., 2013). HGFs also contribute to the economic outcomes of their region
through a variety of direct and indirect effects (Audretsch, 1995; Davidsson &
Henrekson, 2002; Eckhardt & Shane, 2011; Leibenstein, 1968). This model considers not
only the direct effects of antecedents to HGFs’ performance but also the intermediate
effects (indirect effects) that HGFs have on regional economic outcomes.
The key assumptions behind this conceptual model are that 1) there are essential
resources (entrepreneurial density, startup capital, human capital, and business costs) that
high-growth firms require in order to succeed or must contend with in their regional
economic environment; 2) the resources or antecedents that are essential to the success of
high-growth firms also contribute to regional economic prosperity; 3) HGFs contribute to
regional economic prosperity; and 4) there are direct and indirect effects of antecedents
and HGFs on regional economic outcomes.
The Regional High-Growth Firm Antecedents and Outcomes Framework (Figure
III) conceptualizes inputs and outputs of HGFs in the context of RBV based upon the
literature discussed. Economic outcomes are considered separate dependent variables

49
connecting to independent variables via paths within this model. First, entrepreneurial
density is a resource within a region that spurs the development of HGFs, influencing
employment, and per capita income growth rates. Second, startup capital is an vital firm
and regional resource that fulfills the capital demands of growing HGFs resulting in
regional employment, and regional income. Third, human capital is an essential resource
because greater regional knowledge stock is assumed to contribute to firm growth with
follow-on employment and income growth. Fourth, regional business costs are an
important control variable because areas that have pervasive agglomeration economies
will have higher operating costs as land rents and labor markets capture part of the value
of the spillovers. Additionally, HGFs themselves are agents of positive regional business
resources because they contribute to positive regional economic outcomes of employment
gains and higher per capita incomes.

50
Figure III: Regional High-Growth Firm Antecedents and Outcomes Framework
Research Hypotheses
This section describes the Regional High-Growth Firm Antecedents and
Outcomes Framework and how the model is operationalized (Figure IV). This model
allows for the investigation of the relationships between the antecedents of HGFs on
HGFs, HGFs on regional economic outcomes, and the antecedents of HGFs on regional
economic outcomes.
Model Specification
This study tests the model’s hypothetical relationships with path analysis. Path
analysis allows for the examination of the interdependence between variables in a more
structured manner than is possible with a correlation analysis. Path analysis is useful in
making explicit the association between variables and the connections between an
independent variable and a dependent variable in a system-like approach (Duncan, 1966).

51
However, path analysis requires a set of assumptions that are imposed by the researcher
relying on the underlying theory and existing literature to establish hypothesized
causality between the variables (Streiner, 2005). Endogenous and exogenous variables
are established by their position along the paths established by the researcher (Streiner,
2005).
This section describes the results from a path model that operationalizes the
Regional High-Growth Firm Antecedents and Outcomes Framework, which in turn is
derived from both the RBV of the firm and regional factor markets. This model
operationalizes the concepts delineated in Figure IV, allows for the investigation of the
relationships between inputs and HGFs, HGFs and outcomes, and the direct impact of the
inputs on the outcomes. This model is designed to determine the overall effects of the
antecedents on HGFs, the impact of HGFs on regional economic outcomes, and the direct
effect of the antecedents on regional outcomes. Five hypotheses are put forth about the
direct and indirect relationships, or paths. Each of the proposed hypotheses contains three
sub-paths (a, b, and c) to test the direct and indirect effects paths.
Hypothesis 1: Regional entrepreneurial density is positively related to a)
employment growth rates, b) the level of high-growth firms, and c) percent
change in per capita income.
Hypothesis 2: Regional startup capital is positively related to a) employment
growth rates, b) the level of high-growth firms, and c) percent change in per
capita income.

52
Hypothesis 3: Regional human capital is positively related to a) employment
growth rates, b) the level of high-growth firms, and c) percent change in per
capita income.
Hypothesis 4: Regional business costs are a control variable and vary based on the
product cycle and regional assets. Regional business costs are positively related to
a) employment growth rates, b) the level of high-growth firms, and c) percent
change in per capita income.
Hypothesis 5: The percentage of high-growth firms in a regional economy is
positively related to a) employment growth rates and b) percent change in per
capita income.
Figure IV: Hypotheses of the Regional High-Growth Firm Antecedents and
Outcomes Framework

53
Method
This study used path analysis to test the hypothesized relationships between the
inputs and outcomes in the framework. This method is similar to that employed by Qian
& Acs (2013) and Qian, et al. (2013; both articles investigated knowledge as it relates to
regional systems of entrepreneurship. Path analysis is a method used because of its ability
to go beyond the capabilities of multiple regression to examine more complex models.
According to Qian et al. (2013), path analysis is beneficial because of its ability to
distinguish between the direct effects and indirect effects of variables on outcomes.
Streiner (2005) points out that, in addition to being able to examine more complex
models than multiple regression, path analysis can help researchers compare different
models and determine which best matches the data. However, path analysis is unable to
establish causality and has limited abilities beyond justifying whether data fit the
proposed model.
Research Design
This study used Metropolitan Statistical Areas (MSAs) as the unit of analysis to
delineate each region and is a cross-sectional analysis of the association between
antecedents and the performance of HGFs, while percentage change variables are used
for outcome measures for the 355 MSAs1 in the United States. Seven variables were
constructed using available public and private databases and used in the path analyses.
The target year for data collection was 2013; however, data for the variable
entrepreneurial density were only available for 2012. Because entrepreneurial density
measures the regional stock of entrepreneurs, a one-year lag was used (2012 data versus
1 355 MSAs were selected out of the universe of 388 MSAs due to data availability.

54
2013) to account for the lag between the creation of firms and their contribution to a
region’s entrepreneurial density. Regional outcome variables years were created to
measure the impact of the performance of HGFs in 2013on economic growth and the
growth in per capita income from 2014 to 2015. Table I describes the variables used and
how they were constructed.
Table I: Variables and Variable Definitions
Variable Measure Description Year
Used Source
Entrepreneurial Density
(Number entrepreneurs + number of people
working for startups or high-growth companies) /
adult population in MSA
2012 Kauffman Foundation
Startup Capital Venture capital raised ($Mil) 2013 Thompson Reuters
Human Capital Percentage of individuals age 25 or older with a
bachelor's degree or higher in MSA 2013
U.S. Census Bureau,
American Community Survey
Business Costs Cost of Doing Business Index, which includes
labor, energy, and taxes. 2013 Moody's Analytics
Share of High-Growth
Firms Number of Inc. 5000 companies/all firms in MSA 2013
Inc.com; U.S. Census Bureau
Business Dynamics Series
Per Capita Income
Growth Rate
Percentage change in personal income/MSA
population
2014 to
2015
U.S. Bureau of Economic
Analysis
Employment Growth Rate Percentage change in private sector employment in
MSA
2014 to
2015
U.S. Bureau of Labor
Statistics
Direct and Indirect Antecedents of Regional Economic Outcomes
This model examines the direct, indirect, and total effects of the antecedents of
HGF performance, the direct impacts of the antecedents on the one-year growth rate in
two regional economic outcome variables, and of the direct influence of HGFs on the
growth rate in these two regional economic outcomes. Direct effects are those where the
connections between variables have unbroken paths. Indirect effects are those where
HGFs mediate the relationships between the antecedents (entrepreneurial density, startup
capital, human capital, and business costs) and economic outcomes (employment and per
capita income). This next section identifies how the model is specified, the directionality
of paths, and the operationalization of variables in the model.

55
Entrepreneurial Density
Entrepreneurs seek to start businesses for many reasons, but as Zimmer (1986)
shows, the decision is a function of opportunity, motivation, and access to resources.
Beyond this, Zimmer states that social networks and relationships are crucial to
facilitating the entrepreneurial process. Density, from a managerial point of view, equates
to the interconnectedness of an entrepreneur’s contacts (Hoang & Antoncic, 2003;
McEvily & Zaheer, 1999). Density is often referred to as an entrepreneur’s social
network but implies a very business-oriented network. Hoang and Antonic (2003)
highlight the importance of assessing and measuring the relationships of entrepreneurs.
Entrepreneurial success can be supported with large and dense networks of other
entrepreneurs. A high density of entrepreneurs within an economic regions can increase
the probability that a new business entrant will find champions and advisors early in the
business development process, thus facilitating and encouraging an increased number of
entrepreneurial ventures and improving the probability of the success of each (Huggings
& Williams, 2011; Verheul, et al., 2001). The regional studies literature points to the
importance of entrepreneurial density and the volume of entrepreneurial activities to
regional economic growth and prosperity (Acs & Szerb, 2007; Audretsch & Keilbach,
2008).
For this model, entrepreneurial density was operationalized as the number of
entrepreneurs and people working for entrepreneurs, startups, and HGFs in the region
divided by the region’s adult population (Ortmans, 2015). The entrepreneurial density
measure encompasses entrepreneurs and those who work for them because both are
taking risks in choosing to start a business or to work in a startup. Data for this variable

56
comes from the Ewing Marion Kauffman Foundation, which gathers information on
entrepreneurs and startup employment and constructs an index where the closer a region
is to 1, the higher is its entrepreneurial density.
Social networks and mentors are essential aides for entrepreneurs because they
provide access to business-building resources. Access to regional social networks and
mentoring are also important to facilitate the development of entrepreneurs. Therefore,
entrepreneurial density is an independent variable in the model that has a direct effect on
the level of HGFs, as well as a direct effect on regional economic outcomes.
Startup Capital
A resource all businesses need to succeed is startup capital. Startup capital and
early-stage investment have long been recognized as important for building successful
businesses and provide necessary encouragement for entrepreneurial activity (Lerner,
2002, 2009, 2010). Moreover, gaining access to startup capital is identified in the RBV of
the firm as important to success (Barney, 1991; Ireland, et al., 2003). However, access to
the funds required to launch and operate a new high growth business is particularly
challenging and problematic for startups. Because many startups lack fixed assets, liquid
assets, or an operating history, they often cannot be approved for institutional financing
and instead rely on personal savings and money from family and friends to launch their
ventures (Berger & Udell, 1998).
Additionally, external financing, as measured by venture capital (VC) investment,
has been shown to be critical to firm growth, especially for high-technology startups
(Florida & Kenney, 1988). In addition to providing firms with the money needed to
operate and grow, VC investment is an essential signaling mechanism to other investors

57
and to the labor market that the recipient firms are credible and viable businesses (Davila,
Foster, & Gupta, 2003). Signaling that a nascent business is credible may be partially
responsible for why VC-backed firms tend to bring their products to market faster
(Hellman & Puri, 2002).
VC shows a high degree of spatial concentration, are located near financial
centers and produce spatial agglomeration benefits for entrepreneurs in those regional
economies (Florida & Kenney, 1988). This spatial concentration increases not only firm
growth rates directly but also generates indirect benefits for entrepreneurs in the region.
VC firms support regional innovation and growth because they act “as both catalyst and
capitalist [for entrepreneurs], providing the resources and the contacts to facilitate new
business startups, spinoffs and expansions” (Florida & Kenney, 1998, p. 43). Samila and
Sorenson (2011) found that an increase in VC investments contribute to an increase in
firm starts with matching increases in employment and income, suggesting that venture
capital stimulates more job creation than it funds. Because the literature finds a direct link
between VC as an input to HGFs and regional economic outcomes, the model draws a
direct path from VC to HGFs and a direct path from VC to positive regional economic
outcomes.
For this study, the startup capital variable was measured as institutional VC
investment (in dollars) raised in each county across the United States. VC investment
does not capture all investment in firms, such as home equity loans, loans from family
and friends, equity shares given to investors, volunteer time, and other important ways
firms gather business-building resources. However, VC does indicate a formal investment
from another party to a startup, and VC investment tends to be focused on startups. Data

58
for startup capital was obtained from Thompson Reuters as VC raised in millions of
dollars at the county level and aggregated to the MSA level using the 2013 U.S. Census
Bureau MSA delineation file (U.S. Census Bureau, 2016).
Human Capital
In traditional models of economic growth, the production function consists of two
components, labor and capital, and only by increasing one or both can economic growth
occur (Lerner, 2009). Abramowitz (1956) found that 85 percent of U.S. economic growth
between 1870 and 1950 was due to innovation and increased productivity. His study
indicated that innovation and knowledge, not solely traditional productivity increases,
increased economic growth. Solow (1956) indicated that it was not only physical capital
and labor that accounted for growth but technological change laying the groundwork for
New Growth Theory. New Growth Theory conceptualized technology as endogenous to
economic growth and envisioned human capital as the vital source of technological
progress (Lucas, 1993; Mathur, 1999; Romer, 1986, 1990). Moreover, because
knowledge is not subject to decreasing returns to scale like other production function
components (i.e., capital and labor), knowledge has positive externalities for the economy
and is a crucial component to progress (Romer, 1990).
Because knowledge is concentrated in individuals, entrepreneurship is an
instrument through which knowledge spills over into the broader economy and toward
the commercialization efforts of other startup firms (Thurik, 2009). “[K]nowledge is
assumed automatically to spill over from the firm or organization generating that
knowledge for commercialization by third-party firms” (Audretsch, 2007, p. 66).
Knowledge spillovers indicate externalities of proximity (physical and social geographic

59
distances) and help in the transmission of ideas, resulting in more ideas to further
innovation (Glaeser, et al., 1992).
There has been a large volume of literature exploring the effect of human capital
on entrepreneurial activities (Acs & Armington, 2004; Lee, Florida, & Acs, 2004). The
knowledge spillover theory of entrepreneurship is a model that shifts from “exogenously
assumed firms to individual agents with new knowledge endowments” (Acs, et al., 2009,
p.18). To test their model, the authors regressed knowledge stock, research and
development exploitation by incumbent firms, and barriers to entrepreneurship on
entrepreneurship and found that entrepreneurial activity tends to be greater where more
knowledge stock exists.
Human capital is seen to be a contributor to both HGF success and improved
economic outcomes. At the regional level, studies examined the connection between
college graduation rates and new firm formation rates (Qian, et al., 2012) and the linkage
between entrepreneurship education and the establishment of high-growth firms
(Galloway & Brown, 2002). For example, Abel and Gabe (2011) showed that a one
percentage point increase in residents with a college degree results in a two percent
increase in gross regional product per capita. Additionally, Eckhardt and Shane (2011)
examined whether changes in technology affected the distribution of new HGFs. They
found that growth in the employment of scientists and engineers resulted in an increase in
the birth rate of new high-growth firms, thereby, reinforcing the link between increased
human capital (i.e., more well-educated scientists and engineers) and the success of
HGFs. Considering the previous research, the directionality in the model is from the
paths of human capital influencing HGFs and human capital influencing the regional

60
growth in employment and per capita income. Data for the human capital variable in the
model are from the U.S. Census Bureau American Community Survey and are measured
as the percentage of individuals age 25 or older in a region who have at least a bachelor’s
degree for the year 2013.
Business Costs
Location theory, as expressed in classical economic geography, emphasizes
transportation and labor costs as factors of business location (Bhat, Paleti, & Singh, 2014;
Capello, 2014). Bartik (1985) examined how unionization rates, taxes, and other
characteristics influence site selection decisions of manufacturers and found that these
costs affect business location decisions. Although this finding implies that businesses
would be discouraged from locating in expensive cities, Porter (2000) showed that
businesses tend to cluster together, even in locations that have high business costs (i.e.,
labor, taxes, and rent) because they benefit from agglomeration externalities garnered
from production and consumption (purchasing). This finding was reinforced by Bhat, et
al., (2014), who examined business location decisions at the county level in Texas to
better understand the impact of agglomeration economies and diseconomies, industrial
specialization, human capital, fiscal conditions, transportation infrastructure, and land
development patterns. They found that business location decisions weighed industry
specialization and human capital as the most essential demand-side factors and
considered infrastructure and land development as the most important supply-side
factors. Thus, regional endowments must align with both the supply and demand needs of
a business for it to locate in the region.

61
Each region has its own combination of regional endowments that contribute to
positive entrepreneurial outcomes. It is important to account for regional differences in
transportation, human capital, and infrastructure to control for regional endowments that
influence business location decisions. Regional business costs are a proxy for regional
endowments of these factors because, as firms co-locate in a geographic area shared
pools of labor, suppliers, and consumers are developed; these shared resources give rise
to spillovers and positive externalities (Harris, 2011). While these shared resources can
generate positive externalities for businesses, they may also create more competition
among businesses in a regional industrial cluster (Porter, 2000).
The Cost of Doing Business Index from Moody’s Analytics was used to control
for the production characteristics of a region. The Cost of Doing Business Index
incorporates four sub-indices – 1) Unit Labor Cost Index, 2) Energy Cost Index, and 3) a
combination of Office Rent and State and Local Tax Burden into a single index. The Cost
of Doing Business Index weights the component indices, with labor costs given a 65%
weight, energy costs a 15% weight, tax burdens a 10% weight, and office rents and state
and local taxes a 10% weight (Franz, 2011).
Direct Antecedents on Regional Economic Outcomes
High-Growth Firms
HGFs are at the center of the Model of Regional High-Growth Firm Antecedents
and Outcomes, and the analysis is center around these firms. As previously discussed,
policymakers focus intently on HGFs due to their potential as employment generators for
local economies. Recent studies have examined the impact of HGFs in Georgia (Choi, et
al., 2013), South Carolina (Woodward, et al., 2011), and across the United States

62
(Clayton, et al., 2013) using employment. These studies have found that while HGFs
make up a small percentage of the overall business population, they make a
disproportionately large contribution to employment growth, replicating the long-
standing findings of Birch et al. (1993) and Birch and Medoff (1994). However, most of
these analyses use descriptive statistics and do not explicitly engage in statistically valid
hypothesis testing.
There has been significant work within entrepreneurship studies linking business
startups to job creation (Birch, 1979) and gains in gross product and per capita gross
product (Carree & Thurik, 2010; Carree, van Stel, Thurik & Wennekers, 2002). There is
also substantial literature detailing the relationship between HGFs and regional
employment growth (Acs, et al., 2008; Birch, et al., 1993; Birch & Medoff, 1994).
Employment growth is measured using regional, or metropolitan, private sector
employment from the U.S. Bureau of Labor Statistics and regional per capita income data
are acquired from the U.S. Bureau of Economic Analysis. In most of these studies,
change in economic outcomes was measured in years that followed the activities of the
HGFs.
In the model examined in this paper, HGFs act as intermediaries that convert
entrepreneurial density, human capital, startup capital, and business costs into regional
economic outcomes. Moreover, as an intermediary economic actor, HGFs are expected to
make an independent contribution to employment and per capita income. The number of
Inc. 5,000 firms in a metropolitan area divided by the total number of firms in each MSA

63
provided a standardized, or normalized, measure of the presence of HGFs in a
metropolitan area.2
Descriptive Statistics
Table II provides descriptive statistics for each of the variables used in the model.
Some metropolitan areas in the sample did not receive any startup capital investment or
did not have any HGFs. These values were marked as zeros, rather than missing values,
because they are true zeros due to the absence of a positive value. Most of the variables
had a wide dispersion as documented by the standard deviations reported in the table. For
example, human capital in the region with the highest share of adults with a bachelor’s
degree and above is five times higher than the MSA with the smallest proportion. The z-
score method was used to standardize the data in a range of 0 to 1 for all variables so that
they share the same scale.
Table II: Descriptive Statistics
Variable
Observations
Metropolitan
Areas
Mean Standard
Deviation Minimum Maximum
Entrepreneurial Density 355 114.7 37.1 21.9 247.7
Startup Capital ($Mil) 355 $95.3 $600.3 $0.0 $8,420.0
Human Capital 355 26.7% 8.3% 11.3% 58.5%
Business Costs 355 90.2 10.0 67.8 158.7
Per Capita Income Growth Rate 355 $0.04 $0.02 -$0.11 $0.94
Employment Growth Rate 355 0.02 0.02 -0.05 0.07
Share of High-Growth Firms 355 0.0005 0.0006 0.0000 0.0033
2. The number of businesses in a metropolitan area is from the U.S. Census Bureau, Business Dynamics
Statistics. There are limitations to the use of Inc. 5,000 firms because individual firms apply for the
designation and are ranked by their annual revenues over a three-year period (Inc., 2015). This may
increase the selection bias of the firms within this sample since they are self-selecting themselves to apply
for the designation. Many authors use the Inc. 500/5,000 listing as a definition for high growth and have
had robust studies leading to important conclusions (Eckhardt & Shane, 2011; Motoyama, 2014).

64
Table III displays the correlation matrix for all variables in the model. Almost all
of the correlations in this model are significant at the 99% level (p<.01), however, this
can be attributed to the extraordinarily large sample size (Warner, 2008). It is essential to
investigate the magnitude of each correlation to determine its independence and the
absence of potential multicollinearity. This is particularly important to prevent
multicollinearity in a path model to avoid model sensitivity and weakening the statistical
power of the model (Hair, Black, Babin, Anderson, & Tatham, 2006). No variables have
extremely high degrees of correlation since no variable exceeds 0.60.
Table III: Correlation Matrix
1 2 3 4 5 6 7
1. Entrepreneurial
Density 1.0000
2. Startup Capital 0.1923*** 1.0000
3. Human Capital 0.4472*** 0.2858*** 1.0000
4. Business Costs 0.1455*** 0.2749*** 0.2756*** 1.0000
5. Employment
Growth Rates 0.4989*** 0.1460*** 0.2230*** 0.0606 1.0000
6. Per Capita
Income Growth
Rates
0.1116** 0.1709*** 0..1875*** 0.1413*** 0..3890*** 1.0000
7. Share of High-
Growth Firms 0.2921*** 0.3350*** 0.5810*** 0.3236*** 0.2169*** 0.1400*** 1.0000
Observations 355 355 355 355 355 355 355
Note: ***: p<.01; **: p<.05; *: p<.10

65
Analysis and Results
The path model (Figure V) displays the relationships between the variables and
the coefficients of each path. The path analyses were conducted using STATA 14 and the
SEM command to investigate the framework and the hypotheses specified.3 Because
there are large differences in the scales of each variable, all data were standardized using
z-scores. Path coefficients (also known as β coefficients or standardized regression
coefficients) represent the change in standard deviation from the mean.4 Figure V
displays the results for the two path models. One explaining the one-year growth rate in
employment from 2014 to 2015 and the other the one-year growth rate in per capita
income. Both models pass the goodness-of-fit indices for path analysis models. Bowen
and Guo (2009) report that for an acceptable model the p-value for the chi-square statistic
should be no smaller than 0.05. Chi-square measures the distribution of the data to
determine whether variables are independent.
3 Although the SEM command indicates a “structural equation model,” this command is also used for path
analysis. 4 For example, as seen in Figure V, the path between startup capital and HGFs is 0.15 and significant;
therefore, if startup capital increases by 1 standard deviation from its mean, innovation is expected to
increase by 0.15, its own standard deviation from its own mean, while holding all other paths constant.

66
Figure V: Path Coefficients of Regional High-Growth Firm Antecedents and
Outcomes Framework
Note: ***: p<.01; **: p<.05; *: p<.10; nonsignificant results marked with a dotted line. Goodness-of-fit
index: 106.12 (p-value: 0.000); dotted line indicates nonsignificant result. R2 = 0.463
Direct Effects
Figure V displays the path diagrams with the path coefficients of the relationship
between regional entrepreneurial density, human capital, startup capital, business costs,
high-growth firms, and the regional economic outcomes of the one-year growth rate in
employment and the one-year growth rate in per capita income. As shown in the figure,
entrepreneurial density has a significant positive effect on the employment growth rate
(.24) affirming the hypothesis. The density of entrepreneurs in a region directly increases
the one-year private-sector employment growth rate, affirming the literature that shows

67
that entrepreneurial density and entrepreneurial activities contribute to economic growth
and prosperity (Acs & Szerb, 2007; Audretsch & Keilbach, 2008).
Beyond this, practitioners point to the importance of entrepreneurial networks to a
thriving regional entrepreneurial environment (Feld, 2012; Hwang & Horowitt, 2012;
Taich, Piazza, Carter, & Wilcox, 2016). When entrepreneurs concentrate in a given
locality the region benefits from the spillover effects that this proximity facilitates.
Moreover, what this model shows is that having a larger number of individuals who start
companies or take on the risk of working in a startup firm are associated with positive
regional economic outcomes.5 Practitioners Taich, et al. (2016) drew a similar conclusion
after interviewing entrepreneurs in Northeast Ohio. They found talent attraction to be key
to a strong entrepreneurial environment. When jobs are more plentiful overall in an area,
the individual risk to workers from joining in a startup is smaller because they will likely
be able to find another job in the area if the startup fails (Taich, et al., 2016).
The model reveals no significant relationship between entrepreneurial density and
the proportion of HGFs in a regional economy and the one-year growth rate in per capita
income. This indicates that entrepreneurial density is important for the health of the
economy (employment), but is not significantly associated with increasing the proportion
of HGFs in the regional economy or increasing the per capita income growth rate.
The model demonstrates that the absolute amount of startup capital raised in a
metropolitan area has significant and positive direct effect on the share of HGFs in the
number of businesses in a metropolitan economy (.15) and on increasing the per capita
income growth rate (.11). However, it was not significantly associated with the one-year
5 Entrepreneurial density in this model is measured by number entrepreneurs plus the number of people
working for startups or high-growth companies.

68
employment growth rate (.03). These findings reinforce both the academic and
practitioner literature that identify the importance of VC investment in the growth of
startups.
Beyond the formal private VC investments enumerated in this model, there is a
wide variety of public and philanthropic programs to assist small businesses in acquiring
capital necessary for growth. The best-known program is the Goldman Sachs 10,000
Small Businesses program, which provides small business owners with education
designed by Babson College6 and connects them to resources and capital to help grow
their businesses. The program boasts that 78 percent of graduates’ report growing
business revenues within 30 months of completing the program, compared to the 47
percent of businesses that reported increasing their revenues in 2016 (Goldman Sachs,
n.d). The model reported on in this paper indicates that programs, such as Goldman
Sachs’ that provide access to capital, as well as education and networks, will increase the
success rate among business startups and contribute to income growth and business
success in metropolitan regions.
The human capital variable in the model had a strong positive relationship with
the proportion of HGFs in a region’s economy (.49), the one-year employment growth
rate (.13), and the one-year growth rate in per capita income (.13) affirming all three
human capital hypotheses. This finding is consistent with the literature, indicating that the
greater the human capital in a region, the greater the rate of entrepreneurship (Davidsson
& Honig, 2003; Mathur, 1999; Unger, Rauch, Frese, & Rosenbusch). Human capital, as
6 Babson College is a leading entrepreneurship research university.

69
measured by bachelor and advanced degree attainment (.13), held a significant, albeit
weak, relationship to the one-year growth rate in per capita income.
Business costs showed a significant positive relationship with only the share of
HGFs in the economy (.14). The relationship indicates that HGFs have a slight, but
significant, tendency to be located in areas with high business costs. The lack of
association between business costs and regional economic outcomes (change in private
sector employment and change in per capita income) indicates that across 355
metropolitan areas businesses costs are not associated with changes in these outcomes.
Lastly, the proportion of HGFs in the economy showed a significant positive relationship
with the one-year percent change in private sector employment (.12), affirming an
argument made in the literature that HGFs are regional job generators (Henrekson &
Johansson, 2010).
Interestingly, HGFs do not have a significant direct effect on growth in per capita
income, despite having a positive effect on the growth in private sector jobs. There is
literature identifying wealth as a motivating factor as to why entrepreneurs start firms
(Hitt & Ireland, 2000; Hitt, et al., 2001), but there is scant literature as to whether HGFs
contribute to overall increases in income.
Indirect Effects
Path analysis is a unique way of examining the connection between variables and
observing the indirect effects that variables have on outcomes. This study investigates the
direct, indirect, and total effects of the model. Direct effects are the connection between
variables that have an unbroken path, while indirect effects assess the broken, or

70
mediated, paths. Total effects are the sum of direct and indirect effects.7 Table IV
provides the summary of the direct, indirect, and total effects between each independent
variable (entrepreneurial density, startup capital, business, costs, and the proportion of
high-growth firms in the business base of the economy) and each dependent variable
(one-year growth rates in employment and per capita income). It is essential to
understand that the direct effects in Table IV correspond to the path coefficients in Figure
V. The indirect effects are the contribution or deduction that HGFs have on the
independent variable (entrepreneurial density, startup capital, human capital, or business
costs) via the mediating variable (the proportion of HGFs in the business base) to achieve
the total effect on the dependent variable (employment or per capita income).8
Table IV. Summary of Standardized Effects on One-Year Growth Rates in
Employment and Per Capita Income
Dependent Variable:
Employment
Dependent Variable:
Per Capita Income
Independent Variable Direct
Effects
Indirect
Effects
Total
Effects
Direct
Effects
Indirect
Effects
Total
Effects
Entrepreneurial Density 0.24*** 0.00 0.24*** 0.02 0.00 0.02
Startup Capital 0.02 0.02* 0.04 0.11** 0.00 0.11**
Human Capital 0.13** 0.06* 0.19*** 0.13* 0.00 0.13**
Business Costs -0.02 0.02 0.00 0.07 0.00 0.07
Percent High-Growth
Firms in Economy
0.12* (no path) 0.12* 0.00 (no path) 0.00
Note: ***: p<.01; **: p<.05; *: p<.10;
7 For example, there is a direct effect between startup capital and employment, and there is an indirect
effect of high-growth firms on the relationship between startup capital and employment. The total effect
takes into account both of these paths (Figure V). 8 Since HGFs only have a direct effect on employment and per capita income as the model is specified, the
indirect effects are 0.

71
The proportion of HGFs has a small indirect effect on the employment and per
capita income one-year growth rates through most of the independent variables in the
model. The indirect effects of HGFs on employment growth are slight, with the largest
indirect effect of through the proportion of HGFs in the economy relating to human
capital (.06). This shows that increasing the proportion of HGFs in a region’s business
base has a weak indirect effect on employment. Although the percent of HGFs in the
economy has a significant relationship to employment (.11), the indirect effect of startup
capital and business costs it is weak. Examining the indirect effects of the independent
variables, mitigated through HGFs, on the one-year growth rate in per capita income
reveals even weaker results. As can be seen in the table, the proportion of HGFs in the
economy has either no effect or decreases the power of the independent variables on the
growth rate in per capita income. This result only reinforces the earlier finding regarding
the fact that the proportion of HGFs in a region’s business base was not significantly
related to the one-year growth rate in per capita income. Income growth may be part of a
much longer-term process than is employment growth.
Discussion
This study sought to test quantitatively the relationships between inputs and
outputs of HGFs on regional economies. This paper presented a theoretical background
for the investigation of HGFs grounded in the regional science literature and the
Resource-Based View (RBV) of the firm. Several articles in the regional science and
management literature investigated high-growth firms as mechanisms of growth and
income creation but missing from the literature is an ecosystem approach to the

72
contributions of HGFs to their regional economies. Grounding this study in RBV of the
firm establishes a theoretical framework for understanding the critical inputs to HGF
success. Much of the current literature has examined HGFs and their role as job
generators in the economy. This analysis examines the relationship of the proportion of
HGFs in the business base of an economy to one-year employment and income growth
rates.
A regional systems model of economic success centered on HGFs was drawn
from the literature and established as the Regional High-Growth Firm Antecedents and
Outcomes Framework. This framework set HGFs as an intermediary between regional
resources and regional economic outcomes. In other words, the proportion of HGFs in the
business base of the economy was assumed to act as the conduit that harnesses business
resources (inputs) to produce positive regional economic outcomes. Path analysis was
used to test this framework.
Of the HGF antecedents (entrepreneurial density, startup capital, human capital,
and business costs) specified in this model, human capital had the greatest effect on the
density of HGF in the business base and on the regional economic outcome of one-year
growth in per capita income. Findings reinforce much of the existing literature on the
importance of human capital and knowledge in generating innovation and economic
growth (Romer, 1990) and in fostering entrepreneurship (Acs, et al., 2004).
A positive association was seen in the model between the proportion of HGFs in
regional economies and the one-year employment growth rate. This finding also
reinforces the literature identifying HGFs as regional job generators. In fact, the model
73
may undervalue the contribution of HGFs to regional employment because HGFs tend to
be younger and smaller than other firms (Clayton, et al., 2013).
The lack of an observed relationship between the proportion of HGFs in the
business base and the one-year growth rate in regional per capita income suggests the
next frontier in HGF research. Most of the literature on HGFs investigates the importance
of these firms regarding job creation; however, little research exists as to the
contributions these firms make to overall regional prosperity and income creation. In the
model presented here, the fact that the proportion of HGFs in the business base is shown
to be associated with one-year job growth but not the one-year growth in per capita
income is intriguing. Policymakers look to high-growth firms to contribute to the health
of their economies through job creation, sales output, and higher wages. However, if
these firms do not create wealth in the region, the contribution of these firms and public
support for them may need to be reassessed.
74
CHAPTER IV
ESTABLISHING A TYPOLOGY OF HIGH-GROWTH FIRMS: LESSONS
FROM THE STATE OF OHIO
Introduction
Policy makers and practitioners over the last few decades have focused on
examining high-growth firms (HGFs), due to their potential for creating job growth and
prosperity. Numerous academic and practitioner accounts (Acs, et al., 2008; Birch, et al.,
1993; Birch & Medoff, 1994) have praised HGFs as the engine of job growth throughout
the United States. This discourse can be viewed as moving economic development away
from the zero-sum game of business attraction, retention, and expansion--which is
dependent upon factors that economic development has little, if any, control over (Rubin,
1988)—and toward a positive sum process of fostering innovation and entrepreneurship
(Buss, 2002; Mathur, 1999).
The national conversation has shifted in the last ten years so that economic
development organizations have made entrepreneurship a priority, a change that began
with the creation of the Office of Innovation and Entrepreneurship within the U.S.
Economic Development Administration (EDA) under the America Creating
Opportunities to Meaningfully Promote Excellence in Technology, Education, and

75
Science (or COMPETES) Reauthorization Act of 2010 (U.S. Economic Development
Administration, n.d.). This act incorporated entrepreneurship as a policy mechanism.
America COMPETES marks a significant shift from traditional EDA investments in
infrastructure, construction, and disaster recovery, and toward fostering innovation and
entrepreneurship. There is still vagueness that surrounds identifying and fostering
entrepreneurship and HGFs to contribute to economic development gains. It is easy to see
the benefits of business attraction and development since when a company relocates from
another location or expands, it can generate jobs. Entrepreneurship and fostering HGFs
can be a lengthy process involving many economic development actors and professionals
to help seed, grow, and foster an idea into a business. This lack of clarity regarding who,
how, why, and, most importantly, when can lead to funding fatigue in economic
development entrepreneurship. This paper looks to help fill this gap in the literature by
creating a typology of HGFs in Ohio using methodologically sound quantitative
techniques.
The underlying assumption made to justify supporting HGFs is that they will hire
new workers in response to business growth, but this may not necessarily be the case.
Firms grow in a variety of ways: hiring new workers in response to internal sales growth
or by acquiring other companies via mergers and acquisitions and brining some of their
workers. Moreover, the rate of growth can be unpredictable as well.
This paper looks to empirically examine the typology of HGFs using a variety of
growth measures and characteristics based on the literature that underlies this area of
research. This literature review surveys the appropriate literatures in business, economics,
and regional studies. The literature review informs a cluster and discriminant analysis on

76
26,104 HGFs in the state of Ohio. The cluster analysis places each HGF into a relatively
homogeneous subset of the universe and the discriminate analysis identifies the statistical
reasons why the clusters are homogenous.
Theoretical Background
Firm growth is a complicated and multifaceted process that has interested
economists and management professionals for decades (Audretsch et al., 2014; Delmar et
al., 2003). According to Birch and other scholars, the reason why HGFs are of interest in
economic development policy is that a small number of firms generate a
disproportionately large share of new jobs. This observation has been reinforced by the
results from a number of studies examining the United States (Birch, et al., 1993; Birch &
Medoff, 1994), the United Kingdom (Anyadike-Danes, Hart, & Du, 2015; Brown &
Mawson, 2016), Spain (Segarra & Teruel, 2014), and Italy (Arrighetti & Lasagni, 2013).
Most of these studies have examined the economic impacts of HGFs—new jobs, more
output, and higher productivity. However, few studies have examined the heterogeneous
growth pattern of HGFs.
Investigating the mechanism of firm growth is not a new conversation and traces
its roots back to the early twentieth century. French engineer Robert Gibrat determined
that the growth rate of a firm is independent of its initial size, a rule now called “Gibrat’s
Law of Proportionate Effect” (Samules, 1965; Santarelli, Klomp, & Thurik, 2006).
Gibrat’s Law implies that growth among businesses is distributed as a log-normal
function and that firm growth is normally distributed, and their growth rates are randomly
distributed (Hölzl, 2009). Scholars have long debated Gibrat’s work, with some affirming
that growth is independent upon initial size (Hall, 1987; Hart & Prais, 1956; Mansfield,

77
1962; Simon & Bonnini, 1958), while others bring data to bear against Gibrat’s
hypothesis (Dunne et al., 1989; Gabe and Kraybill, 2002; Samules, 1965).
Penrose (1959) took a more management-focused approach to firm growth and
determined that growth is intrinsic to learning-while-doing. As managers and executives
become more familiar with their roles, they become more competitive and efficient in
their jobs and can focus less on managing and more on value creation. In fact, Jovanovic
(1982) proved that as entrepreneurs learn, they have a lower chance of failure.
Williamson (1967) introduced a theory of the firm that discusses the cumulative loss of
control between hierarchical levels of a firm. Meaning, the larger the firm, the less
control management has over decision-making power at different levels. The
management literature sees the growth of HGFs as a process intrinsically tied to the
strategic management of the organization (Kim & Mauborgne, 1996; Nicholls-Nixon,
2005; Parker, Storey, & van Witteloostuijn, 2010).
Measurement of Growth
There are a variety of approaches to measuring firm growth, which creates
inconsistencies in the conceptualization and operationalization of firm growth
(Weinzimmer et al., 1998). This ambiguity not only offers a disservice to the
entrepreneurship discipline but also impedes the advancement of the literature. McKelvie
and Wiklund (2010) rightfully note that many researchers have been quick to evaluate
how much a firm grows, rather than start with the first question of how a firm grows.
Through their literature review, the authors find that it is “virtually impossible to arrive at
a classification scheme that allows us to summarize the literature succinctly in a
meaningful way.” (McKelvie & Wiklund, p. 263). Nightingale and Coad (2014) note that

78
the search classification scheme of firm growth can be a perpetuating system, since
“demands for positive evidence [in entrepreneurship research] which create a shift toward
increasingly positive interpretations as one moves from analysis, through the grey
literature, to policy.” (p.124).
Much of the literature on this subject debate what type of firm growth should be
used as indicators to define HGFs (i.e., employment or sales), how to measure of these
indicators (i.e., absolute or relative to other firms), and how best to combine these
elements to capture the concept of high growth. Delmar (1997) surveyed fifty-five
articles to assess the choice of growth indicator and construction of indicator. He found
that the most numerous variables (in descending order) were the change in sales,
employment, performance, market share, and assets. The most common measurement of
the indicators was (in descending order) relative change, absolute values, log absolute
values, and log relative change. Some scholars suggest that the literature should strive to
find a single or limited way to calculate growth (Chandler and Hanks, 1993; Delmar,
1997; Weinzimmer, Nystrom, & Freeman, 1998). However, Delmar, et al. (2003)
disagreed with this since growth is multifaceted and the "use of multiple measures of firm
growth would likely provide a complete picture of any empirical relationships as well as
provide a way to test the robustness of any theoretical model to misspecifications in the
dependent variable.” (p. 195). Not only are the indicators chosen called into question, but
the computation of the indicator can influence the results of a firm growth study. The use
of relative growth measures (e.g., percentage change) can inflate the performance of
smaller firms while using an absolute measure (e.g., level) can enhance the performance

79
of larger firms. In addition, the way in which a company grows is an equally important
distinction (Delmar et al., 2003).
In all, there are many ways a firm can grow, but understanding the mechanisms
that contribute to that growth is significant because those mechanisms can provide
indications for policy that can help facilitate job creation (Coad, et al., 2014). Do firms
hire their employees and then take on additional labor as needed, or do they acquire other
companies and personnel growth through acquisitions? Penrose (1959) points out that
firms that hire their workers and grow organically will have a smoother growth pattern,
compared with their counterparts that grow through mergers and acquisitions. Strategic
management points out that there are advantages and disadvantages to both types of
growth. According to Lockett, Wiklundm, Davidsson, and Girma (2011), organic growth
allows for the shared experience of all workers as they grow with the firm, while acquired
growth allows for the quick addition of a bundle of resources that can increase
productivity. This study builds upon that idea to examine the multidimensionality of firm
growth from multiple indicators and measures.
Scholars have created many different definitions of HGFs. Some definitions
include changes in employment or sales as the measurement indicator (Clayton et al.,
2013), others use a mixture of a minimum level of employment and consistent growth
rates as the qualifier as a threshold to be considered a member of the cohort
(Organization for Economic Co-operation and Development, 2007). Beyond this, studies
use varying time periods to calculate growth rates, ranging from one to six years; some
are measures are consistent with the literature, others appear to be randomly selected (i.e.,
Acs, et al., 2008; Stangler, 2010).

80
HGFs and Industries
In the wake of deindustrialization and structural economic changes of many U.S.
cities, especially in the Midwest, economic development policies sought to overcome
unfavorable market outcomes from offshoring, trade, and changes in defense spending by
trying to pivot away from their traditional economic bases and trying to attract and
support high-technology (HT) industries (Bartik, 1990; Malecki, 1984; Markusen &
Carlson, 1989).
Over the last twenty years, scholars have examined how technology influences
regional economic growth and entrepreneurship (Acs, et al., 1994; Jaffe, 1986, 1989;
Lendel, 2010). This literature arose from the hypothesis that technology industries and
research universities significantly contribute to their economies through regional
spillovers and innovation relay. Examining the influence of high-technology industries as
it relates to HGFs is a useful contribution to economic development policy and practice
since publicly supported entities are investing time, effort, and sometimes money in
HGFs and high-technology (HT) industries.
The literature on HGFs in HT industries is mixed. Some authors point out that
investing public economic development resources in this sector is not worthwhile since
these firms have at best modestly higher growth rates than do businesses in non-HT
industries (Brown & Mason, 2014; Coad & Rao, 2008). Other analysts have found
positive results, in particular, HT industries (Eckhardt & Shane, 2011; Segarra & Teruel,
2014).
Daunfeldt, Elert, & Johansson (2016) examined the industrial distribution of
HGFs in Sweden from 1997 to 2008, exploring the assumption that policymakers should

81
target HT firms because they are assumed to be high-growth. They found via logit
regression models that industries with high R&D intensity have a lower share of HGFs
than non-R&D intensive industries. Coad and Rao (2008) examined innovation and sales
growth of HT firms by matching NBER patent data with the Compustat database to
assemble sales, patents, and R&D expenditures by Standard Industrial Codes (SIC) from
1963 to 1998. They found that these firms only showed modest growth and concluded
that these firms could grow for a variety of reasons, not just through innovation. Brown
& Mason (2014) investigated technology entrepreneurs in the United Kingdom and found
that many of these firms are small, with few of them becoming HGFs.
Mayer (2011) in her book on Entrepreneurship and Innovation in Second Tier
Regions indicates there are three models of high-technology development: 1) a world-
class research university fostering a HT ecosystem (i.e., Stanford and Silicon Valley), 2)
research institutions and federally funded laboratories playing the same role, and 3) a few
areas that lack either a research university or a major research laboratory have fostered a
high-technology business base fueled by other anchor institutions (i.e., military facilities
or expenditures and/or the presence of private science-based companies). For the current
examination on HGFs in the state of Ohio, it is critical to note that Mayer placed
Cleveland into the second category, whereby the presence of a research university (i.e.,
Case Western Reserve University) was not enough to foster a high-technology industrial
cluster and that concerted efforts must be placed in facilitating these spillovers from
research institutions.
Mohr and Garnsey (2011) examined the characteristics of Cambridge, England’s
tech-based HGFs to determine the likelihood these firms exhibit certain characteristics

82
(resource endowments, serial entrepreneurs, and venture capital investment among
others) and the inverse if firms that display particular characteristics are HGFs. They
estimated a multi-level longitudinal cohort model and found that high-growth firms
benefitted from access to venture capital and intergenerational learning as a result of
being allied with either spin-offs or serial entrepreneurs. A majority of the firms
examined by Mohr and Garnsey benefited from receiving assistance from venture
capitalists to back technology that was previously developed in a corporate or academic
setting. Additionally, they found that tech-based HGFs successfully engaged in alliances
with other businesses more often than non-HGFs and, in addition, they had different
alliance patterns from non-HGFs that chose to use alliances.
From a strategic management perspective, Feeser and Willard (1990) examined
the founding strategy and performance of high- and low- growth HT firms from the Inc.
100 listing, discovering that the founding strategy was vital in the early stages of a firm
and often influenced its growth trajectory. Willard, Krueger, & Feeser (1992) expanded
on this by examining HT high-growth manufacturing firms from the Inc. 100. They found
that firms with CEOs who were the founder of the company were smaller in size and took
their company public on average 2.3 years earlier than non-founder CEOs.
Colombelli, et al., (2013) examined the technological exploration strategy of
HGFs to determine if they pursued a demand-pull strategy (creating goods from demand)
or technology-push strategy (creating technology and bringing it to market without
clearly having a target market in mind). Technology-push strategies are associated with
the firm not knowing specific uses to applications for its technologies and letting the
market guide product development. These scholars examined publicly traded firms in the
83
UK, Germany, France, Sweden, Italy, and the Netherlands and found that HGFs “do not
necessarily follow pure models of innovation patterns” (p. 266). Instead, they can be
viewed as representing a mix of strategies. Thus, the strategic decisions of the
owners/CEOs within the high-technology industries can affect the outcome and
performance of the firm.
Toward a Typology of High-Growth
Over the years, scholars have sought to identify what a HGF looks like and how it
grows. Dwyer & Kotey (2016) looked at three aspects of HGFs: 1) the psychology and
demographics of owners, 2) management practices and strategy, and 3) organizational
characteristics. These factors shape how management forms, assembles the firm, and
manages the firm creates the growth orientation of the firm. Similarly, Wennberg (2013)
conducted a literature review of thirty studies from the management perspective of HGFs
and found five major groupings of the current literature: managers’ leadership in HGFs;
managers’ business experience in HGFs; formal structures and adaptive capacities in
HGFs; innovation in HGFs; and profitability and growth of HGFs. In the end, he finds
that HGFs are, “more often founded and/or managed by a larger management team,
managers of HGFs are likely to be highly educated and have prior industry and leadership
experience, and that different types of innovativeness may be differentially related to
rapid growth.” (p. 14).
Surveys of the literature have confirmed the variability of HGF measurement.
Henrekson and Johansson (2010) surveyed the literature on HGF and found that
employment and sales are usually operationalized to represent growth indications
measured in an absolute or relative measure, with total growth most commonly used

84
because of data availability. Daunfeld, Elert, and Johansson (2010) extended Henrekson
and Johansson’s (2010) examination to eight additional studies, totaling twenty-eight, to
determine if using different selection criteria (i.e., employment or sales) would result in
different firms being chosen. Their study found that as proposed, different firms qualified
as high-growth based upon the definitions used. Additionally, it was found that
definitions matter in cohort selections. Similarly, practitioner investigation by Piazza,
Austrian, Lendel, Alexander, Cyran, Hoover, and Leach (2016) reinforced this concept,
replicating ten HGF definitions from the literature, and determined that definitions do
matter; how HGFs are classified and defined will drastically impact the number of firms
contained in the cohort. Daunfeldt, Elert, and Johansson (2014) examined whether or not
policy implications depend upon the growth indicator chosen by examining firms that
grew by employment versus productivity. Their study concluded that different high-
growth HGFs were identified using employment versus productivity. Additionally, their
study found that young firms are more likely to be high-growth no matter the definition.
To alleviate measurement burdens from earlier studies, Delmar, et al. (2003)
looked to determine the demographic characteristics of high-growth firms using
administrative data. The authors performed a cluster analysis of Swedish high-growth
firms from 1987 to 1996, yielding a seven-cluster solution. Firms were categorized as
Super Absolute Growers, firms that displayed high absolute growth9 in employment and
sales (a definition of high-growth firms); Steady Sales Growers, firms that had a strong
development in absolute sales, but negative development in employment, which indicates
this cluster is predominately large firms; Acquisition Growers, firms that displayed
9 Absolute growth refers to the total growth in the number of employees or sales.

85
growth in absolute sales and total employment, but were negative in organic employment,
which implies that growth was through mergers and acquisitions; Super Relative
Growers, the cluster that had the highest growth in comparable firms and the highest
share of growth years, which along with Super Absolute Growers, showed consistent
signs of acting as high-growth firms; Erratic One-Shot Growers, firms that displayed a
negative development in absolute sales and employment, substantial one-time increases,
and high standard deviation in sales; Employment Growers, firms that had employment
growth higher than their sales growth; and finally, Steady Overall Growers, firms that
had strong development in absolute sales and employment growth. Overall, this research
shows that firm growth is multidimensional and heterogeneous. Recent studies have
examined this also.
Coad, Cowling, and Siepel (2017) use Structural Vector Autoregressions to
identify how firms grow and seek to determine the “distinct causal relationships between
different growth indicators.” (p. 538) Using data from the United Kingdom, they sought
to explain the causal relationship between sales, employment, profits, and assets. In the
population of firms, they found that employment growth initiates the firm’s growth,
followed by sales. In HGFs, profits are the initiator of growth to other variables,
including a positive causal effect on sales and assets. Thus, indicating that HGFs that
have profit growth end up reducing their employment growth, and firms do not
necessarily put profits back into the business. Shepherd and Wicklund (2009) tracked
Swedish firms from 1994 to 1998 to assess the timeline and method of firm growth.
Assessing the Pearson product-moment correlations of different measures of firm growth
with the age of the firm, they find that absolute employee growth, relative employee

86
growth, and absolute sales growth have high or moderate concurrent validity. These
findings indicate that some measures of growth can substitute for each other when
discussing firm growth.
As Demir, Wenneberg, & McKelvie (2017) point out there are three main reasons
for the fragmented nature and assessment of HGFs throughout the literature. They point
to 1) inconsistent measures to quantify high-growth, 2) the brief nature of growth, and 3)
challenges in determining what strategies are needed for high-growth. Establishing
typologies and common constructs within the literature are essential in theory building.
As previously noted, the clusters and dimensions identified by Siegel et al. (1993) and
Delmar, et al. (2003) show that even though these firms are all classified as high-growth,
they have vastly different characteristics. To date, there has not been a uniform
typological investigation of HGFs in the United States. This study seeks to fill this gap by
identifying a typology of high-growth firms in Ohio.10
Research Design and Data
Scholars create and develop typologies to understand complex systems, develop
theories, and understand the cause-effect relationships within a system (Doty & Glick,
1994; Fiss, 2011). Some scholars have criticized the use of typologies as methods of
classification, rather than theory building (McKelvey, 1982; Rich, 1992). However Doty
and Glick (1994) argue that typologies should not just be ideas organized into a structure,
rather “typologies are complex theoretical statement that should be subjected to
quantitative modeling and rigorous empirical testing.” (p. 231). This paper expands the
10 Due to data limitations, the study area is limited to the state of Ohio. However, the state of Ohio has
consistently been representative of the United States due to its large manufacturing and service sectors.

87
use of typologies in the context of HGFs to assess the mechanisms of growth within
HGFs in the state of Ohio to overcome the deviancies suggested by Doty and Glick. The
multidisciplinary nature of this analysis seeks to meld the management literature with the
economic development and regional economics literatures.
Ketchen & Shook (1996) evaluate the use of cluster analysis within the strategic
management literature and found that cluster analysis by itself can call into question the
validity of the results since the technique relies on the judgment of researchers to
establish the cluster cutoffs. These scholars suggest implementing cluster analysis in
conjunction with other statistical methods to establish validity and test theoretical models.
The current study used cluster-discriminate analysis pioneered by Hill, Brennan, and
Wolman (1998), and Hill and Brennen (2000) to overcome validity issues solely using
cluster analysis as the classification method.
Cluster analysis is a multivariate technique that seeks to group objects based upon
characteristics and can be used for taxonomy description, data reduction, and relationship
identification (Hair, et al., 2006). This study employs hierarchical cluster analysis (HCA)
to establish relationships between multivariate data points. HCA produces non-
overlapping clusters that are nested in nature and is a helpful data reduction technique
when attempting to classify large datasets into a hierarchical structure or typology. HCA
clusters on the squared Euclidean distances between similar observations. Ward’s method
of cluster observations was used to assemble homogeneous groups by seeking to
minimize the variance within clusters (Aldenderfer & Blashfield, 1984; Ward, 1963).
Discriminate analysis that uses these clusters as a priori groupings assists our economic
understanding of the clusters by testing group differences statistically. In short, cluster

88
analysis provides a set of homogenous groups, and discriminant analysis informs why the
observations group together.
Quarterly Census of Employment and Wages (QCEW) microdata was employed
for this analysis. The Center for Economic Development at Cleveland State University
maintains a file of QCEW microdata under a contract with the Ohio Department of Job
and Family Services (ODJFS).11 QCEW is derived from state unemployment insurance
(UI) tax records and has information on employment and wages at the establishment
level. The data contains information on the name of the business, its address, industry
classification, Employer Identification Number (the number assigned by the U.S. Internal
revenue service for tax purposes), UI and reporting unit number (assigned by each state
in the United States). Due to data availability and confidentiality restrictions, this analysis
could only be performed for the state of Ohio.
The unit of analysis is the quasi-firm. As defined by the U.S. Bureau of Labor
Statistics (2012), a firm is a “legal business, either corporate or otherwise, and may
consist of one establishment, a few establishments, or even a very large number of
establishments.” There is an essential distinction between a firm and an establishment.
An establishment is an individual worksite where commerce takes place; an
establishment can also be a firm. Only the data from the state of Ohio was used for the
current study since the researcher only had access to this state and it represents the
universe of all business from which the cohort was created. All data were summed to the
unit of the firm within the state of Ohio; therefore, the unit was conceptualized as a quasi-
firm.
11 ODJFS approved the use of QCEW microdata for the use in this dissertation research

89
This research concentrates on post-recession Ohio and examines quasi-firms from
2010 to 2015. The National Bureau of Economic Research announced that the most
recent U.S. recession ended in June 2009; however, the recovery in Ohio took much
longer due to the state’s dependence on manufacturing and almost total shut-down of all
local auto manufacturing (Bello, 2009; Hirsch, 2014; Kavanagh, 2008; National Bureau
of Economic Research, 2010).
Following the study of Delmar et. al. (2003) to establish a universal database of
firms, three qualifiers were placed on the model: 1) only private sector employment, 2)
all non-zero employers, and 3) firms had at least twenty employees in the end year. Then
in order to qualify as high-growth, firms must be in the top 10 percent of all firms in one
or more of the following areas for the initial year (2010): 1) Absolute Total Employment
Growth - annual change in numbers of employees or monetary units; 2) Absolute Organic
Employment Growth; 3) Absolute Payroll Growth; 4) Relative Total Employment
Growth - annual percentage change in employees or sales; 5) Relative Organic
Employment Growth; or 6) Relative Payroll Growth. These qualifiers are consistent with
the overall literature that consistently sets an employment qualifier on HGF cohorts
(Piazza et al., 2016).
This study replicated the eighteen variables used in the Delmar, et al. (2003) study
(pp. 200-203).12 Table V describes the variables used for this analysis.13 Variables 1a-f
examined the overall growth rate of the firm in both absolute and percentage terms. The
variety of growth measures used in the analysis sought to identify or delineate any firm
12 The Delmar, et. al. (2003) study used 19 different variables to perform its cluster analysis. One variable,
regularity of growth via organic growth could not be computed using the QCEW data and was excluded. 13 Payroll was proxied for sales due to data availability.

90
growth patterns between using absolute growth (which has been suggested to inflate large
firms) and relative growth (which has suggested to inflate smaller firms) (Coad, et al.,
2014; Nightingale & Coad, 2013). Categories 2-5 sought to examine the frequency of
growth of firms. Category 2 investigated the relative number of growth and high-growth
years of the firm, seeking to determine if firms have multi-year growth or high-growth.
Category 3 inspected the standard deviation of growth to identify the overall dispersion
of growth via the change in employment and payroll; the larger the number, the more
volatility the firm had year-to-year in its growth. Category 4 examined the regularity of
growth so the number of years a firm experiences high-growth or growth; this can attest
to the consecutive years of growth by a firm. Category 5 considered growth in relation to
the maximum size of the firm; calling this variable “one-shot growth.” Lastly, Category 6
sought to identify different types of growth either through employment or sales, or vice
versa.
Cluster and discriminate analysis are sensitive to outliers (Aldenderfer &
Blashfield, 1984). Therefore each 5 percent tail of every variable was analyzed to assess
outliers. In all, sixteen firms were removed from the dataset, resulting in 26,104 HGFs for
this analysis. Also, all the data entered into the model was entered as a z-score for each
firm to scale the data from 0 to 1.
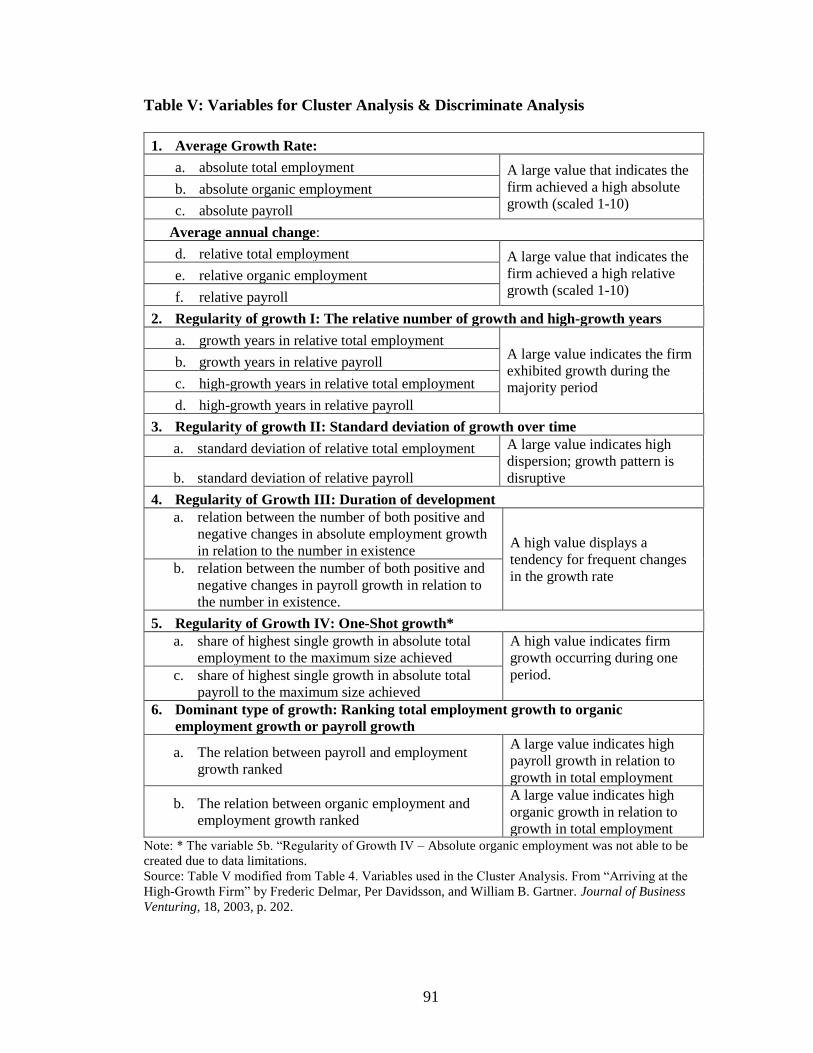
91
Table V: Variables for Cluster Analysis & Discriminate Analysis
1. Average Growth Rate:
a. absolute total employment A large value that indicates the
firm achieved a high absolute
growth (scaled 1-10) b. absolute organic employment
c. absolute payroll
Average annual change:
d. relative total employment A large value that indicates the
firm achieved a high relative
growth (scaled 1-10) e. relative organic employment
f. relative payroll
2. Regularity of growth I: The relative number of growth and high-growth years
a. growth years in relative total employment A large value indicates the firm
exhibited growth during the
majority period
b. growth years in relative payroll
c. high-growth years in relative total employment
d. high-growth years in relative payroll
3. Regularity of growth II: Standard deviation of growth over time
a. standard deviation of relative total employment A large value indicates high
dispersion; growth pattern is
disruptive b. standard deviation of relative payroll
4. Regularity of Growth III: Duration of development
a. relation between the number of both positive and
negative changes in absolute employment growth
in relation to the number in existence A high value displays a
tendency for frequent changes
in the growth rate b. relation between the number of both positive and
negative changes in payroll growth in relation to
the number in existence.
5. Regularity of Growth IV: One-Shot growth*
a. share of highest single growth in absolute total
employment to the maximum size achieved
A high value indicates firm
growth occurring during one
period. c. share of highest single growth in absolute total
payroll to the maximum size achieved
6. Dominant type of growth: Ranking total employment growth to organic
employment growth or payroll growth
a. The relation between payroll and employment
growth ranked
A large value indicates high
payroll growth in relation to
growth in total employment
b. The relation between organic employment and
employment growth ranked
A large value indicates high
organic growth in relation to
growth in total employment Note: * The variable 5b. “Regularity of Growth IV – Absolute organic employment was not able to be
created due to data limitations.
Source: Table V modified from Table 4. Variables used in the Cluster Analysis. From “Arriving at the
High-Growth Firm” by Frederic Delmar, Per Davidsson, and William B. Gartner. Journal of Business
Venturing, 18, 2003, p. 202.

92
Results
Cluster Identification
Cluster analysis is a methodology that groups like entities in stages, but this
technique does not indicate an optimal cluster. This paper investigates the agglomeration
coefficients to identify clusters to avoid “researcher judgment” bias in selecting a cluster
solution (Everitt, 1993; Hill & Brennen, 2000; Ketchen & Shook, 1996). The
agglomeration coefficient is the sum of the within-group variance combined at each stage
of clustering. The cluster solution decision rule indicates that “when there is a marked
increase in the agglomeration coefficient, the previous stage of the cluster solution is a
candidate solution.” (Hill & Brennan, 2000, p. 73). Table VI displays components of the
agglomeration schedule of the cluster analysis at each stage of clustering.14 The first
column displays the number of clusters created by SPSS, the second column shows the
step of clustering (n=26,104), the third column displays the slope of the agglomeration
coefficient,15 and the last column marks the acceleration.16
14 The agglomeration coefficients are not displayed in this table due to confidentiality restrictions. 15 The slope is the percentage change in the agglomeration coefficient, indicating the second moment of the
agglomeration schedule. 16 Acceleration is measured as the percentage change of the slope, indicating the third moment of the
agglomeration schedule.

93
Table VI: Hierarchal Cluster Analysis Agglomeration Schedule
Number of
Clusters
Stage of the
Clustering
Procedure
Slope: %
Change of
Agglomeration
Coefficient
Acceleration:
% Change of
Slope
9 26,095 5.423 1.554
8 26,096 5.448 0.467
7 26,097 5.918 8.622
6 26,098 6.946 17.374
5 26,099 7.942 14.339
4 26,100 9.773 23.046
3 26,101 10.285 5.239
2 26,102 13.199 28.334
1 26,103 15.879 20.310
There are three candidate solutions to the cluster analysis: 8-cluster, 5-cluster, and
3-cluster solution. These are all indicated by increases in the agglomeration coefficients,
substantial changes in the slope, and acceleration. Using the combined outputs of both the
cluster and discriminate analysis the appropriate cluster solution is chosen. Figure VI
illustrates the 8-cluster, 5-cluster, and 3-cluster solutions in a cluster map showing the
nested nature of HCA. The 8-cluster HGF types cluster into the three primary HGF
categories. For example, Volatile Survivors in the 8-cluster solution join with other
clusters to form the Low and Steady Growth HGF cluster. The hit-ratio statistics from the
discriminate analysis, which indicate the percentage of firms classified correctly in the
discriminate analysis, are marginally different from the 5- to 8-cluster solution (88.8%
versus 88.4%). The 8-cluster solution produces unequal group sizes, some of which have
a small number of firms within the cluster, potentially causing a confidentiality issue in

94
Figure VI: Cluster Map
Source: Quarterly Census of Employment and Wages; The Center for Economic Development

95
the data in further discussions in this study. Consequently, cluster #7 (High, volatile
employment growers) and cluster #8 (High, volatile payroll growers) are aggregated
together for discriminate and industrial analysis in subsequent sections of this paper.
Discriminant Analysis: Interpreting Cluster Analysis
The discriminate analysis results in several important outputs to help examine the
model, including the functions’ performance within the model. Box’s M is a null
hypothesis test of homogeneity in the discriminate analysis, testing the equality of
covariance/variance matrices. The equality of these matrices is an underlying assumption
of conducting a discriminate analysis. For the current discriminate analysis, the Box’s M
is significant, indicating that there is no difference in covariance/variance matrices.
Hakstian, Roed, and Lind (1979) indicated that if Box’s M is significant, unequal groups
exist, and if large variances are linked with smaller samples, then robustness of the test is
not guaranteed. Thus, since this analysis involves a large population (N=26,104) Box’s M
can be too strict of a test for large samples sizes, as Box’s M Test is susceptible to
departures from normality (Tabachnick & Fidell, 2007). The overall dataset for this
research multivariate is normal, based upon testing for skewness, kurtosis, and
multivariate normality. Since larger sample sizes and unequal groups possess greater
variances and covariance than groups with smaller samples size, it is still reasonable to
reject the null hypotheses (Tabachnick & Fidell, 2007). The use of Pallai’s trace is
acceptable if Box’s M is significant and group sizes are unequal (Warner, 2008). The
Pallai’s trace test for these discriminate functions is significant at the 99% level (p<.01),
indicating that the null hypothesis can be rejected, that there is a difference between the
groups.

96
The decisive step in examining the cluster-discriminate analysis is to identify the
variables that contribute to each function. The Wilk’s Lambda, indicating the statistical
significance of the discriminate functions, is statistically significant at the 99% level
(<.001). Table VII displays the variables that contribute the most to each function, their
correlation to the function, as well as the overall amount of variance each function
explains (in bold).
High-Grower (Function 1): Function 1 (High-grower) overall explains 35.3
percent of the variance in the overall model. The variables that have the highest
correlation to this function are the two variables that examined the regularity of growth
through the relative number of high-growth years of firms via employment and payroll.
The strong positive correlation between these variables indicates that firms exhibited
high-growth through most of the study period (2010 to 2015). These results intuitively
hold based upon the phenomenon of HGFs to have consistent high-growth. Both high-
growth years in employment and payroll are correlated with Function 1, indicating that
the mechanism of growth (employment or payroll) is inconsequential to their high-
growth performance.
Volatile Grower (Function 2): Function 2 (Volatile Grower) explains 26.4 percent
of the overall model variance, and the two variables that have the highest correlation to
the function are those that examine the volatility of growth of firms. The variables that
measure the volatility are payroll growth, which has the highest correlation to Function 2
at 79.1 percent, and employment volatility, at 41.3 percent. Overall, this variable
measures the relationship between positive and negative changes in employment for the

97
years the firm is in existence, indicating that HGFs grow and contract at a higher rate
than in HGFs.
Low, steady grower (Function 3): Function 3 (Low, Steady grower) explains 19.9
percent of variance to the model, and all variables are strongly negatively correlated with
it; indicating an inverse relationship with these variables and the function. The standard
deviation of relative total employment has the highest correlation to the function (-.521),
but the negative association suggests that this function is described by firms that have
minimal dispersion in the percentage change of employment. The negative correlation of
the variable Share of highest single growth in absolute total employment to the maximum
size achieved (-.520) also indicates that this function is described by growth over many
periods of time, not just one. Both annual change in relative total and organic
employment are negatively correlated with Function 3 (-.478 and -.477, respectively),
signifying that this function describes low relative growth year-to-year.
Consistent Grower (Function 4): Function 4 (Consistent grower) explains 11.7
percent of total variance and has two variables that describe the function. The variables
that are highly correlated with this function are both growth years in relative payroll
(.641) and in total employment (.568). If Function 1 describes the phenomenon of high-
growth, Function 4 describes consistent growth, but not necessarily high-growth.
High-absolute grower (Function 5): Function 5 (High-absolute grower) explains
6.2 percent of total variance and is represented by variables that measure absolute growth
in level terms. The three variables of the average growth rate of absolute total
employment (.814), absolute organic employment growth (.708) and absolute payroll
(.755) indicate those firms with the most substantial changes. These three variables all
98
suggest that this function describes large growing firms since absolute changes in
employment and payroll are associated with larger employers (Coad, et al., 2014).
Growth related to the core business (Function 6): Function 6 explains less than 1
percent (0.6%) of the variance in this model. The two variables that are weakly correlated
with this function are those that rank employment growth for other variables (payroll and
organic employment). This ranking seeks to examine if the firm grows in dominate type
of way that is related to the core of their business function.

99
Table VII: Correlations between the Discriminating Variables and the Discriminate
Functions
Functions Correlation
Coefficient
Function 1: High-grower 35.3
High-growth years in relative total employment .632
High-growth years in relative payroll .607
Function 2: Volatile Grower 26.4
Relation between the number of both positive and negative
changes in payroll growth in relation to the number in existence.
.791
Relation between the number of both positive and negative
changes in absolute employment growth in relation to the
number in existence
.413
Function 3: Low, steady grower 19.9
Standard deviation of relative total employment -.521
Share of highest single growth in absolute total employment to
the maximum size achieved
-.520
Average Annual Change: relative total employment -.478
Average Annual Change: relative organic employment -.477
Function 4: Consistent grower 11.7
Growth years in relative payroll .641
Growth years in total employment .568
Function 5: High-absolute grower 6.2
Average Growth Rate: absolute total employment .814
Average Growth Rate: absolute organic employment .708
Average Growth Rate: absolute payroll .755
Function 6: Growth related to core business 0.6
The relation between payroll and employment growth ranked .443
The relation between organic employment and employment
growth ranked
.325
Note: Percentage of total variance explained for each function displayed in bold

100
Table VIII presents the group centroids for each dependent variable group
(clusters) and the six discriminate functions. Group centroids are the average predicted
values for each discriminate score for each cluster group and can aid in understanding the
relationship between the functions and clusters. A two-tailed T-test is used to determine if
each group’s centroid is statistically significant. Only five of the functions have a
statistically significant relationship with any of the seven cluster groupings.
Table VIII: Dependent Variable Group Means for each Discriminant Function
Cluster Group Function
High-
grower
Volatile
Grower
Low,
steady
grower
Consistent
grower
High-
absolute
grower
Growth-
related
to core
business
Survivors 0.038 -1.630 -0.556 0.059 0.101 -0.159
Volatile Survivors -1.254 -0.177 -1.107 -1.370 0.110 0.399
Large Modest growers -1.266 1.828* 0.107 -0.085 -0.033 -0.160
Small Modest growers 0.146 -0.056 0.637 1.505 -0.489 0.218
Single-unit, one-shot growers 3.272*** 0.288 1.783* -1.312 -0.348 -0.007
Multi-unit, one-shot growers 1.442 0.789 1.876* 1.125 4.583*** 0.199
High, volatile growers 13.730*** 7.397*** -12.900*** 2.341*** 0.170 0.025
Note: *** is the 99.0 percent confidence interval (2.57 critical value); ** is the 95.0 percent confidence
interval (1.96 critical value); *is the 90.0 percent confidence interval (1.65 critical value)

101
Description of HGFs: Growth Survivors
Survivors (N=8,221) are the largest cluster grouping in this analysis, accounting
for more than 30 percent of the firms in this analysis, and describe firms that solely
qualified as HGFs based upon cohort selection.17 After these firms were selected for the
cohort analysis, they showed very little positive change in employment or payroll to mark
them as growers, let alone as HGFs. The cluster displayed limited growth in employment
and payroll and low volatility. None of the high-growth functions from the discriminate
analysis were statistically associated with this cluster. The industrial composition of this
cluster is mostly service-providing firms (N=6,166) (Table IX). These firms would not be
classified as HGFs in the traditional understanding of “high-growth.”
Volatile Survivors (N=3,129) are within a similar cluster tree of Survivors, but
this cluster shows more volatility in its growth than solely cluster #1 (Survivor). This
cluster can be described by firms that, like Survivor, qualified as HGF in their first year
and then just managed not to close businesses. Beyond their Survivor siblings, this cluster
saw negative annual changes in employment and payroll after qualifying for the HGF
cohort analysis and high volatility in payroll and employment growth. None of the high-
growth functions from the discriminate analysis were statistically significant to this
cluster. These firms were mostly composed of service-providing business (Table IX).
This cluster of firms would not be characterized as HGFs.
17 To qualify has a HGF for this study firms must have been in the top 10% of all firms in one or more of
the following areas: 1)Absolute Total Employment Growth - annual change in numbers of employees or
monetary units; 2) Absolute Organic Employment Growth; 3) Absolute Payroll Growth; 4) Relative Total
Employment Growth - annual percentage change in employees or payroll; 5) Relative Organic Employment
Growth; or 6) Relative Payroll Growth.

102
Large Modest Growers (N=6,649) are the second-largest cluster grouping,
representing one-quarter of firms in this analysis (25.5 percent), and can be characterized
by larger firms that showed small to model growth from 2010 to 2015. This grouping is
weakly positively associated (at the 90 percent level) with Function 2 (Volatile Grower),
indicating that these firms grew and contracted. More than one-third of this cluster (76.6
percent) were service-providing firms. These firms would not be classified as HGFs.
Small Modest Growers (N=4,739) are the third-largest cluster grouping in this
study, consisting of 18.2 percent of the HGF population. This cluster is distinguished by
single-unit employers18 that have small to modest growth. None of the high-growth
functions from the discriminate analysis were statistically associated, and 71.8 percent
were service-providing businesses; this cluster would not be classified as “high-growth.”
Description of HGFs: Traditional HGFs
Single-unit, One-Shot Growers (N=2,746) is a consistent cluster that maintains its
grouping from 3-cluster solution to 5-cluster solution and splitting off into single-unit,
one-shot growers in the 8-cluster solution. This cluster is characterized by single-unit
firms with moderate employment growth. Also, this cluster experiences some volatility in
its growth trajectory. Function 1 (High-Grower Function) was positively statistically
significant with this cluster at the 99% (p<.001) level, indicating that this cluster achieved
high-growth over multiple years in growth or payroll. Function 3 (Low, steady grower)
was positively statistically significant at the 90% (p<.10), indicating that these firms saw
a low annual change in relative employment and had a small standard deviation in
18 The QCEW database distinguished between single-unit employers and multi-unit employers. Single-unit
employers are businesses that only have one location, while multi-unit employers have more than one
location.

103
employment. Although these firms had low, steady growth, they did see growth for a
bulk of years in the cohort (2010 to 2015). These firms would be classified as “high-
growth” under the traditional understanding of a HGF.
Multi-unit, one-shot growers (N=501) is the second-smallest cluster in the cohort
representing just 1.9 percent of all HGFs in the cohort. Firms in this cluster are
characterized by having multiple worksites for one firm and seeing employment growth
in a single time period. Function 4 (High-Absolute Grower) was positively statistically
significant with this cluster at the 99% (p<.001) level, indicating that this cluster had
large changes in total employment, organic employment, and payroll, which is indicative
of large, multi-location employers. Moreover, Function 3 (Low, steady grower) was
positively statistically significant at the 90% (p<.10), demonstrating a small dispersion in
relative employment. These firms would be classified as “high-growth” under the
traditional understanding of a HGF, but with the understanding that these are expansion
businesses within a corporate structure.
High, volatile growers (N=119) is the smallest cluster, consisting of less than 1
percent of the HGF cohort (0.46 percent). These firms have large absolute and relative
employment and sales growth, and volatility in employment and payroll growth. Function
1 (High-Grower Function) was positively statistically significant with this cluster at the
99% (p<.001) and a group centroid of 13.730, representing a high level of significance.
Function 1 shows that this cluster achieved high-growth over multiple years in growth or
payroll. This grouping was negatively statistically associated with Function 3 (Low,
steady grower) at the 99% (p<.001) and a group centroid of -12.900, representing a high
level of significance. Function 3 indicates steady growth, but since this cluster had a

104
negative association with the function, this indicates that these firms grew rapidly
quickly; which is also consistent with the positive association with Function 2 (Volatile
Grower) and Function 4 (Consistent Grower). These firms would be considered by
traditional academic and Practioner literature as pure-HGFs; this is the only cluster that
would qualify under these definitions.
Industrial Patterns of HGFs
Understanding the type of growth of a HGF is only one part of the story: By
looking at the industrial structure of HGFs, one can determine if there are external factors
to the business that can contribute to their success (i.e., competitive advantage, industrial
makeup, and agglomeration). Table IX displays HGF counts by industry grouping, HGF
counts by cluster grouping, and HGF counts by cluster and industry grouping.19
It is important to understand first the underlying structure of HGF counts by
industry to see if HGFs behave and a different manner in aggregate than all firms in the
economy. The first column in Table IX displays the total count of HGFs, no matter their
cluster, within grouped industries. The interesting finding from this column reveals the
percentage of HGFs per industry grouping is like that of the percentage of establishments
and employment in the state of Ohio by industry (Appendix Table I). These results
indicate that overall aggregate of HGFs, irrespective of cluster, shows that same
industrial makeup as all firms in the state of Ohio.
A Pearson Chi-Square analysis (χ2) was run on the association between HGF
cluster totals by industry grouping (Table IX) and industry groupings for all
establishments in the state of Ohio (Appendix Table I). χ2 examines the observations
19 Industries were aggregated at the 2-digit NAICS level due to confidentiality restrictions.

105
between two variables with the expected observations if the relationship between them
were random (O’Sullivan & Rassel, 1999). The χ2 between these two variables is not
significant indicating that there is no difference between these groups, showing that the
overall industry dispersion of HGFs and all firms in the state of Ohio are the same.
Examining HGF counts by cluster, especially by Survivors (Clusters 1 to 4) and
High-growth clusters, shows a different story than HGFs in aggregate. Survivor clusters
(#1-4) show the same industrial patterns as non-HGFs in the economy, indicating one-
sixth of the cohort is divided somewhat equally in four groupings, while Natural
Resources, Mining, and Constructing represents 5 percent to 10 percent of HGF counts.
For example, the Volatile Survivors (Cluster 2) reported roughly 18 percent to 20 percent
in all industry groupings, except manufacturing (15 percent) and natural resources,
mining, and construction (6 percent). This pattern is consistent with all of the Survivor
Clusters (#1-4).
The High-growth clusters (Clusters 5 to 7), on the other hand, show different
industrial patterns with roughly 30 percent of HGFs in Information, Financial Activities,
and Professional and Business services, and a lower percentage in Education and Health
Services. This industrial composition is indicative of those industries (Information,
Financial Activities, and Professional and Business services), which are export-orientated
versus population-serving industries (Education and Health Care Services) (Porter, 2003;
Tiebout, 1956). Export-orientated industries are important for regional and state growth
since the population is fixed (and in the state of Ohio declining), therefore for firms to
increase growth they have to find new markets exogenous to the region or state.

106
Table IX: HGFs by Industry Grouping
Industry
Grouping20 TOTAL
Custer Group
Survivors
(#1)
Volatile
Survivors
(#2)
Large Modest
Growers (#3)
Small Modest
Growers (#4)
Single-unit,
One-shot
Growers (#5)
Multi-unit,
One-shot
Growers (#6)
High, volatile
Growers (#7)
Count % Count % Count % Count % Count % Count % Count % Count %
Natural Resources
& Mining;
Construction
2,024 8% 561 7% 179 6% 506 8% 336 7% 413 15% 15 3% 14 12%
Manufacturing 4,506 17% 1,494 18% 478 15% 1,049 16% 1,000 21% 368 13% 108 22% 9 8%
Trade,
Transportation, &
Utilities
5,178 20% 1,535 19% 558 18% 1,378 21% 1,078 23% 512 19% 97 19% 20 17%
Information; Fin.
Activities; Prof. &
Bus. Services
5,147 20% 1,410 17% 694 22% 1,205 18% 859 18% 771 28% 171 34% 37 31%
Education &
Health Services 4,088 16% 1,313 16% 645 21% 1,096 17% 602 13% 350 13% 68 14% 14 12%
Leisure &
Hospitality; Other 5,161 20% 1,908 23% 575 18% 1,415 21% 864 18% 332 12% 42 8% 25 21%
TOTAL 26,104 100% 8,221 100% 3,129 100% 6,649 100% 4,739 100% 2,746 100% 501 100% 119 100%
Source: Quarterly Census of Employment and Wages; The Center for Economic Development
20 Natural Resources and Mining & Construction (NAICS 11, 21, 23); Manufacturing (NAICS 31-33); Trade, Transportation, and Utilities (NAICS 42, 44-45,
48-49, 22; Information, Financial Activities & Professional and Bus. Services (NAICS 51-56); Education and Health Services (NAICS 61-62); and Leisure and
Hospitality & Other (NAICS 71-72, 81).

107
The High-growth clusters industrial composition is consistent with the national
analysis by Clayton, et al. (2013) and the examination of HGFs in Georgia by Choi, et al.
(2013). Clayton, et al. (2013) found that of their nationwide cohort of HGFs, 46.2 percent
was in construction; professional, scientific, and technical services; health care and social
assistance; and accommodation and food services. Choi, et al. (2013) found the highest
industry shares of HGFs in Georgia from 2006 to 2009 were in construction, professional
services, healthcare, retail, manufacturing, and wholesale trade. The comparisons from
these two studies show that the Ohio case study of HGFs is not unusual and does not go
against the established trend in the literature. Moreover, this study reiterates that even
regional variation of HGFs is similar.
As discussed, recent literature has pointed to the fact that HGFs are not in the
high-technology sector, and research also looked to explore the composition of high-
technology industries and HGFs. Table X displays the count of HGFs classified as high-
technology based upon Hecker (2005).21 Only 2,576 firms qualified as high-technology,
representing just 9.9 percent of all HGFs in this cohort. More than 83 percent were
classified in the Survivor clusters (Clusters 1 to 4). This reinforces that, in the Ohio
experience, high-technology firms cannot be classified as HGFs in this study, which is
reinforced in the literature by Daunfeldt, et al. (2016) from their examination of HT-
HGFs in Sweden.
21 Hecker identifies 44 high-technology North American Industry Classification System (NAICS) industries
through an investigation of high-technology occupations cross walking them to industries. These 44
industries are listed in Appendix Table II. NAICS codes were based upon the 2102 update.

108
Table X: High-Tech HGFs by Cluster Grouping
High-Growth Category Number of
HT-HGFs % within HT % of all HGFs
Survivors (Clusters 1-4) 2,137 83.0% 8.2%
HGFs (Clusters 5-7) 439 17.0% 1.7%
TOTAL 2,576 100.0% 9.9%
Source: Quarterly Census of Employment and Wages; The Center for Economic Development
Discussion and Conclusion
This paper investigated the typology of high-growth firms using a variety of
growth measures and characteristics to examine how and why HGFs grow, and how this
growth is heterogeneous. Through cluster-discriminate analysis, a small portion (3,366 of
26,104) of HGFs that were in the cohort could justly be categorized as “high-growth.”
The remainder of these firms were termed Survivors, which are firms that can be
classified as high-growth and, although in the top 10 percent of all firms in one or of six
growth categories,22 displayed no growth after being put into the cohort, merely
surviving. HGFs should be coined “ghosts” rather than “gazelles” for their lack of
appearance, but they consistently haunt economic development practitioners.
The findings of this study were consistent with Nightingale and Coad (2014), who
recognized that most startups end up being slow-growth firms rather than HGFs.
Furthermore, the authors describe the most typical scenario for entrepreneurs as hard-
working individuals who use their savings to start a restaurant in a competitive market,
and if the business is around in a few years, then it only has displaced a similar firm in
22 1) Absolute Total Employment Growth - annual change in numbers of employees or monetary units; 2)
Absolute Organic Employment Growth; 3) Absolute Payroll Growth; 4) Relative Total Employment
Growth - annual percentage change in employees or sales; 5) Relative Organic Employment Growth; or 6)
Relative Payroll Growth
109
the market. Many of these firms create and destroy jobs in the economy but serve as
pecuniary benefits to the owners (Hurst & Pugsley, 2011).
This study supports that there is more than one path to high-growth, with HGFs
growing over multiple years, or in a single spurt that can sustain them for a while.
Additionally, the current study found, economic development facilitates transactions for
all types of business relocation and expansion but does not consider facilitating mergers
or buyouts as a component of its function. Young, Hood, and Peters (1994) explored the
idea that multinational corporations (MNC) could open subsidiaries in regions furthering
regional cluster development and competitive advantage. Based upon findings of this
paper, the Multi-unit, One-shot Growers cluster (Cluster #6), which was considered a
high-growth cluster, was composed mostly of large firms, and fostering of mergers within
these firms could further growth and foster competitive advantages to increase innovation
and productivity. This study shows economic development practitioners that it is
important to know what businesses are in an economic development service area and
going door-to-door to understand their needs to help each business grow and stay
competitive is essential. This high-touch approach to economic development is the
current practice and is the behavior in which most economic development practitioners
excel. Continuing this type of behavior is not just economic development practice but
creates positive economics for the region.
The industry composition of firms categorized as High-Growth reveals that most
of these firms are in professional and business services, which is consistent with the
literature. Also, the result of the examination of HGFs within HT industries indicates that
most of these firms are in the Survivor clusters and not in High-Growth clusters, which is

110
also consistent with the literature. This analysis was based upon examining those forty-
four HT industry codes (NAICS), which were categorized as HT by Hecker (2005). This
study shows that HT, as categorized by Hecker, does not facilitate HGFs. One reason for
this finding is that technology is a fast-moving industry that has traditionally not been
able to be captured adequately through government statistics (Feldman & Lendel, 2010).
The Ohio Third Frontier (OTF), a technology-based economic development program in
the state of Ohio, bases its funding on technology streams under the idea that “a high-
performing innovation network creates and sustains high-wage jobs, and that the state [of
Ohio] must not only expand its innovation potential but also convert these ideas into new
products.” (Austrian & Auerbach, p. 168). Moving away from industries into technology
streams allows for more flexibility in industry and product in more of a model that
business would employ rather than the government.
This paper shows the incongruence of economic development policy to foster
HGFs and the actual number of opportunities in the market for these firms to exist.
Dennis (2011) indicates that the basic issue for policymakers is jobs, since “policymakers
need jobs; smaller firms produce jobs; thus, small business remains a central focus for
many policymakers” (p. 92). This study did not examine the growth of these firms in
employment terms; it cannot directly disprove Birch and Medoff’s (1994) findings that
HGFs disproportionately contribute to overall job growth. However, the false importance
practitioners place on fostering HGFs can be noted as a result of the current study.
The findings that most firms, and even HGFs, are not “high-growth” have
important implications for economic development practice. According to Holzl (2013),
selectively picking “winners” based upon industries or technologies is not a wise strategy

111
because growth is difficult and rarely persistent. However, choosing to invest in creating
more entrepreneurs through teaching entrepreneurship and fostering an entrepreneurial
mindset can create an ecosystem that fosters job churning.
There is robust management literature (Davis, Hall, & Mayer, 2016; Rauch &
Frese, 2007) that seeks to identify and foster an entrepreneurial mindset (EM) in
individuals. Exploring economic development opportunities that align with fostering EM
in individuals can harness the capacity that lies in many people to be entrepreneurs.
Davis, et al. (2016) constructed an entrepreneurial mindset profile (EMP) to identify
adequately individuals who have EM but also identified ways to help foster EM through
traits and skills. These authors show that organizations and businesses can foster EM by
identifying these traits and helping employees overcome weakness or funnel them into
professions that suit their talents.
When economic development practitioners seek to create the next Silicon Valley,
the output they are looking for is more jobs, but the process is more complicated, as it
involves the creation of a regional culture that is not averse to the risk of starting a
business. By focusing HGFs’ creation on the inputs of these firms, entrepreneurs, and
managers, rather than just the creation of jobs, it takes a human capital approach to
economic development (Mathur, 1999). Encouraging entrepreneurship and an EM
enhances the spillovers from entrepreneurs and non-entrepreneurs. This human capital
approach then teaches individuals to become more an agent of their density and adverse
to risk and therefore increasing prosperity through increased productivity. This proactive
approach to fostering EM should move away from the reactive approach of picking
winners, selecting industries, and looking for those ghosts.

112
CHAPTER V
CONCLUSION
The research in this dissertation is located at the intersection of regional science,
economics, businesses, and management literatures examining high-growth firms
(HGFs). This process included identifying the antecedents and outcomes of HGFs,
identifying the relationship between these elements, testing these elements statistically,
and examining the different growth patterns of HGFs. This chapter examines how this
dissertation contributes to the current literature while examining the future directions of
study based on the results contained within it. Specifically, this dissertation can be
viewed as filling missing gaps that exist in the literature in the following ways: 1) merges
literature across disciplines to establish a comprehensive typology of antecedents and
outputs of HGFs, 2) analyzes and assess the nature of HGFs in the United States, and 3)
takes into consideration practitioner and policy when establishing its research.
Using a multidisciplinary approach to examine HGFs contributes to the existing
literature by associating related, albeit different, concepts within multiple disciplines to
help establish a cohesive typology of the necessary antecedents and outcomes of HGFs.
Earlier business and management literature examined the personal characteristics of
entrepreneurs, strategic management by individuals to steer their companies to high-

113
growth, and how resources are used by firms to foster growth and create wealth. This
individualistic approach to examining entrepreneurship and HGFs helps in understanding
individual motivations to create firms and foster firm growth. The economics and
regional science literature, on the other hand, has previously sought to identify the
outcomes of HGFs to determine how these firms in the aggregate contributions to
regional job growth and prosperity. By drawing on the business and regional economics
literatures, the perspective of entrepreneurs is joined with the economic development and
policy perspective to understand motivations within the aggregate.
This dissertation melds these areas of literature under the framework of the
Resource-Based View (RBV) of the firm. RBV theorizes that resources (physical capital
resources, human capital resources, and organizational capital resources) are vital
differentiators of firm advantage and the control and management of these resources are
critical to firm success (Barney, 1991; Penrose, 1959). RBV helps create a useful
typology for both the management and regional science disciplines to better understand
the interrelation of entrepreneurs and regional economic development outcomes, since
both understand the use of strategic resources within their discipline (in management see
Alvarez & Buseniz, 2001; Barney & Arikan, 2001; Ireland, Hitt, & Sirmon, 2003) (in
regional science see Porter, 2000).
The literature on HGFs has sought to investigate the impact HGFs have on
regions by quantifying the number of HGFs in a given region (Acs, et al., 2008; Birch, et
al., 1993; Birch & Medoff, 1994; Choi, et al., 2013; Clayton, et al., 2013; Davidsson &
Henrekson, 2002; Kirchoff, 1994; Stangler, 2010; Woodward, et al., 2011), the extent to
which HGFs cluster (Motoyama & Danley, 2012ab), and compare HGF performance

114
with non-HGFs (Boston & Boston, 2007). However, much of this literature sought to
describe HGFs solely in terms of descriptive statistics, rather than test hypotheses as to
the determinates of HGFs. This dissertation not only describes HGFs in the United States
(Paper II) and in the state of Ohio (Paper III), but it tests their importance to the overall
economic environment. Paper II indicates that HGFs have an association with
employment within a region, but they are weak mediators between antecedents of HGFs
and outcomes. Paper III describes the nature of high-growth firms in the state of Ohio and
challenges the commonly held belief that HGFs are everywhere in the current economy.
Instead, there are very few HGFs, with the majority acting as survivors, holding on to
their market shares.
The literature examining how to define HGFs is scattered at best, with some
articles reporting that a HGF is a firm with years of consecutive growth in sales (Birch, et
al., 1993; Birch & Medoff, 1994; Davidsson & Henrekson, 2002), others having growth
in indicators with an initial condition of employment (i.e., greater than twenty
employees) (Choi, et al., 2013; Clayton et al., 2013; OECD, 2007). Even with all of the
variability in definitions, these identifiers show that several years of growth is a
component of identifying these firms. These stringent definitions indicate not many firms
can be classified as high-growth (Delmar et al., 2003; Henrikson & Johnanson, 2010).
Consistent with the literature on HGFs, Paper III found that although many firms can be
designated as HGFs, the reality is few firms can be classified as "high-growth” based
upon the definitions used in the literature. Of the 26,104 firms categorized as high-growth
based upon an initial definition, just 3,366, or 12.9% of the firms in the universe, met the
statistical criteria revealed in the cluster-discriminate analysis as being HGFs.

115
This dissertation not only contributes to the academic literature, but it also looks
to inform economic development practice and policy. HGFs are an essential component
for economic development practitioners. This can be seen in how the International
Economic Development Council (IEDC), the most significant association for economic
development, has held information sessions for its members on HGFs (International
Economic Development Council, 2017). Identifying and understanding HGFs is key to
economic development professionals so they can find the firms early, offer support to
help them grow, and invest public dollars wisely. This dissertation shows that having a
people orientated strategy is the best way to encourage HGFs. Paper III shows that HGFs
are rare, but firms that survive and contribute to the economy at a slower pace are more
prevalent. Moreover, investing in the education of people can affect the stock of HGFs in
a given area (Paper II).
Focusing economic development efforts toward a human capital approach to
economic development can encourage entrepreneurship and an entrepreneurial mindset
(EM). The spillovers from entrepreneurs and non-entrepreneurs can create an overall
benefit by teaching individuals to become agents of their own destiny and adverse to risk,
therefore increasing prosperity through increased productivity. This strategy is a
proactive economic development approach that examines the economy as a whole, rather
than finding winners and losers. This strategy, however, is risky for economic developers
to pursue since their main determinates of success are job creation and high income in the
short-run. The human capital strategy is a long-term growth strategy that looks to create
more entrepreneurs, increase the knowledge stock of the population, and increase
prosperity overall. In the end, teaching individuals to become entrepreneurs and to foster

116
an entrepreneurial mindset is key to creating more firms; in the hope that one of these
will become high-growth.
There are limitations to the findings of this dissertation. The primary limitation
comes from data unavailability. Paper II examined the antecedents and outputs of HGFs
at the MSA level. Most variables for the model were able to be specified based on
existing literature, but as more data becomes available, this model can be tailored to
specific concepts that currently cannot be measured in the aggregate (i.e., entrepreneur
social networks, business loans, and firm transaction costs). For Paper III, although
microdata were used to specify HGFs at the firm level, the database was limited to
establishments located in the state of Ohio. This limitation caused complications as some
Ohio’s metropolitan areas cross the state’s boundary, such as Cincinnati, which stretches
into Kentucky and Indiana, the Youngtown MSA, which reaches into Pennsylvania, and
Toledo which is closely aligned with Southeast Michigan. The same applies for a
number of Ohio’s micropolitan areas and counties. This paper used the concept of a
quasi-firm to indicate to the reader this limitation.
There are areas of research on HGFs identified within this dissertation that can be
expanded. The first is to examine further the relationship between income growth and
HGFs. Paper II showed that there was a lack of association between HGFs and growth in
regional per capita income, suggesting that HGFs do not play a role in regional income
growth. Most of the literature on HGFs investigates their importance as job creators;
however, to date, there are no academic publications on the contributions HGFs make to
regional average income growth. Economic Development practitioners look to HGFs as a

117
source of new jobs, but if these firms do not increase incomes, their importance to broad-
based economic development needs to be reassessed.
The second and third areas are specific to the practice of economic development.
The second is to investigate the impact and contribution of a human capital approach to
economic development could make to fostering more entrepreneurs and HGFs over time.
Examining how these people-based policies contribute or detract from the more place-
based policies of economic development in the long-run will be an interesting
examination. The third is to use new data and tools on economic development
incentives23 to assess how much public support is given to HGFs and if this support ends
up furthering the development of the region. For example, the Ohio Third Frontier boasts
that it created 3,074 new jobs, $1.6 billion in follow-on equity, and $1.6 billion in
revenue (Ohio Department of Development, n.d.), but are all the public expenditures in
this program seeing results? Some reports point to yes (Clouse, 2017), while others are
unsure (Schiller, 2003). Using all of the new data at our disposal investigating these costs
and benefits could be essential to the future of economic development and entrepreneurial
support. The future frontiers of HGF research show promise for both academic
knowledge and practitioner information.
23 In March 2017, the W.E. Upjohn Institute released Panel Database on Incentives and Taxes developed by
Institute Senior Economist Tim Bartik. This database is intended to be the most comprehensive data on
business incentives by state and local economic development agencies.

118
REFERENCES
Abel, J. R. & Gabe, T. M. (2011). Human capital and economic activity in urban
America. Regional Studies, 45, 1079-1090.
Abramovitz, M. (1956). Resource and output trends in the United States since 1870.
American Economic Association, 46 (2), 5-23.
Acs, Z. & Armington, C. (2006). Entrepreneurship, geography and American economic
growth. Cambridge: Cambridge University Press.
Acs, Z., Audretsch, D. B., & Feldman, M. P. (1994). R & D spillovers and recipient firm
size. The Review of Economics and Statistics, 5(1), 336-340.
Acs, Z., Audretsch, D., Braunerhjelm, P., & Carlsson, B., (2004). The missing link: The
knowledge filter, entrepreneurship, and endogenous growth. Working Paper.
Centre for Economic Policy Research, London.
Acs, Z., J. & Armington, C. (2004). Employment growth and entrepreneurial activity in
cities. Regional Studies. 38 (8), 911-927.
Acs, Z. J., & Audretsch, D. B. (2003). Innovation and technological change, in Z. J. Acs
and D. B. Audretsch (Eds.), Handbook of entrepreneurship research: an
interdisciplinary survey and introduction (pp. 55-79). Boston, MA: Kluwer.
Acs, Z. J., Brunerhjelm, P., Audretsch, D. B., & Carlsson, B. (2009). The knowledge
spillover theory of entrepreneurship. Small Business Economics, 32, 15-30.
Acs, Z. J., Parsons, W., & Tracy, S. (2008). High-impact firms: Gazelles revisited.
Washington, D.C.: Small Business Administration
Acs, Z. J. & Szerb, L. (2007). Entrepreneurship, economic growth and public policy.
Small Business Economics, 28, 109-122.

119
Agarwal, R., & Audretsch, D. B. (2001). Does entry size matter? The impact of the life
cycle and technology on firm survival. The Journal of Industrial Economics,
49(1), 21-43.
Aldenderfer M. S., & Blashfield, R. K. (1984). Cluster Analysis. Sage University Paper
series on Quantitative Applications in the Social Sciences, 07-044. Beverly Hills
and London: Sage Pubs.
Aldrich, H., & Zimmer, C. (1986). Entrepreneurship through social networks. In D. L.
Sexton, & R. W. Smilor (Eds). The art and science of entrepreneurship (pp. 3-
24). Cambridge: Ballinger.
Allen, S. D., Layson, S. K., & Link, A. N. (2012). Public gains from entrepreneurial
research: inferences about the economic value of public support of the Small
Business Innovation Research program. Research Evaluation, 21, 105-112.
Alvarez, S. A., & Barney, J. B. (2007). Discovery and creation: Alternative theories of
entrepreneurial action. Strategic Entrepreneurship Journal, 1(1-2), 11-26.
Alvarez, S. A., & Buseniz, L. W. (2001). The entrepreneurship of resource-based theory.
Journal of Management, 27, 755-775.
American entrepreneurship is flourishing, if you know where to look. (2017, Sept. 30).
The Economist. Retrieved from
https://www.economist.com/business/2017/09/30/american-entrepreneurship-is-
flourishing-if-you-know-where-to-look
Amit, R., Glosten, L., & Mueller, E. (1993). Challenges to theory development in
entrepreneurship research. Journal of Management Studies, 30(5), 815-834.
120
Anyadike-Danes, M., Hart, M., & Du, J. (2015). Firm dynamics and job creation in the
United Kingdom: 1998–2013. International Small Business Journal, 33(1), 12-27.
Argwal, R. (1998). Small firm survival and technological activity. Small Business
Economics, 11, 215-224.
Arrighetti & Lasagni (2013). Assessing the determinants of high-growth manufacturing
firms in Italy. International Journal of the Economics of Business, 20 (2), 245-
267.
Audretsch, D. B. (1995). Innovation and Industry Evolution (EBook ed.). Cambridge,
Massachusetts: The MIT Press. Retrieved April 22, 2012, from
http://web.ebscohost.com/ehost/ebookviewer/ebook/nlebk_11335_AN?sid=d5a63
7f6-bcaa-41eb-afbd-e0252304735c@sessionmgr13&vid=1
Audretsch, D. B. (2003). Entrepreneurship Policy and the strategic management of
places, in D. M. Hart (Ed.) The emergence of entrepreneurship policy (pp. 20-38).
Cambridge University Press.
Audretsch, D. B. (2003). Standing on the shoulders of midgets: the U.S. Small Business
Innovation Research program (SBIR). Small Business Economics, 20, 129-135.
Audretsch, D. B. (2007). Entrepreneurship capital and economic growth. Oxford Review
of Economic Policy, 23 (1), 63-78.
Audretsch, D. B., Bozeman, B., Combs, K. L., Feldman, M., Link, A. N., Siegel, D. S.,
Stephan, P., Tassey, G., & Wassner, C. (2002). The economics of science and
technology. The Journal of Technology Transfer, 27, 155-203.
Audretsch, D. B., Coad, A., & Segarra, A. (2014). Firm growth and innovation. Small
Business Economics, 43(4), 743 - 749.

121
Audretsch, D. B., & Feldman, M. P. (1996). Innovative clusters and the industry life
cycle. Review of Industrial Organization, 11, 253-273.
Audretsch, D. B. & Keilbach, M. (2008). Resolving the knowledge paradox: Knowledge-
spillover entrepreneurship and economic growth. Research Policy, 37 (10), 1697-
1705.
Audretsch, D. B., & Mahmood, T. (1995). New firm survival: new results using a hazard
function. The Review of Economics and Statistics, 77(1), 97-103.
Austrian, Z. & Auerbach, E. (2012). State Financing of Innovation and Entrepreneurship.
In S. B. White & Z. Z. Kotval (Eds.). Financing Economic Development in the
21st Century. (pp.168-196). Armonk, New York: M. E. Sharpe
Austrian, Z., & Piazza, M. C. (2014). Barriers and opportunities for entrepreneurship in
older industrial regions. In W. M. Bowen (Ed.) The road through the rustbelt (pp.
215-243). Kalamazoo: W.E. Upjohn Institute for Employment Research.
Barney, J. (1991). Firm resources and sustained competitive advantage. Journal of
Management, 17(1), 99-120.
Barney, J., & Arikan, A. M. (2001). The resource-based view: origins and implications.
In M. A. Hitt, R. F. Freeman, & J. S. Harrison (Eds.) Handbook of strategic
management (pp. 124-188). Oxford: Blackwell.
Barney, J., Wright, M., & Ketchen, Jr., D. J. (2001). The resource-based view of the firm:
ten years after 1991. Journal of Management, 27, 625-641.
Bartik, T. (1990). The market failure approach to regional economic development policy.
Economic Development Quarterly, 4 (4), 361-370.

122
Bartik, T. J. (1985). Business location decisions in the United States: Estimates of the
effects of unionization, taxes, and other characteristics of states. Journal of
Business & Economic Studies, 3 (1), 14-22.
Baum, J. R. & Bird, B. J. (2010). The successful intelligence of high-growth
entrepreneurs: Links to new venture growth. Organization Science, 21 (2), 397-
412.
Baum, J. R. & Wally, S. (2003). Strategic decision speed and firm performance. Strategic
Management Journal, 24 (11), 1107-1129.
Baum, J. R., Frese, M. Baron, R. & Katz, J. A. (2006). Entrepreneurship as an area of
psychology: An introduction. In J. R. Baum, M. Frese, R. Baron, (Eds.) The
psychology of entrepreneurship (pp. 1-18). Erlbaum, New York.
Berger, A.N., & Udell, G.F., (1998). The economics of small business finance: the roles
of private equity and debt markets in the financial growth cycle. Journal of Bank
Finance, 22 (6–8), 613–673.
Bhat, C.R., Paleti, R. & Singh. P. (2014). A spatial multivariate count model for firm
location decision. Journal of Regional Science, 54, 462–502.
Birch, D., Haggerty, A., & Parsons, W. (1993). Who's creating jobs? Cognetics, Inc.
Birch, D. L. (1979). The job generation process. Cambridge, MA: M.I.T. Program on
Neighborhood and Regional Change.
Birch, D. L., & Medoff, J. (1994). Gazelles. In L. C. Solomon, & A. R. Levenson (Eds.),
Labor markets, employment policy and job creation (pp. 159-167). Boulder, CO:
Westview.

123
Birley, S., & Westhead, P. (1994). A taxonomy of business start-up reasons and their
impact on firm growth and size. Journal of Business Venturing, 9, 7-31.
Borgatti, S. P., Mehra, A., Brass, D. J., & Labianca, G., (2009). Network analysis in the
social sciences. Science, 323, 892-895.
Boschma, R. A. (2004). Competitiveness of regions from an evolutionary perspective.
Regional Studies, 38(9), 1001-1014.
Boston, T. D., & Boston, L. R. (2007). Secrets of gazelles: The difference between high-
growth and low-growth businesses owned by African American entrepreneurs.
Annals, AAPS, 613, 108-130.
Bouncken, R. B. & Reuschl, A. J. (2018). Coworking-spaces: How a phenomenon of the
sharing economy builds a novel trend for the workplace and for entrepreneurship.
Review of Management and Science, 12, 317-334.
Bowen, N. K., & Guo, S. (2011). Structural equation modeling. USA: Oxford University
Press. Retrieved on October 27, 2016, from www.ohiolink.edu
Bravo-Biosca, A. (2010). Growth dynamics: Exploring business growth and the
contraction in Europe and the US. London, UK: NESTA. Retrieved September
29, 2015, from http://www.nesta.org.uk/sites/default/files/growth_dynamics.pdf
Brockhaus, R. H., & Horwitz, P. S. (1986). The psychology of the entrepreneur. In D. L.
Sexton, & R. W. Smilor (Eds.) The art and science of entrepreneurship (pp. 25-
48). Cambridge: Ballinger.
Brown, R. & Mason, C. (2014). Inside the high-tech black box: A critique of technology
Entrepreneurship policy. Technovation, 34,773-784.

124
Brown, R., & Mawson, S. (2013). Trigger points and high-growth firms. Journal of Small
Business Enterprise Development, 20(2), 279-295.
Brown, R. & Mawson, S. (2016). The geography of job creation in high growth firms: the
implications of ‘growing abroad’. Environment and Planning C: Government and
Policy, 34, 207-227
Bruno, A. V., and Tyebjee, T. T. (1982). The environment for entrepreneurship. In C. A.
Kent, D. L. Sexton, and K. H. Vesper, (Eds.) Encyclopedia of entrepreneurship,
(pp. 288-315) Prentice-Hall: Englewood Cliffs, NJ.
Busenitz, L. W., & Barney, J. B. (1997). Differences between entrepreneurs and
managers in large organizations: Biases and heuristics in strategic decision-
making. Journal of Business Venturing, 12, 9-30.
Busenitz, L. W., Plummer, L. A., Klotz, A. C., Shahzad, A., & Rhoads, K. (2014).
Entrepreneurship research (1985–2009) and the emergence of opportunities.
Entrepreneurship Theory and Practice, 38(5), 981-1000.
Buss, T. F. (2002). Emerging high-growth firms and economic development policy.
Economic Development Quarterly, 16 (1), 17-19.
Bygrave, W. D. (1989a). The entrepreneurship paradigm (I): A philosophical look at its
research methodologies. Entrepreneurship Theory and Practice, 14, 7-26.
Bygrave, W. D. (1989b). The entrepreneurship paradigm (II): Chaos and catastrophes
among quantum jumps? Entrepreneurship Theory and Practice, 15, 7-30.
Cantillon, R. (1730). Essay on the nature of trade in general (Original work published
1730 ed.). (H. Higgs, Ed., & H. Higgs, Trans.) London: Frank Cass and Co.

125
Retrieved December 2, 2013, from
http://www.econlib.org/library/NPDBooks/Cantillon/cntNT.html
Capello, R. (2014). Classical contributions: von Thünen, Weber, Christaller, Lösch, in
Manfred M. Fischer and Peter Nijkamp (eds), Handbook of Regional Science (pp.
507-526). Springer: New York.
Carland, J. W., Hoy, F., Boulton, W. R., & Carland, J. C. (1984). Differentiating
entrepreneurs from small business owners: a conceptualization. Academy of
Management Review, 9(2), 354-359.
Carlsson, B., Acs, Z. J., Audretsch, D. B., & Braunerhjelm, P. (2009). Knowledge
creation, entrepreneurship, and economic growth: a historical review. Industrial
and Corporate Change, 18(6), 1193-1229.
Carree, M. A. & Thurik, R. (2010). The impact of entrepreneurship on economic growth,
in Z. J. Acs & D. B. Audretsch (Eds.) Handbook of entrepreneurship research.
(pp. 557-594). New York: Springer.
Carree, M. A., van Stel, R. Thurik, R. & Wennekers, S. (2002). Economic development
and business ownership: An analysis using data of 23 OECD countries in the
period 1976–1996. Small Business Economics, 19, 271–290.
Casson, M. (2005). Entrepreneurship and the theory of the firm. Journal of Economic
Behavior and Organization, 58, 327-348.
Chandler, G.N. & Hanks, S.H. (1993). Measuring the performance of emerging
businesses: a validation study. Journal of Business Venturing, 8, 391–408.
Chinitz, B. (1961). Contrasts in agglomeration: New York and Pittsburgh. American
Economic Review, 51(2), 279-289.

126
Choi, T., Roberson, J. C., & Rspasingha, A. (2013). High-growth firms in Georgia.
Atlanta: The Federal Reserve of Atlanta.
Clayton, R. L., Sadeghi, A., Spletzer, J. R., & Talan, D. M. (2013, June). High-
employment-growth firms: defining and counting them. Monthly Labor Review,
3-13.
Clouse, C. (2017). 2016 Economic Impact of Companies Funded and/or Assisted by the
Northeast Ohio Entrepreneurial Service Provider Program. Urban Publications.
Retrieved on May 20, 2018 from
https://engagedscholarship.csuohio.edu/urban_facpub/1501
Coad, A., Cowling, M. & Siepel, J. (2017). Growth processes of high-growth firms as a
four-dimensional chicken and egg. Industrial and Corporate Change, 26 (4), 537-
554.
Coad, A., Daunfeldt, S.O., Holzl, W., Johansson, D., & Nightingale, P. (2014). High-
growth firms: Introduction to the special section. Industrial and Corporate
Change, 23(1), 91-112.
Coad, A. & Rao, R., (2008). Innovation and firm growth in high-tech sectors: A quantile
regression approach. Research Policy, 37, 633-648.
Colombelli, A., Krafft, J., & Quartaro, F. (2013). High-growth firms and technological
knowledge: Do gazelles follow exploration or exploitation strategies? Industrial
and Corporate Change, 23(1), 261-291.
Czarnitzki, D. & Delanote, J. (2013). Young innovative companies: The new high-
growth firms? Industrial and Corporate Change, 22 (5), 1315–1340.

127
Daunfeldt, S. O., Elert, N. & Johansson, D. (2016). Are high-growth firms
overrepresented in high-tech industries? Industrial and Corporate Change, 25 (1),
1-21.
Daunfeldt, S.O., Elert, N., & Johansson, D. (2010). The economic contribution of high-
growth firms: Do definitions matter? Ratio Working Papers 151, The Ratio
Institute. Retrieved on March 31, 2018 from
http://ratio.se/app/uploads/2014/11/sod_ne_dj_contribution_151.pdf
Daunfeldt, S.O., Elert, N., & Johansson, D. (2014). The economic contribution of high-
growth firms: Do policy implications depend on the choice of growth indicator?
Journal of International Competitive Trade, 14, 337-365
Daunfeldt, S. O., Elert, N., Johansson, N.(2016).Are high-growth firms overrepresented
in high-tech industries?, Industrial and Corporate Change, 25 (1) 1–21.
Davidsson, P., & Henrekson, M. (2002). Determinants of the prevalence of start-ups and
high-growth firms. Small Business Economics, 19(2), 81-104.
Davidsson, P., & Honig, B. (2003). The role of social and human capital among nascent
entrepreneurs. Journal of Business Venturing, 18, 301-331.
Davila, A., Foster, G., & Gupta, M. (2003). Venture capital financing and the growth of
startup firms. Journal of Business Venturing, 18 (6), 689-708.
Davis, M. H, Hall, J. A., & Mayer, P. S. (2016). Developing a new measure of
entrepreneurial mindset: Reliability, validity, and implications for practitioners.
Consulting Psychology Journal: Practice and Research, 68 (1), 21-48.
Delmar, F., (1997). Measuring growth: Methodological considerations and empirical
results. In Donckels, R., Miettinen, A. (Eds.), Entrepreneurship and SME
128
research: On its way to the next millennium (pp. 199–216). London/New York:
Routledge
Delmar, F., Davidson, P., & Gartner, W. B. (2003). Arriving at the high-growth firm.
Journal of Business Venturing, 18, 189–216
Demir, R., Wenneberg, K., & McKelvie, A. (2017). The strategic management of high-
growth firms: A review and theoretical conceptualization. Long Range Planning,
50, 431-456.
Dennis Jr., W. J. (2011). Entrepreneurship, small business and public policy levers.
Journal of Small Business Management, 49 (1), 92-106.
Doty, D. H., & Glick, W. H. (1994). Typologies as a unique form of theory building:
Toward improved understanding and modeling. Academy of Management Review,
19 (2), 230-251.
Dubini, P. (1988). The influence of motivations and environment on business start-ups:
Some hints for public policies. Journal of Business Venturing, 4, 11-26.
Duncan, O. D. (1966). Path analysis: Sociological examples. American Journal of
Sociology, 72 (1), 1-16.
Dunne, T., Roberts, M., & Samuelson, L. (1989). The growth and failure of US
manufacturing plants. Quarterly Journal of Economics, 104 (4), 671-698.
Dwyer, B. & Kotey, B. (2016). Identifying high growth firms: Where are we? Journal of
Management & Organization, 22 (4), 457-475.
Eckhardt, J. T. & Shane, S. A. (2003). Opportunities and entrepreneurship. Journal of
Management, 29(3), 333-349

129
Eckhardt, J. T. & Shane, S. A. (2011). Industry changes in technology and
complementary assets and the creation of high-growth firms. Journal of Business
Venturing, 26, 412-430.
Everitt, B. S. (1993). Cluster Analysis. (3rd ed.) New York: Halsted.
Feeser, H. R. & Willard, G. E. (1990). Founding strategy and performance: A comparison
of high and low growth high-tech firms. Strategic Management Journal, 11 (2),
87-98.
Feld, B. (2012). Startup communities: Building an entrepreneurial ecosystem in your
city. Hoboken, NJ: Wiley & Sons.
Feldman, M. & Francis, J. L. (2006). Entrepreneurs as agents in the formation of
industrial clusters. In P. Cooke, R.L. Martin, & B.T. Asheim (Eds.) Clusters and
regional development: Critical reflections and explorations (pp. 115-136).
London/New York: Routledge.
Feldman, M., Francis, J., & Bercovitz, J. (2005). Creating a cluster while building a firm:
Entrepreneurs and the formation of industrial clusters. Regional Studies, 39(1),
129-141.
Feldman, M. & Lendel, I. (2010). Under the lens: The geography of optical science as an
emerging industry. Economic Geography, 86(2), 147-172.
Feldman, M. & Zoller, T. (2012). Dealmakers in place: Social capital connections in
regional entrepreneurial economies. Regional Studies, 46 (1), 23-37.
Fiss, P. C., (2011). Building better causal theories: A fuzzy set approach to typologies in
organization research. Academy of Management Journal, 54 (2), 393-420.

130
Florian, J., Lubatkin, M., & Schulze, W. (2003). A social capital model of high-growth
ventures. Academy of Management Journal, 46 (3), 374-384.
Florida, R. (2005). Cities and the creative class. New York: Routledge.
Florida, R. L. & Kenney, M. (1988). Venture capital, high technology and regional
development. Regional Studies, 22 (1), 33-48.
Franz, A. (2011). North American Business Cost Review. Moody’s Analytics.
Gabe, T. M. & Kraybill, D. S. (2002). The effect of state economic development
incentives on employment growth of establishments. Journal of Regional Science,
42 (4), 703-730.
Galloway, L. & Brown, W. (2002). Entrepreneurship education at university: a driver in
the creation of high growth firms? Education + Training, 44 (8/9), 398-405.
Gartner, W. B. (1985). Conceptual framework for describing the phenomenon of new
venture creation. The Academy of Management Review, 10(4), 696-706.
Gartner, W. B. (1990). What are we talking about when we talk about entrepreneurship?
Journal of Business Venturing, 5, 15-28.
Geroski, P. A. (1995). What do we know about entry? International Journal of Industrial
Organization, 13, 421-440.
Glaeser, E. L., Kallal, H. D., Scheinkman, J. A., & Shleifer, A. (1992). Growth in cities.
Journal of Political Economy, 100(6), 1126-1152.
Glaeser, E. L., Kerr, W. R., & Ponzetto, G. A. (2010). Clusters of entrepreneurship.
Journal of Urban Economics, 67, 150-168.
Goedhuys, M. & Sleuwaegen, L. (2010). High-growth entrepreneurial firms in Africa: A
quantile regression approach. Small Business Economics, 34 (1), 31-51.

131
Goldman Sachs (n.d.) Goldman Sachs 10,000 Small Business. Retrieved on April 24,
2018, from http://www.goldmansachs.com/citizenship/10000-small-
businesses/US/#
Gundry, L. K., & Welsch, H. P. (2001). The ambitious entrepreneur: High growth
strategies of women-owned enterprises. Journal of Business Venturing, 16, 452-
470.
Hair, J. F., Black, W. C., Babin, B. J., Anderson, R. E. & Tatham, R. L., (2006)
Multivariate Data Analysis (6th ed). Upper Saddle River, New Jersey: Pearson
Hakstian, A. R., Roed, J. C., & Lind, J. C. (1979). Two-sample T–2 procedure and the
assumption of homogeneous covariance matrices. Psychological Bulletin, 86(6),
1255-1263.
Hall, B. H., (1987). The Relationship between Firm Size and Firm Growth in the U.S.
Manufacturing Sector. Journal of Industrial Economics, 35 (4), 583-600.
Hambrick, D. C. & Crozier, L. M. (1985). Stumblers and stars in the management of
rapid growth. Journal of Business Venturing, 1 (1), 31-45.
Hansen, G. S. & Wernerfelt, B. (1989). Determinates of firm performance: the relative
importance of economic and organizational factors. Strategic Management
Journal, 10, 399-411.
Haltiwanger, J. C. (2011). Job creation and firm dynamics in the United States. In J.
Lerner and S. Stern (Eds.) Innovation policy and the economy. Vol. 12 (pp. 17-
38). Chicago: University of Chicago Press.
Haltiwanger, J. C., Jarmin, R. S., & Miranda, J. (2010, August). Who creates jobs? Small
vs. large vs. young. Cambridge, MA: National Bureau of Economic Research.

132
Harris, R. (2011). Models of regional growth: Past, present, and future. Journal of
Economic Surveys, 25(5), 913-951.
Hart, P. E. & Prais, S. J. (1956). The analysis of business concentration: A statistical
approach. Journal of the Royal Statistical Society (Series A), 119(1), 150-91.
Hecker, D. (2005, July). High-technology employment: a NAICS-based update. The
Monthly Labor Review, 57-72.
Hellmann, T. & Puri, M. (2002). Venture capital and the professionalization of start-up
firms: Empirical evidence. The Journal of Finance, 57, 169-197.
Henrekson, M. & Johansson, D. (2010). Gazelles as job creators: A survey and
interpretation of the evidence. Small Business Economics, 35, 227-244.
Hill, E. W., & Brennan, J. F. (2000). A methodology for identifying the drivers of
industrial clusters: The foundation of regional competitive advantage. Economic
Development Quarterly, 14(1), 65-96.
Hill, E. W., Brennan, J. F., & Wolman, H. L. (1998). What is a Central City in the United
States? Applying a Statistical Technique for Developing Taxonomies. Urban
Studies. 35 (11). 1935 - 1969
Hitt, M. & Ireland, R. D. (2000). The intersection of entrepreneurship and strategic
management research. In D. L. Sexton & H. Landstrom (Eds.) The Blackwell
Handbook of Entrepreneurship (pp. 45-63). Oxford: Blackwell Publishers.
Hitt, M. A., Ireland, R. D., Camp, S. M., & Sexton, D. L. (2001). Strategic
entrepreneurship: Entrepreneurial strategies for wealth creation. Strategic
Management Journal, 22, 479–491.

133
Hitt, M. A., Ireland, R. D., Camp, S. M., & Sexton, D. L. (2002). Strategic
entrepreneurship: Integrating entrepreneurial and strategic management
perspectives. In M. A. Hitt, R. D. Ireland, S. M. Camp, & D. L. Sexton (Eds.),
Strategic entrepreneurship: creating a new mindset (pp. 1–16). Oxford:
Blackwell Publishers.
Hoang, H. & Antoncic, B. (2003). Network-based research in entrepreneurship: A critical
review. Journal of Business Venturing, 18, 165-187.
Hölzl, W. (2009). Is the R&D behaviour of fast-growing SMEs different? Evidence from
CIS III data for 16 countries. Small Business Economics, 33, 59-75.
Hölzl, W. (2013). Persistence, survival and growth: A closer look at twenty years of fast
growing firms in Austria. Industrial and Corporate Change, 23 (1), 1-38.
Hölzl, W. & Friesenbichler, K., (2010, April 13). High-growth firms, innovation and the
distance to the frontier. Economics Bulletin, 30(2), 1016-1024.
Huggins, R. & Williams, N. (2011). Entrepreneurship & regional competitive: The role
and progression of policy. Entrepreneurship & Regional Development, 23 (9-10),
907-932.
Hurst, E., & Pugsley, B. W. (2011). What do small businesses do? Washington, D.C.:
Brookings. Retrieved April 18, 2015, from
http://www.brookings.edu/about/projects/bpea/papers/2011/small-businesses-
hurst
Hwang, V. & Horowitt, G. (2012). The rainforest: The secret to building the next Silicon
Valley. Los Altos Hills, CA: Regenwald.

134
Inc. (2015). Inc. 5,000 frequently asked questions. Inc. Retrieved September 29, 2015,
from http://www.inc.com/inc5000apply/faqs.html
International Economic Development Council (2017). EDJ: The IEDC Economic
Development Journal. Retrieved on May 20, 2018 from
https://www.iedconline.org/web-pages/resources-publications/economic-
development-journal/
Ireland, R. D., Hitt, M. A., Camp, S. M., & Sexton, D. L. (2001). Integrating
entrepreneurship and strategic management action to create firm wealth. Academy
of Management Executive, 15(1), 49–63.
Ireland, R. D., Hitt, M. A., & Sirmon, D. G. (2003). A model of strategic
entrepreneurship: the construct and its dimensions. Journal of Management,
29(6), 963-989.
Jaffe, A. B. (1986). Technological opportunity and spillovers of R&D: Evidence from
firms' patents, profits and market value. The American Economic Review, 76(5),
984-1001.
Jaffe, A. B. (1989). Real effects of academic research. The American Economic Review,
79(5), 957-970.
Johannisson, B., Alexanderson, O., Nowicki, K., & Senneseth, K., (1994). Beyond
anarchy and organization: entrepreneurs in contextual networks. Entrepreneurship
& Regional Development, 6, 329–356.
Jovanovic, B. (1982). Selection and the evolution of industry. Econometrica, 50(3), 649-
670

135
Kellermanns, F., Walter, J., Crook, T. R., Kemmerer, B., & Narayanan, V. (2016). The
resource-based view in entrepreneurship: A content-analytical comparison of
researchers' and entrepreneurs' views. Journal of Small Business Management,
54(1), 26-48.
Kerr, S. P., Kerr, W. R. & Xu, T., (2017). Personality Traits of Entrepreneurs: A Review
of the Recent Literature. NBER Working Paper No. 24097. Retrieved on July 31,
2018 from http://www.nber.org/papers/w24097
Ketchen, D. J., & Shook, C. L. (1996). The application of cluster analysis in strategic
management research: An analysis and critique. Strategic Management Journal,
17, 441-458.
Keuschnigga, C., & Nielsen, S. B. (2002). Tax policy, venture capital, and
entrepreneurship. Journal of Public Economics, 87, 175-203.
Kim, W. C. & Mauborgne, R. (1997). Value innovation: The strategic logic of high
growth. Harvard Business Review, 75 (1), 102-112.
Kirchhoff, B. A. (1994). Entrepreneurship and dynamic capitalism. Westport, CT:
Praeger.
Klepper, S. (1996). Entry, exit, growth, and innovation over the product lifecycle. The
American Economic Review, 86(3), 562-583.
Knight, F. (1921). Risk, uncertainty and profit. Boston: Houghton Mifflin Co.
Kolvereid, L. (1992). Growth aspirations among Norwegian entrepreneurs. Journal of
Business Venturing, 7(3), 209-222.
Lee, S. Y., Florida, R., Acs, Z. J. (2004) Creativity and entrepreneurship: A regional
analysis of new firm formation, Regional Studies, 38 (8), 879-891.

136
Leibenstein, H. (1968). Entrepreneurship and development. American Economic
Association, 58(2), 72-83.
Lendel, I. (2010). The impact of research universities on regional economies: The
concept of university products. Economic Development Quarterly, 24 (3), 210-
230.
Lerner, J. (1999). The government as venture capitalists: The long-run impact of the
SBIR program. Journal of Business, 72(3), 285-318.
Lerner, J. (2002). When bureaucrats meet entrepreneurs: the design of effective 'public
venture capital' programmes. The Economic Journal, 112(477), F73-F84.
Lerner, J. (2009). Boulevard of broken dreams: Why public efforts to boost
entrepreneurship and venture capital have failed--and what to do about it.
Princeton: Princeton University Press.
Lerner, J. (2010). The future of public efforts to boost entrepreneurship and venture
capital. Small Business Economics, 35, 255-264.
Link, A. N., & Scott, J. T. (2010). Government as entrepreneur: Evaluating the
commercialization success of SBIR projects. Research Policy, 39, 589-601.
Link, A. N., & Scott, J. T. (2012). Employment growth from the Small Business
Innovation Research program. Small Business Economics, 39, 265-287.
Lockett, A., Wiklund, J., Davidsson, P., & Girma, S. (2011). Organic and acquisitive
growth: Re-examining, testing and extending Penrose’s Growth Theory. Journal
of Management Studies, 48 (1), 48-74.
Lucas, R. E. (1993). Making a miracle. Econometrica, 61, 251-272.

137
Malecki, E. (1984). High technology and local economic development. Journal of the
American Planning Association, 50 (3), 262-269.
Malecki, E. J. (2012). Regional social capital: Why it matters. Regional Studies, 46 (8),
1023-1039.
Mayer, H. (2011). Entrepreneurship and Innovation in Second Tier Regions.
Cheltenham, UK: Edward Elgar.
Mansfield, E. (1962). Entry, Gibrat’s law, innovation and the growth of firms. American
Economic Review, 52, 1023-1051.
Mansfield, E. (1981). Composition of R and D expenditures: Relationship to size of firm,
concentration, and innovative output. The Review of Economics and Statistics,
63(4), 610-615.
Marks, G. (2012, June 6). The difference between an entrepreneur and a small business
owner. Forbes. Retrieved September 27, 2015, from
http://www.forbes.com/sites/quickerbettertech/2012/06/06/the-difference-
between-an-entrepreneur-and-a-small-business-owner/
Markusen, A, Carlson, V, (1989), Deindustrialization in the American midwest: Causes
and responses. In L. Rodwin, H., Sazanami (Eds.) Deindustrialization and
Economic Transformation. (pp. 29-59). Winchester, MA: Unwin Hyman
Markusen, A. (1999). Fuzzy concepts, scanty evidence, policy distance: The case for
rigor and policy relevance in critical regional studies. Regional Studies, 33(9),
869-884.

138
Marlin, M., & Wurster, C. (1997). Economic development finance in the United States. In
R. D. Bingham, & E. W. Hill, (Eds.) Global perspective on economic
development (pp. 1-27). Rutgers: Center for Urban Policy Research.
Marshall, A. (1912). Economics of industry. London: Macmillian.
Mason, C., & Brown, R. (2013). Creating good public policy to support high-growth
firms. Small Business Economics, 40, 211-225.
Mason, G., Bishop, K., & Robinson, C. (2009). Business growth and innovation: The
wider impact of rapidly growing firms in UK City-Regions. London: National
Endowment for Science, Technology and the Arts. Retrieved October 10, 2015,
from
http://www.nesta.org.uk/sites/default/files/business_growth_and_innovation.pdf
Mathur, V. K. (1999). Human capital-based strategy for regional economic development.
Economic Development Quarterly, 13(3), 203-216.
McClelland, D. C. (1961). The achieving society. New York: The Free Press.
McEvily, B., & Zaheer, A., (1999). Bridging ties: A source of firm heterogeneity in
competitive capabilities. Strategic Management Journal, 20, 1133-1156.
McKelvey, B. (1982). Organizational systematics: Taxonomy, evolution, classification.
Berkeley: University of California Press.
McKelvie, A., & Wicklund, J. (2010). Advancing firm growth research: A focus on
growth mode instead of growth rate. Entrepreneurship Theory and Practice, 34,
261-288.
Mohr, V. & Garnsey, E. (2011). How do high-growth firms grow? Evidence from
Cambridge, UK. Economics, Management, and Financial Markets, 6, 29-59

139
Moreno, A. M., & Casillas, J. C. (2007). High-growth SMEs versus non-high-growth
SMEs: A discriminant analysis. Entrepreneurship & Regional Development, 19,
69-88.
Morris, M. H., Neumeyer, X., Kuratko, D. F. (2015). A portfolio perspective on
entrepreneurship and economic development. Small Business Economics, 45, 713-
728.
Motoyama, Y. (2014). The state-level geographic analysis of high-growth companies.
Journal of Small Business & Entrepreneurship, 27 (2), 213-227.
Motoyama, Y., & Danley, B. (2012a). The ascent of America’s high-growth companies:
An analysis of the geography of entrepreneurship. Kansas City: Ewing Marion
Kauffman Foundation.
Motoyama, Y., & Danley, B. (2012b). The ascent of America’s high-growth companies:
state profiles of America’s high-growth companies. Kansas City: Ewing Marion
Kauffman Foundation.
Mueller, P. (2007). Exploiting entrepreneurial opportunities: The impact of
entrepreneurship on economic growth. Small Business Economics, 28, 355-362.
Nicholls-Nixon, C. L., (2005). Rapid growth and high performance: The entrepreneur’s
impossible dream?” Academy of Management Executive, 19 (1), 77-88.
Nightingale, P., & Coad. A. (2014). Muppets and gazelles: Political and methodological
biases in entrepreneurship research. Industrial and Corporate Change, 23, 113-
143.
Organization for Economic Co-operation and Development. (2007). Eurostat-OECD
manual on business demography statistics. Paris, France: OECD. Retrieved Feb

140
21, 2015, from http://www.oecd.org/std/business-stats/eurostat-
oecdmanualonbusinessdemographystatistics.htm
Ortmans, J. (2015). Gauging impact: A closer look at entrepreneurial density. Kauffman
Foundation. Retrieved on July 13, 2016, from
http://www.kauffman.org/blogs/policy-dialogue/2015/april/gauging-impact-a-
closer-look-at-entrepreneurial-density
O’ Sullivan, E., & Rassel, G. R. (1999). Research Methods for Public Administrators.
(3rd Ed.) New York: Longman.
Parker, S. C. (2009). The economics of entrepreneurship. Cambridge: Cambridge
University Press.
Parker, S. C., Storey, D. J., & van Witteloostuijn, A. (2010). What happens to gazelles?
The importance of dynamic management strategy. Small Business Economics, 35,
203-226.
Pe'er, A., & Keil, T. (2013). Are startups affected similarly by clusters? Agglomeration,
competition firm heterogeneity, and survival. Journal of Business Venturing, 28,
354-372.
Penrose, E. (1959). The theory of the growth of the firm (3rd ed.). Oxford: Oxford
University Press.
Piazza, M., Austrian, Z., Lendel, I., Alexander, S., Cyran, E., Hoover, D. D., & Leach, R.
(2016). High-growth firms: Delineating definitions, industries, and business cycle
performance. Urban Publications. Retrieved on March 30, 2018 from
https://engagedscholarship.csuohio.edu/cgi/viewcontent.cgi?article=2371&contex
t=urban_facpub

141
Plehn-Dujowich, J. M. (2013). Product innovations by young and small firms.
Washington, D.C.: Small Business Administration. Retrieved July 18, 2013, from
Small Business Administration: http://www.sba.gov/advocacy/7540/621871
Porter, M. (2000). Location, competition, and economic development: Local clusters in a
global economy. Economic Development Quarterly, 14 (1), 15-34.
Porter, M. E. (2003). The economic performance of regions. Regional Studies, 37 (6&7),
549-578.
Qian, H., & Acs, Z. (2013). An absorptive capacity theory of knowledge spillover
entrepreneurship. Small Business Economics, 40, 185-197.
Qian, H., Acs, Z., & Stough, R. R. (2013). Regional systems of entrepreneurship: The
nexus of human capital, knowledge and new firm formation. Journal of Economic
Geography, 13, 559-587.
Qian, H., & Haynes, K. E. (2013). Beyond innovation: The small business innovation
research program as entrepreneurship policy. Journal of Technology Transfer, 39
(4), 524-543.
Rauch, A., & Frese, M. (2007). Let’s put the person back into entrepreneurship research:
A meta-analysis on the relationship between business owners’ personality traits,
business creation, and success. European Journal of Work and Organizational
Psychology, 16, 353–385.
Rich, P. (1992). The organizational taxonomy: Definition and design. Academy of
Management Review, 17, 758-781.

142
Ricketts, M. (2006). Theories of entrepreneurship: Historical development and critical
assessment. In M. Casson, B. Yeung, A. Basu, & N. Wadeson, (Eds.) The Oxford
Handbook of Entrepreneurship (pp. 33-58). Oxford: Oxford University Press.
Romer, P. M. (1986). Increasing returns and long-run growth. Journal of Political
Economy, 94(5), 1002-1037.
Romer, P. M. (1990). Endogenous technological change. Journal of Political Economy,
98(5), S71-S102.
Ross-Sorkin, A. (2017, Dec 4). From Bezos to Walton, Big Investors Back Fund for
‘Flyover’ Start-Ups. The New York Times. Retrieved on May 15, 2018 from
https://www.nytimes.com/2017/12/04/business/dealbook/midwest-start-ups.html
Rubin, H. J. (1988). Shoot anything that flies; claim anything that falls: Conversations
with economic development practitioners. Economic Development Quarterly,
2(3), 236-251.
Rumelt, R. P. (1995). Inertia and transformation. In C. A. Montgomera, (Ed.) Resources
in an evolutionary perspective: A synthesis of evolutionary and resource-based
approaches to strategy (pp. 101-134). New York: Springer Science + Business
Media.
Samila, S. & Sorenson, O. (2011). Venture capital, entrepreneurship, and economic
growth. The Review of Economics and Statistics, 93 (1), 338-349.
Samuels, J. M. (1965). Size and the growth of firms. The Review of Economic Studies, 32
(2), 105-112.
Santarelli, E., Klomp, L., & Thurik, A. R. (2006). Gibrat’s law: An overview of the
empirical literature. In E. Santarelli (Ed.), Entrepreneurship, growth, and

143
innovation: The dynamics of firms and industries: International Studies in
Entrepreneurship (pp. 41–73). Berlin: Springer
Saxenian, A. (1994). Regional advantage: Culture and competition in Silicon Valley and
Route 128. Cambridge: Harvard University Press.
Saxenian, A. (2002). Silicon valley’s new immigrant high-growth entrepreneurs.
Economic Development Quarterly, 16 (1), 20-31.
Scherer, F. M. (1965). Firm size, market structure, opportunity, and the output of
patented inventions. The American Economic Review, 55(5), 1097-1125.
Schiller, Z. (2003, Dec. 12). Economic benefits, state oversight faulted in study of Third
Frontier Grant Program. Policy Matters Ohio. Retrieved on May 20, 2018 from
https://www.policymattersohio.org/press-room/2003/12/12/economic-benefits-
state-oversight-faulted-in-study-of-third-frontier-grant-program
Schumpeter, J. A. (1934). The theory of economic development. Cambridge: Harvard
University Press.
Schumpeter, J. A. (1942). Capitalism, socialism, and democracy. New York: Harper &
Brothers.
Segarra, A., & Teruel, M. (2014). High-growth firms and innovation: an empirical
analysis for Spanish firms. Small Business Economics, 43, 805-821.
Sexton, D. L., & Bowman, N. (1985). The entrepreneur: A capable executive and more.
Journal of Business Venturing, 1, 129-140.
Shane, S. (2009). Why encouraging more people to become entrepreneurs is bad public
policy.. Small Business Economics, 33(2), 141-149.

144
Shane, S., Klovereid, L., & Westhead, P. (1991). An exploratory examination of the
reasons leading to new firm formation across country and gender. Journal of
Business Venturing, 6, 431-446.
Shane, S., & Venkataraman, S. (2000). The promise of entrepreneurship as a field of
research. Academy of Management Review, 25(1), 217-226.
Shepherd, D. & Wicklund, J. (2009). Are we comparing apples with apples or apples
with oranges? Appropriateness of knowledge accumulation across growth studies.
Entrepreneurship Theory and Practice, 33(1), 105-123.
Shepherd, D. A. (1999). Venture capitalists' assessment of new venture survival.
Management Science, 45(5), 621-632.
Siegel, R., Siegel, E., & Macmillian, I. C. (1993). Characteristics distinguishing high-
growth ventures. Journal of Business Venturing, 8, 169-180.
Simon, H. A. and Bonnini, C. P. (1958). The size distribution of business firms.
American Economic Review, 48(4), 607-17.
Solow, R. (1956), A Contribution to the Theory of Economic Growth. Quarterly Journal
of Economics, 70(1), 65–94.
Spigel, B. (2017). The relational organization of entrepreneurial ecosystems.
Entrepreneurship Theory and Practice, 41(1), 49-72.
Spilling, O. R. (1996). The entrepreneurial system on entrepreneurship in the of a mega-
event context. Journal of Business Research, 36, 91-103.
Stangler, D. (2010). High-growth firms and the future of the American economy. Kansas
City, MO: Ewing Marion Kauffman Foundation.

145
Steiger, J. H. & Lind, J. (1980) Statistically-based tests for the number of common
factors. Paper presented at the Annual Spring Meeting of the Psychometric
Society, Iowa City.
Stewart, F. (2018). The STEM dilemma: Skills that matter to regions. Kalamazoo, MI:
W.E. Upjohn Institute for Employment Research.
St-Jean, E., & Audet, J. (2012). The role of mentoring in the learning development of the
novice entrepreneur. International Entrepreneurship and Management Journal,
8(1), 119-140.
Streiner, D. L. (2005). Finding our way: An introduction to path analysis. Canadian
Journal of Psychiatry, 50, 115-122.
Tabachnick, B. G., & Fidell, L. S. (2007). Using multivariate statistics. Boston: Pearson.
Taich, C., Piazza, M., Carter, K. & Wilcox, A. (2016). Measuring entrepreneurial
ecosystems. Urban Publications. Retrieved on April 24, 2018, from
https://engagedscholarship.csuohio.edu/urban_facpub/1452
Thurik, R. (2009). Entreprenomics: Entrepreneurship, economic growth, and policy. In
Z. J. Acs, D. B. Audretsch, & R. J. Strom, Entrepreneurship, Growth, and Public
Policy (pp. 219-249). Cambridge: Cambridge University Press.
Tiebout, C. M. (1956) Exports and regional economic growth, Journal of Political
Economy, 64(2), 160–64.
U.S. Bureau of Labor Statistics. (2012, January 3). Job creation among small and large
businesses. Retrieved May 2, 2015, from
http://www.bls.gov/opub/ted/2012/ted_20120103.htm

146
U.S. Census Bureau. (2016, Nov 22). Delineation files. Retrieved on October 23, 2017,
from https://www.census.gov/geographies/reference-files/time-
series/demo/metro-micro/delineation-files.html
U.S. Economic Development Administration (n.d.).About OIE. Retrieved on May 23,
2018 from https://www.eda.gov/oie/
U.S. Government Accountability Office. (2013). Entrepreneurial assistance:
Opportunities exist to improve programs’ collaboration, data-tracking, and
performance management. GAO-13-452T, Washington, DC. Retrieved November
25, 2014, from http://www.gao.gov/products/GAO-12-601T
U.S. Small Business Administration. (2012). The Small Business Innovation Research
(SBIR) & Small Business Technology Transfer (STTR) programs. Washington,
D.C.: U.S. Government. Retrieved December 5, 2015, from
https://www.sbir.gov/sites/default/files/annual_reports/SBIR-
STTR_FY_2012_Report_Final.pdf
U.S. Small Business Administration. (2016). Loans & grants. Retrieved April 27, 2016,
from http://www.sba.gov/category/navigation-structure/loans-grants
Unger, J. M., Rauch, A., Frese, M., & Rosenbusch, N. (2011). Human capital and
entrepreneurial success: A meta-analytical review. Journal of Business
Venturing, 26, 341-358.
Venkataraman, S. (1997). The distinctive domain of entrepreneurship research: An
editor’s perspective. In J. Katz & R. Brockhaus (Eds.), Advances in
entrepreneurship, firm emergence, and growth, vol. 3 (pp. 119-138). Greenwich,
CT: JAI Press.

147
Verheul, I., Wennekers, S., Audretsch, D., Thurik, A. R. (2001). An eclectic theory of
entrepreneurship: Policies, intuitions, and culture. Tinbergen Institute Discussion
Paper. TI 2001-030/3
Ward, J. (1963). Hierarchical grouping to optimize an objective function. Journal of the
American Statistical Association, 58, 236-244.
Warner, R. M. (2008). Applied statistics: From bivariate through multivariate
techniques. Thousand Oaks, CA: Sage.
Weinzimmer, L. G., Nystrom, P. C., & Freeman, S. J. (1998). Measuring organizational
growth: Issues, consequences and guidelines. Journal of Management, 24 (2).
235-262
Wennberg, K. (2013). Managing high-growth firms: A literature review. International
Workshop on Management and Leadership Skills in High-Growth Firms.
Presented 6 May 2013 in Warsaw, Poland.
Wennekers, S., & Thurik, R. (1999). Linking entrepreneurship and economic growth.
Small Business Economics, 13, 27-55.
Wernerfelt, B. (1984). A resource-based view of the firm. Strategic Management
Journal, 5, 171–180.
Wernerfelt, B. (1995). The resource-based view of the firm: ten years after. Strategic
Management Journal, 16 (3), 171-174.
Willard, G. E., Krueger, D. A., & Feeser, H. R. (1992). In order to grow, must the
founder go: performance between founder and non-founder managed high-growth
manufacturing firms. Journal of Business Venturing, 7, 181-194.

148
Williamson, O. E. (1967). Hierarchical control and optimum firm size. Journal of
Political Economy, 75 (2), 123-138.
Winter, S. G. (1984). Schumpeterian competition in alternative technological regimes.
Journal of Economic Behavior and Organization, 5, 287-320.
Wolfe, R. W. (2014). Business R&D performance in the United States tops $300 billion
in 2012. Washington D.C.: National Science Foundation. Retrieved December 7,
2015, from http://www.nsf.gov/statistics/2015/nsf15303/nsf15303.pdf
Woodward, D. P, Guimaraes, P., & Watson, V., (2011). High-impact firms in South
Carolina. University of South Carolina: Darla Moore School of Business.
Young, S., Hood, N., & Peters, E. (1994). Multinational enterprises and regional
economic development. Regional Studies, 28, 657-677.
Zimmer, C. (1986). Entrepreneurship through social networks: The art and science of
entrepreneurship. Ballinger, Cambridge, MA.
Zopounidis, C. (1994). Venture capital modeling: Evaluation criteria for the appraisal of
investments. The Financier, 1(2), 54-64.

149
APPENDIX
Table XI. Establishment Counts by Industry Category, 2013-2015
Industry Category 2013 2014 2015 Count % Count % Count %
Natural Resources and Mining; Construction 24,957 9% 24,898 9% 25,108 9%
Manufacturing 15,702 6% 15,582 6% 15,493 6%
Trade, Transportation, and Utilities 67,464 25% 67,519 25% 67,887 25%
Information, Financial Activities, Professional & Business
Services
81,480 30% 81,926 30% 82,965 30%
Education and Health Services 31,451 12% 32,879 12% 32,879 12%
Leisure and Hospitality & Other 51,573 19% 51,423 19% 51,184 19% 272,627 100% 274,227 100% 275,516 100%
Source: U.S. Bureau of Labor Statistics, Quarterly Census of Employment and Wages

150
Table XII. High-Tech NAICS Codes and Descriptions
NAICS
Code
NAICS Description
1131 Timber Tract Operations
1132 Forest Nurseries and Gathering of Forest Products
2111 Oil and Gas Extraction
2211 Electric Power Generation, Transmission and Distribution
3241 Petroleum and Coal Products Manufacturing
3251 Basic Chemical Manufacturing
3252 Resin, Synthetic Rubber, and Artificial and Synthetic Fibers and Filaments Manufacturing
3253 Pesticide, Fertilizer, and Other Agricultural Chemical Manufacturing
3254 Pharmaceutical and Medicine Manufacturing
3255 Paint, Coating, and Adhesive Manufacturing
3259 Other Chemical Product and Preparation Manufacturing
3332 Industrial Machinery Manufacturing
3333 Commercial and Service Industry Machinery Manufacturing
3336 Engine, Turbine, and Power Transmission Equipment Manufacturing
3339 Other General Purpose Machinery Manufacturing
3341 Computer and Peripheral Equipment Manufacturing
3342 Communications Equipment Manufacturing
3343 Audio and Video Equipment Manufacturing
3344 Semiconductor and Other Electronic Component Manufacturing
3345 Navigational, Measuring, Electromedical, and Control Instruments Manufacturing
3346 Manufacturing and Reproducing Magnetic and Optical Media
3353 Electrical Equipment Manufacturing
3364 Aerospace Product and Parts Manufacturing
3369 Other Transportation Equipment Manufacturing
4234 Professional and Commercial Equipment and Supplies Merchant Wholesalers
4861 Pipeline Transportation of Crude Oil
4862 Pipeline Transportation of Natural Gas
4869 Other Pipeline Transportation
5112 Software Publishers
5171 Wired Telecommunications Carriers
5172 Wireless Telecommunications Carriers (except Satellite)
5174 Satellite Telecommunications
5179 Other Telecommunications
5182 Data Processing, Hosting, and Related Services
Source: Listing of NAICS codes from “High-technology employment: a NAICS-based update”
by Hecker (2005)

151
Table XII. High-Tech NAICS Codes and Descriptions (Continued)
NAICS
Code
NAICS Description
5191 Other Information Services
5211 Monetary Authorities-Central Bank
5232 ecurities and Commodity Exchanges
5413 Architectural, Engineering, and Related Services
5415 Computer Systems Design and Related Services
5416 Management, Scientific, and Technical Consulting Services
5417 Scientific Research and Development Services
5511 Management of Companies and Enterprises
5612 Facilities Support Services
8112 Electronic and Precision Equipment Repair and Maintenance
Source: Listing of NAICS codes from “High-technology employment: a NAICS-based update”
by Hecker (2005)