CATCH grant: Pediatric Obesity and Weight Management Community Assessment Naya Antink, MD June 25,...
36
CATCH grant: CATCH grant: Pediatric Pediatric Obesity and Obesity and Weight Weight Management Management Community Community Assessment Assessment Naya Antink, MD Naya Antink, MD June 25, 2008 June 25, 2008
-
Upload
jesse-evans -
Category
Documents
-
view
214 -
download
0
Transcript of CATCH grant: Pediatric Obesity and Weight Management Community Assessment Naya Antink, MD June 25,...

CATCH grant: CATCH grant: Pediatric Obesity Pediatric Obesity
and Weight and Weight Management Management Community Community AssessmentAssessment
Naya Antink, MDNaya Antink, MD
June 25, 2008June 25, 2008

Obesity!Obesity!• Concern for increasing rates of
pediatric obesity: nationwide and locally
• Lack of family awareness regarding patient’s growth status
• Lack of awareness of resources for families with obese kids
• Lack of community resources for pediatric weight management

What is Overweight?
• Example:
• 10 yo boy• Height: 4 ft 11 in• Weight: 113 lbs
●
●

Body Mass Index (BMI)Body Mass Index (BMI)
Weight in kg OR Weight in lbs x 703
(Height in m)2 (Height in inch)2
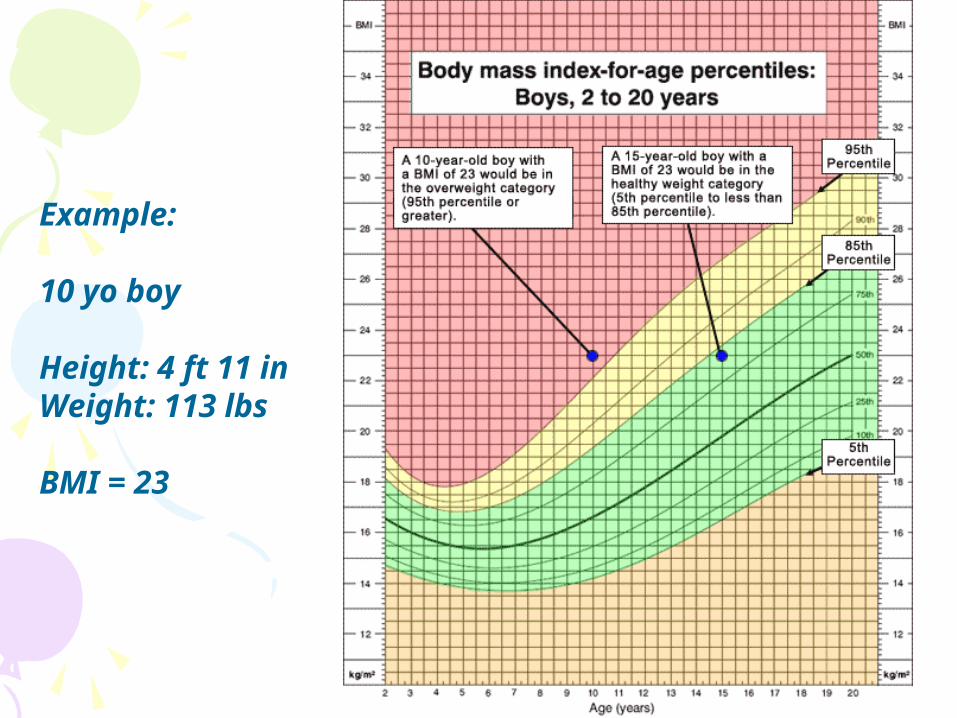
Example:
10 yo boy
Height: 4 ft 11 inWeight: 113 lbs
BMI = 23

Obesity Trends Among U.S. Adults
No Data <10% 10%–14%
19851985

Obesity Trends Among U.S. Adults
19861986
No Data <10% 10%–14%

Obesity Trends Among U.S. Adults
19871987
No Data <10% 10%–14%
Obesity Trends Among U.S. Adults
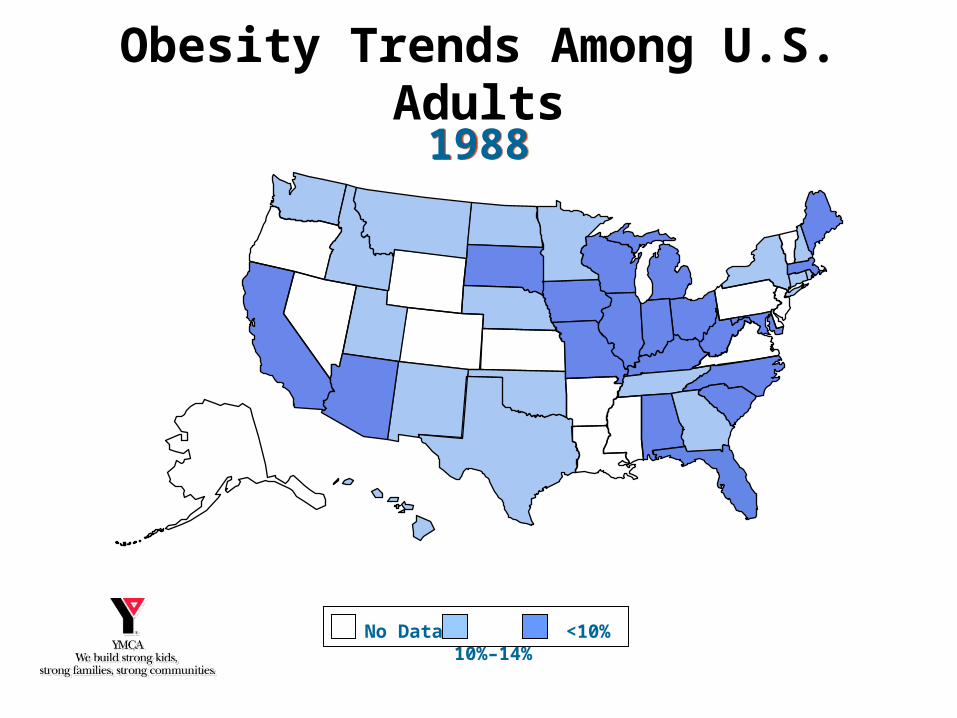
19881988
No Data <10% 10%–14%

Obesity Trends Among U.S. Adults
19891989
No Data <10% 10%–14%

Obesity Trends Among U.S. Adults
19901990
No Data <10% 10%–14%

Obesity Trends Among U.S. Adults
19911991
No Data <10% 10%–14% 15%–19%

Obesity Trends Among U.S. Adults
19921992
No Data <10% 10%–14% 15%–19%

Obesity Trends Among U.S. Adults
19931993
No Data <10% 10%–14% 15%–19%

Obesity Trends Among U.S. Adults
19941994
<10% 10%–14% 15%–19%

<10% 10%–14% 15%–19%
Obesity Trends Among U.S. Adults
19951995

<10% 10%–14% 15%–19%
Obesity Trends Among U.S. Adults
19961996

10%–14% 15%–19% ≥20%
Obesity Trends Among U.S. Adults
19971997

10%–14% 15%–19% ≥20%
Obesity Trends Among U.S. Adults
19981998

10%–14% 15%–19% ≥20%
Obesity Trends Among U.S. Adults
19991999

10%–14% 15%–19% ≥20%
Obesity Trends Among U.S. Adults
20002000

10%–14% 15%–19% 20%–24% ≥25%
Obesity Trends Among U.S. Adults
20012001

15%–19% 20%–24% 25%–29%
Obesity Trends Among U.S. Adults
20022002

15%–19% 20%–24% 25%–29%
Obesity Trends Among U.S. Adults
20032003

15%–19% 20%–24% 25%–29%
Obesity Trends Among U.S. Adults
20042004

15%–19% 20%–24% 25%–29% ≥30%
Obesity Trends Among U.S. Adults
20052005

15%–19% 20%–24% 25%–29% ≥30%
Obesity Trends Among U.S. Adults
20062006

Increasing Prevalence of Overweight Children
05
10
15
20
2-5 Years 6-11 Years 12-19 Years
Perc
en
t
1971-741976-801988-941999-20002003-2004
Source: CDC/NCHS and NHANES

Summary of Health Indicators
Number Included
in AnalysisPrevalence
%
Nation* (0-5 yo) BMI ≥ 95th percentile 7,192,043 13.8
Nation (2-5 yo) BMI 85th to 95th percentile 2,945,212 16.4
BMI ≥ 95th percentile 2,945,212 14.8
Idaho: 2-5 yo BMI 85th to 95th percentile 16,305 16.9
Idaho: 2-5 yo BMI ≥ 95th percentile 16,305 12.4
* Based on 2000 CDC growth chart percentiles for weight-for-length for children under 2 years of age and BMI-for-age for children 2 years of age and older.
2006 Pediatric Nutrition Surveillance National Summary of Health Indicators
Children Aged less than 5 years

More Idaho StatsMore Idaho Stats
• 26% of the 160,000 Idaho kids ages 10-17 yo are considered overweight or obese.#
• Hispanic children have almost double the rate of overweight/obesity than non-Hispanic children (49% vs 24%).
• Kids with public insurance have almost double the incidence compared to those with private insurance (40% vs 22%).
• 29% of low-income children ages 2-5 years participating in WIC are overweight/obese.*
# 2003 National Survey of Children’s Health * 2006 Pediatric Nutrition Surveillance System (PedNSS)

My question is…My question is…
Is there a need for a comprehensive pediatric weight management program here in
the Treasure Valley?

CATCH ProgramCATCH Program• CATCH = Community Access To Child
Health
• Founded in 1991 by the AAP under a grant from the Robert Wood Johnson Foundation
• Increase children’s access to medical homes or specific health services not otherwise available.
• Focus on underserved children or health disparities among children.
• Partnership between pediatricians and community-based organizations.

The CATCH Program provides The CATCH Program provides pediatricians with:pediatricians with:
• Training
• Technical Assistance and Resources
• Peer Support and Networking Opportunities
• Funding Opportunities

Various types of grants Various types of grants offered:offered:
• Planning
• Implementation
• Resident
• Residency training
• Visiting Professorship

CATCH Planning GrantCATCH Planning Grant• Needs assessment
• Community Asset Mapping
• Feasibility Studies
• Community meetings
• Focus Groups
• Planning meetings
• Grant proposals for future project implementation

What have I accomplished so What have I accomplished so far?far?