Catch-and-Release Influences on Inland Recreational Fisheries

ISSN 1175-1 584
MINISTRY OF FISHERIES
Te Tauiiaki i nga tini a Tangaroa
Catch and effort data for New Zealand rock lobster fisheries
Nokome Bentley Paul J. Starr '
Nathan A. Walker Paul A. Breen
New Zealand Fisheries Assessment Report 2005149 September 2005

Catch and effort data for New Zealand rock lobster fisheries
Nokome Bentley' Paul J. S t a d
Nathan A, Walker' Paul A, Breen3
'Trophia Lrd P 0 Box 60
Kaikoura
'61A Rhine Street Island Bay Wellington
'NIWA Private Bag 14901
Wellington
New Zealand Fisheries Assessment Report 2005149 September 2005

Published by Ministry of Fisheries Wellington
2005
ISSN 1175-1584
@ Ministry of Fisheries
2005
Citation: Bentley, N.; Stan, PJ.; Walker, N.A.; Breen, P.A. (2005).
Catch and effort data for New Zealand rock lobster fisheries. New Zealand Fisheries Assessment Report 2005/49. 49 p.
This series continues the informal New Zealand Fisheries Assessment Research Document series
which ceased at the end of 1999.

EXECUTIVE SUMMARY
Bentley, N.; Starr, P.J.; Walker, N.A.; Breen, P.A. (2005). Catch and effort data for New Zealand rock lobster fisheries.
New ZeaIand Fisheries Assessment Report 200V49.49 p.
Catch and effort data are an important part of the assessment of New Zealand red rock lobster (Jasus edwardsig fisheries. This report describes the available sets of commercial catch and effort data and the screening procedures used to correct errors in the data. It also serves as documentation for the CRA Catch and Effort (CRACE) database and the procedures used to prepare the data for rock lobster stock assessments.
The six sets of data that we describe are:
1945-62, Marine Department: landings and number of vessels by month and port
1963-73, Annala &King: catch and effort by statistical area, methcd, and month
1974-79, Annala & Esterman: total annual catch and days fished for each quota management area
1979-89, Rock Lobster Fishing Returns (FSU): catch and effort by vessel, day, and statistical area
1989-Present, Catch and Effort Landing Returns (CELR): catch and effort by vessel, day, and statistical area
198%Present, Quota Management Returns (QMR) and Monthly Harvest Returns m): catch by month and quota management area
For each data set, we describe the e x k t of the data and any error screening or correction procedures that are performed on them. There are no error screening or corrections on the Marine Department, Annala & King, and Annala & Esterman data sets.
For the FSU data set, we describe alternative data extracts. The FSU data set held in the CRACE database appears to be the most comprehensive available for rock lobster. Error screening and correction methods for this data set follow closely those performed by Booth et al. (1994).
We describe in detail the error screening and catch correction methods used for CELR data. Verified catches are only available when the catch is landed to a Licensed Fish Receiver and we describe ten methods which can be used to link the effort section of the CELR forms with the verified landings. The deveIoping use of holding pots and on-land retention facilities in rock lobster fisheries have made it more difficult to reliably link these two sections of the form We demonstrate that the method used to correct estimated catches with verified catches can have a significant effect on the estimates of catch per unit effort.
The QMR and MHR data sets provide catch by month and quota management area. These data sets are assumed to provide a more accurate value for the total catch taken in a quota management area than from the CELR data.
Reference
Booth, J.D.; Robinson, M.; Starr, P.J. (1994): Recent research into New Zealand rock lobsters, and a review of rock lobster catch and effort data. New Zealand Fisheries Assessment Research Document 9417. 56 p. (Unpublished report held in NIWA library, Wellington.)

1. INTRODUCTION
Catch and effort data are an important component of the assessment of New Zealand red rock lobster (Jasus edwardsii) fisheries. This report is intended to be a reference document for stock assessment research which descnies the sets of commercial catch and effort data that are available for this species and the correction and error screening procedures which are used to prepare these data for use in the stock assessments. The W E (CRA catch and effort) database was developed for stock assessment in 1998, and since then has served as the repository of all catch and effort data and the SQL queries used for correcting and error screening these data. This document serves as documentation for that database and for the procedures used to prepare the data for rock lobster stock assessments.
Catch and effort data h m non-commercial fisheries are not considered here. There is little reliable quantitative information on the catch or effort of the recreational, Maori customary, or illegal sectors currently available. The most reliable data for any of these sectors come h m surveys of recreational fishers (e.g., Bradford 1997, Bradford 1998, Teirney et al. 1997). For estimates of catches fiom the Maori customary and illegal sectors see Annala & Sullivan (1999) and Sullivan (2004).
The last published review of rock lobster catch and effort data was by Booth et al. (1994). Their description focussed on catch and effort data from Rock Lobster F i Returns (1979-81), Fisheries Statistics Unit Returns (198248), and Catch Effort Landing Returns (1989-92). This report covers the same data sets as well as data sets on commercial catch and effort h m years before 1979. For each set of data we describe:.
(a) how the data were originally collected;
(b) the source of the data imported into the CRACE database;
(c) procedures for error checking and corrections;
(d) some standard extracts of the data from the CRACE database.
We refer to tables, queries, and fields in the CRACE database using italics.
2. METHODS
Although the CRACE database was developed in 1998, it was extensively modified in 2000 so that its representation of the CELR data more closely mirrored the Ministry of Fisheries w i s h ) WARMOU database (Mmktry of Fisheries 2004) from which the CELR data extracts are taken.
The most critical use of catch and effort data in rock lobster stock assessments is for obtaining an index of catch rates. Any corrections or error screening, particularly to fields for pots lifted and catch, have the potential to change these indices. To examine the potential effect of error screening on catch rate indices for each data set, apparent awrs are flagged with an error rating P b l e 1). The effect of error screening can then be examined by comparing indices with different degrees of error screening.
For each level of error screening, we calculated the totals of potlifts and catch for each vessel/month/area stratum. Maunder & Starr (1995) examined alternative methods for standardising rock lobster catch and effort data to obtain indices of abundance. They found that vessel effects were small and suggested that a standardisation using year, month, and area was superior to a model including vessel effects because it allowed more data to be used. The geometric mean of the total catch divided by the total potlifts for each fishing year was used to compare each level of error screening. This approach was chosen to approximate the results of CPUE standardisation as previous studies have shown that, for most quota management areas, there is very little difference between the geometric means and standardised indices (e.g., Bentley 2001).

3. 194-2: MARINE DEPARMENT
The former New Zealand Marine Department recorded the landings of rock lobster and number of vessels landing rock lobster by month for each of the major ports around the country. Vessels were obliged to record their catch in their home port regardless of where it was caught. Thus, landings may not be representative of the catch taken in the immediate vicinity of the port. For example, there are anecdotal reports that many fishing vessels ftom ports in Otago were fishing in Fiordland and reporting their catch in Otago during the 1960s.
3.1 Source
Total landings and vessel numbers aggregated by quota management area (QMA) and calendar year were obtained from the original "CRA45-9 5. xls" spreadsheet maintained by one of us (P. Breen, NIWA). Data for that spreadsheet were obtained h the annual reports of the Marine Department. Ports were aggregated into QMkr according to the location of the port. These data were imported in to the CRACE table mardept.
3.2 Fields
There are only four fields in the mardept table (Table 2).
3.3 Error checking and corrections
No error-checkine: or corrections have been made on these data. Ifpossible, the original data should be obtained and the aggregation of data by port and vessel into totals by QMA and vessel checked
3.4 Extracts
Queries are provided for landings (Table 3) and vessels (Table 4) by QMA and calendar year in tabular format.
Annala & King (1983) stated that these data were obtained from "data on the weight of rock lobsters caught and the number of vessel-days fished by area fished takenfrom fishing return supplied by rock lobsterfishemen using pots from I963 to 1973 ...I1. These data are totals for each fisbing method during each month in each of 24 statistical areas, which differ h r n the statistical areas that are currently used for rock lobster.
4.1 Source
Computer print-outs of summarked catch and effort data by year, month, and 24 statistical areas for 1963 to 1973 were obtained from hard copy computer printouts by J. Booth (NIWA). The totals kom these printouts correspond to the summaries published by Annala & King (1983). However, the individual records by fishing vessel are not available. These summary data were manually entered into a database by NIWA during 2000. An electronic copy of these data was imported into the CRACE table annking.

4.2 Fields
The statistical areas used for recording rock lobster catch and effort data &om 1963 to 1973 were different h m those used currently (Table 5). The field Type indicates whether the catch was landed as tails or whole. However, Catch is in whole weight which is assumed to be equivalent to the green weight cu~~ently used (i.e., where Type = tail, the conversion to whole weight has already been made). Note that Catch is in pounds. Most of the catch comes fiom Method 8 ("pots", Table 6).
4.3 Error checking and corrections
These data use different statistical areas from those currently used. The two systems have only two common boundaries (Waitaki River, between CRA 5 and CRA 7, and Cape Farewell between CRA 5 and CRA 9). To calculate CPUE or catch totals by the current QMAs, it is necessary to apportion catches and days fished from each statistical area to a QMA (Table 7). While some statistical areas lie wholly within a QMA, others straddle a QMA boundary and it is necessary to assume a proportion with which to divide catches and days fished to two QMAs. To date such apportioning has been necessary for assessments of CRA 3 (Breen et al. 2002), CRA 4 and CRA 5 (Kim et al. 2004) and CRA 8 pentley et al. 2001).
4.4 Extracts
Catches and catch rates fiom rock lobster potting have been summarised using only methods 8 and 19 (both potting), with other methods of capture not included Queries are provided for producing summaries of catch and catch rates (kglyear) by QMA and fishing year (1 April to 31 Mwh; Table 8, Table 9). Two other queries calculate the average catch (Table 10) and catch rates (Table 11) for each QMA for an assessment period (defined as each of the two six-month periods fiom April to September and October to March).
5. 1974-1979: ANNALA & ESTERMAN
Annala & Esterman (1986) estimated the total annual catch and days fished for each quota management area. They stated that "Catch and effortfigures by areafished were not compiled during 1974-78, because of the collapse of the fisheries statistics scheme, but data were collected on the weight landed by port of landing. This required s;trapolations to estimate the number of vesseldays jished. For the years 1963-73 and 1979-82 the estimated number of days fished were derived by dividing the total landings from the port of landing data by the average catch per day fishedfiom the area jished data. Because of the lack of catch and effort data by area fished during 1974-78, the port of landing figures were used for the entire 1963-82periodW.
5.1 Source
Total landings and days fished aggregated by quota management area (QMA) and calendar year were obtained &om the "CRA45 - 95 . xls" spreadsheet maintained by P. Breen (NIWA). These data were imported into CRACE table annest and correspond to the totals provided by Amala & Esterman (1986).
5.2 Fields
There are only four fields in the annest dataset (Table 12).

5.3 Error checking and corrections
No error checks or corrections have been done on these data.
5.4 Extracts
Queries are provided for catches (Table 13) and days fished (Table 14) by QMA and calendar year in tabular format.
6. 1979-1989: ROCK LOBSTER FISHING STATISTICS UNIT (FSU) RETURNS
From 1979 to 1982, rock lobster fishers were rapired to submit 'Rock Lobster Fishing Returns' on a monthly basis. These retums detailed the daily catch of legal-sized lobsters, the number of potlifts, and the statistical area of tishing (Figure 1). The Fisheries Statistics Unit was established in 1982 and performed checks and corrections on these data (often referred to as 'FSU data').
Booth et al. (1994) provided a g o d overview of these data and some of the problems withusing them. Further details can be found there and in references cited thakn (e.g., Annala & Sandas 1981, Sanders 1984).
6.1 Obtaining'and importing data
Since 1992, three extracts of rock lobster FSU data have been obtained. These are described below.
6.1.1 1992 extract
These data were obtained by one of us (PIS) for the study on rock lobster catch and effort data described by Booth et al. (1994). At the time, substantial checking was canied out between that dataset and previously published summary reports. There was generally good correspondence between the 1992 extract and original reports (see appendix 1 of Booth et al. 1994).
6.1.2 1998 extract
For the initial construction of the CRACE database, an extract of FSU rock lobster data held by the Ministry of Fisheries was obtained in 1998. Catch rates calculated fiom the 1998 extract were consistently higher than those previously published for FSU data (I3ooth et al. 1994). A comparison of the 1992 and 1998 data sets showed that the 1998 extract contained no records where catch was zero, whereas the 1992 extract had 98 617 records where the catch was zero. However, the 1998 extract had 5809 more records where catch was greater than zero, p a s because some screening of records had been done in the 1992 extract. For instance, the 1998 extract had 5107 records with statistical areas outside the valid range, whereas the 1992 extract had none (although it has 1332 records with a null statistical area).
For records with a positive catch, the 1992 extract had consistently lower numbers of potlifts (except for 1980 and 1981), lower catches, and a higher catch to potlift ratio (Table 15). These dif5erences indicate that there are major inconsistencies between the two extracts that could influence the calculation of CPUE. The 1992 extract is considered to be superior because it holds catch records with no catch (Figure 2). These records are important because often fishers would record only a total monthly catch for the last day of the month, even though they may have fished on several days (see appendix 1 of Booth et al. (1994) for a discussion of this issue). The 1992 extract was therefore imported into the CRACE tablefsu and the 1998 extract was discarded.

6.1.3 2003 extract
During 2002, NIWA, under contract to the Ministry of Fisheries, collated and checked FSU data and created a new database named "fsu". We obtained dl the data in that database for the rock lobster form type. From 1979 to 1986, the number of records by year in the 2003 extract was within 1% of the number of records in the 1992 extract (although always lower). The 2003 extract had less than half the number of records as the 1992 extract for 1988 and no records for 1989 (Figure 2).
The error checking done by NIrNA on the rock lobster FSU data mainly replaced missing effort data with the average for the vessel (3.38% of records) and fixed invalid dates (0.07%). Because we had already corrected for the missing effort data in the 1992 extract (see below), we did not consider it worthwhile switching to the 2003 extract on the basis of error checking and grooming. Therefore, we have ignored the 2003 exhact and continued to use the one obtained in 1992. Anothe~ reason to use the 1992 extract over the 2003 extract is that it contains more information for 1988 and 1989 than the 2003 extract.
6.2 Error checking and corrections
6.2.1 Statistical area
For records where statistical area was null, less than 901 or more than 943, statt_stats-wea-code-ewor was set to 3. Outliers were defined using the calculated field base-region, which, for each vessel, is the most fiequent (or modal) statistical area. A statistical area became an outlier when, for any vessel, it represented less than 5% of the records observed for the base-region and that statistical area was more than four statistical areas distant fiom the modal statistical area. The start-stats-area-code-error field was set to 2 for these outlier statistical areas. These queries marked less than 0.5% of records U b l e 16). The number of statistical areas used to determine unusual deviations in the FSU data set (four) is greater than the equivalent number used for the CELR data (two: see Section 7.3.1) because it appears that the repo*g of statistical area in this data set is more accurate than in the CELR
6.2.2 Pot and catch corrections . .
FSU forms were required to be submitted each month, but daily recording of number of pots and catch by statistical area were required. This level of detailed reporting did not always occur. Booth et al. (1994) noted that the catch fields on FSU forms were often entered only at the end of a trip while the number of pots lifted were recorded for each day of the trip. Thus, the number of pots fished is available on a daily basis although there is no associated daily catch (see example ~able i7) . This type of recording appears to have occurred for a large proportion of records. For instance, there are 60 254 vesse~~eadrnonth combinations and 13 657 ofthese records have a minimum catch of zero. There are 98 617 records where the catch is zero, but there are no records with a null catch.
This type of recording behaviour can result in very high apparent catch rates for a vessel. For example, in 1982, one vessel appears to have fished every day in the month using 85 pots and landed a total of 15 600 t. While this initially seems like a very large catch, it equates to a plausible catch rate of 6 kglpotlift. Booth et al. (1994) indicated that it was not appropriate to calculate daily catch rates using these data and suggested that it would be more appropriate to calculate catch rates based on the sum of pots and catch by vessel, month, and statistical area. For kips which extend from the end of one month to the beginning of another (e.g., 25 June 1980 to 04 July 1980), and when the vessel records catch only on the last day of the trip, the estimated mean catch rate will be too low in June and too high in July. However, over the entire dataset, this effect should only increase variability without biasing the estimated catch rates.

The situation is further complicated because, on some occasions, the number of pots was not entered on a daily basis. There are 8% (57 769 out of 738 692) of records with null pots. These appear to arise because the fisher entered the number of pots for only the first day of the month as an indication that the same numba were used each day (see example Table 18).
Although this type of misreporting is only a small proportion of the records, it could bias catch rates upwards that are calculated using monthly sums of pots and catch. Thus it is important to adjust for records with missing effort data. In order to address this problem, Booth et al. (1994) made the following additions to the existing data:
(a) replaced null entries with the average number of pots for that month for the vessel;
@) if there was no pot information for the vessel for that month, they used the average of all vessels in that area in that month.
Thae corrections have been implemented in the CRACE database. The effect of (b) is less than that of (a).
Error checking has not been not performed on the daily records of pots or catch because these will be affected by the frequency of recording. Instead, error checks are performed on the montbly totals (described in the next section).
6.2.3 Monthly totals .,...
The total catch, effort (potlifts), and number of days fished were calculated for each vessel by month and statistical area by aggregating records with a sta~-stat~_area-code-eror less than or equal to 1 (query: MQJsu-agg). A resultant tablefsu-agg was created. AUfsu-agg records where the number of days fished was greater than 31 were given a days-emor of 3 Uable 19; 10 of these records were from one vessel). E w r checks on pots (Table 20) and catch (Table 21) were done on a daily basis to make them as consistent as possible with checks done for CELR data. It was not possible to identify high outliers for pots as it was for the CELR data. The FSU data are used as the s o w of total annual catch by QMA (Table 22) for the fishing years before the beginning of the QMR reporting system (1986-87; see Section 8).
6.2.4 Sensitivities
The sensitivities of catch rate trends to error checking and correction methods were examined by calculating the trends in CPUE indices for each QMA under the following error screening extracts:
1. no cmections, no error screening
2. corrected number of pots, no error screening
3. corrected numba of pots, level 3 e w r screening
4. corrected number of pots, level 2 e w r screening
5 , corrected number of pots, level 1 error screening
As expected, correcting for null entries for pots reduced catch rates in most years in most quota management areas (Figure 3). The effects of the error corrections are minor compared to the effect of adding in the missing potlift data as implemented in options (a) and @) (Section 6.2.2).

7. 1989 TO PRESENT: CATCH AND EFFORT LANDING RETURNS (CELR)
7.1 Description
CELR data are kept by the Ministry of Fisheries in the WAREHOU database (Ministry of Fisheries 2004) and are based on daily reporting forms filled out by fishers. A fisher is required to begin a new record every time he changes date, statistical area, target species, or method of capture. The green weight of lobster landed on the same date as the form was filled out are included in the "Landing" (bottom) part of the form. Only rock lobster taken using the potting method are included in the CRACE database. Four tables within this database contain dataused for stock assessments Gable 23).
I 7.2 Obtaining and importing data
CELR data are obtained &om the Ministry of Fisheries' Information Management Group. Standard Query Language (SQL) commands for extracting these data are provided in Appendix 1. Between 1998 and 2002, the approach taken to updating CELR data was to request data for the last two Ghing years from MFish. However, since 2003, all CELR data held by the Ministry are re-imported into the CRACE database whenever the database is updated. This approach ensures that any error corrections made by the Ministry on older data are transfared and recognises the WAREHOU database as the canonical source for CELR data.
I 7.3 Error checking and corrections
A procedure for error checking the CELR catch and effort data was described by Booth et al. (1994) and Maunder & Starr (1995). Vignaux & Kendrick (1998) described an alternative procedure for error checking data from CELR forms which incorporated the correction of estimated catches based on the landed catches. Bentley (2001) audited catch and effort data h m the Chatham Islands (CRA 6) and examined the effect of errors on indices obtained from standardisation of catch rates. The CRACE database implements similar error checking procedures. These are described below for each field in each of the CELR tables.
I 7.3.1 fishing-event table: statistical area
The Ministry of Fisheries uses 43 Rock Lobster Statistical Areas (RSA): 901 to943 (see Figure 1). A large number of fishing events have a statistical area outside this range. There appear to be two principal reasons for this:
I (a) fishers have not included the "9" prefix;
(b) the General Statistical Area (GSA) has been incorrectly used. This most frequently happens in the Chatham Islands where the GSA and RSA are the same. This happens rarely for the rest of the country because the GSA and the RSA do not always correspond.
These errors were conected in two ways. Where the statistical area was in the range 1 to 43, 900 was added to correct the entry. Around the Chatham Islands, the General Statistical Areas 049,050, 052 and 051 correspond exactly to Rock Lobster Statistical Areas 940,941, 942, and 943 and these were changed appropriately. In both cases, records were given a start-stars area-code-eror rating of 1. A range check was then done to mark any remaining records that were-null or outside the valid range, giving these records an error rating of 3 (Table 24).
Statistical area outliers for a vessel in a fishing year were de5ne.d as any statistical area that represented less than 5% of records and where that statistical area was more than two statistical areas away from the modal statistical area (Table 24). These outliers were given an error rating of 2.

7.3.2 fishing-event table: pots lifted
Daily records where the number of pots lifted was over 500 or was null (missing) were given an error rating of 3. Records where the number of potlifts was zero while the catch was greater than 0 were also given an error rating of 3. An error rating of 2 was applied to those records where the number of pots lifted was 3 times the mean for that vessel in that month, or 3 tima the number of pots held overnight, and the number of pots lifted was more than 60 (Table 25).
Low numbers of pots may arise because of bad weather, thus low outliers were identiiied in relation to the catch r&e on that day. An error rating of 2 was applied to those records where the number of pots lifted was leas than or equal to 10 and the daily catch rate was greater than 30 kg/pot (Table 25).
7.3.3 estimated-subcatch table: specles code
There were 129 species codes recorded with associated estimated catch weight in the estimated-subcatch table over the period 1 October 1989 to 31 ~ a r & 2003. Jarus edwardsii accounted for 89 to 98% of the estimated catch weight in the nine QMAs for this period (Table 26).
7.3.4 estimated_subcatch table: catch weight
Range checks were done on catch-weight field for those records wbere species-code was "CRA", with m r ratings greater than zero assigned to estimated catch weights greater than 2000 kg or which were null (Table 27).
7.3.5 estimated-subcatch table: duplicates
Thae are some instances where, for a single fishing event, there are multiple records of estimated catch for "CRA". For each fishing event, we accepted the record which had the highest estimated catch weight for CRA and marked any other records for CRA for that fishing event with duplicate error=3 (Table 28).
7.3.6 landing table: green weight
Checks were also done to compare the green-weight field with the weight calculated h m the product of unit number, unit-weight, cowjactor fields. Bentley (2001) found that there were often errors in these additional fields. In particular, it appeared that, in many instances, the total landed weight is entered into the unit-weight field. Where the green-weight is correct, this causes the calculated weight to be several 'times higher than the green-weight (Bentley 200i). To reduce the chance of incorrect green weights being included, records w a e marked where the green-weight was greater than the calculated weight and was also greater than a specified threshold (Table 29). In these cases, we replaced the landed green weight with the calculated green weight.
Range checks were then done on the landed green weights, after perfarming the green weight outlier checks described in the previous paragraph. Green weights outside the specified ranges wme marked with an appropriate error rating (Table 30).
7.3.7 landing table: duplicates
Duplicates in the landmgs data were detined as having the same landing-datetime, species-code, fishstock-code, state-code, destination-type, qrn-key, vessel-key, green weight, green-weight type. Duplicates were calculated only for destination-me L where green-weight was over 100 kg (Table 31). Many of these combinations were repeated several times (up to 12 times) and these have the

potential to distort aggregate laadings. For example, in one case, it was recorded that 999.8 kg was landed eight times by the same vessel on the same day. Only the h t record was given an error rating of 0 and the other records for the fishing event were given an error rating of 3.
7.3.8 landing table: destination-type
The "Catch Landing Data" part of the CELR form includes a section on the destination of the catch. Most catch by green-weight is recorded under destination-me 'L' (fish or fish product conveyed or sold to a licensed fish receiver at the time of landing; Table 32). However, a significant proportion of the catch is recorded as retained on board or placed in a holdmg receptacle (destination-Wpe R, P or Q) (' A unique "replog" code is assigned to every extract provided h m the data held by MFish. Table 33). This catch is presumably landed at a later date.
Anecdotal information suggests that this practice has been increasing through time, which is confirmed by an increasing ratio of retained (R,F',Q) to landed Q catches in many of the CRA QMAs (Table 34). These catch-weight ratios suggest that up to about 30% of catches in CRA 6, CRA 8, and CRA 9 may be retained before they are landed.
However, many of the records where destination-@e is R, P, or Q have zero entered for green-weight, particularly in earlier years. Thus, comparisons of landed versus retained catches based on green-weight may underestimate the extent to which catches are retained before landing. Indeed the proportion of records where the destinution-@e was R, P or Q suggests that the frequency of retention is high for a number of areas (Table 35).
7.3.9 Correcting catch weights: linking the fishing-event, estimated-subcatch and landing tables
On CELR forms, effort and estimated catches are entered by fishers in the "CatchO3fort Data" part of the form. Verified landed weights are entered in the "Catch Landing Data" part of the fom. Up until 1997, CPUE had been derived using the estimated catches in the "CatchfEffort Data" part of the form. However, primarily because of the erroneous inclusion of sub-legal lobsters in atimated catches by most fishers in CRA 5, landed catches started to be used in the standardisation procedure. Vignaux & Kendrick (1998) used landed catches to calculate CPUE for CRAs 3, 4 and 5 up to 1997-98. Since 1998, landed catches have been used for all CPUE standardisations.
To calculate CPUE, landings from the "Catch Landmg Data" part of the form must be associated with effort data h m the "Catch/Effort Data',. part of the form. There are a number of ways in which this can be done. We examined 10 methods which are grouped into 5 related procedures (labelled A to E).
Method A: by vessel-month-area using potlifts
This was the first method used to correct estimated catches for rock lobster. It was described by Vignaux & Kendrick (1998) who used it to correct estimated catches for CRAs 3,4, and 5.
The method estimates the total catches by each vessel in each month in each area. The sum of landings for a vessel in a month are apportioned to statistical areas according to the proportion of effort that the vessel expended in each area.
D

where C,,, is the corrected catch for vessel v during month m in area a, P,,,,, is the sum of pots
lifted by vessel v during month m in area a, and L , , is the sum of landing for vessel v during month
m. By apportioning landings using potlifts, this method assumes that within a month, the catch per potlift in each of the areas fished by a vessel is equal. Most vessels fish within a single statistical area in each month so the effects of this assumption being wrong are likely to be small.
Vignaux & Kendrick (1998) error checked the monthly totals of catch and pots. In our implementation, to maximise consistency with the other correction methods, we perform error checking on the strata totals. The total landings for a vessel in a month, L , , , are calculated, excluding
all landing records where green-weight-error, duplicate-error, or calc-error are greater than 1. The total number of potlifts for a vessel in a month in an area, Pv,,,a, is calculated excluding all
fishing-event records where start_stat-area-code-error orpot.-l13ed-error are greater than 1.
In most QMAs this method produced CPUE values similar to estimated catches for most years. The greatest difference occurs in CRA 5 where corrected CPUE was lower than estimated. This method caused an upward correction from 1996-97 to 1998-99 in CRA 3 and CK4 4, and h m 1995-96 to 200041 in CRA 1 (Figure 4).
Method 8: by vessel-month-area using estimated catch
This method is similar to method A except that landings are apportioned according to estimated catches. That is, rather than assuming that catch rates are equal in the areas fished by a vessel in a month, it assumes that any bias in estimated catches for a vessel is consistent across areas.
- E"fl.0 c,,, - =v,m C E " . ~ , D
a
where E,,,, is the sum of estimated catches for vessel v during month m in area a.
Method 82
There is a significant percentage of vessel-months where effort was recorded but there were no landings (Table 36). The CPUE standardisation excludes any vessel-month-area combinations that have catches which are zero. If vessels are indeed holding catches over from one calendar month and landing in the next month, this exclusion wuld bias upwards CPUE estimates. The Rock Lobster Fisheries Assessment Working Group suggested that an adjustment be made so that landings are apportioned to previous months that have zero landings.
Some vessels have a long series of months with zero landings (e.g., Table 37, Table 38). It is very unlikely that a vessel would be fishing but not land any catches for more than a month. Zero landings may occur because errors in the landing table have been screened out (see Sections 7.3.6, 7.3.8) and thus the vessel has no valid landings for the month. They may also occur because the landings did not have any records for that vessel in that month. To prevent landings being erroneously apportioned to months from which they were not taken, and thus biasing downwards catch rates, we apportioned catches only to the previous month. Apportioning was done according to the estimated catches (E,, and Eva+,) :

where L:, is the apportioned landings, rn is the month having zero landings, and m+l is the following month having positive landings.
This methodhas the greatest effect in CRA 8 (Table 39). It performs well where a vessel appears to be holdmg small amounts of catches lo be landed in the following month (Table 40A). However, in other instances the method appears to fail to apportion landings to months when it was unlikely that landings were actually zero (Table 40B). Thus this method also has the potential to downwardly bias catch rates.
Method 83
Apportioning catches is one way to account for the holding over of catches from one month to the next. However, it is not robust to errom in the database. A more robust method is to exclude data. Method B3 excludes all months for a vessel-year where at least one month had zero landings. However, this method excludes a very large number of records, particularly in CRA 8, because there are many vessels that have zero landings at some time during the year vable 41).
Method 84
This method excludes months that have zero landings and the subsequent month for that vessel. This method generally excludes less than 5% of vessel-month-statistical area combinations in most fishing years and CRA areas, with higher levels of exclusion in CRA 8 (Table 42). This method is considered more robust than methods B1, B2, or B3 because it accounts for the holding over of landings &om one month to the next with the fewest assumptions and excludes the least amount of data.
Methods B1 and I34 produce similar CPUE trends in most CRA areas (Figure 5).
Method C: by form number
Method C1
Each CELR form has a unique number which can be used to link fishing-event records with the landing records that were on the same CELR form. Thus, landings for a form can be apportioned to fishing events based on the estimated catch for each fishing event on that form:
whereC, and E, are respectively the corrected and estimated catch for hhing event e, ZE, and =f
L, are respectively the sum of estimated catches and sum of landings for formf:
The sums of estimated catches and landings were calculated only for forms that badno records with an error rating of greater than 1 for estirnated_subcatch,catch-weight, landinggreen-weight-error, 1anding.duplicate-error or landing.calc-error. If a form did not satisfy this condition, then a corrected catch was not calculated for any of the fishing events associated with this form. This ensures that both the catch and effort are excluded fiom totals.

In some areas, a large proportion of fishing events do not have a correspondmg l a n k (Table 43). This appears to arise because fishers often retain catch in holding pots or tanks on land and do not necessarily land lobsters on every day that they fish (see Section 7.3.8). The retained catch is landed on a subsequent date.
A corrected catch can be calculated only for fishing events which have a corresponding landing. Consequently, when aggregating catch and effort into monthly totals, only fishing events, and hence the number of potlifts, fiom forms where a landing 0ccun:ed will be included. Other potlifts, which may have contributed to the catch but which are on different forms, are not included in the monthly totals when using this method. This is illustrated in Figure 6 which shows the total catch and potlifts for each vessel-month-area combination calculated using methods B1 and C1. In CRA 7, where most fishing events can be associated with a landing on the same form (Table 43), there is little difference between the total catch and number of pots between the two methods. However, in CRA 8, where a large proportion of forms do not have a landing, the total number of pots for method C is always less than it is for method B while the catch totals are similar, resulting in biased CPUE calculations.
Thus, when there are a large number of fishing events without landings on the same form, this method biases CPUE upwards. In most areas this method produced CPUE estimates that were higher than when no correction was used (Figure 7). The exception was CRA 7. The extent of this bias will be related to the proportion of forms that do not have a landing.
Method C2
This method attempts to account for the lack of landings on some forms. Rather than ignoring those forms that do not have a landing, where there is no L, for a fishing event, L, is set to 0. This means
that the corrected catch will be zero for that form. This is an unsatisfactory method for correcting catches on small time scales, but should produce unbiased estimates of CPUE when aggregated to a month (Figure 7). However, this method will also have diftlculty where there are prolonged periods of zero landings, and thus also has the potential to be positively biased.
Method D: by trip
Every trip is assigned a unique number when it is entered into the Wish catchleffort system and a trip may span a number of forms. Thus this method is similar to Method C but uses the trip number to associate landings with fishing events rather than the form number,
whereC, and E, are respectively the conected and estimated catch for fishing event e, E, and L, OEt
are respectively the sum of estimated catches and sum of landings for trip t . This method is subject to the same assumptions and biases which were described for Method C1, but there is some evidence that the failure to match effort and landings is slightly less severe at the kip level than at the form level (Table 44). However, there still are a large proportion of trips which have no 'L' destination-we in the landing data, particularly in CRA 8 (Table 45). Accordingly, the resulting CPUE series appears to be positively biased (Figure 8).
Method D2
This method is analogous to Method C2, in that it attempts to correct for the positive bias in Method Dl by assigning a landed catch weight (L,) of zero to the trips with no reported landmgs. As for Method C2, this wrrection results in a CPUE series that appears to be less biased, but will be still vulnerable to long periods of zero landings (Figure 8).
Method E: by landing date
The problem with methods C and D is that effort expended to take catch during a trip, or entered on a form, results in catch that may not be landed when the vessel returns to port. This occurs when catch is retained (in a holding pot or on land) and thus is not landed (and sold) for some time. This effectively disassociates the effort ffom the catch. A possible way to overcome this problem and to allocate landings to effort is to assume that all retained catches are landed at the following landing.
To implement this method, we needed to determine the next landing date for each fishing event. The sum of landings for each landing date is then apportioned to fishing events according to the estimated catch,
whereC, and E, are.respectively the corrected and estimated catch for fishing event e, ZE, and A d
Ld are respectively the sum of estimated catches and sum of landings for landing dated .
For each fishing event we determined the next landing date for that vessel. Of the 517 251 events in thefishing-event table, 512 349 had a landing for that vessel that occwed on or after the date of the fishing event. In most areas, a high proportion of fishing events have a landing on the same day (Table 46). In CRAs 3, 4, and 7, at least 99% offishing-events had a landing within 4 days (Table 46). However, in some areas, a greaterproportion of fishing events had an extended period between fishing and the next landing. For example, in CRA 8, only 34% offishing-events had a landmg on the same day and 90% within 9 days of the fisbing event (Table 46).
In some instances the next landing date was more than a year from the fishing event. Since these landings are unlikely to be related to the fishing event, we linked only fishing events with landings that were within 59 days of landing (i.e., we excluded all that were 60 days or more). Less than 1% of qualifying fishing event records could not be matched with a corresponding landing in most fishing years and QMAs (Table 47).
Method E produces CPUE indices that are similar to methods A and B4 in some QMAs (e.g., CRA 1, CRA 8) and similar to methods C and D in others (e.g., CRA 4, CRA 5, CRA 9) Figure 9). It is likely that the linlnng of landings by date may not overcome the problem of disassociation of catch with effort when catch is held for long periods to satisfy market demands or other economic imperatives.
8. QUOTA MANAGEMENT RETURNS (QMR) AND MONTHLY HARVEST RETURNS ( M W
The QMR database provides data on total catches by month and quota management area. There are three tables in the CRACE database that relate to QMR and MHR data. The table qmr contains monthly QMR data for October 1989 to September 2001. The table qmr-old contains QMR data obtained from the Ministry of Fisheries by one of us (PJS) in 1998. These data have records from October 1985 to September 1989 that the qrnr table does not have. However, for 1985, 1986, and 1987

all the catch is incorrectly assigned to CRA 1. The mhr data contains records fkom October 2001 to the present.
No error screening is necessary on these datasets. To create a continuous data set on monthly catches since the beginning of the 1986 fishing year (1 April 1986) we combined the qmr-old, qmr and mhr data sets in the following way:
(a) 1986-W: Apportion the total annual catch in qmr-old by QMA according to the distribution of catch by QMA recorded in the FSU data for those years (Qqmr-oldCatchFYQU4)
@) 1988-89: Use qmr-old (QqmtmhrUnion)
(c) 1990Sept. 2001: Use qmr (QqmrmhrUnion)
(d) Oct. 2001-present: Use mhr (QqmtmhrUnion)
The resulting catches by fishing year and quota management area are provided inTable 48.
9. DISCUSSION
We have described a standardised methodology for extracting and storing catch and effort data which are relevant for the stock assessment of rock lobster. A range of data sources is required due to the long history of the rock lobster commercial fishery in New Zealand. Our confidence in the quality of these data vary, depending on the level of supporting information which is available, allowing us to draw conclusions about the W t y of the data based on how the data have been gathered.
''
In general, our confidence in the data before 1979 is low because most of these data consist of summed catches collected by port of landing, which are difficult to validate. The exception to this are the data collected between 1962 and 1973, reported by Amala & King (1983). More detailed supporting information is available for this data set, including the statistical area of capture and the method and date of capture. However, even for this data set there are strong reservations because the base underlying information from which the summaries have been derived bas not been located.
Although we have more confidence in the detailed vessel-specific information available since 1979, first from the FSU system and then from the Wish WAREHOU database, there still remain some serious difliculties wen with these data.
1. There are a considerable number of serious errors in the data. This requires an elaborate system of error-checking which has been automated in the CRACE database and documented in this report. Using these data without prelimhy error screening would lead to serious biases in most subsequent analyses.
2. There are considerable uncertainties in the approp&te level of catch to assign to the effort informatioa The design of the present Wish data system is not optimal for linking these two types of information and this document describes a range of methods which can be used to correct for the design deficiencies. However, none of these methods is fully satisfactory and consequently there is uncertainty as to which method is best to apply. It is possible that, because of the differences in the fisheries between the various CRA QMAs, different methods should be applied to different QMAs to account for variations between fisheries.
We describe 10 methods for associating catch and effort at the vessel-rnon&statistical-area stratum level so that standardised CPUE analyses can be performed. An eleventh method is inferred and all 11 methods are summarised and reviewed in the list below:
1. Estimated catches This is the most straightfornard source of catch information available which has the advantage of being linked explicitly in the database to the relevant effort information. However, these catch data are flawed for two reasons: a) they are unvalidated estimates; and b) there are inconsistencies in the instructions given to fishermen for what catch

to put in this category, depending on the location of the %hery. This has been most obvious in CRA 5 where fishermen were instructed for many years to include all rock lobster in this total, including sub-legals and baTied females. There are reports of similar instructions being given to fishermen in other CRA QMAs as recently as May 2005. This inconsistency in reporting means that CPUE based on estimated catches may not be representative of legal landed rock lobster.
Method A This method apportions the monthly landed catch by vessel to each statistical area based on the distribution of effort. This method is probably not optimal, particularly for extended trips, because it assumes that CPUE is constant across statistical areas within a month for a vessel.
Method B1 This method apportions the monthly landed catch by vessel to each statistical area based on the distribution of estimated catch This method is better than Method A, but fails to take into account the high proportion of vessel-monkea strata which have zero landed catch.
Method B2 This method also apportions the monthly landed catch by vessel to statistical areas based on the distribution of estimated catch, but it does this on the basis of combining the catch of adjacent months for a vessel. Essentially this method changes the base stratification of the analysis to two-month blocks rather than a single month block This method perfoms better than Method A or Method B1, but fails where there is a succession of months which have zero landed catch.
Method B3 This method is the same as Method B1 except that all data for a vessel-year stratum are dropped if any month in the year has zero landings. This method assumes that the vessels which land consistently are repmentative of the overall CPUE for legal-sized lobster. However, this method leads to high levels of data loss in areas where retention of lobster before landing is frequent, making the assumption of representativeness untenable.
Method B4 This method is similar to Method B3, except that, instead of excluding the data for an entire vessel-year stratum when there are months with zero landings, only the vessel-month with zero landings and the subsequent month are excluded. This results in an acceptable level of excluded catch in all QMAs, even those where lobster retention is high, allowing for a more credible assumption of representativeness for the remaining data.
Method C1 This method links the landed catch by vessel to the appropriate effort for each individual reporting form. This method would probably work well if there was confidence that the hdmgs on the form were consistently associated with the effort on the same form. However, this is unlikely, given that there is no landed catch at all for a significant proportion of forms in many QMAs. This results in a positively biased CPUE series because this method drops the effort associated with forms with z m landmgs.
Method C2 This method is the same as Method C1, except that the effort associated with forms with zero landings are included in the effort totals by assigning a catch of zero to the landing. This method appears to be less biased than Method C1, but is stiU not completely satisfactory because effort from long periods (generally longer than a month) with no landings at all will still be dropped by this method, given the underlying monthly strafication.
Method D l This method is the same as Method C1, except that the linking of landed catch with effort is done at the trip level rather than the form (a trip may consist of more than one form). This method has the same shortcomings and results in a positive bias as described for Method C1.
Method D2 This method is the same as Method C2, except it is performed at the trip level rather than the form level. Again this method has the same shortcomings as described for Method C2.
Method E This method links effort to landings on the basis of date, making the assumption that all effort between landing events for a vessel can be associated with the catch recorded on the next landing. This method provides results that are intermediate between Method B4 and the C and D methods, indicating that the tenability of the method assumption likely varies between

QMAs. It seems that thismethod would also not perform well when lobster are held for long periods before being landed and sold.
The Rock Lobster Fishery Assessment Working Group reviewed these 11 methods of associating catch and effort for rock lobster standardised CPUE analyses and concluded that Method B4 was potentially the least biased and most reliable of the methods presented. This conclusion was reached because fewer data were dropped compared to Method B3 and that each of the other methods considered was potentially biased, particularly when there were long periods of lobster retention in holding pots.
10. REFERENCES
Annala, J.H.; King, M.R (1983). The 1963-73 New Zealand rock lobster landings by statistical area. Fisheries Research Division Occasional Publication: Data Series No. 11. 20 p.
Annala, J.H.; Esterman, D.B. (1986). Yield Estimates for the New Zealand rock lobster fishery. In: Jamieson, G. and Bourne, N. (eds.) North Pacific Workshop on Stock Assessment and Management of Invertebrates. Canadian Special Publication Fisheries &Aquatic Sciences 92: 347-358.
Annals, J.H.; Sanders, BM. (1981). The 1979 New Zealand rock lobster landings. Fisheries Research Division Occasional Publication: Data Series No. 1.28 p.
Annala, J.H.; Sullivan, K.J. (comps.) (1999). Report from the Mid-Year Fishery Assessment Plenary, November 1999: Stock assessments and yield estimates. ftJn~ublished report held in NZWA . +
Greta Point library, Wellington) 45 p.
Bentley, N. (2001). An audit of catch and effort data from the Chatham Islands (CRA 6) rock lobster fishery. New Zealand Fisheries Assessment Report 2OOl/6l. 24 p.
Bentley, N, Breen, P A ; Starr, P.J.; Kendrick, T.H. (2001). Assessment of the CRA 3 andNSS substocks of red rock lobster for 2000. New Zealand Fisheries Assessment Report 2001/69. 84 p.
Breen, P.A.; Kim, S.W.; Starr, P.J.; Bentley, N. (2002). Assessment of the red rock lobster (Jasus edwardsii) in area CRA 3 in 2001. New Zealand Fisheries Assessment Report 2002/27.82 p.
Booth, J.D.; Robinson, M.; Stan; P.J. (1994). Recent research into New Zealand rock lobsters, and a review of rock lobster catch and effort data. New Zealand Fisheries Assessment Research Document 94/7.56 pp. (Unpublished report held inNIWA library, Wellington)
Bradford, E. (1 997). Estimated recreational catches from Ministry of Fisheries North region marine recreational iisbing surveys, 1993-94. New Zealand Fisheries Assessment Research Document 97/7. 16 p. (Unpublished report held in NIWA library, Wellington.)
Bradford, E. (1998). Harvest estimates £tom the 1996 national marine recreational fishing surveys. New Zealand Fisheries Assessment Research Document 98/16. 27 p. (Unpublished report held in NIWA library, Wellington.)
Kim, S.W.; Bentley, N.; Starr, P.J.; Breen, P.A. (2004). Assessment of red rock lobsters ( J m s edwardsiz] in CRA 4 and CRA 5 in 2003. New ZealandFisheries Assessment Reporf 2004/8. 165 pp.
Maunder, M.N.; Starr, P.J. (1995). Rock lobster standardised CPUE analysis. New Zealand Fisheries Assessment Research Document 9Y11.28 p. (Unpublished report held in NIWA library, Wellington.)
Ministry of Fisheries (2004). WAREHOU database documentation: base views and fields. Version 5.0. 62 p. (Unpublished report held by the Ministry of Fisheries, Wellington, N.Z.)
Sanders, B.M.; (1984). The 1983 New Zealand rocklobsterlandings. Fisheries Research Division Occasional Publication: Data Series No. 16.31 p.

Sullivan, R.J (comp.) (2004). Report from the Mid-Year Fishery Assessment Plenary, November 2004: Stock assessments and yield estimates. (Unpublished report held in NIWA Greta Point libmy, Wellington) 47 p.
Teimey, L.D.; Kilner, A.R.; Milla, R.B.; Bradford, E.; Bell, J.D. (1997). Estimation of recreational harvests f?om 1991-92 to 1993-94. New Zealand Fisheries Assessment Research Document 97/15. 43 p. (Unpublished report held inNIWA library, Wellington.)
Vignaux, M.; Kendtick, T.H. (1998). CPUE analyses for rock lobster substocks and QMAs to 1997. New ZealandFhheries Assessment Research Document 98119.24 p. (Unpublished report held in NIWA library, Wellington.)
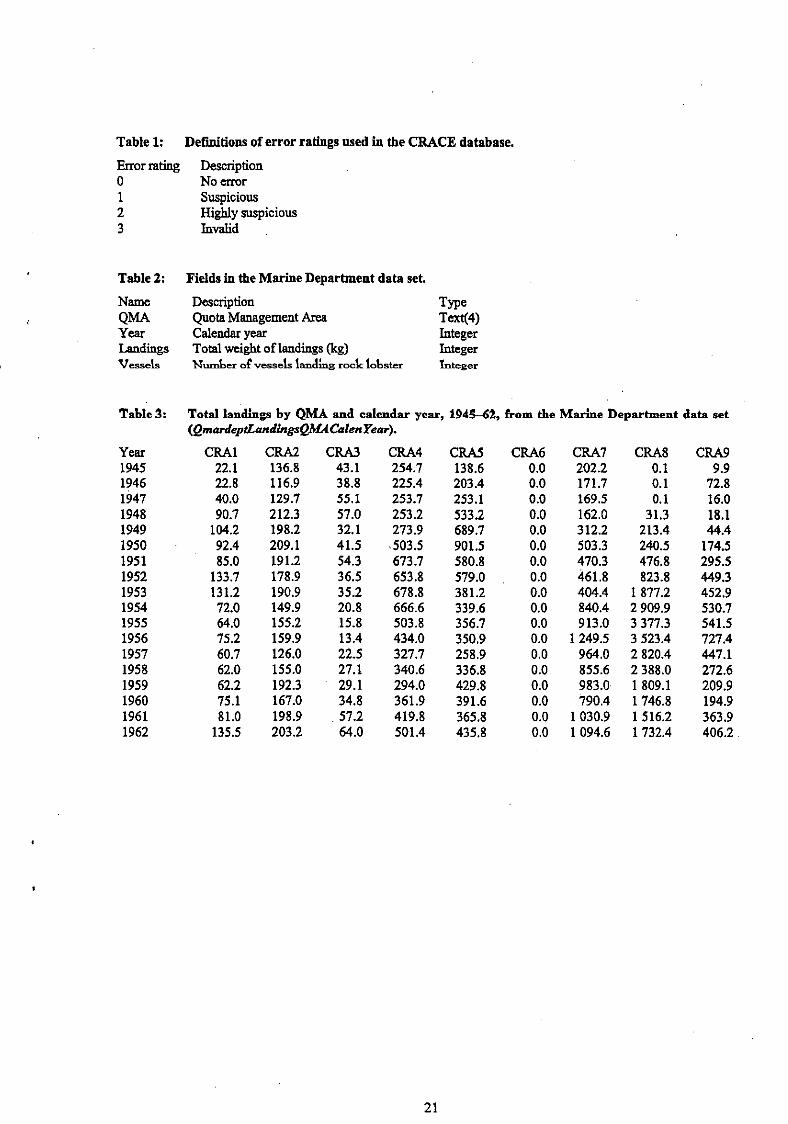
Table 1: Definitions of error ratings used in the CRACE database.
Error rating Description 0 No error 1 Suspicious 2 Highly suspicious 3 Invalid
Table 2: Fields in the Marine Department data set.
Name Description T W QMA Quota Management h a TexY4) Year Calendar year Integer Landings Total weight of landings (kg) Integer V-eh Number of vessels land& rock lobster Integer
Table 3: Total landings by QMA and calendar year, 194562, &om the M&e Department data set
Year CRAl 1945 22.1 1946 22.8 1947 40.0 1948 90.7 1949 104.2 1950 92.4 1951 85.0 1952 133.7 1953 131.2 1954 72.0 1955 64.0 1956 75.2 1957 60.7 1958 62.0 1959 62.2 1960 75.1 1961 81.0 1962 135.5

Table 4:
Year 1945 1946 1947 1948 1949 1950 1951 1952 1953 1954 1955 1956 1957 1958 1959 1960 1961 1962
Table 5:
Name Year Month Area Tme Method Days Catch
Table 6:
Number of vessels fishing for rocklobster by QMA and calendar year, 194562 from the Marine Department dsta set (QmardeptVesseLsQM4CalenYear).
Fields and associated codes available in the Annals & King data set.
Description Calendar year Calendar month Statistical area (1-24; see ) . Pmcessing type, 0 = tails, 1 = whole Fishing method 2 = trawl, 7 =hand, 8 =pots, 19 =pots, other codes unhown Number of days fished Catch in pounds whole weight
The percentage of catch recorded by method in the Annala &King data set.
Method Proportion of catch 1 <0.1 2 1 .o 3 <0.1 4 co.1 5 <O.l 7 0.2 8 91.9 9 <0.1 15 CO.1 16 <O. 1 18 0.1 19 6.7
0 0 0 11 46 35 67 74 84 95 109 117 113 119 119 118 113 113
Tme Integer Integer Integer Integer Integer Integer Integer

Table 'l: Matrix for apportioning catch and effort from old statistical areas used in the Annala & King data set Italidsed numbers represent assumed proportions used to apportion old statistical areas which straddle across current QMA boundaries.
Old OMA Area 1 2 3 4 5 6 7 8 9 1 1 2 1 0 3 1 4 1 5 0 1 6 0 1 7 1 8 0.4 0.6 9 10 11 1 12 1 13 14 I5 16 17 18 19 20 21 22 23 24
Table 8: Catch (t) by QMA and fishing year. Catch and effort apportioned to QMAs based on proportions provided in Table 7 (QannkingCatcheMAFY).
Fishing year 1963-64 1964-65 196566 196647 196768 196849 1969-70 1970-71 1971-72 1972-73
CRA 2 241.2 261.1 262.4 295.9 335.7 319.5 264.0 206.1 178.5 203.8
CRA 5 393.3 460.4 626.9 482.6 459.1 407.9 402.7 395.1 427.5 424.9
CRA 6 0.0 0.6
250.6 1 874.9 4 611.9 6 163.7 3 171.8 1250.8 997.1 911.5

Table 9: Catch rate (k%day) by QMA and fishing year. Catch and effort apportioned to QMAs based on Table 7 (QannkingCatchRateQiUAFu).
Fisbingyear CRA1 CRAZ CRA3 CRA4 CRA5 CRA6 CRA7 CRA8 CRA9 1963-64 196465 1965-66 1966-57 1967-68 196849 1969-70 197&71 1971-72 1972-73
Table 10:
Period 37 38 39 40 41 42 43 44 45 46 47 48 49 50 51 52 53 54 55 56 57
Catch (t) by QMA and assessment period (Period 37=Apr&September, 1963; Period 57=April-September, 1973). Catch and apportioned to QMAs based on Table 7 (QannkingCatchQMAPerioa).

Table 11: Catch rate (kglday) by QMA and assessment period period 37=AprilSeptember, 1963, Period 57=AprilSeptembw,l973). Catch and effort apportioned to QMAs based on Table 7 (QannRingCatcMateQUeriod).
Period CRA 1 37 42.19 38 57.23 39 49.40 40 104.45 41 42.24 42 98.85 43 43.16 44 55.66 45 33.36 46 70.29 47 31.28 48 43.97 49 36.85 50 45.19 51 35.86 52 64.63 53 38.87 54 47.42 55 20.24 56 21.94 57 14.95
CRA 2 37.61 39.40 4 1 .OO 41.24 34.72 36.78 35.79 40.66 39.43 42.63 28.25 32.66 20.83 24.1 1 21.31 28.35 21.44 27.33 21.27 27.51 18.47
CRA 6
- 32.23 4.54
600.87 939.70 930.45
1304.00 756.71 640.23 464.12 204.79 238.91 131.43 150.40 116.09 160.13 133.81 188.30 107.66
Table 12:
Name Year QMA Days Catch
Table 13:
Year
# 1974 1975 1976
< 1977 1978
Fields and associated codes available in the Annala & Esterman data set
Description Calendar year Quota management area Number of days fished Catch in kilograms (to nearest 1000 kg)
TYPO Integer Text(4) Integer Integer
CRA 9 44.96 48.70 45.34
138.79 112.32 134.35 92.56 78.32 52.15 55.63 58.93 74.50 38.03 36.33 43.66 62.03 48.93 43.21 46.08 46.55 35.77
Catch (t) by QMA and calendar year, 197449'78, from the Annala and Esterman data set (QannestCatchQM4Pear).
CRA 1 45 78 99
182 126

Table 14: Number of days fished by QMA and calendar year, 19741978, from the Annala and Esterman data set (QanneslDllysQMAYear).
Year CRAl CRA2 CRA3 CRA4 CRA5 CRA6 CRA7 ' CRA8 CRA9 1974 1599 6204 3894 8152 8778 4125 5013 17621 ? 1975 2144 5520 3115 8414 11583 3352 6545 16701 ? 1976 2490 5760 3736 9304 10611 2750 6238 19310 ? 1977 3853 7968 4583 8580 10422 3695 6388 16811 ? 1978 2936 7800 3712 8075 9513 4468 7673 18793 ?
Table 15: Comparison of the number of records, the total number of pot lifts, and the sum of catches between the 1992 and 1998 extracts of FSU data.
Year 1979 1980
1998 extract Records Potlifts Catch Catchl Potlifts
65 224 3 452 337 4 543 899.2 1.32 61 391 3 529 912 4 537 915.8 1.29 60 020 3 697 175 4 527 009.3 1.22 62 075 4 117 207 4 773 533.2 1.16 66 558 4 681 324 5 001 899.1 1.07 71608 5442839 5460013.2 1 .OO 69 602 5 637 617 5 507 097.7 0.98 64 828 5 518 602 5 349 091.9 0.97 57 357 4 980 406 4 420 496.3 0.89 48 096 4 172 731 2 998 197.9 0.72 19 079 1 610 247 1 041 764.4 0.65
48 2419 1839.6 0.76 645 886 46 842 816 48 162 758 1.03
1992 extract where catch > 0 Records Pot lifts Catch Catchl Potlifts
64 932 3 388 807 4 535 890 1.34 61 435 3 463 574 4 541 831 1.31 60 106 3 448449 4 528 714 1.31 61 998 3 642260 4764 309 1.31 64 921 4 192 123 4 965 330 1.18 70338 4905348 5405980 1.10 68 588 5 215 905 5 455 169 1.05 63 878 5 147 029 5 297 820 1.03 57 059 4 509 287 4 389 314 0.97 47 853 3 739 373 2 968 663 0.79 18 919 1417 351 1 023 875 0.72
48 2 419 1 829 0.76 640 077 43 072 085 47 878 815 1.11
I Table 16: Number of records by FSU statistical area error rating.
Rating Checks Query Records 0 - 735 099 1 - 0 2 <5% of records for base region and >4 areas away from E@m_stat-areaOut1ier 2 261
modal area for base region 3 Null or <901 or >943 E@m-stat-areaRange 1332
Table 17: Example of consecutive records for a single vessel illustrating catch being recorded only at the end of trip.
Date 1/09/84 2/09/84 3/09/84 4/09/84 5/09/84 6/09/84 9/09/84 10/09/84 11/09/84 14/09/84 15/09/84 16/09/84 24/09/84 25/09/84 26/09/84 27/09/84
Pots Catch 38 0 58 0 38 0 58 0 63 0 80 934 20 0 39 0 38 0 35 0 30 0 50 484 60 0 14 0 18 0 45 0

Table 18:
Date 2/08/84 3/08/84 4/08/84 5/08/84 7/08/84 8/08/84 17/08/84 18/08/84 20/08/84 21/08/84 22/08/84 23\08/84 24/08/84 25/08/84 28/08/84 29/08/84 30/08/84
Example of consecutive records for a single vessel illustrating the number of pots entered only for the first day of the month. Note that U." indicates "missing" data in the field.
Pots Catch 75 0
151 0
132 0
104 0
78 0 0 0
250
Table 19: Number of records by FSU aggregated days error rating.
Rating Checks 0 - 3 >31 days
Table 20: Number of records by FSU aggregated catch error rating.
Rating Checks 0 1 >ZOO0 kg/day 2 >3000 kglday 3 MOO0 kg/day
Query Records - 60 666
EQf.su_agg-catchRange 90 Eefm-agg-catchRmge 42 Eefs~agg-catchRmge 38
Table 21: Number of records by FSU aggregated pots error rating.
Rating Checks @W Records 0 - 58 431 2 110 poWday and >30 kglpotlift EQfisu_agggotsLow 4 3 Null or >500 poWdays or 0 but catch >O Eefsu-agggotsRange 65
Table 22: Catch (t) by QMA and fishing year from the FSU data set. (efsu-aggCatchQMXTJ
Fishing year CRAl CRA2 CRA3 CRA4 CRAS CRA6 CRA7 CRA8 1979-80 115.04 292.93 480.26 503.66 401.99 400.32 403.42 1725.58 1980-81 179.79 445.96 606.34 607.71 505.10 355.88 297.76 1463.40 198142 183.31 390.98 574.07 614.24 476.02 465.37 267.00 1395.68 1982-83 222.90 326.58 733.90 853.50 625.51 471.67 129.45 1502.41 1983-84 231.70 274.62 763.71 940.39 599.09 547.70 109.15 1524.86 1984-85 211.60 270.26 708.93 863.27 721.93 491.96 191.66 1 549.29 1985-86 218.76 337.68 654.08 847.95 724.58 603.63 319.91 1865.57 1986-87 2d4.85 266.32 552.26 918.02 606.68 562.28 316.93 1550.33 1987-88 165.78 224.67 313.89 820.71 438.51 396.09 261.25 1470.67 1988-89 112.07 190.08 243.37 684.85 304.06 329.74 132.72 759.36
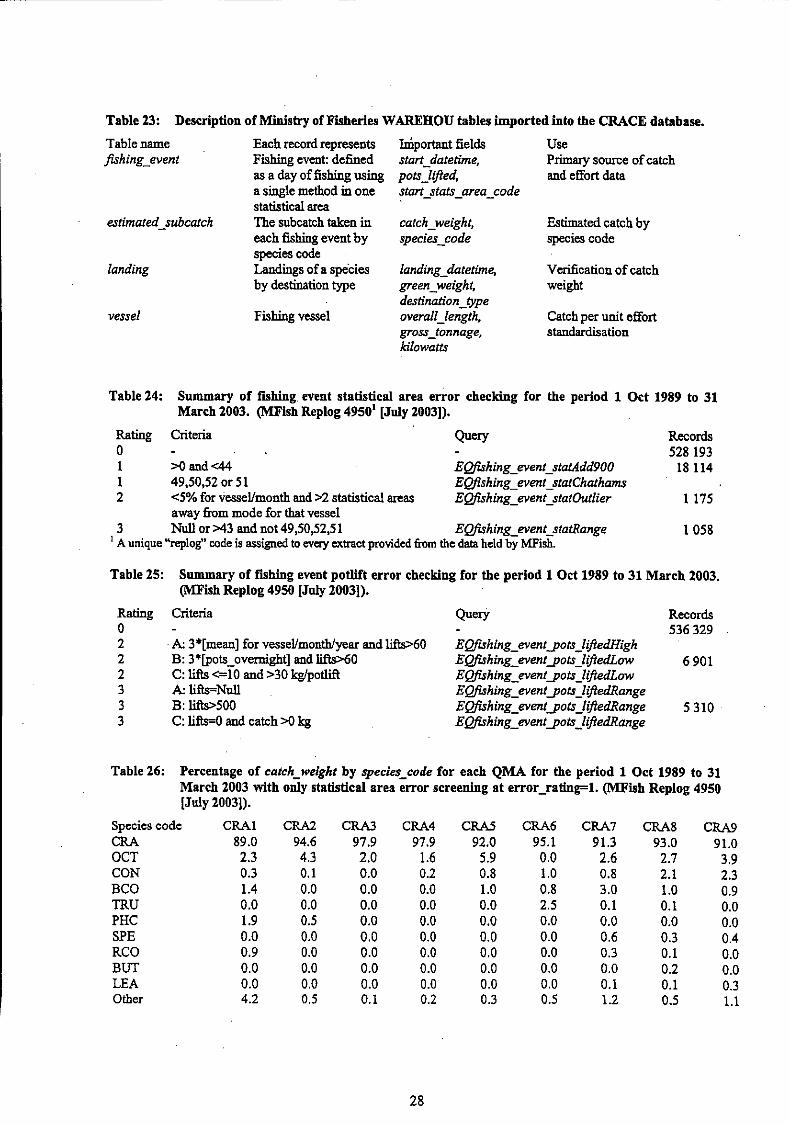
Table 23: Description of Minishy of Fisheries WAREHOU tables imported into the CRACE database.
Table name fishing-event
estimated-subcatch
landing
vessel
Each record represents Fishing event: dehed as a day of fishing usu a single method in one statistical area The subcatch taken in each fishing event by species code Landings of a species by destination type
Fishing vessel
hiportant fields start-datetime, pots-[ifred, start_stats-area-code
catch-weight, species-code
landing-datetime, green-weight, destination-type overal[_[ength, gross-tonnage, kilowatts
Use Primary source of catch and effort data
Estimated catch by species code
Verification of catch weight
Catch per unit effort standardisation
Table 24: Summary of fishing event statistical area error cheeldng for the period 1 Oct 1989 to 31 March 2003. @Wish Replog 4950' [July 20031).
Rating Criteria Quer~ Records 0 - - 528 193 1 =4 and 4 4 EQfishing-went-statAdd900 18 114 1 49,50,52 or 51 Esshing-went-statChathams 2 4 % for vesseYmonth and >2 statistical areas EQfishing-went-stathtlim 1 175
away &om mode for that vessel 3 NuU or M3 and not 49,50,52,51 EQfishing-wen-statRange 1058
' A unique "replog" code is assigned to every extract provided 6um the data held by MFish.
Table 25: Summary of fishing event potlift error checking for the period 1 Oct 1989 to 3 1 March 2003. (MTish Replog 4950 [July 20031).
Rating 0 2 2 2 3 3 3
Criteria - A 3*[mean] for vesseVmontWyear and lifts-60 B: 3*lpots_ovemight] and lifts60 C: lifts <=lo and >30 kglpotlii A: liftn=Null B: W 5 0 0 C: lifts=O and catch 3 kg
Query Records - 536 329 EQfishing-wentjot~~IiftedHigh EQfishing-wentjots-IifredLow 6 901 E@hingEMishing_eventsots_liPedLowwentgotstsIiftedLow E-hing-went~ots~IiftedRmge EQfishing-wentjots-IifredRange 5 310 E@hing-wentjots-IifredRange
Table 26: Percentage of catch-weight by species-code for each QMA for the period 1 Oct 1989 to 31 March 2003 with only statistical area error screening at error-ratin~l. W i s h Replog 4950 [July 20031).
Species code CRAl CRA 89.0 OCT 2.3 CON 0.3 BCO 1.4 TRU 0.0 PHC 1.9 SPE 0.0 RCO 0.9 B r n 0.0 LEA 0.0 Other 4.2

Table 27: Summary of estimated CRA suhcatch catch weight error checking for the period 1 Oct 1989 to 31 March 2003 (MFish Replog 4950' [July 20031).
Rating Criteria @ety Records 0 - 685 976 1 catch >ZOO0 kg and catch<= 3000 kg EQestimated-subcat~h~catchRange 0 2 catch >3000 kg and catch <= 4000 kg EQestimated-subcatch-catchRange 0 3 catch =Null or catch >4000 EQestimafed-subcatch-catchRange 400
' A unique 'kplog" code is assigned to evay extract provided 'om the data held by MFish.
Table 28: Summary of estimated CRA subcatch catch weight duplicate error checking for the period 1 Oct 1989 to 31 March 2003 w i s h Replog 4950 [July 20031).
Rating Criteria Query Reconis 0 - - 685 838 3 wevent-key & species="CRA"]>l and EQestimated-subcatch-duplicate-dupmark 538
[estimated-catch]~M~~[estimated_catch]
Table 29: Summary of landed CRA green weight error checking based on calculated weights for the period 1 Oct 1989 to 31 March 2003 (MFish Replog 4950 [July 20031).
Rating Criteria @W Records 0 468 976 1 >(2*[unit-number]*[unit-weight]*[conv_factor]) and 2200 kg Eelanding-calc-weight1 1 864 2 >(5*[unit-number]*[unitweight]*[conv-factor]) and >500 kg EQlanding_calc-weight2 390 3 >(lO*[unit~munber]*[unittweight]*[conv~factor]) and >I000 kg EQlanding-calc-weight3 272
Table 30: Simmary of landing green weight error checking for the period 1 Oct 1989 to 31 March ZOO3 w i s h Replog 4950 [July 20031).
Rating Criteria Query Records 0 - 468 996 1 landing >2 000 kg and landing <=6 000 kg EQrmdinggreen-weighflange 99 2 landing* 000 kg and landing <=lo 000 kg EQlanding~een-weightRange 19 3 landing=Null or landing>lO 000 kg EQlandingseen-weightkge 2 388
Table 31: Summary of landing green weight duplicate error checking for the period 1 Oct 1989 to 31 March 2003 (MFish Replog 4950 [July 20031).
Rating Criteria Query Records 0 - 470 305 3 N[landing - datetime, species-code, jishstock-code, EQlandingDuplicate 1 197
state-code, qm-key, vesseI_key, green-weight, green-weight-fype]>l and [destination-type]= "L" and [green_weightplOO kg
Table 32: Percentage of landing records by destination-type for each QMA for the period 1 Oct 1989 to 3 1 March 2003 w i s h Replog 4950' [July 20031). See ' A unique "replog" code is assigned to every extract provided from the data held by MFish.
Table 33 for a description of codes. Includes only records wheregreen-weighLenor is 0.
QMA CRA1 CRA2 CRA 3 CRA4 CRA 5 CRA6 CRA7 CRA8
Other 0.6 0.1 0.0 0.2 0.6 0.3 0.1 0.2

CRA9 80.2 15.7 1.3 2.0 0.0 0.4 0.3 ' A unique Ureplog" code is assigned to every extract provided h m the data held by Wish.
Table 33: Descriptions for &nding.desrination-Wpe codes.
Code Description L Fish or fish product conveyed or sold to a licensed fish receiver at the time of landing R F i or fish product retained on board a vessel at the time of landing (introduced October 200 1) P Fish or fish product placed in a holding receptacle in New Zealand fisheries waters (introduced October 2001) Q Fish or fish product placed in a holding receptacle on land T Fish or fish product transferred from a vessel to another vessel or foreign fishing vessel A Fish or fish product of the species or classes of fish subject to the quota management system established under
Part IV of the Act that are returned to, or abandoned in, or accidentally lost at, sea
Table 34: Ratio of retained (codes=R,P, or Q) to landed (code=L) catches for each QMA in each fishing year. Note that these are not proportions of total catches. A value of 1 would mean that all catches are retained before it is landed. Includes only records wheregreen-weight-error is 0.
Fishing year CRAI CRA2 CRA3 CRA4 CRAZi CRA6 -7 CRA8 CRA9 1989-90 0.01 0.00 0.00 0.00 0.00 0.00 0.00 0.01 0.00 1990-91 0.00 0.00 0.00 0.00 0.00 0.00 0.00 0.00 0.00 1991-92 0.00 0.00 0.00 0.00 0.00 0.00 0.00 0.00 0.00 1992-93 0.00 0.00 0.00 0.00 0.00 0.00 0.00 0.01 0.00 1993-94 0.00 0.00 0.00 0.00 0.00 0.00 0.00 0.01 0.00 1994-95 0.00 0.00 0.02 0.00 0.00 0.00 0.00 0.01 0.00 1995-96 0.01 0.02 0.03 0.04 0.07 0.12 0.00 0.03 0.13 199647 0.05 0.21 0.09 0.09 0.12 0.03 0.00 0.03 0.26 1997-98 0.05 0.12 0.10 0.07 0.12 0.06 0.00 0.03 0.28 1998-99 0.01 0.11 0.13 0.10 0.21 0.23 0.01 0.06 0.35 199P-00 0.00 0.11 .0.21 0.14 0.17 0.26 0.00 0.05 0.39 2000-01 0.01 0.13 0.22 0.13 0.18 0.23 0.01 0.07 0.60 2001-02 0.05 0.16 0.35 0.17 0.19 0.27 0.00 0.12 0.47 2002-03 0.12 0.24 0.42 0.18 0.20 0.34 0.00 0.41 0.65
Table 35: Percentage of landing records with deshitation-type R, P, or Q for each QMA in each fishing year. Includes only records wheregreen-weight_mor is 0.
Fishing year CRAl CRA2 CRA3 CRA4 CRAS CRA6 CRA7 CRA8 CRA9 1989-90 9.2 0.3 0.0 2.0 2.5 6.4 0.2 27.4 44.0 1990-91 3.1 0.5 2.2 2.1 3.4 3.1 0.1 27.1 13.6 1991-92 4.9 0.8 2.2 2.3 2.4 4.0 0.2 22.9 22.3 1992-93 6.4 1.8 1.8 0.4 2.2 6.0 0.2 11.4 19.5 1993-94 8.8 3.1 2.1 2.2 2.5 5.2 0.0 9.3 36.6 1994-5'5 3.7 6.4 3.4 5.2 4.0 8.0 0.1 6.7 56.4 1995-96 12.5 9.6 7.2 7.2 5.7 14.4 0.5 8.0 49.8 1996-97 17.1 11.6 7.7 8.9 9.5 4.4 0.9 6.4 57.0 1997-98 18.6 12.3 8.6 8.6 10.7 6.5 1.9 5.6 60.1 199849 3.2 12.7 12.2 11.8 16.0 18.0 2.0 7.4 55.8 1999-00 0.9 9.7 15.4 16.4 12.0 18.9 0.2 7.8 59.5 2000-01 6.2 14.3 14.9 12.8 13.9 18.8 1.5 9.5 61.8 2001-02 12.6 13.6 26.5 14.6 19.0 19.7 0.3 12.5 59.1 2002-03 25.0 23.1 36.3 15.0 24.8 27.4 0.4 39.6 53.4

Table36: Percentage of vessel-months where potlifts were recorded but where there were no landing for the same vessel month. AU error ratings are 0 or 1 and only "Ln landings were used
Fishing year 1990-91 1991-92 1992-93
CRA 3 0.2 0.3 0.5 0.0 0.0 0.0 1.7 2.7 1.5 0.0 0.0 0.5 1.7
Table 37: An example of the total estimated catch and total landings for a single vessel. Only in some months do the landings appear to correspond with estimated catches for the previous months which had no landings. No landing may appear because of error checking. Vessel key 1511.
Fishing year 1993-94 1993-94 1993-94 1993-94 1993-94 1993-94 1993-94 1993-94 1993-94 1994-95 199495 1994-95 199445 199495 1994-95 199495 1995-96 1995-96 1995-96 1995-96 1995-96 1995-96 1995-96 1995-96 199546 1996-97 1996-97
Fishing mouth 6 7 8 9 10 11 12 13 14 6 7 8 9 10 11 12 7 8 9 10 11 12 13 14 15 6 7
Estimated catch 2
110 372 484 427 166 294 304 296 161 322 23 1 953 505 860 509 201 267 375 825 720 100 240 160 140 120 190
Landings 0
' 0 0 0
203 183 263
0 406
0 306
0 0 0
1213 206
0 0 0 0 0 0
207 48
484 0
316

Table 38: Distribution of number of months between a month with no landings for a vessel and the next month that landings were recorded (for the period 1 Oct 1989 to 31 March 2003 -MFish Replog 4950' [July 20031).
Months Percent 1 67.2 2 8.1 3 4.3 4 3.1 5 2.9 6 2.5 7 1.7 8 1.2 9 1.3 1Dt 7.6 ' A unique "replog" code is assigned to every extract pmvided fm the data held by MFish.
Table 39: Total Iandings (t) that were assigned to vessel-months having zero landings using Method B2 by fishing year and CRA area.
Fishingyear CRA1 CRA2 CRA3 CRA4 CRA5 CRA6 CRA7 CRA8 CRA9 199041 1.2 . 0.2 0.0 0.0 0.1 0.0 0.0 10.6 0.0 1991-92 0.1 0.1 0.1 0.0 0.0 0.2 0.0 5.8 0.2 1992-93 0.1 0.1 0.0 0.0 0.2 0.0 0.0 6.1 0.7 1993-94 0 .O 0.1 0 .O 0.0 0.5 0 .O 0 .O 9.7 0.2 1994-95 0.2 0.2 0.0 0.0 0.5 0.0 0.0 5.6 0.0 1995-96 0.2 0.1 0.0 0.1 0.8 0.1 0.0 10.0 0.2 199697 0.7 0.3 0.8 0.2 0.5 0.7 0.0 4.4 0 2 1997-98 0.9 0.4 0.1 0.1 1.7 0.0 0.0 2.9 0.1 1998-99 0.9 0.0 0.0 0.1 1.0 0.0 0.0 5.8 0.4 1999-00 0.3 0.5 0.0 0.4 0.1 0.9 0.0 5.9 0.6 2000-01 1.6 0.3 0.0 0.0 0.5 0.0 0.0 11.4 0.0 2001-02 0.1 0.9 0.0 0.1 0.7 0.1 0.0 11.1 0.1 2002-03 0.1 1.1 0.3 0.0 3.1 1.9 0.0 21.3 0.5
Table 40: Examples of apportioning landings to the previous month with zero Landings (Method B2). In all cases, the tables show all months for a vessel. A: Apportioning performs well; the apportioned landings are similar to the estimated catches. B: Apportioning performs
A vessel-key 309 309 309 309 309 309 309 Sum
B vessel-key 1055 1055 1055 1055 I055 1055 Sum
Fishing year 2001-02 2001-02 2001-02 2001-02 2001-02 2001-02 2001-02
Fishing month 8 9
10 11 12 13 14
Estimated catches 225 300 60
130 20
260 120
1115.0
Fishing year Fishing month Estimated catches 200142 4 110 2001-02 5 182 2001-02 6 265 2001-02 7 29 8 200142 8 113 2001-02 9 200
1168
Landings 241.5 428.8
0 239.1 288.9
0 380.1
1578.4
Landings 0 0 0 0
462.31 178.01 640.32
Apportioned landings 241.5 428.8 75.5
163.6 288.9 260.1 120.0
1578.4
Apportioned landings 0 0 0
335.2029 127.1071
178.01 640.32

Table41: Percentage reduction in the number of vessel-month-statistical area combinations using Method B3 compared to Method B1.
Fishing year 1990-91 1991-92 1992-93 1993-94 1994-95 1995-96 1996-97 1997-98 1998-99 1999-00 2000-01 2001-02 2002-03
CRA 1 21.3 10.5 6.0 9.3
13.4 8.9
16.0 14.8 26.1 16.3 24.6
7.1 19.1
CRA 2 2.9 6.9 3.5 2.1 3.4 8.8
13.2 16.7 10.3 8.1
15.3 6.9
21.1
CRA 8 26.7 20.1 25.2 23.6 21.6 25.7 22.1 25.3 30.4 30.5 36.3 27.6 54.0
CRA 9 11.8 12.6 6.8
21.3 18.8 31.3 38.5 34.1 43.8 32.1
2.7 23.9 36.1
Table42 Percentage reduction in the number of vessel-month-statistical area combinations using method B4 compared to method B1.
Fishing year 1990-91 1991-92 1992-93 1993-94 1994-95 1995-96 199637 1997-98 1998-99 1999-00 2000-01 2001-02 2002-03
CRA 6 0.3 0.5 0.8 0.0 0.4 1.3 0.2 0.6 0.3 3.0 0.9 1.7 1.0
Table 43: Percentage of f ih ingevent records for which there is no matching form landing. A form landing occurs if for a fonn_number there is at least one landing event where destination-type is 'L' and the maximum error rating is 1 for green-weight-error, duplicate-error and
Fishing year
1989-90 1990-91 1991-92 1992-93 1993-94 1994-95 1995-96 1996-97 1997-98 1998-99 1999-00 2000-91 200142 2002-03
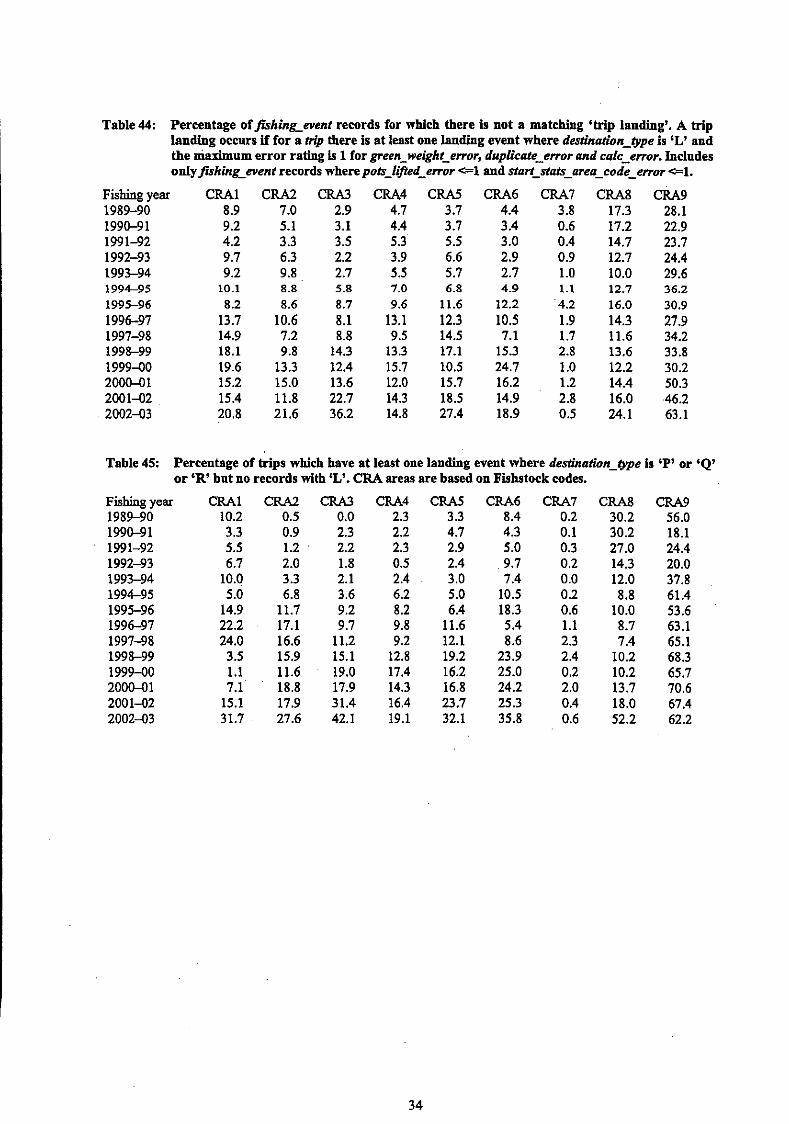
Table 44: Percentage offishingevent records for which there is not a matching Vrip landing'. A trip landing occurs if for a trip there is at least one landing event where destination-lype is 'L' and the maximum error rating is 1 for green-weight_error, duplicate-error and cdc-error. Includes onlyflhingevent records wherepotF_liped_error -1 and start-stats-area-code-error 6 1 .
Fishingyear CRAl CRA2 CR43 CR.44 CRA5 CRA6 CRA7 CRA8 CRA9 198940 8.9 7.0 2.9 4.7 3.7 4.4 3.8 17.3 28.1 1990-91 9.2 5.1 3.1 4.4 3.7 3.4 0.6 17.2 22.9 199 1-92 4.2 3.3 3.5 5.3 5.5 3.0 0.4 14.7 23.7 1992-93 9.7 6.3 2.2 3.9 6.6 2.9 0.9 12.7 24.4 1993-94 9.2 9.8 2.7 5.5 5.7 2.7 1.0 10.0 29.6 199695 10.1 8.8 5.8 7.0 6.8 4.9 1.1 12.7 36.2 199596 8.2 8.6 8.7 9.6 11.6 12.2 4.2 16.0 30.9 1996-97 13.7 10.6 8.1 13.1 12.3 10.5 1.9 14.3 27.9 1997-98 14.9 7.2 8.8 9.5 14.5 7.1 1.7 11.6 34.2 1998-99 18.1 9.8 14.3 13.3 17.1 15.3 2.8 13.6 33.8 1999-00 19.6 13.3 12.4 15.7 10.5 24.7 1.0 12.2 30.2 2oOo-01 15.2 15.0 13.6 12.0 15.7 16.2 1.2 14.4 50.3 200 1-02 15.4 11.8 22.7 14.3 18.5 14.9 2.8 16.0 46.2 2002-03 20.8 21.6 36.2 14.8 27.4 18.9 0.5 24.1 63.1
Table 45: Percentage of trips which have at least one landing event where destination-type is <P' or 'Q' or &R' but no records with 'L'. CRA areas are based on Fishstock codes.
Fishing year 1989-90 1990-91 1991-92 1992-93 1993-94 1994-95 1995-96 1996-97 1997-98 1998-99 1999-00 2000-01 200 1-02 2002-03
CRAl CRA2 CRA3 CRA4 CM.5 CRA6 10.2 0.5 0.0 2.3 3.3 8.4 3.3 0.9 2.3 2.2 4.7 4.3 5.5 1.2 2.2 2.3 2.9 5.0 6.7 2.0 1.8 0.5 2.4 9.7
10.0 3.3 2.1 2.4 3.0 7.4 5.0 6.8 3.6 6.2 5.0 10.5
14.9 11.7 9.2 8.2 6.4 18.3 22.2 17.1 9.7 9.8 11.6 5.4 24.0 16.6 11.2 9.2 12.1 8.6 3.5 15.9 15.1 12.8 19.2 23.9 1.1 11.6 19.0 17.4 16.2 25.0 7.1 18.8 17.9 14.3 16.8 24.2
15.1 17.9 31.4 16.4 23.7 25.3 31.7 27.6 42.1 19.1 32.1 35.8

Table 46:
No. days 0 1 2 3 4 5 6 7 8 9 10 11 12 13 14 15 16 17 18 19 20 21 22 23 24 25 26 27 28 29 >5 30 r 60 - 90 >5 120
Cumulative proportion of days between fishing event data and the next landing date for that vessel. (e.g. in CRA 1,83% of landings occurred within 4 days of the fishing event.)
Table 47: Percentage of jishingevent records for which there is no record in landing with a matching vesseckey, and a landingdatetime that is greater than or equal to skrrt_datetime but which is within 59 days of stan-datetime. Includes only fshing-event records where potJ_liped_error <=I and staH-stats_area-code-emor el .
Fishing year 1989-90 199&91 1991-92 1992-93 1993-94 1994-95 1995-96 1996-97 1997-98 1998-99 1999-00 200(M1 200142 2002-03
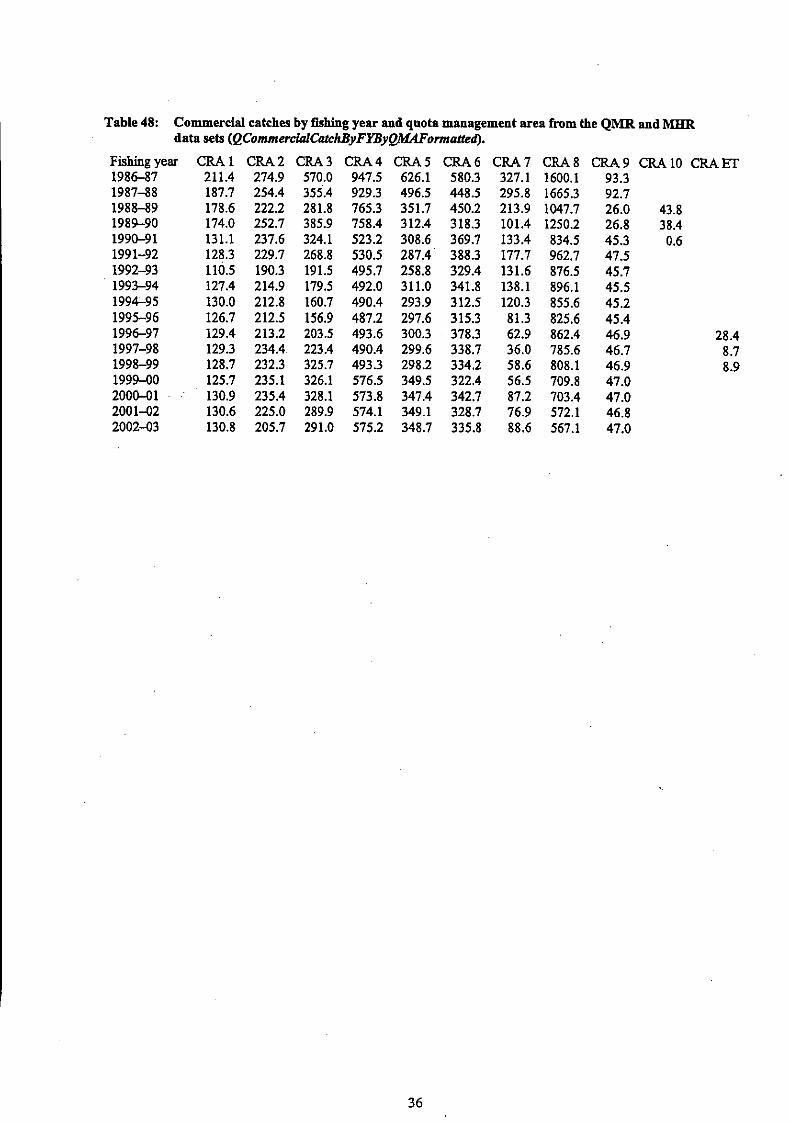
Table 48: Commercial catches by fishing year and quota management area from the QMR and MHR data sets (QCommercialCatchByFYBy~onnatted).

925
Figure 1: Map of rock lobster statistical areas 1979-80 to 200243.
CRA 3
CRA 6

Calendar year
Figure 2: Number of records by calendar year for the 1992,1998, and 2003 extracts of the FSU data.

1980 I982 1984 1986 1988 1980 1982 1984 1986 1988 1980 1982 1984 1986 1988
Fishing Year
Figure 3: Trends In arithmetic nnnaal catch rates (total catch divided by total effort) derived from the FSU data for each quota management area, 1979 to 1988, using the five sensitivity analyses described in Section 6.2.4.
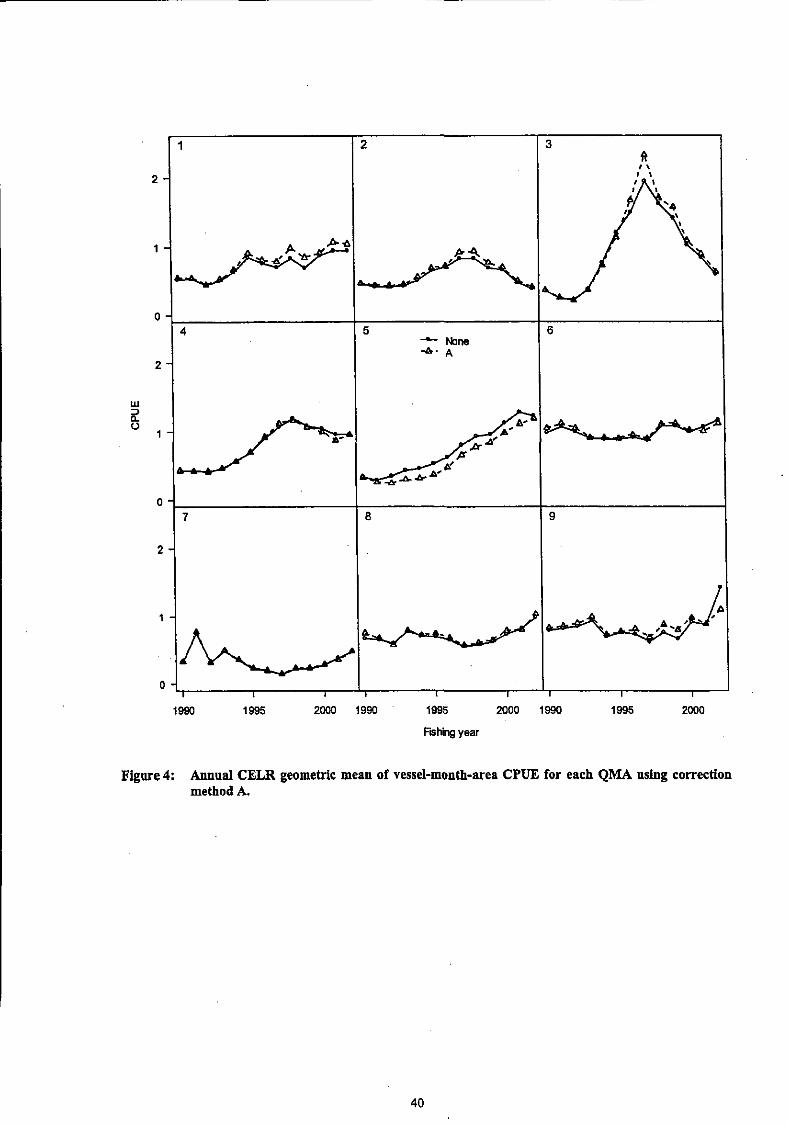
Whii year
Figure 4: Annual CELR geometric mean of vessel-month-area CPUE for each QMA ushg correction method A.

1990 1995 2WO 1990 1995 2030 1990 1995 2000
*hing year
Figure 5: Annual CELR geometric mean of vessel-month-area CPUE for each QMA using correction methods B1 and B4.

Method C catch
0 2000 40M) 6000 8000
Method C catch
M O O
,Dm 0 P
m -0 3000 0
r 2 2wo
I W O
0
Method C pots
0 1000 2000 3000 4000 5.000
Method C pots
Figure 6: Comparison of the total number of pots and catch (t) for each vessel-month-area using methods B1 and C1 for CRA 7 and CRA 8.

1990 1995 2000 1990 1995 2000 1990 1995 20M)
Fishhg year
Figure 7: Annual geometric mean of vessel-month-area CPUE for each QMA using correction methods C1 and C2.

1990 1995 2WO 1990 I995 2000 1990 1995 2000
Fishing year
Fignre 8: Annnal geometric mean of vessel-month-area CPUE for each QMA using correction methods D l and D2.

1980 1995 2OW 1990 1995 2000 1990 1995 2000
Fahlng year
Figure9: Annual geometric mean of vessel-month-area CPUE for each QMA using correction method E.

APPENDIX 1. SQL CODE USED TO EXTRACTTABLES FROM THE MFISH WAREHOU DATABASE fihing-event table:
/ * Replog 4950: * / / * All fishing records where Species = CRA and pm = RLP * /
SELECT fe.event-key, fe.start-datetime, fe.end-datetime, fe.primaryaethod, fe.target-species, fe.fishing-duration, fe.catcLweight, fe.effort-total-nun, fe.effort_num, fe.trunc-start-lat, fe.trunc-start-long, fe.trunc-endJat, fe.trunc-end-long, fe.start-stats-area-code, fe.vesse1-key, fe.forn-number, fe.fomtype, fe. trip
WHERE fe.interp_yn = "Y" AND fe.target-species = *CRAn AND fe.primary_method = "RLP" AND fe.start-datetime < "01 Apr 2003"

estimated-subcatch table:
/ * Replog 4950: * / / * All estimated catch records where species = CRA and pm = RLP */
SELECT es.event-key, es.species-code, es.catch-weight, es.target-species, es .primarysethod, es . f onn-number, es . f o mtype, es . trip
WHERE es.interp_yn= "Y" AND es.target-species = "CRA" AND es .primarysethod = "RLP". AND es.start-datetime < "01 Apr 2003"

landing table:
/ * Replog 4950: * / / * All landing records where Species = CRA * /
SELECT 1a.event-key, la. landing-datetime, 1a.species-code, 1a.fishstock-code, 1a.state-code, la-destination-type, la.unit-type, la.unit-nun, la.unit-weight, la-conv-factor, la.gree=weight, la.green_weight-type, la. -key, la-vessel-key, la. f onn-number , 1a.form-type, la. trip
WHERE la.interpyn = "Y" AND 1a.species-code = "CRAn AND la.landing-datetime <. "01 Apr 2003"

vessel table:
I* Replog 4950: * / I* Vessel details for vessels in CRA fishery * / /*set showplan on set noexec on*/
SELECT distinct la.vesse1-key, vs.overal1-length~etres, vs.gross-tomes, vs.engine-kilowatts, vs.max-speed-knots, vs.service-speed-knots, vs.registeredJength-metres,
convert(char(l2),vs.history_start-datetime,3)
FROMwarehou..landing la, corporat..vs~vessel~history vs
WHERE 1a.interpyn = "Y" AND 1a.species-code = 'CRAn AND 1a.landing-datetime >=I01 Oct 1989' AND la.landing-datetime c "01 Apr 2004" AND la.vesse1-key = vs.vesse1-key AND . vs.history_start-datetime <= 1a.landing-datetime AND vs.history-end-datetime > 1a.landing-datetime
UNION
SELECT distinct fe.vesse1-key, vs.overal1-length~etres, vs.gross-tomes, vs.engine-kilowatts, vs.max-speed-knots, vs.service-speed-knots, vs.registered-length-metres,
convert(char(l2),vs.hi~tory_start~datetime,3)
FROM warehou..fishing-event fe, corporat..vs~vessel~history vs
WHERE fe.interpyn= "Y" AND fe.target-species = "CRA" AND fe.primary-method = "RLP" AND fe.start-datetime >=I01 Oct 1989' AND fe.start-datetime < "01 Apr 2003" AND fe.vesse1-key = vs.vesse1-key AND vs.history_start4atetirne <= fe.start-datetime AND vs.history_end-datetime > fe.start-datetime