Casting of Tin Bronze Alloy in a Low-Head Mold · tin used my mankind. The percentage of tin in...
25
Heat and Mass Transfer Research Journal Vol. 2, No. 1; 2018 Published by CanSRG http://cansrg.com/journals/hmtrj/ * Corresponding author Submitted: January 25, 2018 Accepted: July 2, 2018 Casting of Tin Bronze Alloy in a Low-Head Mold Mainul Hasan * and Latifa Begum Department of Mining & Materials Engineering, McGill University, M. H. Wong Building, 3610 University Street Montreal, QC, Canada H3A 0C5 Abstract A computational modeling study has been carried out for a vertical Direct Chill (DC) ingot caster for tin bronze alloy (C903). The industrial caster modeled here consists of a low-head hot-top mold. The 3-D model incorporated the coupled laminar melt flow and wide mushy region solidification aspects of the casting process. The melt is delivered through the entire open top cross-section of the caster and, as a result, the inlet melt flow to the caster is equal to the casting speed. In confirmatory with the industry practice, three different cooling water temperatures, namely 10, 20 and 30 o C, respectively, for the mold, impingement, and streaming regions have been considered. A verified in-house 3-D CFD code developed particularly for the DC casting process is used to investigate the effects of the major parameters such as casting speed ranging from 40 to 80 mm/min., inlet melt superheat varying from 16 to 64 o C and the imposed mold-metal contact effective heat transfer coefficient changing from 1,500 to 4,500 W/(m 2 K) on the low-head casting process. The results are presented pictorially in the form of temperature and velocity fields. At the center of the ingot, the predicted results show that the sump depth, liquid depth, and mushy thickness increase linearly with the casting speed. The shell thickness at the exit of the mold decreases linearly with the casting speed. Useful, practical correlations concerning the above quantities with casting speed are provided to facilitate designing such casters for bronze. Keywords: low-head DC casting; 3-D modeling; tin bronze alloy (C903); mushy zone; variable water cooling conditions. Nomenclature A * Darcy coefficient ap, anb coefficients in the discretized governing equations b discretized source term c1,c2,c empirical constants in low Reynolds number model cP specific heat C morphology constant D hydraulic diameter of the caster (the entire cross-section of the ingot) Dk * extra dissipation term in k-equation E * extra generation term in -equation f1, f2, fμ empirical constants used in low-Re version of k-є models fl liquid fraction fs solid fraction G* production term in turbulent kinetic energy equation Gr Grashof number Grm modified Grashof number (Gr/Ste) gx gravitational acceleration in the x- direction h sensible heat h∞ ambient enthalpy H total heat (sensible and latent) k turbulent kinetic energy K thermal conductivity of aluminum (solid or liquid) P hydrodynamic pressure Pe Peclet number [non-dimensional] Pr laminar Prandtl number
Transcript of Casting of Tin Bronze Alloy in a Low-Head Mold · tin used my mankind. The percentage of tin in...

Heat and Mass Transfer Research Journal
Vol. 2, No. 1; 2018
Published by CanSRG
http://cansrg.com/journals/hmtrj/
* Corresponding author
Submitted: January 25, 2018 Accepted: July 2, 2018
Casting of Tin Bronze Alloy in a Low-Head Mold
Mainul Hasan* and Latifa Begum
Department of Mining & Materials Engineering, McGill University, M. H. Wong Building, 3610 University Street
Montreal, QC, Canada H3A 0C5
Abstract
A computational modeling study has been carried out for a vertical Direct
Chill (DC) ingot caster for tin bronze alloy (C903). The industrial caster
modeled here consists of a low-head hot-top mold. The 3-D model
incorporated the coupled laminar melt flow and wide mushy region
solidification aspects of the casting process. The melt is delivered through
the entire open top cross-section of the caster and, as a result, the inlet melt
flow to the caster is equal to the casting speed. In confirmatory with the
industry practice, three different cooling water temperatures, namely 10, 20
and 30oC, respectively, for the mold, impingement, and streaming regions
have been considered. A verified in-house 3-D CFD code developed
particularly for the DC casting process is used to investigate the effects of
the major parameters such as casting speed ranging from 40 to 80 mm/min.,
inlet melt superheat varying from 16 to 64oC and the imposed mold-metal
contact effective heat transfer coefficient changing from 1,500 to 4,500
W/(m2K) on the low-head casting process. The results are presented
pictorially in the form of temperature and velocity fields. At the center of
the ingot, the predicted results show that the sump depth, liquid depth, and
mushy thickness increase linearly with the casting speed. The shell
thickness at the exit of the mold decreases linearly with the casting speed.
Useful, practical correlations concerning the above quantities with casting
speed are provided to facilitate designing such casters for bronze.
Keywords: low-head DC casting; 3-D modeling; tin bronze alloy (C903); mushy
zone; variable water cooling conditions.
Nomenclature
A* Darcy coefficient
ap, anb coefficients in the discretized
governing equations
b discretized source term
c1,c2,c empirical constants in low Reynolds
number model
cP specific heat
C morphology constant
D hydraulic diameter of the caster (the
entire cross-section of the ingot)
Dk* extra dissipation term in k-equation
E* extra generation term in -equation
f1, f2, fµ empirical constants used in low-Re
version of k-є models
fl liquid fraction
fs
solid fraction
G* production term in turbulent kinetic
energy equation
Gr Grashof number
Grm modified Grashof number (Gr/Ste)
gx gravitational acceleration in the x-
direction
h sensible heat
h∞ ambient enthalpy
H total heat (sensible and latent)
k turbulent kinetic energy
K thermal conductivity of aluminum
(solid or liquid)
P hydrodynamic pressure
Pe Peclet number [non-dimensional]
Pr laminar Prandtl number
M. Hasan and L. Begum Heat and Mass Transfer Research Journal Vol. 2, No. 1; 2018
47
Re Reynolds number
Ret turbulent Reynolds number based
on the turbulent quantities
S source term
S source term associated with
Sk* non-dimensional source term
associated with buoyancy term in k-
equation
S* non-dimensional source term
associated with buoyancy term in ε-
equation
Ste Stefan number
T temperature inlet temperature
liquidus temperature
solidus temperature
Tsurf slab surface temperature
ui velocity component in the i-th
direction; corresponding to u
time-average velocity component in
the i-th direction
uin inlet velocity
us casting speed
U, V, W non-dimensional form of the u, v
and w velocities
Us non-dimensional form of us
x axial direction
y horizontal direction parallel to the
wide face
z horizontal direction parallel to the
narrow face
X, Y, Z non-dimensional form of x, y, z
i, j, k coordinate direction
Greek symbols H nodal latent heat
Hf latent heat of solidification
diffusion coefficient associated with
alloy density
l laminar viscosity
t turbulent viscosity or eddy
diffusivity
ν laminar kinematic viscosity
generalized dependent variable
Гeff effective diffusivity
є rate of energy dissipation
єin inlet rate of energy dissipation
γ effective convective heat transfer
coefficient
σk , σє turbulence model constants
σt turbulent Prandtl number
Superscripts * non-dimensional variables _ time-averaged variables
Subscripts P center of the grid point
nb neighbor of grid point P
1. Introduction
Among the various metallic alloys, the tin bronze alloy is one of the oldest alloys of copper and
tin used my mankind. The percentage of tin in this alloy varies between 7.5 to 9.0 wt%. A low tin
content makes the alloy softer while a high tin content makes the bronze alloy harder. This alloy
is hard and strong and is most often used in high-load, low-speed applications. For making
smaller objects, this alloy is cast by die casting, sand casting, permanent mold casting, investment
casting, etc. If the objective is to make good quality casts, particularly in larger sizes, the above
casting methods are not suitable since they make poor quality casts with a number of unacceptable
internal defects. In producing industrial sizes and rates of better quality casts of non-ferrous alloys
in an economical way, the semi-continuous vertical direct chill casting (DCC) process has been
found to be more suitable [1]. The DCC process is in fact, nowadays the predominant route for
casting of non-ferrous metals and their alloys such as aluminum, magnesium, copper, zinc, etc.
The advantages of this process lie in the fact that it is quite flexible and versatile. Because of the
extensive industrial usages, the description of the DCC process is quite well documented in a
number of recent books and studies [1-2], including in the recent publications of the present
authors [3-8]. To acquaint the general readers about the DCC process, a brief description of the
process is given below.
The casting in a DCC process starts with a bottomless mold which is initially kept plugged by a
retractable bottom block. The mold-bottom block assembly, thus forms a mold cavity. The mold
inT
lT
sT
iu

M. Hasan and L. Begum Heat and Mass Transfer Research Journal Vol. 2, No. 1; 2018
48
cavity is then filled from the top with the melt to be cast up to a predetermined height using a
suitable melt distributor. In order to solidify the incoming melt, its superheat has to be removed.
This is done by circulating chilled water through the inner channels of the mold. The flow rate
and the temperature of the circulating water are carefully controlled so that the inner faces of the
mold remain at a temperature much below the solidus temperature of the melt during the total
casting time. Because of the heat extraction by the cooling water through the mold walls, and
embryonic solid shell is developed on the inner faces of the mold walls. After a small time break,
the bottom block holding the partially solidified ingot is slowly lowered by the hydraulic ram
fitted at the bottom of the block. The downward speed of the block-ingot assembly is then
gradually increased to reach the predetermined casting speed. As the ingot exits the mold, it is
cooled further by the impinging water jets coming out of the holes at the bottom of the mold. In
practice, the same circulating cooling water in the mold is used for the above purpose. The cooling
that takes place in the mold region is inappropriately termed by the DCC industry as ‘primary
cooling’ where only 5-10% of the total heat content of the incoming melt is usually removed. The
cooling of the partially solidified ingot that takes place below the exit of the mold is termed
‘secondary’ cooling where 90 to 95% of the heat content of the ingot is removed [1]. It is very
important that sufficient cooling of the melt in the mold takes place such that the metal does not
come out at the exit of the mold in the liquid state. If the latter condition occurs, what is termed
‘bleed-out’ or ‘run-out’ condition, an explosion can occur and this may lead to a catastrophic and
fatal condition in the casting plant.
The DCC process is initially unsteady and it is difficult to model the initial casting phase of the
process because of the three-dimensional transient free-surface characteristic of the problem.
Depending upon the aspect ratio of the ingot, casting speed, superheat, water cooling rates and
water temperature, and the thermo-physical properties of the molten alloy, after about 0.5 m to
1.0 m length, the casting process reaches a pseudo-steady state [9]. Usually, after the casting of
about 8 to 10 m in length, the melt delivery to the mold is stopped and the casting is suspended.
From the water casting pit the cast is then taken away for homogenization, and for hot and cold
rolling to obtain a plate/sheet/foil/strip of required thickness for various useful applications.
As mentioned above, apart from the prevention of the bleed-out condition, the initial cooling of
the melt by the chilled mold wall is also critical since it dictates the development of the initial
ingot shell as well as the microstructure and surface quality of the cast. Because of intense cooling
of the semi-solid ingot by the water spray jets below the mold, the solid shell in the mold
experiences thermal contraction and if the shell that has formed in the mold is not sufficiently
strong enough, then it pulls out of the mold wall and thus an air gap between the solid shell and
the mold wall is formed. The formation of the air gap leads to a drastic decrease in the heat transfer
rate from the ingot to the mold, and this causes reheating of the shell due the internal heat transfer.
If the extent of reheating is high, the solid shell could become semi-solid and could promote a
number of uncontrollable internal and external casting defects such as cold shuts, drag marks,
segregation knot, bleed-out, surface cracks and mixed fine/coarse microstructure [9].
Once the above defects appear on the cast surface, the surface and subsurface layers of the ingots
need to be ‘scalped’ (the mechanical removal of the surface layer) before further processing. The
process of scalping is tedious, time-consuming and expensive, which also results in the loss of
material and productivity. Hence, much of research efforts in designing new DCC molds are
geared towards the intention of eliminating the reheating of the shell in the mold by reducing
mold cooling. In this regard, the casting company Wagstaff, Inc. (Spokane Valley, WA 99206,
M. Hasan and L. Begum Heat and Mass Transfer Research Journal Vol. 2, No. 1; 2018
49
USA), a major supplier of DC casting machines, has developed a low head composite (LHC)
ingot casting technology which the company now markets all over the world under the name
‘LHCTM’ [10]. The essential difference between the conventional and LHC mold is that the active
mold length in a conventional mold as stated earlier is usually between 70 to 80 mm while it is
usually between 25 to 30 mm in LHC mold. As a result, no air gap forms in the latter mold. The
quality of the cast in a low-head mold has been found to be much superior compared to the
conventional DCC mold. Other benefits of the former mold is that it diminishes scalp rates,
affords higher casting speeds; leads to a longer mold life, yields superior surface quality casts,
reduces mold cooling water treatment costs, and provides safer operations [10].
Although the DCC process for aluminum alloys is a well-established process, very little modeling
work exists in the literature, particularly for an industrial scale slab caster for bronze. A hot-top
LHDC caster mold with an open top melt feeding system is modeled here. The melt is considered
to have been supplied at an uniform temperature and velocity along the entire top cross-section
of the mold. Fully elliptic 3-D laminar momentum and energy equations are used to model the
macroscopic solidification aspects of the process. An in-house developed and well-verified CFD
code is extended to model this casting problem. To the best of the knowledge of the authors an
industrial size, low-head DC slab caster has not been previously modeled considering the coupled
3-D flow and solidification heat transfer aspect for bronze or in fact for any alloys of copper.
2. Mathematical Model
The studied physical model and the computational domain (yellow color region) considered is
schematically shown in Figure 1. As the problem has a two-fold symmetry, to reduce the
computational time, only an upper left-hand quarter of the physical domain was considered for
the simulations. The computational domain is a rectangular parallelepiped and has a dimension
of 2500 mm 865 mm 330 mm in x, y, and z directions, respectively. The origin of the
coordinates of the computational domain is selected at the center of the physical domain at the
top surface. The melt is considered to have been delivered in the direction of gravity at the top
free-surface with a uniform velocity across the entire cross-section of the caster. The solid shell
once formed in the mold it is then shifted downward at a preselected but constant casting speed
during the steady state operation of the vertical DC casting process.
2.1. Test Material
The tin bronze (C903) alloy having a freezing range of 146oC was selected as a test material. The
nominal chemical composition limits and the thermo-physical properties of this alloy are listed in
Table 1 [111] and Table 2 [112], respectively. The tin bronze is a copper alloy in which the weight
percentage of tin (Sn) usually varies from 7.5 to 9.0 %. Other predominant alloying elements in
this alloy are Zinc (3.5 wt. %) and Nickel (1.0 wt. % max.). This alloy has many favorable
properties which include good corrosion resistance, high wear resistance, moderate machinability,
and remarkable hardness. Because of the aforementioned properties, this alloy is widely used in
many useful applications. The cast products of this copper alloy are used in plumbing fixtures,
marine fittings, portable water devices, valves, gears, pump components, etc. [12-13].

M. Hasan and L. Begum Heat and Mass Transfer Research Journal Vol. 2, No. 1; 2018
50
Figure 1. Schematic of the low-head DC caster and the computational domain for an open-top melt feeding scheme.
Table 1. Chemical composition limits of C 903 Tin Bronze11.
Weight% Cu Sn Ni Pb Zn Sb Fe P S Al Si
C 903 Tin
Bronze
Balance
86.0 -
89.0
7.5 –
9.0
1.00
max.
0.30
max.
3.0 –
5.0
0.20
max.
0.20
max.
1.50
max.
0.05
max.
0.005
max.
0.005
max.
Table 2. Thermo-physical properties of Bronze11.
2.2. Assumptions and Simplifications
To realistically model the casting problem some standard assumptions have been considered.
Since all of the assumptions used here are provided in [12], hence to avoid duplications those
assumptions are not listed here.
Variable (unit) Value
Thermal conductivity (liquid or solid) (kW/mK) 0.0748
Specific heat (liquid or solid) (kJ/kg K) 0.3771
Latent heat of fusion (kJ/kg) 204.8
Liquidus temperature (C) 1000.0
Solidus temperature (C) 854.0
Viscosity ( kg/m s) 0.0044
Density (liquid or solid) ( kg/m3) 8800
Coefficient of thermal expansion at 20-200C (/C) 18.0 10-6
M. Hasan and L. Begum Heat and Mass Transfer Research Journal Vol. 2, No. 1; 2018
51
2.3. Numerical Procedure
2.3.1. Governing Equations for Laminar Melt Velocity and Enthalpy
The 3-D general transport equations for laminar melt velocity and enthalpy at steady state in
Cartesian tensor notation can be written as follows.
)1(
S
xxx
u
iii
i
where, ρ, ui , ΓΦ and SΦ are representing the melt density, the velocity component in the xi -
direction, the effective diffusion coefficient of Φ and the source term of Φ, respectively. Φ is
equal to 1 for the continuity equation. For momentum equations, it is the velocity components ui,
while for the energy equation it represents the temperature T. The positive x-direction is taken
parallel to the direction of the gravity field. The detailed derivation of the above general transport
equation can be found in [14].
2.3.2. Solidification Modeling and Modeling of Fluid Flow in the Mushy Region
A single domain modeling approach was considered in the present study to model the mushy-
region solidification problem since it does not require the tracking of the unknown interfaces
(liquid-mushy and mushy-solid). The popular enthalpy-porosity method was implemented here
[14-16]. One major advantage of this method is that, a single set of transport equations is able to
appropriately handle all three regions namely, liquid, mushy, and solid zones. In this method, the
total enthalpy is decomposed into sensible and nodal latent heat components in the energy
equation
H = h + H (2)
where h is the sensible heat, which is defined as
(3)
For constant cp, and taking href = 0 at Tref, the above equation can be integrated to obtain the
sensible heat as
h = cp (T-Tref ) (4)
In order to establish the region of phase change, the latent heat contribution was calculated from
the predicted temperature field and was used to identify the regions of three phases. The nodal
latent heat is a function of temperature of that specific node, i.e. H = f(T ).
The energy equation was applied for the entire calculation domain, including solid, liquid, and
mushy regions. In this study, the nodal latent heat was assumed to be a linear function the liquid
fraction that is
H = Hf fl (5)
where fl is the liquid fraction. It is assumed in the present model that increases
linearly from zero at the liquidus temperature to 1 at the solidus temperature. Mathematically the
above statement can be represented by the following expression in terms of equivalent liquid
fraction fl.
T
Tp
h
href
ref
dTcdh
ls ff 1

M. Hasan and L. Begum Heat and Mass Transfer Research Journal Vol. 2, No. 1; 2018
52
(6)
where Tl and Ts are the liquidus and solidus temperatures, respectively. It is to be noted here that
to simplify the modeling effort; Tl and Ts were assumed constant in the present model.
The final form of the energy equation in dimensional form can be written as follows.
)7(
Pr i
i
i
l
ii
i
x
Hu
x
h
xx
hu
The last term in Eq. (7) represents the latent heat exchange rate due to the solid-liquid phase
change resulting from the laminar convective flow in the melt. The flow of melt in the mushy
region is quite complicated. Because of the simplicity of the Darcy law for porous media, in the
current mathematical model for the mushy fluid this law was adopted [14-16]. The above equation
was suitably non-dimensionalized, and its final form is listed in Table 3.
2.3.3. Non-dimensionalization of the Governing Equations and Boundary Conditions
The general form of the 3-D laminar Navier-Stokes and energy equations [Eq. (1)] and the
associated boundary conditions were non-dimensionalize by the following variables as:
(8)
where D, uin and Hf represent the hydraulic diameter of the caster, the inlet velocity and the
latent heat of solidification, respectively. All the conservation equations can be expressed in a
general form of a non-dimensional partial differential equation. The Cartesian-tensor form of this
equation is
)9(3,2,1**
**
iS
XXX
U
iii
i
The values of *, and the associated definition of and , for all the transport equations are
listed in Table 3. The development of a general-purpose program is considerably simplified
because of the casting of the governing equations in a general form.
The non-dimensional form of the boundary conditions becomes
(i) Open-top inlet
U=1, V=W=0, h*= , k*=0.01, (10)
(ii) Free surface
, U=0 (11)
(iii) Symmetry planes
At the X-Y plane: W=0 (12)
.0
,
,1
s
sl
sl
s
l
l
TTwhen
TTTwhenTT
TT
TTwhen
f
,D
xX ,
D
yY ,
D
zZ ,
inu
uU ,
inu
vV ,
inu
wW ,
2
*
inu
PP
,*
fH
hh
* *
S
*
inh 05.0/)01.0( 2/3
c
0***
X
h
XX
k
X
W
X
V
,0***
Z
h
ZZ
k
Z
V
Z
U

M. Hasan and L. Begum Heat and Mass Transfer Research Journal Vol. 2, No. 1; 2018
53
At the X-Z plane: V=0 (13)
(iv) Outlet
(14)
V=W=0 (15)
(v) Moving walls
U=Us= us/uin , V=W=k*=*=0, (16)
where is the effective heat transfer coefficient between the solid surface and the surrounding,
represents the non-dimensional sensible enthalpy at the ingot surface and represents the
non-dimensional ambient enthalpy. The values of the effective heat transfer coefficient along the
length of the DC slab caster were taken from Vreeman and Incropera [17], which are given below.
Adiabatic section: γ(x) = 0 (0 x 60 mm)
(17)
Mold-metal contact region: γ(x) = 3.0 (60 x 90 mm)
(18)
Secondary cooling zone:
(a) impingement zone: γ(x) = 20.0 (90 x 100 mm)
(19)
(b) water streaming zone:
(100 x 140 mm) (20)
(x 140 mm) (21)
where x2 = 100, x3 = 140 mm and γmax = 20.0 kW/m2K , γflim = 10.0 kW/m2K.
It is to be noted here that for the mold, impingement and streaming zones, three different cooling
water temperatures, namely 10, 20 and 30oC, respectively, have been invoked to model the slab
casting process for maintaining the consistency with the industrial low-head DC casting
operations [18].
Table 3. Summary of the non-dimensional governing equations.
Equation
Continuity 1 0 0
U-momentum U
Re
1
V-momentum V
Re
1
,0***
Y
h
YY
k
Y
W
Y
U
0***
X
h
XX
k
X
U
)( ****
as hhK
D
Z
h
Y
h
sh
ah
)()( max
23
2max
film
xx
xxx
filmx )(
**
*
S
hh
mGr
sUUA
iX
U
iXX
P *
2ReRe
**
*
sVVA
iX
V
iXY
P
Re
**
*

M. Hasan and L. Begum Heat and Mass Transfer Research Journal Vol. 2, No. 1; 2018
54
W-momentum W
Re
1
Energy h*
PrRe
1
where ;
qf
fCA
l
l
3
2
* 1 ;
2.4. Solution Procedure and Grid Independent Tests
The governing partial differential equations were discretized to obtain their algebraic counterparts
by using the control volume (CV) based finite difference technique on a staggered grid system.
The convection-diffusion terms in the governing equations were discretized by employing the
hybrid difference scheme [19]. The five variables of this problem, namely, U, V, W, P*, h*, were
solved iteratively in a sequential manner to obtain a converged solution. To resolve the velocity-
pressure coupling in the three momentum equations, the SIMPLE algorithm [19-20] was used. In
the actual implementation of the SIMPLE algorithm, an iterative solution scheme was adopted by
using an implicit relaxation technique to solve the discretized equations. After a number of
preliminary numerical simulations, the following implicit relaxation factors (αi) were found to
decrease the computational time quite significantly: αu =0.2; αv =0.2; αw =0.2; αPC =0.1; αT =0.4.
The discretized equations for each variable were declared to have converged when the sum of the
residuals of all CVs for that particular variable ( ) was less than 10-4. The convergence criterion
described above can be defined mathematically as follows.
(22)
The CPU time per iteration was about 1.0 min. The computations were performed on a personal
computer having a speed of 2.66 GHz and fitted with a RAM of 4 Gigabytes. For a typical case,
to obtain a fully converged solution, it took about 3 days and required more than 4,000
iterations.
The grid independence tests were performed using three sets of grid systems, namely, 60 42
24, 70 52 34, and 80 62 44 (x, y, z directions), respectively. Since the local surface heat flux
is the most sensitive quantity with regard to the grid points, hence the local surface heat fluxes
were compared for the above three grid arrangements. It was found that the local surface heat flux
varied by less than 2.0 % between the coarse and fine grid systems for this laminar flow problem.
The details of the predicted results along with the comparisons are provided in [14]. In order to
conserve space, those results are not reported here. To optimize CPU resources with an acceptable
level of accuracy and reasonable computational time, all production runs reported in this paper
were performed with a grid distribution of 60 42 24 grid points.
3. Code Validation
The present code was validated by comparing the positions of the solidification front provided by
the experimental measurements of a rolling ingot by Jones et al. [21]. In Table 4, the comparison
is given. It is apparent from the comparison that closer to the slab center, the predicted and
sWWA
iX
W
iXZ
P
Re
**
*
Z
HW
Y
HV
X
HU
DuinRe30101 q
R
nodesall nb
nbnbpp baaR
M. Hasan and L. Begum Heat and Mass Transfer Research Journal Vol. 2, No. 1; 2018
55
measured solidification front distances matched quite well, while further the thermocouples were
away from the center and near the side wall the match is not that satisfactory. It is to be noted
that Jones et al. did not provide the experimentally measured thermal boundary conditions in [21].
As a result, the employed standard thermal boundary conditions used in the model might not have
been appropriate. Further details about the verifications of the code are available in [14].
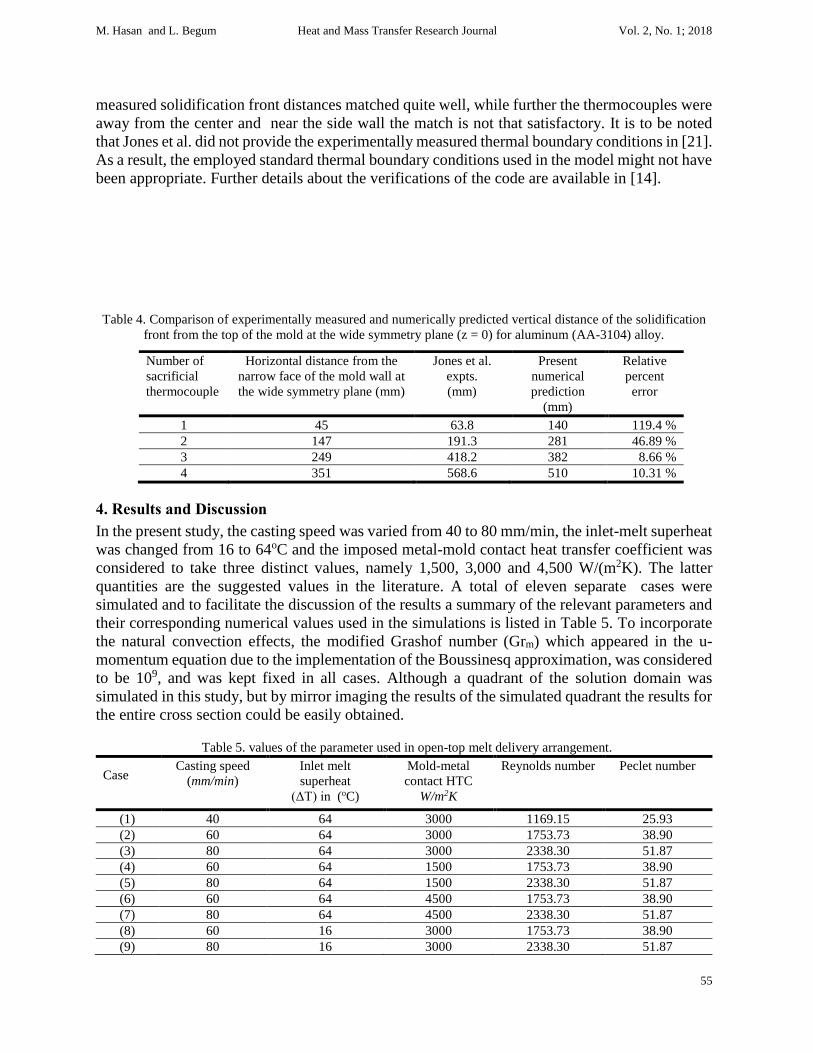
Table 4. Comparison of experimentally measured and numerically predicted vertical distance of the solidification
front from the top of the mold at the wide symmetry plane (z = 0) for aluminum (AA-3104) alloy.
Number of
sacrificial
thermocouple
Horizontal distance from the
narrow face of the mold wall at
the wide symmetry plane (mm)
Jones et al.
expts.
(mm)
Present
numerical
prediction
(mm)
Relative
percent
error
1 45 63.8 140 119.4 %
2 147 191.3 281 46.89 %
3 249 418.2 382 8.66 %
4 351 568.6 510 10.31 %
4. Results and Discussion
In the present study, the casting speed was varied from 40 to 80 mm/min, the inlet-melt superheat
was changed from 16 to 64oC and the imposed metal-mold contact heat transfer coefficient was
considered to take three distinct values, namely 1,500, 3,000 and 4,500 W/(m2K). The latter quantities are the suggested values in the literature. A total of eleven separate cases were
simulated and to facilitate the discussion of the results a summary of the relevant parameters and
their corresponding numerical values used in the simulations is listed in Table 5. To incorporate
the natural convection effects, the modified Grashof number (Grm) which appeared in the u-
momentum equation due to the implementation of the Boussinesq approximation, was considered
to be 109, and was kept fixed in all cases. Although a quadrant of the solution domain was
simulated in this study, but by mirror imaging the results of the simulated quadrant the results for
the entire cross section could be easily obtained.
Table 5. values of the parameter used in open-top melt delivery arrangement.
Case
Casting speed
(mm/min)
Inlet melt
superheat
(ΔT) in (oC)
Mold-metal
contact HTC
W/m2K
Reynolds
number
Peclet number
(1) 40 64 3000 1169.15 25.93
(2) 60 64 3000 1753.73 38.90
(3) 80 64 3000 2338.30 51.87
(4) 60 64 1500 1753.73 38.90
(5) 80 64 1500 2338.30 51.87
(6) 60 64 4500 1753.73 38.90
(7) 80 64 4500 2338.30 51.87
(8) 60 16 3000 1753.73 38.90
(9) 80 16 3000 2338.30 51.87

M. Hasan and L. Begum Heat and Mass Transfer Research Journal Vol. 2, No. 1; 2018
56
(10) 60 32 3000 1753.73 38.90
(11) 80 32 3000 2338.30 51.87
Figure 2. 3-D surface plots of temperature and velocity fields for three cases (1–3).
4.1. Velocity Fields for Cases (1-3) of Table 5
Figure 2(b,d,f) shows a 3-D surface plot of the velocity vector fields on the wide (x-y plane) and
the narrow (x-z plane) symmetric planes as well as the melt entry surface of the simulated caster.
As stated earlier, the melt in this study is considered to have been delivered uniformly at the
corresponding casting speed across the entire top cross-section. Due to this simple melt feeding
system, from these figures, it can be clearly seen that all of the melt flows downward. Along the
narrow and wide faces parts of the vertical melt that flow near the walls are diverted by the
developed solidified shells, and then they follow the solidification fronts. An increase in the
casting speed certainly increases the mass flow rate of the melt into the caster. As a consequence,

M. Hasan and L. Begum Heat and Mass Transfer Research Journal Vol. 2, No. 1; 2018
57
the magnitude of the resultant velocity vector increases with the increase of the casting speed.
The above observation is due to the conservation of mass into the domain.
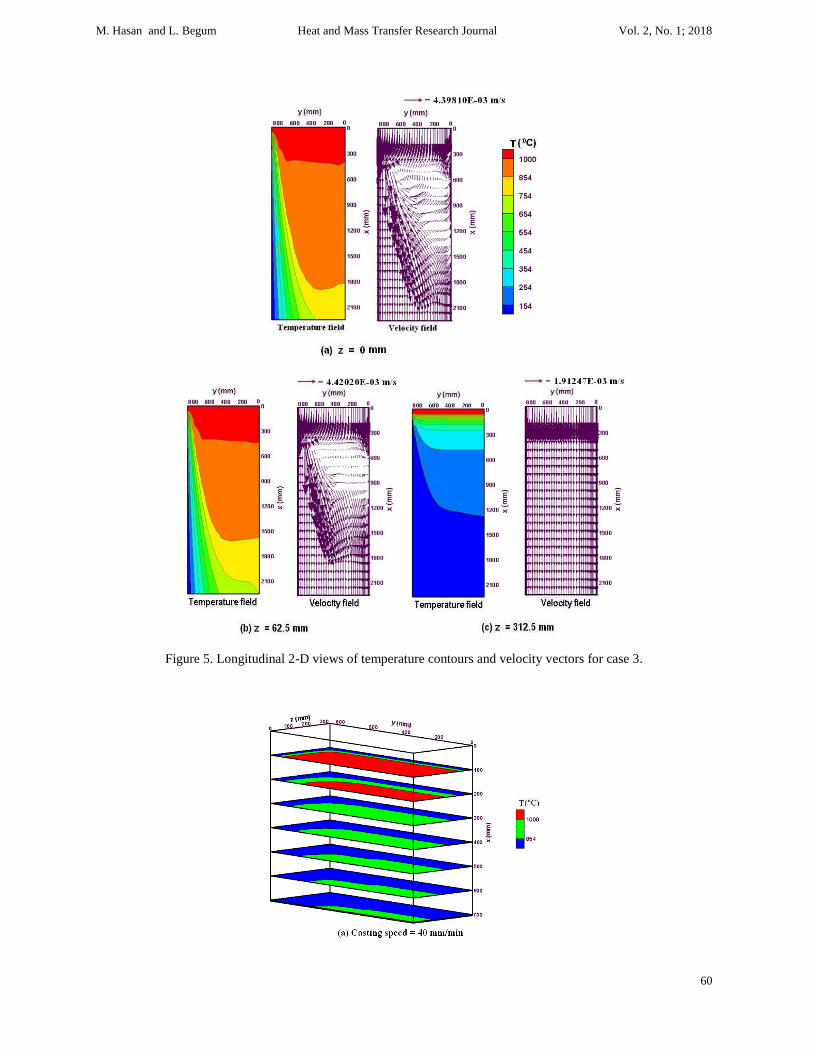
The right-hand frames of Figures 3(a-c) through Figures 5(a-c) illustrate the 2-D projections of
the velocity vectors at the wide symmetry plane (z = 0) and parallel to the wide symmetry plane
at two inward locations, viz., z = 62.5 mm, and z = 312.5 mm, for cases (1-3). While plotting the
results about two-third of the axial domain is magnified for better visualization and clear
understanding of the flow patterns prevailing within the cast. The velocity vectors in the wide
symmetry plane (z = 0) for three casting speeds are portrayed in Figures 3(a) through 5(a). It
should be noted that from the 3-D surface plots of the velocity vectors, one can extract the same
information which are shown in the above figures.
In order to visualize what is happening in the melt for this high-temperature opaque system, the
velocity fields on the longitudinal planes at an inward distance of z = 62.5 mm and z = 312.5 mm
from the wide symmetry plane, are presented in Figures 3(b) through 5(b), and 3(c) through 5(c),
respectively for three cases (1-3). From the velocity vector field at z = 62.5 mm it can be observed
that the developing solidified shell is still obstructing the corner stream near the narrow face and
this is true for all three casting speeds, but the velocity field at z = 312.5 mm, which is nearer to
the rolling face shows an almost uniform downward flow. The similarity of the flow near the
plane at z = 62.5 mm with a boundary layer type of flow along a moving plate is clearly visible
in this plane. It is to be noted that the magnitude of the velocity vectors at z = 312.5 mm is slightly
higher than the corresponding casting speed, which means that the melt is accelerated in this plane
with respect to the imposed casting speed.
4.2. Temperature Fields for Cases (1-3) of Table 5
The solidification front, the liquidus isotherm along with the other iso-temperature contours are
shown in Figures 2(a,c,e) for the three cases (1-3) of Table 5. The mushy region, which is bounded
by the liquidus (1000oC) and solidus (854oC) isotherms, can be clearly observed in these figures.
At each casting speed, it is seen that a classical parabolic-shaped solidification front is developed
which signifies a weaker thermal convection effect in the mushy region. The very strong effect
of the casting speed on the temperature fields is clearly visible in the above figures. The above
figures further show that the extent of the melt region within the domain is enlarged with the
increasing casting speed which can be easily visible from the comparative locations of the liquidus
isotherm. The solidification front as well as the other isotherms is becoming steeper and are
moving in the cast, direction with the increase in the casting speed. The mushy region is also seen
to be expanding due to the stronger thermal convection. It must be emphasized here that there is
a lack of available information regarding effective heat transfer coefficients, and, as a result, the
same values of the coefficients in the primary and secondary cooling regions were used
irrespective of the casting speed. The effective heat transfer coefficients were although different
from the mold, impingement, and free stream falling regions, but were kept constant for all
simulated casting speeds. Because of this assumption, with the increase in the mass flow rate as
well as with the accompanying decrease of the residence time of the melt with the increase of the
casting speed, the ingot is not sufficiently cooled by the extraction of heat. It is also observed
from these figures that at and near the central area of the ingot the solidification front has turned
to almost horizontal in shape. The weak vertical melt flow at and near the central area has caused
negligible thermal convection, and, as a result, the shape of the solidification front has altered.
With the increase in casting speed, the horizontal extent of the solidus isotherm is decreasing. The

M. Hasan and L. Begum Heat and Mass Transfer Research Journal Vol. 2, No. 1; 2018
58
primary reason behind this outcome is that at a lower casting speed near the solidification front
the conduction mode of heat transfer is enhanced with respect to the thermal convection.
The knowledge of the temperature profiles for this high-temperature opaque system is quite useful
for the development of various types of micro models including models for hot tears, cold cracks,
micro-segregation, etc. To this end, the selective temperature contours, at z = 0, z = 62.5 mm and
z = 312.5 mm for three cases (1-3) are shown in the left-hand frames of Figures 3(a) through 5(a),
3(b) through 5(b), and 3(c) through 5(c), respectively. The rate of heat extraction increases as one
proceeds from the wide symmetry plane along the narrow wall toward the wide rolling face. The
shapes and locations of the isotherms at the above three longitudinal planes are the manifestations
of the above fact. In comparison to the symmetry plane, the temperature contours are seen to have
been lifted upward in the other two planes. From these figures, it can be further observed that
both the liquidus and the solidus isotherms have moved downward with the increase of the casting
speed and there is also a corresponding increase in the vertical separation distance between them.
Figure 3. Longitudinal 2-D views of temperature contours and velocity vectors for case 1.

M. Hasan and L. Begum Heat and Mass Transfer Research Journal Vol. 2, No. 1; 2018
59
Figure 4. Longitudinal 2-D views of temperature contours and velocity vectors for case 2.
Figure 6(a-c) shows the 2-D transverse cross-sectional plots along the casting direction for three
cases (1-3). These figures clearly show the longitudinal developments of the solid shell and mushy
zone at different cross-sections (y-z plane) parallel to the slab top surface. To get a better
understanding of what is happening within the ingot in each of the above figures, a total of seven
cross-sections of the ingot are depicted. With the downward movement, since more heat is being
extracted from the ingot through the mold walls and by the chilled water jets, the thickness of the
solid layer from the wide and narrow sides are progressively increasing which are obvious from
these figures at each casting speed. Nearly uniformly thick solid shell on the narrow and wide
faces convey the fact that an almost uniform rate of heat extraction is taking place from both the
sides at each cross-section. Since in the corner region heat is being extracted from both the rolling
and narrow faces, this has resulted in a higher rate of heat extraction there compared to the other
locations and this enhanced heat transfer has caused in the almost round-shaped solid layer and
mushy zone. With the increase in the casting speed, the marked reduction of the extent of the
solid region along the casting direction is clearly portrayed in the above figures. The fundamental
reasons for this expected outcome have already been explained in the preceding paragraph.
M. Hasan and L. Begum Heat and Mass Transfer Research Journal Vol. 2, No. 1; 2018
60
Figure 5. Longitudinal 2-D views of temperature contours and velocity vectors for case 3.

M. Hasan and L. Begum Heat and Mass Transfer Research Journal Vol. 2, No. 1; 2018
61
Figure 6. Contours of solidus and liquidus temperatures at various transverse cross-sectional planes for three cases
(1–3).
4.3. Quantitative Analysis for ΔT = 64oC
4.3.1. Sump Depth and Mushy Layer Thickness
In DCC process the quality of the cast is predominantly determined by the depth of the sump and
the thickness of the mushy region. The latter two quantities are very difficult to obtain through
experiments during the casting operations. The mathematical model is a viable alternative for the
predictions of the two said quantities. From the predicted temperature field, the above quantities
are calculated through linear interpolation of the temperature with respect to the vertical distance.
In Table 6, the sump depth and the mushy layer thickness at the ingot center for three cases (1-3)
are given. The present authors are a bit puzzled by the fact that in none of the vast literature on
DCC process for non-ferrous alloys there is any reporting of the quantitative values of the sump
depth and mushy thickness.
With the increase in the casting speed, the sump and the mushy thickness are both increasing. For
the comparison purposes, of the above two quantities the values of these quantities for the lowest
casting speed of 40 min/mm were taken as the base case. For a withdrawal speed of 40 min/mm
the sump depth is found to be approximately 841.80 mm from the top of the mold and the mushy
thickness was 131.95 mm at the ingot center. In the cases for the higher casting speeds of 60, and
80 min/mm , about 49.08 % and 108.58 % higher values in the sump depth were obtained,
respectively. The corresponding relative increases in the mushy thickness were about 91.96 %,
and 149.54 %, respectively.
Table 6. Sump depth and mushy thickness in mm at the ingot center for cases (1-3).
Quantity Values of casting speed (us ) in min/mm
40 60 80
Sump depth (mm) 841.80 1254.97 1755.79
Mushy thickness (mm) 131.95 253.29 329.27

M. Hasan and L. Begum Heat and Mass Transfer Research Journal Vol. 2, No. 1; 2018
62
4.3.2. Predicted Shell Thickness
The casting speed increases the productivity of the DCC process. It is the aim of all slab producers
to produce high-quality casts at higher casting speeds and with larger cross-sections. But in
reality, the above two quantities can’t be arbitrarily increased since various internal and surface
defects appear in the cast if prior study and planning of the above two aspects are not carefully
thought out. In this regard, fruitful guidance can be obtained from the equivalent industrial
practices or through the study of the relevant literature.
Casting speed is the predominant controlling parameter that determines the magnitude of the shell
thickness. As mentioned in the introduction, the breakout or run-out condition must be avoided
at all cost in a DCC process. For this reason, the shell thickness at the exit of the mold is a crucial
quantity. The predicted shell thickness from the narrow side of the wide symmetry plane and from
the wide side of the narrow symmetry plane at the exit of the mold representing an axial distance
of 90 mm from the top free surface is given in the form of bar charts for three casting speeds for
three cases (1-3) in Figure 7. The numerical value inside each bar of the chart of this figure shows
the predicted value of the shell thickness (in mm) for three casting speeds. For both locations with
the increase of the casting speed the shell thickness decreases. The rate of decrease of the shell
thickness is smaller for the lower casting speeds ( 60 min/mm ) compared to the higher casting
speeds (> 60 min/mm ). On examination of this figure, it is revealed that the growth rate of the
solid shell at the center of the narrow side is relatively greater compared to the center of the rolling
face for cases (1-3). The reason for this unequal growth rate of the shell at the mold exit is due to
the proximity of the middle of the narrow side from the slab corner (region of high heat extraction)
compared to the middle of the wide slab side.
Figure 7. Shell thickness at the middle of the slab faces at mold exit vs. casting speed for cases (1–3).
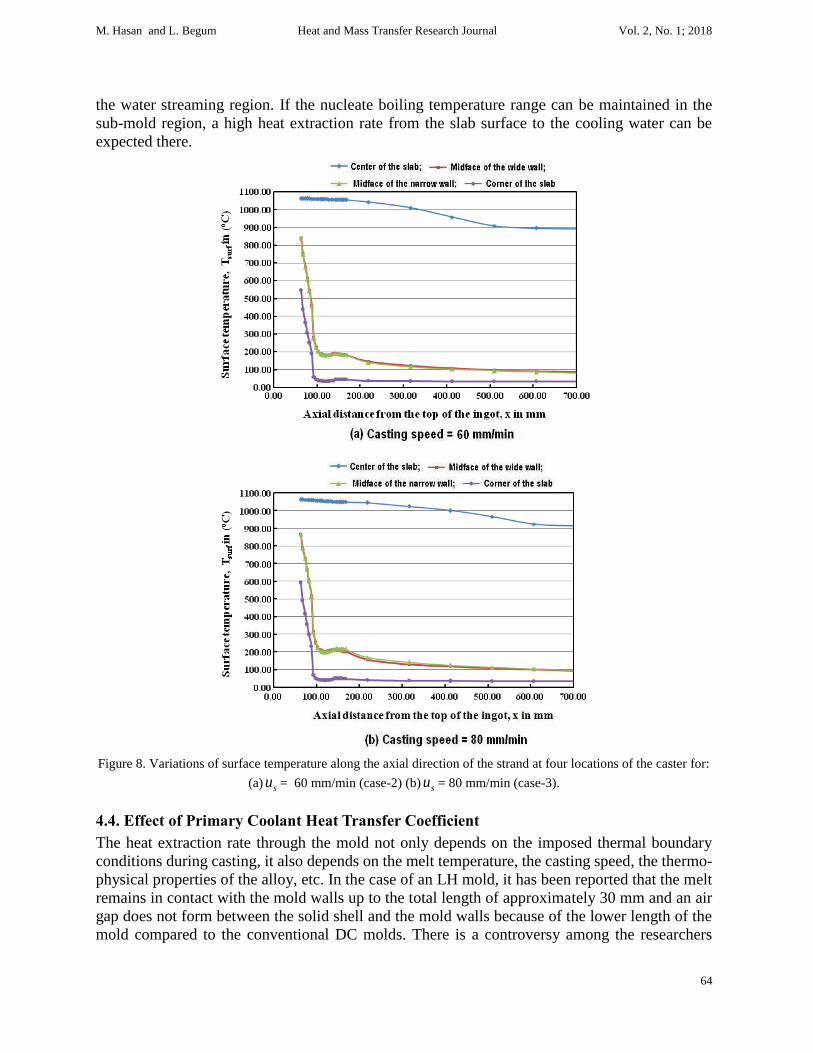
4.3.3. Predicted Strand Surface Temperature
The ingot surface temperature is another important quantity to slab producers for controlling
various defects. Proper imposition of the cooling conditions at the boundaries is very important
to slab producers since for a specific alloy in a DCC process several physical and geometrical
parameters plays complex roles, and, as a result, the surface temperatures cannot be predicted in
advance without resorting to measurements or numerical predictions. There is very little

M. Hasan and L. Begum Heat and Mass Transfer Research Journal Vol. 2, No. 1; 2018
63
information in the literature on the trend of the heat extraction rate from the ingot surface at
different operating conditions. Knowing this trend one can presumably determine where the
improvements in terms of heat extraction rates are needed to obtain a good quality cast. For this
reason, in this study, the ingot surface temperatures are predicted for various practical, effective
heat transfer coefficients. This quantitative information may provide useful guidance in locating
possible hot tears and cracking zones. It is to be recognized that the surface temperature is an
unknown initially and once the converged solutions were obtained the surface temperatures were
obtained by making a heat balance on each of the control volumes at the slab surface. The
temperature distributions along the caster for two cases (2 and 3) are portrayed in Figures 8(a)
and 8(b) corresponding to the casting speed of 60 and 80 min/mm , respectively. The locations in
the ingot used for the presentation of the predicted temperatures are given at the top of the above
figures. Four locations are selected in this study, which are prone to the higher compressive and
tensile stresses. As the effective heat transfer coefficients are increased from the mold to the sub-
mold regions, the increasing rate of heat extractions decreases the temperatures significantly at
the four locations, namely: (a) center; (b) mid-distance of the wide face; (c) mid-distance of the
narrow face; and (d) corner point of the caster. Both figures show that from the top of the mold
to the impingement point the temperature drops quite sharply and after the impingement zone the
temperature drop is rather gradual except for the temperatures in the ingot central region. The
midpoint of the wide face shows a slightly higher temperature compared to the midpoint of the
narrow face. As a consequence of this effect, approximately 1.04 to 1.05 times thicker solid shell
is seen to develop at the midpoint of the narrow face compared to the midpoint of the wide face
(refer to Figure 7). The surface temperature at the corner drops more sharply and attains lower
values compared to the mid-faces. The reason behind this has already been explained earlier.
This overcooled situation on the corner compared to the mid-face regions and little bit overheated
situation of the wide face compared to the narrow face resulted in the unequal increase in
temperatures across the ingot cross-section. This may lead to the formation of the surface and
shape defects. Since the heat transfer rate from the ingot center is the lowest, hence the
temperatures are the highest therein with regard to the other three locations. Within the mold and
for part of the sub-mold region, the temperature at the center drops rather gradually and at a much
slower rate compared to the film boiling zones in the lower part of the sub-mold region. In the
latter region, the temperature drops comparatively at a higher rate until the end of the cast.
For the same axial locations, it is seen that for a higher casting speed the surface temperatures are
higher compared to the lower casting speed which is clearly evident from Figures 8(a) and 8(b).
The above-stated trends have prevailed in all the four ingot locations. It is to be mentioned here
that irrespective of the casting speed the same convective heat transfer boundary conditions were
implemented on the ingot surface without considering the enhanced cooling requirements for a
higher casting speed. As a result, at the mold exit for a casting speed of 60 mm/min the ingot
surface temperatures at the mid-distance of the wide and narrow faces are seen to reach
approximately to 370.6, and 367.4, respectively, whereas for a casting speed of 80 mm/min their
reach to a higher value of around 414.1oC and 412.1oC, respectively. The surface temperatures
for both cases show that the temperatures there are not within the nucleate boiling regime (which
is below 150 oC) and hence there could be the possibility of hot tears in those regions.
From this study, one can ascertain how to adjust the water cooling conditions in the mold and
sub-mold regions so that the nucleate boiling of water, which is known to occur in a range of
surface temperatures between 100 and 150 Co [1, 9], prevails near the exit of the mold and down
M. Hasan and L. Begum Heat and Mass Transfer Research Journal Vol. 2, No. 1; 2018
64
the water streaming region. If the nucleate boiling temperature range can be maintained in the
sub-mold region, a high heat extraction rate from the slab surface to the cooling water can be
expected there.
Figure 8. Variations of surface temperature along the axial direction of the strand at four locations of the caster for:
(a) su = 60 mm/min (case-2) (b) su = 80 mm/min (case-3).
4.4. Effect of Primary Coolant Heat Transfer Coefficient
The heat extraction rate through the mold not only depends on the imposed thermal boundary
conditions during casting, it also depends on the melt temperature, the casting speed, the thermo-
physical properties of the alloy, etc. In the case of an LH mold, it has been reported that the melt
remains in contact with the mold walls up to the total length of approximately 30 mm and an air
gap does not form between the solid shell and the mold walls because of the lower length of the
mold compared to the conventional DC molds. There is a controversy among the researchers

M. Hasan and L. Begum Heat and Mass Transfer Research Journal Vol. 2, No. 1; 2018
65
working in this field regarding the values of the effective heat transfer coefficients in the mold
region. From the literature, one gets conflicting values of the HTCs in the metal-mold contact
region. The very well cited literature on this above issue has reported a wide range of values for
the HTCs in this regard. In the metal-mold contact region, the value of HTC ranging from 1000
to 5000 W/(m2K) has been reported in the literature [1, 22]. In order to ascertain the impact of
the heat transfer coefficient (HTC) at the mold-metal contact region, for an inlet superheat of
64oC, three HTCs namely 1,500, 3,000 and 4,500 W/(m2K) were selected for the two casting
speeds namely, 60 and 80 mm/min.
The values of shell thickness at the mold exit for the above mentioned two casting speeds are
given in the form of bar charts against the HTCs in Figure 9. The reported shell thickness is
obtained through the interpolation of the temperature profile at an axial distance of 90 mm from
the top inlet along the wide symmetry plane from the middle of the narrow face.
Figure 9. Shell thickness at the middle of the narrow face at mold exit vs. effective HTC (W∕m2K) for six cases (2,
3, and 4-7).
With the increase of the imposed HTCs, the quantitative values of the shell thickness increase.
For both casting speeds, a similar is found. As mentioned earlier with the increase of the casting
speed, but for a fixed HTC, the shell thickness decreases. For the increase of HTC from 1,500 to
3,000 W/(m2K) and the lower casting speed of 60 mm/min, an enhancement of 28.73% in solid-
shell thickness is found. On the contrary, for the increase of HTC from 3,000 to 4,500 W/(m2K),
the increment is only 6.37%. The corresponding increase in shell thickness is about 15.60% and
26.33%, respectively, for the higher casting speed of 80 mm/min. For the lower casting speed,
the effect of HTCs (from 1,500 to 3,000 W/m2K) on shell thickness is more pronounced for this
alloy. From the quantitative analysis of the shell thickness, it can be concluded that the value of
HTC at the metal-mold contact region has a significant effect on the shell thickness at the exit of
the mold. In an industrial setting, the cooling water flow rate and its temperature in the mold
should be carefully controlled such that the desired shell thickness at the exit of the mold is
attained. If a solid shell of sufficient thickness at the exit of the mold cannot be obtained from
using an inappropriate mold cooling condition a catastrophic breakout condition may occur.

M. Hasan and L. Begum Heat and Mass Transfer Research Journal Vol. 2, No. 1; 2018
66
4.5. The Effect of Inlet Melt Superheat ( T ) on Shell Thickness
The inlet superheat of the melt is a critical issue which is usually decided by the cast operator
from their previous experience of the casting campaign for an alloy. If the superheat is too low,
the melt may partially solidify in the launder-trough assembly due to inevitable heat losses from
the high-temperature melt to relatively cold ambient air. In such circumstances, the casting
process may have to be stopped and unwanted solid needs to be removed before the next casting
campaign. On the contrary, if the melt superheats is too high unwanted inter-metallic compounds
may form which will inevitably deteriorate the quality of the final cast product. Another more
serious problem may arise for a higher melt superheat is that a sufficiently thick solid shell may
not be developed at the exit of the mold which may lead to the catastrophic breakout condition.
A parametric study is carried out for three superheats, namely 16, 32 and 64oC for each of the two
casting speeds of 60 and 80 mm/min. The impact of the three studied superheat is shown through
the values of the shell thickness along the wide symmetry plane from the middle of the narrow
face at the exit of the mold in the form of a bar chart in Figure 10. From the above figure, it is
seen that with the increase of the superheat the value of the shell thickness decreases as expected.
The latter statement is true for both casting speeds. In the case of the lower casting speed of 60
mm/min an increase of the superheat from 16 to 32oC has resulted in the decrease of the shell
thickness of about 4.29%, whereas for the change in superheat from 32 to 64oC the reduction of
shell thickness is lower which is only about 2.36%. The corresponding decrease in shell thickness
with the increase in HTC is approximately 1.27% and 11.89%, respectively, for the higher casting
speed of 80 mm/min. From this predicted results, it is evident that for this specific copper alloy
the superheat within the range of 32 to 64oC adversely affect the solidification process for the
higher casting speed.
Figure 10. Shell thickness at the middle of the narrow face at mold exit vs. melt superheat (oC) for six cases (2, 3,
and 8-11).
5. Conclusions
The present computational study has employed an in-house 3-D CFD code to model a DC casting
process. Specifically, this study is concerned with a low-head vertical DC slab casting process for
tin bronze alloy. From this study, the following conclusions can be drawn

M. Hasan and L. Begum Heat and Mass Transfer Research Journal Vol. 2, No. 1; 2018
67
1. The higher casting speed results in a deeper sump compared to the lower casting speed. The
sump depth (SD in mm) and liquid pool depth (MD in mm) at the center for three cases (1-
3) of Table 5 can be represented as a function of the simulated casting speed (us in mm/min)
by the following linear equations, respectively: SD = -86.798 + 22.850 us (R2 = 0.997) and
MD = -28.988 + 17.917 us (R2 = 0.989).
2. The vertical extent of the mushy region, which is bounded by the liquidus temperature of
1000oC and solidus temperature of 854oC of the simulated tin bronze alloy, shows that at the
ingot center it increases with the increase in the casting speed in a linear fashion. The mushy
thickness at the center (MT in mm) for three cases (1-3) of Table 5 can be represented as a
function of the casting speed (us in mm/min) by the equation: MT = - 57.810 + 4.933 us (R2
= 0.983).
3. For an increase in casting speed the solid shell thickness at the exit of the mold decreases,
which in turn is manifested by the increase of the surface temperature of the strand. The shell
thickness at the center of the narrow face at the mold exit (ST in mm) for three cases (1-3) of
Table 5 can be represented by a linear function of the casting speed (us in mm/min) according
to: ST = 37.637 - 0.221 us (R2 = 0.993).
4. Provided all conditions remain the same, for an increase of the melt superheat, the shell
thickness at the mold exit decreases and a reduction in shell thickness is more pronounced for
the higher range of the superheat for the higher casting speeds.
5. When all other parameters are fixed, for a higher HTC at the metal-mold contact region, the
shell thickness at the mold exit is greater. The enhancement of the shell thickness is more
pronounced for the lower HTCs at lower casting speed.
6. The thermal buoyancy force has a significant effect on the results. For a higher casting speed,
a stronger thermal convective flow in the melt is seen to develop compared to the lower
casting speed.
The above-predicted results are the first of its kind for an industrial scale slab DCC of the tin
bronze alloy. The present authors believe that the quantitative information provided here for
various important quantities like shell thickness, sump depth, liquid pool depth, mushy thickness,
etc. will help the designers and operators of such casters in a significant way
One of the difficulties encountered in modeling the mushy zone is the lack of information for the
above alloy showing the functional variation of the liberation of the latent heat of solidification
with temperature. In order to develop a model it is easy to allow a linear variation of liquid
fraction with regard to the solidus and liquidus temperatures in the mushy zone. It is to be noted
that the solidification rate in a DC casting process is rather low and hence unlike rapid
solidification processes an equilibrium assumption is fully justified for this process.
Acknowledgments
This work is partially supported from the National Sciences and Engineering Research Council
(NSERC) of Canada Discovery Grant RGPIN48158 awarded to M. Hasan of McGill University,
Montreal, for which authors are grateful.
M. Hasan and L. Begum Heat and Mass Transfer Research Journal Vol. 2, No. 1; 2018
68
References
[1] J.F. Grandfield, D.G. Eskin and I. Bainbridge, Direct-Chill Casting of Light Alloys: Science and
Technology, Hoboken, Nj: John Wiley and Sons, Inc. p. 242; p. 334, 2013.
[2] D.G. Eskin, Physical Metallurgy of Direct Chill Casting of Aluminum Alloys, Advances in Metallic
Alloys. Boca Raton, FL:CRC Press, Taylor & Francis Group, p. 120-122, 2008.
[3] L. Begum and M. Hasan, 3-D CFD simulation of a vertical direct chill slab caster with a submerged
nozzle and a porous filter delivery system, Int. J. Heat & Mass Transfer, vol. 73, pp. 42-58, 2014.
[4] L. Begum and M. Hasan, A numerical study of 3D turbulent melt flow and solidification in a direct
chill slab caster with a porous combo bag melt distributor, Numerical Heat Transfer, Part A:
Applications, vol. 67(7), pp. 746-770, 2015.
[5] M. Hasan and L. Begum, Three-dimensional numerical study of a low head direct chill slab caster for
aluminum alloy AA-5052, ASME Journal of Thermal Sciences and Engineering Applications, vol. 7,
Article no. 021008, pp. 1-15, 2015.
[6] L. Begum and M. Hasan, A numerical study of 3D turbulent melt flow and solidification in a Direct
Chill slab caster with an open-top melt feeding system, Numerical Heat Transfer, Part A: Applications,
vol. 67(7), pp. 719-745, 2015.
[7] L. Begum and M. Hasan, Numerical study of turbulent flow and solidification of a Direct Chill caster
fitted with a channel bag, Heat and Mass Transfer Journal, vol. 51, pp. 759-779, 2015.
[8] M. Hasan and L. Begum, Modeling of transport phenomena in low-head Direct Chill caster for
AA7050 alloy, AIAA Journal of Thermophysics and Heat Transfer, vol. 30(1), pp. 168-181, 2016.
[9] J. Sengupta, B.G. Thomas and M.A. Wells, The use of water cooling during the continuous casting of
steel and aluminum alloys, Metall. Mater. Trans. A, vol. 36A, pp.187-204, 2005.
[10] B. Rinderer, P. Austen and A. Tuff, Casthouse modifications for improved slab quality, Light Metals,
The Minerals, Metals & Materials Society, Warrendale, PA, pp. 1-6, 2003.
[11] Tin Bronze Alloy (C903); Physical Properties, Thermal Properties. 1www.morganbronze.com/pdf/c903_tin_bronze.pdf and 2www.beartechalloys.com/cast-alloys-
c903.html
[12] M. Hasan and L. Begum, On numerical modeling of low-head direct chill ingot caster for magnesium
alloy AZ31, Journal of Magnesium and Alloys, vol. 2, pp. 275-286, 2014.
[13] M. Hasan and L. Begum, Semi-continuous casting of magnesium alloy AZ91 using a filtered melt
delivery system, Journal of Magnesium and Alloys, vol. 3(4), pp. 283-301, 2015.
[14] L. Begum, 3-D Transport Phenomena in Vertical Direct Chill Casting Processes (PhD. thesis), Dept.
of Mining and Materials Engineering, McGill University, Montreal, Quebec, Canada, 2013.
[15] V.R. Voller and C.A. Prakash, Fixed grid numerical modeling methodology for convection-diffusion
mushy region phase-change problems, Int. J. Heat Mass Transfer, vol. 30(8), pp. 1709-1719, 1987.
[16] S.H. Seyedein and M. Hasan, A three-dimensional simulation of coupled turbulent flow and
macroscopic solidification heat transfer for continuous slab casters, Int. J. Heat Mass Transfer, vol.
40(18), pp. 4405-4423, 1997.
[17] C.J. Vreeman and F.P. Incropera, The effect of free-floating dendrites and convection on
macrosegregation in direct chill cast aluminum alloys part II: predictions for Al-Cu and Al-Mg alloys,
Int. J. Heat Mass Transfer, vol. 43(5), pp. 687-704, 2000.

M. Hasan and L. Begum Heat and Mass Transfer Research Journal Vol. 2, No. 1; 2018
69
[18] Mr. Turina McClelland, Marketing Communications Director (2013). Personal communications,
http://www.Wagstaff.com
[19] S.V. Patankar, Numerical Heat Transfer and Fluid Flow, 1st ed., Hemisphere Publishing Corporation,
NY:Taylor and Francis Group, p. 88-90; p. 126-131, 1980.
[20] H.K. Versteeg and W. Malalasekera, An Introduction to Computational Fluid Dynamics, The Finite
Volume Method, 1st ed., Longman Scientific Technical, Longman Group Ltd., Essex, England, p.
142-146, 1995.
[21] W.K. Jones Jr, D. Xu, J. Evans, W.E. Williams and D.P. Cook, Effects of combo-bag geometry on
the thermal history and sump profile of a 3104 DC cast ingot, Light Metals, The Minerals, Metals &
Materials Society, Warrendale, PA, USA, pp. 841-845, 1999.
[22] E. Caron and M.A. Wells, Secondary cooling in the direct chill casting of magnesium alloy AZ31,
Metall. Mater. Trans. B., vol. 40B(4), pp. 585-595, 2009.
Biographical information
Dr. Mainul Hasan is a
tenured Associate Professor
and has been teaching in the
Department of Mining and
Materials Engineering at
McGill University, Montreal,
Quebec for over 30 years.,
Dr. Hasan obtained his PhD degree in 1988
from the Department of Chemical
Engineering at McGill University He
obtained his M.Sc degree in 1981 from the
Department of Chemical Engineering,
University of Petroleum and Minerals (now
King Fahd University of Petroleum &
Minerals), Dhahran, Saudi-Arabia. He
received his B.Sc. Eng degree in 1978 from
the Department of Chemical Engineering,
Bangladesh University of Engineering &
Technology, Dhaka, Bangladesh.
For the past 30 or so years Dr. Hasan has
been carrying out scientific research in the
area of mathematical modeling with
particular emphasis on the applications of
advanced computational fluid dynamics
(CFD) in metallurgical and chemical
processes. Over the years, Dr. Hasan has
published more than 100 articles in refereed
journals, conferences proceedings and as
book chapters. At McGill, he has supervised
or co-supervised 12 PhD students and a host
of M.Eng students. Dr. Hasan is a senior
member of the American Society of
Mechanical Engineers (ASME) and
American Institute of Chemical Engineers
(AIChE).
Dr. Latifa Begum, since
September, 2017, is working
as a Research Engineer in
the Department of Mining
and Materials Engineering,
McGill University,
Montreal, Quebec, Canada.
From September, 2015 to August, 2017, she
worked as an NSERC Post Doctoral Fellow
(PDF) at Concordia University in the
Department of Mechanical and Industrial
Engineering, Montreal, Canada under the
supervision of Prof. G. H. Vatistas. In 2008
and 2014, she obtained the M.Eng. in
Materials Engineering (Thesis Option)
degree and PhD in Materials Engineering
degree, respectively from the Department of
Mining and Materials Engineering, McGill
University, Montreal, Quebec, Canada under
the supervision of Professor Mainul Hasan.
She obtained her Bachelor of Science (B.Sc.)
in Engineering degree in 1989 and Master of
Science in Engineering (thesis option)
degree in 1988 from the Department of
Mechanical Engineering, Bangladesh
University of Engineering & Technology,
Dhaka, Bangladesh. From the year 1990 to

M. Hasan and L. Begum Heat and Mass Transfer Research Journal Vol. 2, No. 1; 2018
70
2001, she was a government officer worked
as a Mechanical Engineer in the Ministry of
Communication of Bangladesh. Over the last
four years, Dr. Latifa Begum published as a
first or as a co-author twenty-six journal
papers in various high impact factor heat and
fluid flow journals and a number of
conference papers. Dr. Latifa Begum has
been carrying out scientific research in the
area of mathematical modeling with
particular emphasis on the applications of
advanced computational fluid dynamics in
metallurgical and energy storage/retrieval
processes.