Casinos - GAMCO InvestorsF_20150714.pdfGabelli & Company 2 CASINOS - MARKET OVERVIEW Modern Gaming...
37
Gabelli & Company -Please Refer To Important Disclosures On The Last Page of This Report- Companies Ticker Price Exchange Boyd Gaming Corp. (BYD - $16.47 - NYSE) Churchill Downs, Inc. (CHDN - 129.95 - NASDAQ) Isle of Capri Casinos, Inc. (ISLE - 18.79 - " ) MGM Resorts International (MGM - 18.85 " ) Casinos Source: Ron Niebrugge, Cotai Management, Mountainhighgambler.com, Time Magazine, and Borgata Holding, Folding & Doubling Down Adam Trivison (914) 921-5591 ©2015 Gabelli & Company G.research, Inc. One Corporate Center Rye, NY 10580-1422 Tel (914) 921-5591 www.gabelli.com July 14, 2015
Transcript of Casinos - GAMCO InvestorsF_20150714.pdfGabelli & Company 2 CASINOS - MARKET OVERVIEW Modern Gaming...
Gabelli & Company
-Please Refer To Important Disclosures On The Last Page of This Report-
Companies Ticker Price ExchangeBoyd Gaming Corp. (BYD - $16.47 - NYSE)Churchill Downs, Inc. (CHDN - 129.95 - NASDAQ)Isle of Capri Casinos, Inc. (ISLE - 18.79 - " )MGM Resorts International (MGM - 18.85 " )
Casinos
Source: Ron Niebrugge, Cotai Management, Mountainhighgambler.com, Time Magazine, and Borgata
Holding, Folding & Doubling Down
Adam Trivison (914) 921-5591 ©2015 Gabelli & Company
G.research, Inc. One Corporate Center Rye, NY 10580-1422 Tel (914) 921-5591 www.gabelli.com
July 14, 2015
Gabelli & Company
1
CASINOS – Holding, Folding & Doubling Down
OVERVIEW
Casino stocks have recovered considerably since the depths of the financial crisis with the Market Vectors Gaming ETF (BJK) up around 225% from its low in early March 2009. The Las Vegas Strip has taken a back seat to growth in Macau and regional US markets. Today, all three of the largest casino companies have properties and/or developments in Las Vegas, Macau, and regional US markets. For the past five years, Macau has been driving the narrative and, in large part, the financial performance of these firms. Macau’s unprecedented growth, a 24% CAGR over the past ten years, has been propelled by high-stakes VIP gamblers from Mainland China. But due to the Chinese government’s crackdown on corruption, Chinese gamblers have been staying away from the tables. Year-to-date, Macau gaming revenues are down 37%. In the US, low energy prices and an improving job market are driving an increasing number of casino visits and higher spending per visit. Moreover, an investor-led push to reorganize US casinos into tax-advantaged structures has led some companies to reassess the value of its properties. With these dynamics in place, the search for investment opportunities should be focused on margin of safety and the question: What has been priced in? SUMMARY AND OPINION
Gaming assets operate as a function of the competitive, political and economic dynamics of their particular location and the geographies from which they draw patrons. Thus, casino assets must be assessed on a market-by-market basis.
Macau and Other Asia
While we would wait for greater visibility before putting money to work across the board in Macau, we think that the prospects for Macau look very good in the long-term.
New infrastructure projects and development of the adjacent Hengqin Island will drive increased visitation from a rising Chinese middle class, while strict regulation will likely keep supply growth constrained.
New casino openings in the Philippines and Southeast Asia threaten to steal some low-end VIP patrons, but weak infrastructure in those locals will moderate the risk.
We expect Macau’s 2015 gross gaming revenue to fall to $28 billion from $44 billion in 2014, a decline of 36%; however, we expect the market to stabilize in 2016 as Cotai property openings are offset by the effects of a full smoking ban.
Las Vegas Strip
Due in large part to the expansion of regional casinos, gaming revenue growth on the Strip has been challenged for some time, with gaming revenues (excluding baccarat) stagnant for the past ten years. Investment in non-gaming entertainment, dining, and retail assets has helped to offset the shortfall, but room revenues are the real driver of incremental profit.
Events have become the major driver of visitation to Las Vegas and we think that new investments in convention and arena facilities will drive visitation growth and support room rates with limited room supply growth on the horizon.
We view Genting’s development of a $4 billion, 3,000-room casino as a neutral event as it will seek to leverage the company’s extensive database in an attempt to draw incremental international visitors into the Las Vegas market.
We expect Strip REVPAR to grow at a 3-4% rate over the next five years as increasing occupancy drives ADRs higher.
Regional US
While each market must be judged on its own merits, the following holds true across all US casino markets:
Regional casinos have experienced macro headwinds with middle-class incomes slow to rebound after the recession and the industry’s core +50 customers disproportionately harmed by lower home prices.
To compound matters, many markets have become fully saturated due to expanded commercial gaming legislation as states legislatures have attempted to balance budgets and stimulate economic activity.
With energy prices at lower levels and the job market beginning to show signs of wage growth, we are constructive on regional casinos in markets where the outlook for new supply is limited.
We are less enthused by properties located in markets that are susceptible to in-state gaming expansion and/or border risk.
Finally, we think that REIT conversions and industry consolidation could help surface value for shareholders.
G.research, Inc. One Corporate Center Rye, NY 10580-1422 Tel (914) 921-5591 www.gabelli.com
July 14, 2015
Gabelli & Company
2
CASINOS - MARKET OVERVIEW Modern Gaming Overview
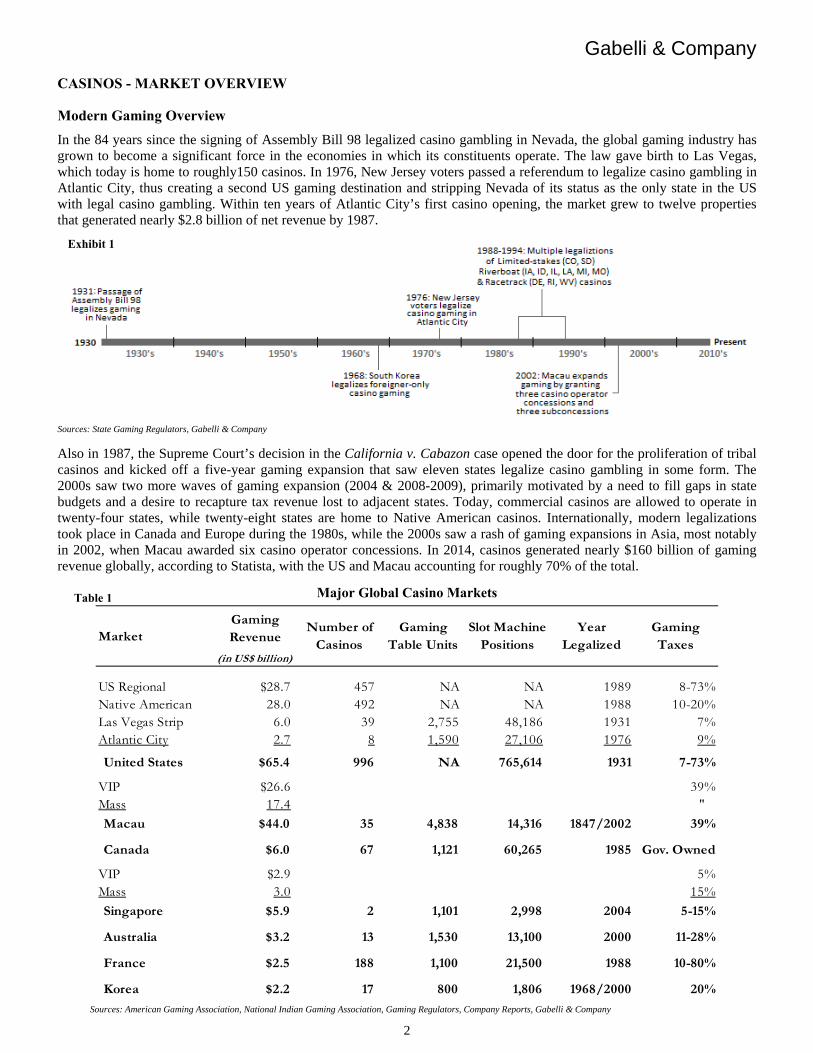
In the 84 years since the signing of Assembly Bill 98 legalized casino gambling in Nevada, the global gaming industry has grown to become a significant force in the economies in which its constituents operate. The law gave birth to Las Vegas, which today is home to roughly150 casinos. In 1976, New Jersey voters passed a referendum to legalize casino gambling in Atlantic City, thus creating a second US gaming destination and stripping Nevada of its status as the only state in the US with legal casino gambling. Within ten years of Atlantic City’s first casino opening, the market grew to twelve properties that generated nearly $2.8 billion of net revenue by 1987.
Sources: State Gaming Regulators, Gabelli & Company
Also in 1987, the Supreme Court’s decision in the California v. Cabazon case opened the door for the proliferation of tribal casinos and kicked off a five-year gaming expansion that saw eleven states legalize casino gambling in some form. The 2000s saw two more waves of gaming expansion (2004 & 2008-2009), primarily motivated by a need to fill gaps in state budgets and a desire to recapture tax revenue lost to adjacent states. Today, commercial casinos are allowed to operate in twenty-four states, while twenty-eight states are home to Native American casinos. Internationally, modern legalizations took place in Canada and Europe during the 1980s, while the 2000s saw a rash of gaming expansions in Asia, most notably in 2002, when Macau awarded six casino operator concessions. In 2014, casinos generated nearly $160 billion of gaming revenue globally, according to Statista, with the US and Macau accounting for roughly 70% of the total.
Major Global Casino Markets
Sources: American Gaming Association, National Indian Gaming Association, Gaming Regulators, Company Reports, Gabelli & Company
Gaming Revenue
(in US$ billion)
US Regional $28.7 457 NA NA 1989 8-73%Native American 28.0 492 NA NA 1988 10-20%Las Vegas Strip 6.0 39 2,755 48,186 1931 7%Atlantic City 2.7 8 1,590 27,106 1976 9%
United States $65.4 996 NA 765,614 1931 7-73%
VIP $26.6 39%Mass 17.4 "
Macau $44.0 35 4,838 14,316 1847/2002 39%
Canada $6.0 67 1,121 60,265 1985 Gov. Owned
VIP $2.9 5%Mass 3.0 15%
Singapore $5.9 2 1,101 2,998 2004 5-15%
Australia $3.2 13 1,530 13,100 2000 11-28%
France $2.5 188 1,100 21,500 1988 10-80%
Korea $2.2 17 800 1,806 1968/2000 20%
Number of Casinos
Gaming Table Units
Slot Machine Positions
Gaming Taxes
Year Legalized
Market
Exhibit 1
Table 1
Gabelli & Company
3
CASINOS - MARKET OVERVIEW
Casino Market Segments
We recommend segmenting casinos and the markets in which they operate based on their customer reach in order to better assess competitive risk, unit economics, and capital spending needs. These distinctions are not mutually exclusive as many markets may contain a mix of casinos across segments.
Global Destination (e.g. Las Vegas Strip, Macau, Singapore)
- Resort properties with significant non-gaming amenities create a draw
- Hotel room capacity and infrastructure drive traffic
- Junkets often used to source international visitors
Regional Destination (e.g. Downtown Las Vegas, Atlantic City, Blackhawk - CO)
- Mix of overnight vacationers, regional day-trippers, and local crowd
- Adding hotels and other non-gaming amenities can grow the market and sustain returns
- Susceptible to competition from gaming expansions in the markets from which they draw visitors
Locals Markets (e.g. Boulder Strip - NV, Detroit, Philadelphia)
- Vast majority of visitors travel less than a one-hour drive by car
- Less of a special occasion, more a part of regular discretionary spending
- Building customer relationships via loyalty programs is critical
Licensing and Oversight
Casinos have natural barriers to entry as governing authorities put limits on gaming activity. Generally, the number of casino licenses and in some cases, the number of gaming devices, in a given market is limited to a finite number.
In most jurisdictions, licensing and regulation are performed on a regional basis (e.g. state-level in the US, provincial-level in Canada and Australia) by governing bodies specifically tasked with gaming regulation.
Typically, each casino property as well all key persons must be approved and licensed by a gaming regulator to operate.
In the US, Native American tribes operate casinos on their lands based on compacts negotiated with the state in which the tribe is located; slot/table limits, ability to expand and taxation are subject to the terms agreed upon in the compact.
Online & Social Gaming
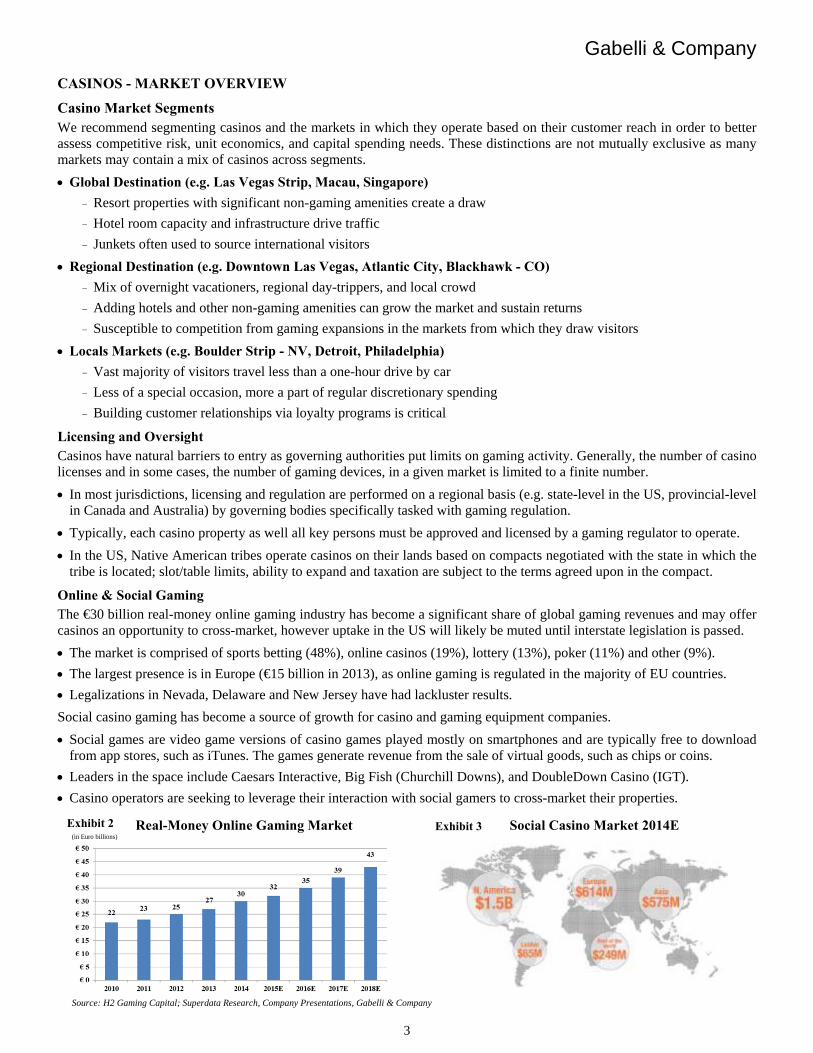
The €30 billion real-money online gaming industry has become a significant share of global gaming revenues and may offer casinos an opportunity to cross-market, however uptake in the US will likely be muted until interstate legislation is passed.
The market is comprised of sports betting (48%), online casinos (19%), lottery (13%), poker (11%) and other (9%).
The largest presence is in Europe (€15 billion in 2013), as online gaming is regulated in the majority of EU countries.
Legalizations in Nevada, Delaware and New Jersey have had lackluster results.
Social casino gaming has become a source of growth for casino and gaming equipment companies.
Social games are video game versions of casino games played mostly on smartphones and are typically free to download from app stores, such as iTunes. The games generate revenue from the sale of virtual goods, such as chips or coins.
Leaders in the space include Caesars Interactive, Big Fish (Churchill Downs), and DoubleDown Casino (IGT).
Casino operators are seeking to leverage their interaction with social gamers to cross-market their properties.
Real-Money Online Gaming Market Social Casino Market 2014E (in Euro billions)
Source: H2 Gaming Capital; Superdata Research, Company Presentations, Gabelli & Company
Exhibit 2 Exhibit 3
Gabelli & Company
4
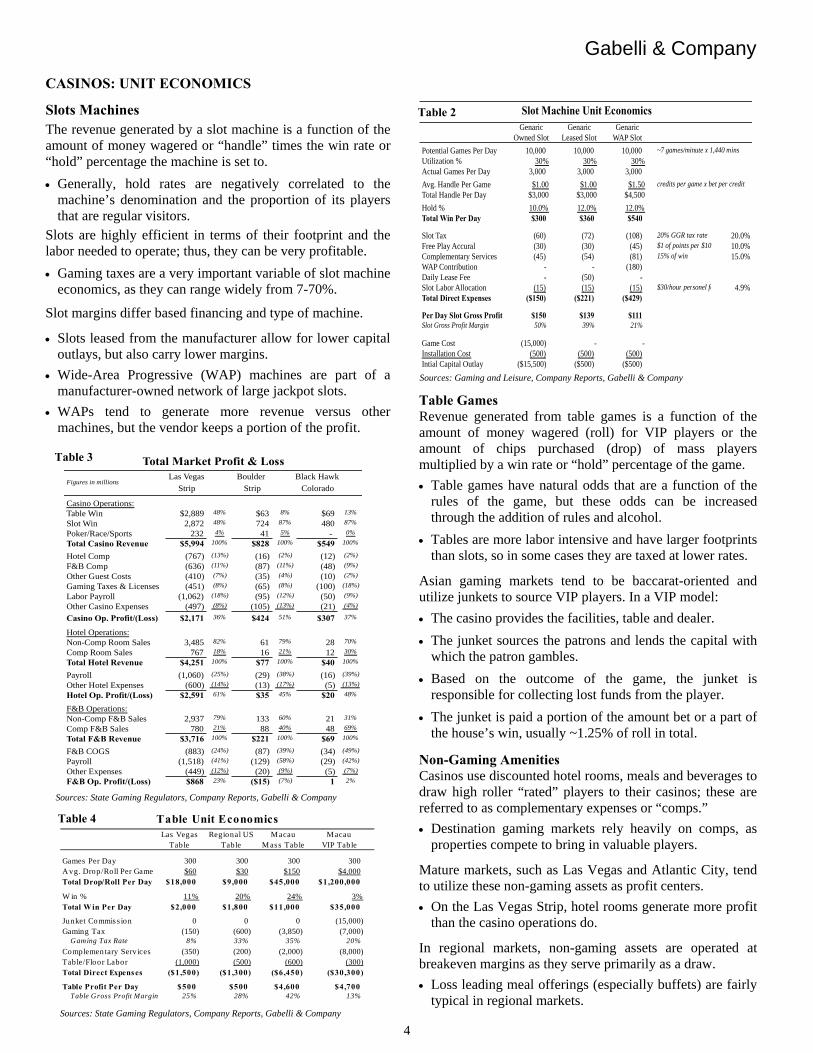
Sources: Gaming and Leisure, Company Reports, Gabelli & Company
Genaric Genaric GenaricOwned Slot Leased Slot WAP Slot
Potential Games Per Day 10,000 10,000 10,000 ~7 games/minute x 1,440 mins
Utilization % 30% 30% 30%Actual Games Per Day 3,000 3,000 3,000
Avg. Handle Per Game $1.00 $1.00 $1.50 credits per game x bet per credit
Total Handle Per Day $3,000 $3,000 $4,500
Hold % 10.0% 12.0% 12.0%Total Win Per Day $300 $360 $540
Slot Tax (60) (72) (108) 20% GGR tax rate 20.0%Free Play Accural (30) (30) (45) $1 of points per $10 10.0%Complementary Services (45) (54) (81) 15% of win 15.0%WAP Contribution - - (180)Daily Lease Fee - (50) -Slot Labor Allocation (15) (15) (15) $30/hour personel fo 4.9%Total Direct Expenses ($150) ($221) ($429)
Per Day Slot Gross Profit $150 $139 $111Slot Gross Profit Margin 50% 39% 21%
Game Cost (15,000) - -Installation Cost (500) (500) (500)Intial Capital Outlay ($15,500) ($500) ($500)
Slot Machine Unit Economics
Sources: State Gaming Regulators, Company Reports, Gabelli & Company
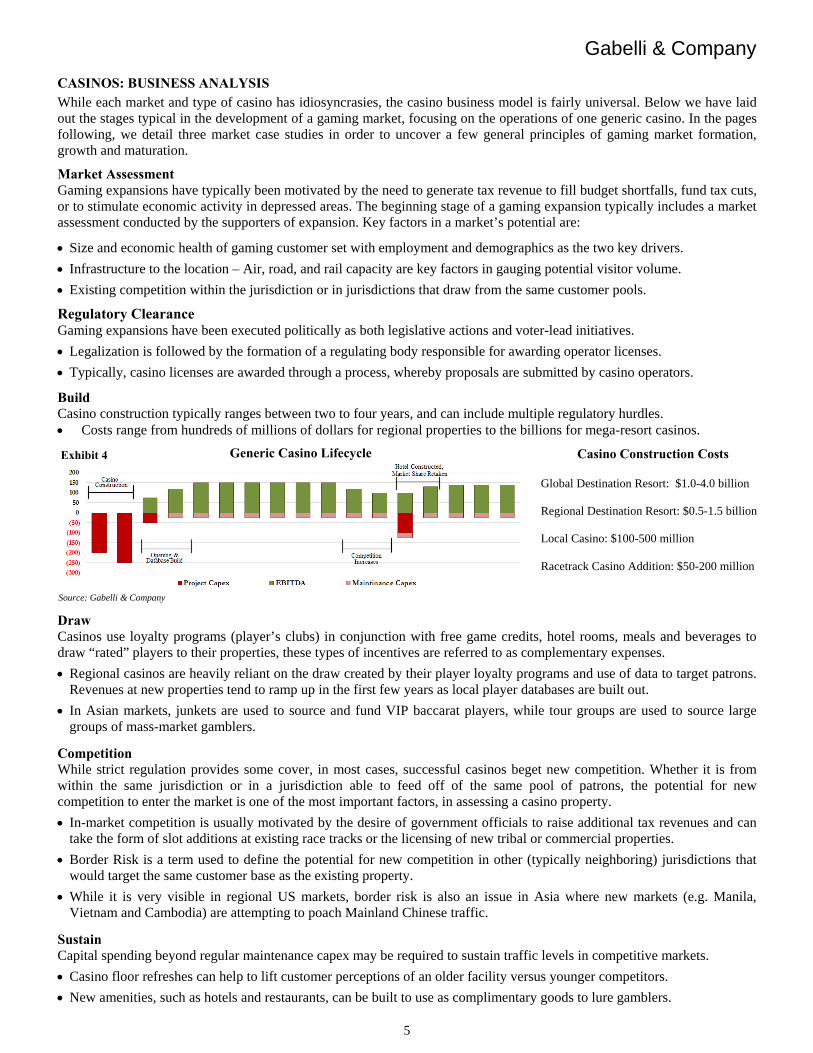
Las Vegas Boulder Black Hawk
Strip Strip Colorado
Casino Operations:Table Win $2,889 48% $63 8% $69 13%
Slot Win 2,872 48% 724 87% 480 87%
Poker/Race/Sports 232 4% 41 5% - 0%
Total Casino Revenue $5,994 100% $828 100% $549 100%
Hotel Comp (767) (13%) (16) (2%) (12) (2%)
F&B Comp (636) (11%) (87) (11%) (48) (9%)
Other Guest Costs (410) (7%) (35) (4%) (10) (2%)
Gaming Taxes & Licenses (451) (8%) (65) (8%) (100) (18%)
Labor Payroll (1,062) (18%) (95) (12%) (50) (9%)
Other Casino Expenses (497) (8%) (105) (13%) (21) (4%)
Casino Op. Profit/(Loss) $2,171 36% $424 51% $307 37%
Hotel Operations:Non-Comp Room Sales 3,485 82% 61 79% 28 70%
Comp Room Sales 767 18% 16 21% 12 30%
Total Hotel Revenue $4,251 100% $77 100% $40 100%
Payroll (1,060) (25%) (29) (38%) (16) (39%)
Other Hotel Expenses (600) (14%) (13) (17%) (5) (13%)
Hotel Op. Profit/(Loss) $2,591 61% $35 45% $20 48%
F&B Operations:Non-Comp F&B Sales 2,937 79% 133 60% 21 31%
Comp F&B Sales 780 21% 88 40% 48 69%
Total F&B Revenue $3,716 100% $221 100% $69 100%
F&B COGS (883) (24%) (87) (39%) (34) (49%)
Payroll (1,518) (41%) (129) (58%) (29) (42%)
Other Expenses (449) (12%) (20) (9%) (5) (7%)
F&B Op. Profit/(Loss) $868 23% ($15) (7%) 1 2%
Figures in millions
Total Market Profit & Loss
Sources: State Gaming Regulators, Company Reports, Gabelli & Company
Las Vegas Regional US M acau M acauTable Table M ass Table VIP Table
Games Per Day 300 300 300 300A vg. Drop/Roll Per Game $60 $30 $150 $4,000Total Drop/Roll Per Day $18,000 $9,000 $45,000 $1,200,000
W in % 11% 20% 24% 3%Total Win Per Day $2,000 $1,800 $11,000 $35,000
Junket Commis s ion 0 0 0 (15,000)Gaming Tax (150) (600) (3,850) (7,000)
Gaming Tax Rate 8% 33% 35% 20%
Complementary Services (350) (200) (2,000) (8,000)Table/Floor Labor (1,000) (500) (600) (300)Total Direct Expenses ($1,500) ($1,300) ($6,450) ($30,300)
Table Profit Per Day $500 $500 $4,600 $4,700Table Gross Profit Margin 25% 28% 42% 13%
Table Unit Economics
CASINOS: UNIT ECONOMICS
Slots Machines
The revenue generated by a slot machine is a function of the amount of money wagered or “handle” times the win rate or “hold” percentage the machine is set to.
Generally, hold rates are negatively correlated to the machine’s denomination and the proportion of its players that are regular visitors.
Slots are highly efficient in terms of their footprint and the labor needed to operate; thus, they can be very profitable.
Gaming taxes are a very important variable of slot machine economics, as they can range widely from 7-70%.
Slot margins differ based financing and type of machine.
Slots leased from the manufacturer allow for lower capital outlays, but also carry lower margins.
Wide-Area Progressive (WAP) machines are part of a manufacturer-owned network of large jackpot slots.
WAPs tend to generate more revenue versus other machines, but the vendor keeps a portion of the profit.
Table Games Revenue generated from table games is a function of the amount of money wagered (roll) for VIP players or the amount of chips purchased (drop) of mass players multiplied by a win rate or “hold” percentage of the game.
Table games have natural odds that are a function of the rules of the game, but these odds can be increased through the addition of rules and alcohol.
Tables are more labor intensive and have larger footprints than slots, so in some cases they are taxed at lower rates.
Asian gaming markets tend to be baccarat-oriented and utilize junkets to source VIP players. In a VIP model:
The casino provides the facilities, table and dealer.
The junket sources the patrons and lends the capital with which the patron gambles.
Based on the outcome of the game, the junket is responsible for collecting lost funds from the player.
The junket is paid a portion of the amount bet or a part of the house’s win, usually ~1.25% of roll in total.
Non-Gaming Amenities Casinos use discounted hotel rooms, meals and beverages to draw high roller “rated” players to their casinos; these are referred to as complementary expenses or “comps.”
Destination gaming markets rely heavily on comps, as properties compete to bring in valuable players.
Mature markets, such as Las Vegas and Atlantic City, tend to utilize these non-gaming assets as profit centers.
On the Las Vegas Strip, hotel rooms generate more profit than the casino operations do.
In regional markets, non-gaming assets are operated at breakeven margins as they serve primarily as a draw.
Loss leading meal offerings (especially buffets) are fairly typical in regional markets.
Table 2
Table 3
Table 4
Gabelli & Company
5
CASINOS: BUSINESS ANALYSIS
While each market and type of casino has idiosyncrasies, the casino business model is fairly universal. Below we have laid out the stages typical in the development of a gaming market, focusing on the operations of one generic casino. In the pages following, we detail three market case studies in order to uncover a few general principles of gaming market formation, growth and maturation.
Market Assessment Gaming expansions have typically been motivated by the need to generate tax revenue to fill budget shortfalls, fund tax cuts, or to stimulate economic activity in depressed areas. The beginning stage of a gaming expansion typically includes a market assessment conducted by the supporters of expansion. Key factors in a market’s potential are:
Size and economic health of gaming customer set with employment and demographics as the two key drivers.
Infrastructure to the location – Air, road, and rail capacity are key factors in gauging potential visitor volume.
Existing competition within the jurisdiction or in jurisdictions that draw from the same customer pools.
Regulatory Clearance Gaming expansions have been executed politically as both legislative actions and voter-lead initiatives.
Legalization is followed by the formation of a regulating body responsible for awarding operator licenses.
Typically, casino licenses are awarded through a process, whereby proposals are submitted by casino operators.
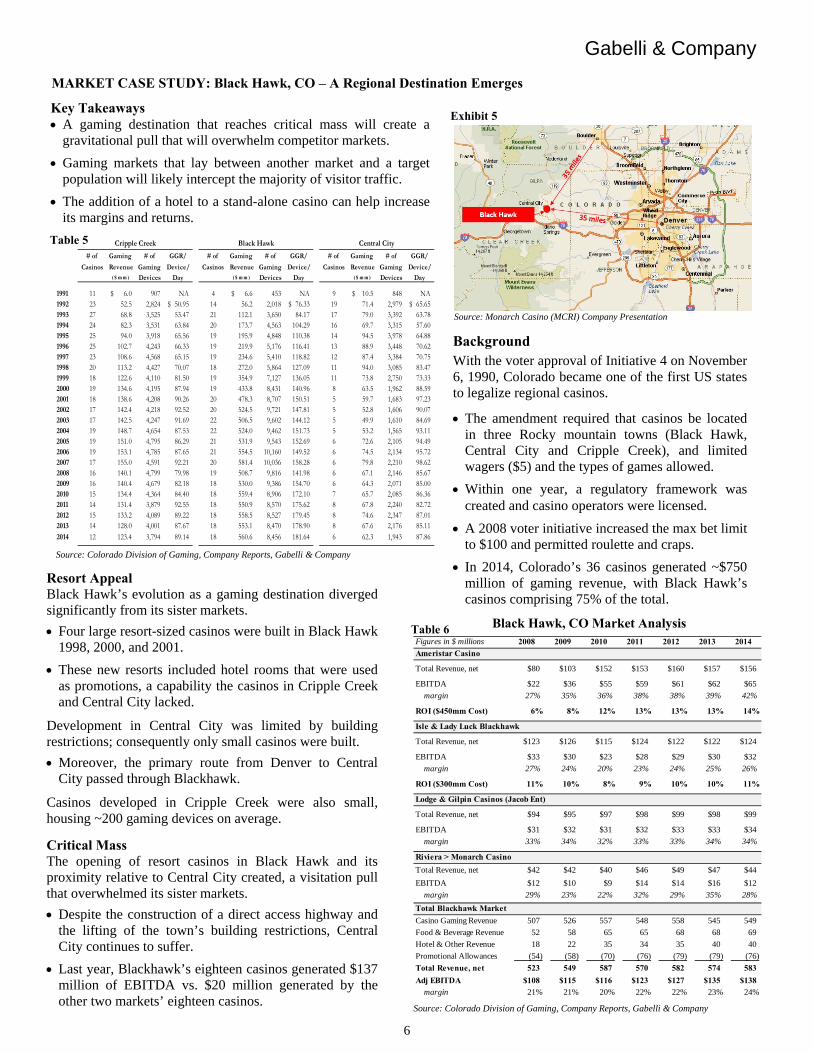
Build Casino construction typically ranges between two to four years, and can include multiple regulatory hurdles. Costs range from hundreds of millions of dollars for regional properties to the billions for mega-resort casinos.
Draw Casinos use loyalty programs (player’s clubs) in conjunction with free game credits, hotel rooms, meals and beverages to draw “rated” players to their properties, these types of incentives are referred to as complementary expenses.
Regional casinos are heavily reliant on the draw created by their player loyalty programs and use of data to target patrons. Revenues at new properties tend to ramp up in the first few years as local player databases are built out.
In Asian markets, junkets are used to source and fund VIP baccarat players, while tour groups are used to source large groups of mass-market gamblers.
Competition While strict regulation provides some cover, in most cases, successful casinos beget new competition. Whether it is from within the same jurisdiction or in a jurisdiction able to feed off of the same pool of patrons, the potential for new competition to enter the market is one of the most important factors, in assessing a casino property.
In-market competition is usually motivated by the desire of government officials to raise additional tax revenues and can take the form of slot additions at existing race tracks or the licensing of new tribal or commercial properties.
Border Risk is a term used to define the potential for new competition in other (typically neighboring) jurisdictions that would target the same customer base as the existing property.
While it is very visible in regional US markets, border risk is also an issue in Asia where new markets (e.g. Manila, Vietnam and Cambodia) are attempting to poach Mainland Chinese traffic.
Sustain Capital spending beyond regular maintenance capex may be required to sustain traffic levels in competitive markets.
Casino floor refreshes can help to lift customer perceptions of an older facility versus younger competitors.
New amenities, such as hotels and restaurants, can be built to use as complimentary goods to lure gamblers.
Generic Casino Lifecycle
Source: Gabelli & Company
Casino Construction Costs
Global Destination Resort: $1.0-4.0 billion Regional Destination Resort: $0.5-1.5 billion Local Casino: $100-500 million Racetrack Casino Addition: $50-200 million
Exhibit 4
Gabelli & Company
6
Background
With the voter approval of Initiative 4 on November 6, 1990, Colorado became one of the first US states to legalize regional casinos.
The amendment required that casinos be located in three Rocky mountain towns (Black Hawk, Central City and Cripple Creek), and limited wagers ($5) and the types of games allowed.
Within one year, a regulatory framework was created and casino operators were licensed.
A 2008 voter initiative increased the max bet limit to $100 and permitted roulette and craps.
In 2014, Colorado’s 36 casinos generated ~$750 million of gaming revenue, with Black Hawk’s casinos comprising 75% of the total.
Black Hawk, CO Market Analysis
Source: Colorado Division of Gaming, Company Reports, Gabelli & Company
Figures in $ millions 2008 2009 2010 2011 2012 2013 2014
Ameristar Casino
Total Revenue, net $80 $103 $152 $153 $160 $157 $156
EBITDA $22 $36 $55 $59 $61 $62 $65
margin 27% 35% 36% 38% 38% 39% 42%
ROI ($450mm Cost) 6% 8% 12% 13% 13% 13% 14%
Isle & Lady Luck Blackhawk
Total Revenue, net $123 $126 $115 $124 $122 $122 $124
EBITDA $33 $30 $23 $28 $29 $30 $32
margin 27% 24% 20% 23% 24% 25% 26%
ROI ($300mm Cost) 11% 10% 8% 9% 10% 10% 11%
Lodge & Gilpin Casinos (Jacob Ent)
Total Revenue, net $94 $95 $97 $98 $99 $98 $99
EBITDA $31 $32 $31 $32 $33 $33 $34
margin 33% 34% 32% 33% 33% 34% 34%
Riviera > Monarch Casino
Total Revenue, net $42 $42 $40 $46 $49 $47 $44
EBITDA $12 $10 $9 $14 $14 $16 $12
margin 29% 23% 22% 32% 29% 35% 28%
Total Blackhawk Market
Casino Gaming Revenue 507 526 557 548 558 545 549
Food & Beverage Revenue 52 58 65 65 68 68 69
Hotel & Other Revenue 18 22 35 34 35 40 40
Promotional Allowances (54) (58) (70) (76) (79) (79) (76)
Total Revenue, net 523 549 587 570 582 574 583
Adj EBITDA $108 $115 $116 $123 $127 $135 $138
margin 21% 21% 20% 22% 22% 23% 24%
# of Gaming # of GGR/ # of Gaming # of GGR/ # of Gaming # of GGR/
Casinos Revenue Gaming Device/ Casinos Revenue Gaming Device/ Casinos Revenue Gaming Device/($ m m ) Devices Day ($ m m ) Devices Day ($ m m ) Devices Day
1991 11 6.0$ 907 NA 4 6.6$ 453 NA 9 10.5$ 848 NA1992 23 52.5 2,824 50.95$ 14 56.2 2,018 76.33$ 19 71.4 2,979 65.65$ 1993 27 68.8 3,525 53.47 21 112.1 3,650 84.17 17 79.0 3,392 63.78 1994 24 82.3 3,531 63.84 20 173.7 4,563 104.29 16 69.7 3,315 57.60 1995 25 94.0 3,918 65.56 19 195.9 4,848 110.38 14 94.5 3,978 64.88 1996 25 102.7 4,243 66.33 19 219.9 5,176 116.41 13 88.9 3,448 70.62 1997 23 108.6 4,568 65.15 19 234.6 5,410 118.82 12 87.4 3,384 70.75 1998 20 113.2 4,427 70.07 18 272.0 5,864 127.09 11 94.0 3,085 83.47 1999 18 122.6 4,110 81.50 19 354.9 7,127 136.05 11 73.8 2,750 73.33 2000 19 134.6 4,195 87.94 19 433.8 8,431 140.96 8 63.5 1,962 88.59 2001 18 138.6 4,208 90.26 20 478.3 8,707 150.51 5 59.7 1,683 97.23 2002 17 142.4 4,218 92.52 20 524.5 9,721 147.81 5 52.8 1,606 90.07 2003 17 142.5 4,247 91.69 22 506.5 9,602 144.12 5 49.9 1,610 84.69 2004 19 148.7 4,654 87.53 22 524.0 9,462 151.73 5 53.2 1,565 93.11 2005 19 151.0 4,795 86.29 21 531.9 9,543 152.69 6 72.6 2,105 94.49 2006 19 153.1 4,785 87.65 21 554.5 10,160 149.52 6 74.5 2,134 95.72 2007 17 155.0 4,591 92.21 20 581.4 10,036 158.28 6 79.8 2,210 98.62 2008 16 140.1 4,799 79.98 19 508.7 9,816 141.98 6 67.1 2,146 85.67 2009 16 140.4 4,679 82.18 18 530.0 9,386 154.70 6 64.3 2,071 85.00 2010 15 134.4 4,364 84.40 18 559.4 8,906 172.10 7 65.7 2,085 86.36 2011 14 131.4 3,879 92.55 18 550.9 8,570 175.62 8 67.8 2,240 82.72 2012 15 133.2 4,089 89.22 18 558.5 8,527 179.45 8 74.6 2,347 87.01 2013 14 128.0 4,001 87.67 18 553.1 8,470 178.90 8 67.6 2,176 85.11 2014 12 123.4 3,794 89.14 18 560.6 8,456 181.64 6 62.3 1,943 87.86
Cripple Creek Black Hawk Central City
MARKET CASE STUDY: Black Hawk, CO – A Regional Destination Emerges
Source: Monarch Casino (MCRI) Company Presentation
Key Takeaways A gaming destination that reaches critical mass will create a
gravitational pull that will overwhelm competitor markets.
Gaming markets that lay between another market and a target population will likely intercept the majority of visitor traffic.
The addition of a hotel to a stand-alone casino can help increase its margins and returns.
Resort Appeal Black Hawk’s evolution as a gaming destination diverged significantly from its sister markets.
Four large resort-sized casinos were built in Black Hawk 1998, 2000, and 2001.
These new resorts included hotel rooms that were used as promotions, a capability the casinos in Cripple Creek and Central City lacked.
Development in Central City was limited by building restrictions; consequently only small casinos were built.
Moreover, the primary route from Denver to Central City passed through Blackhawk.
Casinos developed in Cripple Creek were also small, housing ~200 gaming devices on average.
Critical Mass The opening of resort casinos in Black Hawk and its proximity relative to Central City created, a visitation pull that overwhelmed its sister markets.
Despite the construction of a direct access highway and the lifting of the town’s building restrictions, Central City continues to suffer.
Last year, Blackhawk’s eighteen casinos generated $137 million of EBITDA vs. $20 million generated by the other two markets’ eighteen casinos.
Exhibit 5
Table 5
Table 6
Source: Colorado Division of Gaming, Company Reports, Gabelli & Company
Gabelli & Company
7
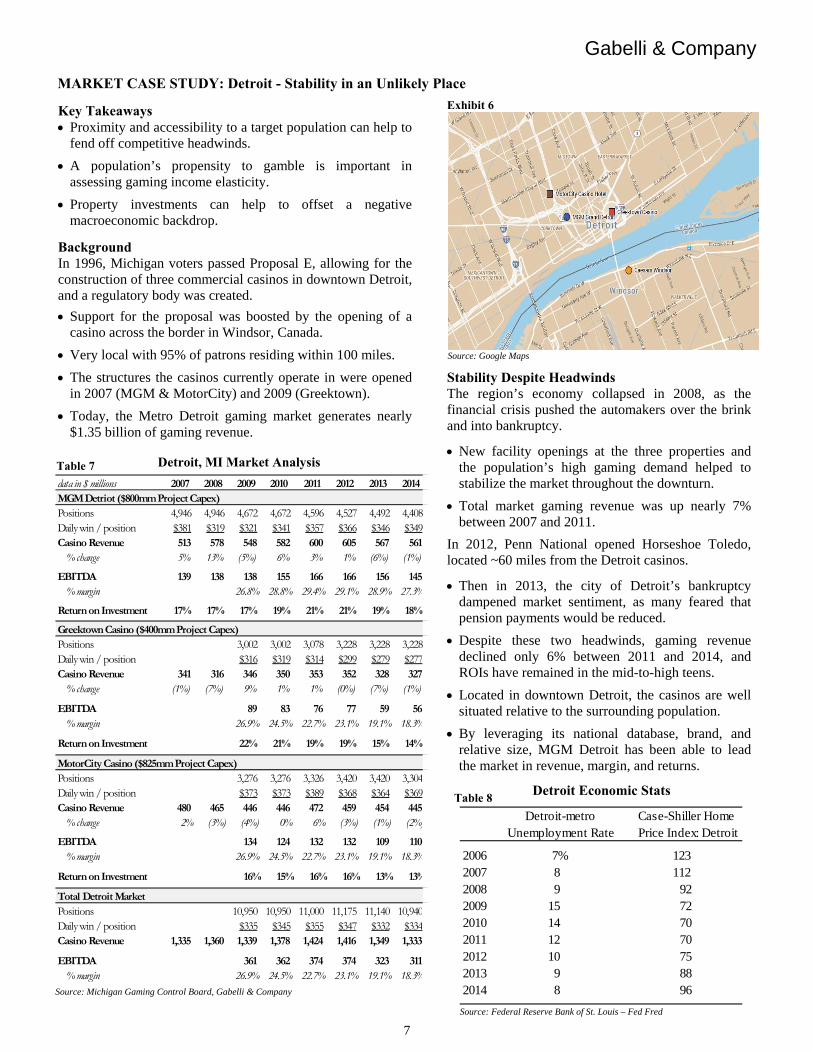
MARKET CASE STUDY: Detroit - Stability in an Unlikely Place
Key Takeaways Proximity and accessibility to a target population can help to
fend off competitive headwinds.
A population’s propensity to gamble is important in assessing gaming income elasticity.
Property investments can help to offset a negative macroeconomic backdrop.
Background In 1996, Michigan voters passed Proposal E, allowing for the construction of three commercial casinos in downtown Detroit, and a regulatory body was created.
Support for the proposal was boosted by the opening of a casino across the border in Windsor, Canada.
Very local with 95% of patrons residing within 100 miles.
The structures the casinos currently operate in were opened in 2007 (MGM & MotorCity) and 2009 (Greektown).
Today, the Metro Detroit gaming market generates nearly $1.35 billion of gaming revenue.
Source: Google Maps
Stability Despite Headwinds The region’s economy collapsed in 2008, as the financial crisis pushed the automakers over the brink and into bankruptcy.
New facility openings at the three properties and the population’s high gaming demand helped to stabilize the market throughout the downturn.
Total market gaming revenue was up nearly 7% between 2007 and 2011.
In 2012, Penn National opened Horseshoe Toledo, located ~60 miles from the Detroit casinos.
Then in 2013, the city of Detroit’s bankruptcy dampened market sentiment, as many feared that pension payments would be reduced.
Despite these two headwinds, gaming revenue declined only 6% between 2011 and 2014, and ROIs have remained in the mid-to-high teens.
Located in downtown Detroit, the casinos are well situated relative to the surrounding population.
By leveraging its national database, brand, and relative size, MGM Detroit has been able to lead the market in revenue, margin, and returns.
Detroit, MI Market Analysis
Source: Michigan Gaming Control Board, Gabelli & Company
data in $ millions 2007 2008 2009 2010 2011 2012 2013 2014MGM Detriot ($800mm Project Capex)Positions 4,946 4,946 4,672 4,672 4,596 4,527 4,492 4,408Daily win / position $381 $319 $321 $341 $357 $366 $346 $349Casino Revenue 513 578 548 582 600 605 567 561
% change 5% 13% (5%) 6% 3% 1% (6%) (1%)
EBITDA 139 138 138 155 166 166 156 145% margin 26.8% 28.8% 29.4% 29.1% 28.9% 27.3%
Return on Investment 17% 17% 17% 19% 21% 21% 19% 18%
Greektown Casino ($400mm Project Capex)Positions 3,002 3,002 3,078 3,228 3,228 3,228Daily win / position $316 $319 $314 $299 $279 $277Casino Revenue 341 316 346 350 353 352 328 327
% change (1%) (7%) 9% 1% 1% (0%) (7%) (1%)
EBITDA 89 83 76 77 59 56% margin 26.9% 24.5% 22.7% 23.1% 19.1% 18.3%
Return on Investment 22% 21% 19% 19% 15% 14%
MotorCity Casino ($825mm Project Capex)Positions 3,276 3,276 3,326 3,420 3,420 3,304Daily win / position $373 $373 $389 $368 $364 $369Casino Revenue 480 465 446 446 472 459 454 445
% change 2% (3%) (4%) 0% 6% (3%) (1%) (2%)
EBITDA 134 124 132 132 109 110% margin 26.9% 24.5% 22.7% 23.1% 19.1% 18.3%
Return on Investment 16% 15% 16% 16% 13% 13%
Total Detroit MarketPositions 10,950 10,950 11,000 11,175 11,140 10,940Daily win / position $335 $345 $355 $347 $332 $334Casino Revenue 1,335 1,360 1,339 1,378 1,424 1,416 1,349 1,333
EBITDA 361 362 374 374 323 311% margin 26.9% 24.5% 22.7% 23.1% 19.1% 18.3%
Detroit Economic Stats
Source: Federal Reserve Bank of St. Louis – Fed Fred
Detroit-metro Case-Shiller Home Unemployment Rate Price Index: Detroit
2006 7% 123 2007 8 112 2008 9 922009 15 722010 14 702011 12 702012 10 752013 9 882014 8 96
Exhibit 6
Table 7
Table 8
Gabelli & Company
8
MARKET CASE STUDY: The Northeast – Competition Encroaches
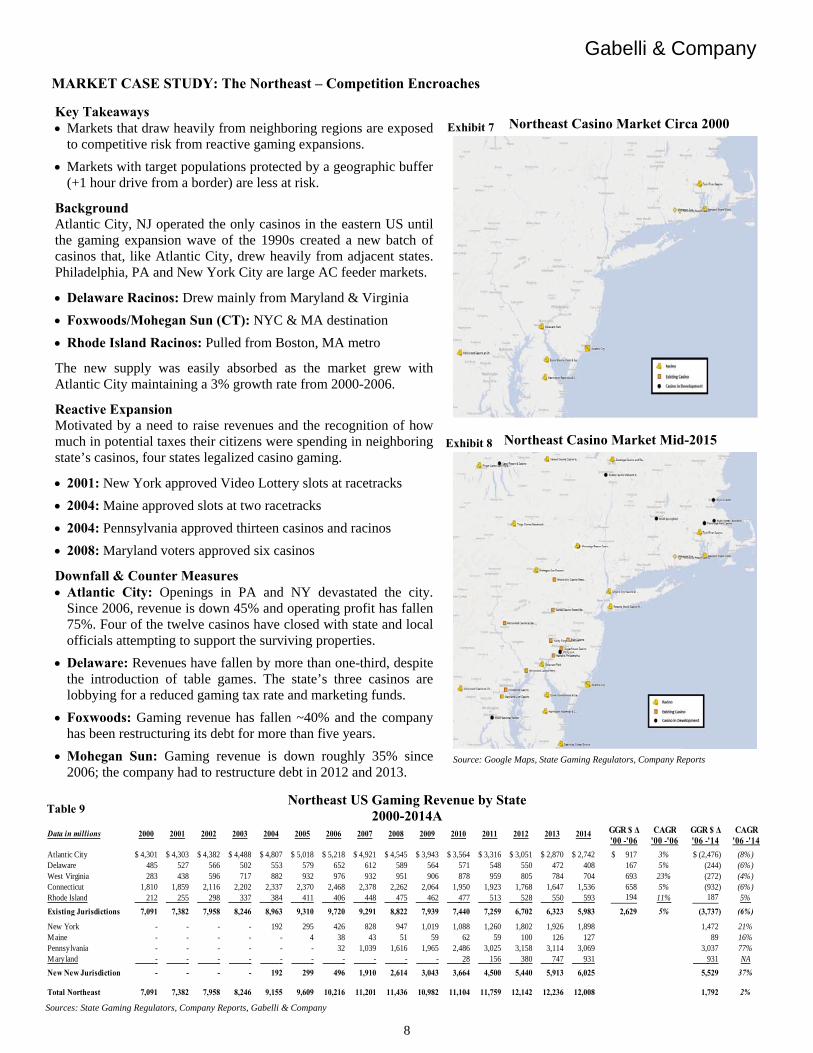
Northeast Casino Market Circa 2000
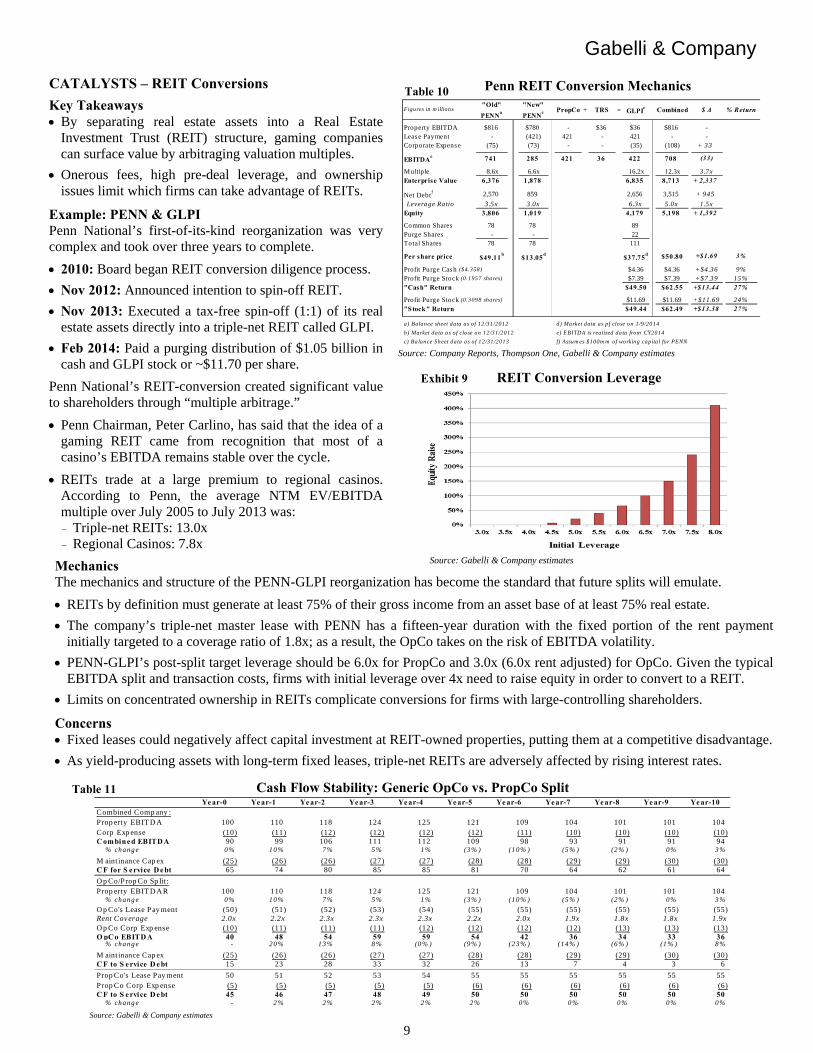
Northeast Casino Market Mid-2015
Source: Google Maps, State Gaming Regulators, Company Reports
Key Takeaways Markets that draw heavily from neighboring regions are exposed
to competitive risk from reactive gaming expansions.
Markets with target populations protected by a geographic buffer (+1 hour drive from a border) are less at risk.
Background Atlantic City, NJ operated the only casinos in the eastern US until the gaming expansion wave of the 1990s created a new batch of casinos that, like Atlantic City, drew heavily from adjacent states. Philadelphia, PA and New York City are large AC feeder markets.
Delaware Racinos: Drew mainly from Maryland & Virginia
Foxwoods/Mohegan Sun (CT): NYC & MA destination
Rhode Island Racinos: Pulled from Boston, MA metro
The new supply was easily absorbed as the market grew with Atlantic City maintaining a 3% growth rate from 2000-2006.
Reactive Expansion Motivated by a need to raise revenues and the recognition of how much in potential taxes their citizens were spending in neighboring state’s casinos, four states legalized casino gaming.
2001: New York approved Video Lottery slots at racetracks
2004: Maine approved slots at two racetracks
2004: Pennsylvania approved thirteen casinos and racinos
2008: Maryland voters approved six casinos
Downfall & Counter Measures Atlantic City: Openings in PA and NY devastated the city.
Since 2006, revenue is down 45% and operating profit has fallen 75%. Four of the twelve casinos have closed with state and local officials attempting to support the surviving properties.
Delaware: Revenues have fallen by more than one-third, despite the introduction of table games. The state’s three casinos are lobbying for a reduced gaming tax rate and marketing funds.
Foxwoods: Gaming revenue has fallen ~40% and the company has been restructuring its debt for more than five years.
Mohegan Sun: Gaming revenue is down roughly 35% since 2006; the company had to restructure debt in 2012 and 2013.
Northeast US Gaming Revenue by State
2000-2014A
Sources: State Gaming Regulators, Company Reports, Gabelli & Company
GGR $ Δ CAGR GGR $ Δ CAGR'00 -'06 '00 -'06 '06 -'14 '06 -'14
Atlantic City 4,301$ 4,303$ 4,382$ 4,488$ 4,807$ 5,018$ 5,218$ 4,921$ 4,545$ 3,943$ 3,564$ 3,316$ 3,051$ 2,870$ 2,742$ 917$ 3% (2,476)$ (8%)Delaware 485 527 566 502 553 579 652 612 589 564 571 548 550 472 408 167 5% (244) (6%)West Virginia 283 438 596 717 882 932 976 932 951 906 878 959 805 784 704 693 23% (272) (4%)Connecticut 1,810 1,859 2,116 2,202 2,337 2,370 2,468 2,378 2,262 2,064 1,950 1,923 1,768 1,647 1,536 658 5% (932) (6%)Rhode Island 212 255 298 337 384 411 406 448 475 462 477 513 528 550 593 194 11% 187 5%
Existing Jurisdictions 7,091 7,382 7,958 8,246 8,963 9,310 9,720 9,291 8,822 7,939 7,440 7,259 6,702 6,323 5,983 2,629 5% (3,737) (6%)
New York - - - - 192 295 426 828 947 1,019 1,088 1,260 1,802 1,926 1,898 1,472 21%Maine - - - - - 4 38 43 51 59 62 59 100 126 127 89 16%Pennsylvania - - - - - - 32 1,039 1,616 1,965 2,486 3,025 3,158 3,114 3,069 3,037 77%Maryland - - - - - - - - - - 28 156 380 747 931 931 NA
New New Jurisdiction - - - - 192 299 496 1,910 2,614 3,043 3,664 4,500 5,440 5,913 6,025 5,529 37%
Total Northeast 7,091 7,382 7,958 8,246 9,155 9,609 10,216 11,201 11,436 10,982 11,104 11,759 12,142 12,236 12,008 1,792 2%
Data in millions 20082000 2001 2002 2003 2004 2005 2006 2007 201420132012201120102009
Exhibit 7
Table 9
Exhibit 8
Gabelli & Company
9
CATALYSTS – REIT Conversions
Key Takeaways By separating real estate assets into a Real Estate
Investment Trust (REIT) structure, gaming companies can surface value by arbitraging valuation multiples.
Onerous fees, high pre-deal leverage, and ownership issues limit which firms can take advantage of REITs.
Example: PENN & GLPI Penn National’s first-of-its-kind reorganization was very complex and took over three years to complete.
2010: Board began REIT conversion diligence process.
Nov 2012: Announced intention to spin-off REIT.
Nov 2013: Executed a tax-free spin-off (1:1) of its real estate assets directly into a triple-net REIT called GLPI.
Feb 2014: Paid a purging distribution of $1.05 billion in cash and GLPI stock or ~$11.70 per share.
Penn National’s REIT-conversion created significant value to shareholders through “multiple arbitrage.”
Penn Chairman, Peter Carlino, has said that the idea of a gaming REIT came from recognition that most of a casino’s EBITDA remains stable over the cycle.
REITs trade at a large premium to regional casinos. According to Penn, the average NTM EV/EBITDA multiple over July 2005 to July 2013 was: - Triple-net REITs: 13.0x - Regional Casinos: 7.8x
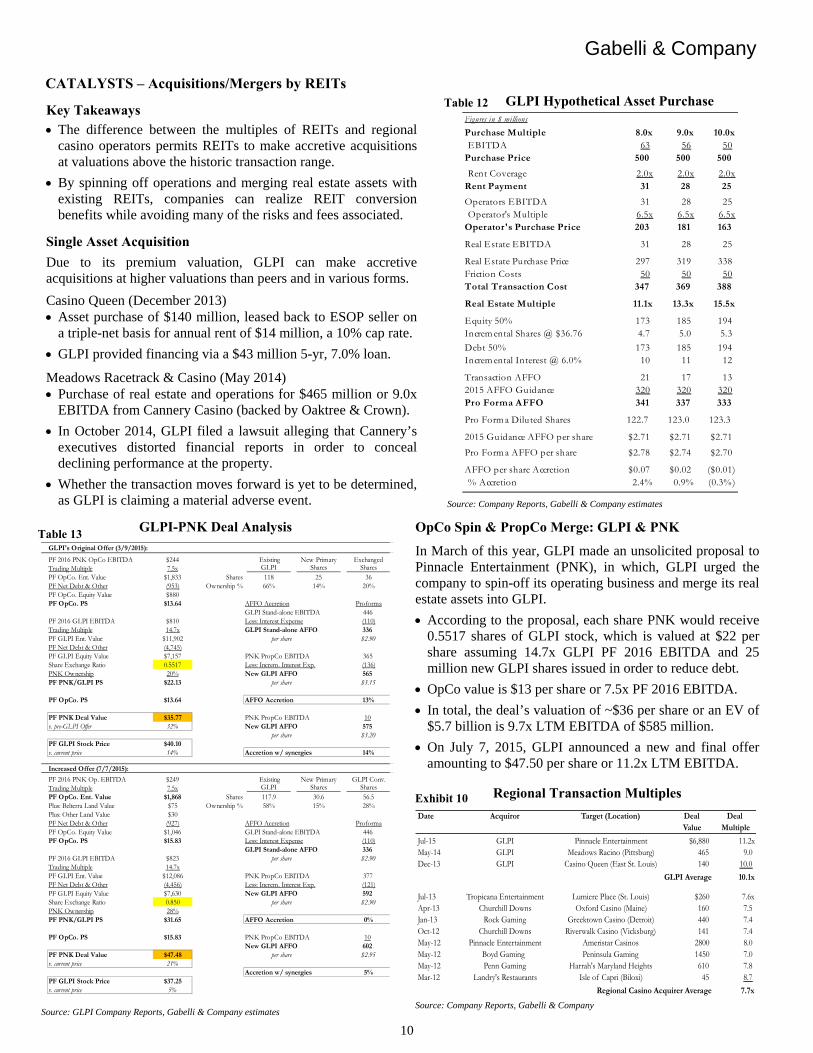
Penn REIT Conversion Mechanics
Source: Company Reports, Thompson One, Gabelli & Company estimates
REIT Conversion Leverage
Source: Gabelli & Company estimates
Figures in m illions "Old"
PENNa
"New"
PENNc PropCo + TRS = GLPI
c Combined $ Δ % Return
Property EBITDA $816 $780 - $36 $36 $816 -Leas e Payment - (421) 421 - 421 - -Corporate Expens e (75) (73) - - (35) (108) + 33
EBITDAe 741 285 421 36 422 708 (33)
Multiple 8.6x 6.6x 16.2x 12.3x 3.7xEnterprise Value 6,376 1,878 6,835 8,713 + 2,337
Net Debtf 2,570 859 2,656 3,515 + 945
Leverage Ratio 3.5x 3.0x 6.3x 5.0x 1.5xEquity 3,806 1,019 4,179 5,198 + 1,392
Common Shares 78 78 89Purge Shares - - 22Total Shares 78 78 111
Per share price $49.11b
$13.05d
$37.75d $50.80 +$1.69 3%
Profit Purge Cash ($4.358) $4.36 $4.36 +$4.36 9%Profit Purge Stock (0.1957 shares) $7.39 $7.39 +$7.39 15%"Cash" Return $49.50 $62.55 +$13.44 27%
Profit Purge Stock (0.3098 shares) $11.69 $11.69 +$11.69 24%"Stock" Return $49.44 $62.49 +$13.38 27%
a) Balance sheet data as of 12/31/2012 d) Market data as pf close on 1/9/2014
b) Market data as of close on 12/31/2012 e) EBITDA is realized data from CY2014
c) Balance Sheet data as of 12 /31/2013 f) Assum es $100m m of working capital for PENN
Mechanics The mechanics and structure of the PENN-GLPI reorganization has become the standard that future splits will emulate.
REITs by definition must generate at least 75% of their gross income from an asset base of at least 75% real estate.
The company’s triple-net master lease with PENN has a fifteen-year duration with the fixed portion of the rent payment initially targeted to a coverage ratio of 1.8x; as a result, the OpCo takes on the risk of EBITDA volatility.
PENN-GLPI’s post-split target leverage should be 6.0x for PropCo and 3.0x (6.0x rent adjusted) for OpCo. Given the typical EBITDA split and transaction costs, firms with initial leverage over 4x need to raise equity in order to convert to a REIT.
Limits on concentrated ownership in REITs complicate conversions for firms with large-controlling shareholders.
Concerns Fixed leases could negatively affect capital investment at REIT-owned properties, putting them at a competitive disadvantage.
As yield-producing assets with long-term fixed leases, triple-net REITs are adversely affected by rising interest rates.
Cash Flow Stability: Generic OpCo vs. PropCo Split
Source: Gabelli & Company estimates
Year-0 Year-1 Year-2 Year-3 Year-4 Year-5 Year-6 Year-7 Year-8 Year-9 Year-10Combined Comp any :Prop erty EBIT D A 100 110 118 124 125 121 109 104 101 101 104Corp Exp ense (10) (11) (12) (12) (12) (12) (11) (10) (10) (10) (10)C ombined EBITD A 90 99 106 111 112 109 98 93 91 91 94
% chang e 0% 10% 7% 5% 1% (3% ) (10% ) (5% ) (2% ) 0% 3%
M aint inance Cap ex (25) (26) (26) (27) (27) (28) (28) (29) (29) (30) (30)C F for S ervice D ebt 65 74 80 85 85 81 70 64 62 61 64
O p Co/Prop Co Sp lit :Prop erty EBIT D A R 100 110 118 124 125 121 109 104 101 101 104
% chang e 0% 10% 7% 5% 1% (3% ) (10% ) (5% ) (2% ) 0% 3%
O p Co's Lease Pay ment (50) (51) (52) (53) (54) (55) (55) (55) (55) (55) (55)Rent Coverage 2.0x 2.2x 2.3x 2.3x 2.3x 2.2x 2.0x 1.9x 1.8x 1.8x 1.9xO p Co Corp Exp ense (10) (11) (11) (11) (12) (12) (12) (12) (13) (13) (13)O pC o EBITD A 40 48 54 59 59 54 42 36 34 33 36
% chang e - 20% 13% 8% (0% ) (9% ) (23% ) (14% ) (6% ) (1% ) 8%
M aint inance Cap ex (25) (26) (26) (27) (27) (28) (28) (29) (29) (30) (30)C F to S ervice D ebt 15 23 28 33 32 26 13 7 4 3 6
Prop Co's Lease Pay ment 50 51 52 53 54 55 55 55 55 55 55Prop Co Corp Exp ense (5) (5) (5) (5) (5) (6) (6) (6) (6) (6) (6)C F to S ervice D ebt 45 46 47 48 49 50 50 50 50 50 50
% chang e - 2% 2% 2% 2% 2% 0% 0% 0% 0% 0%
Table 10
Table 11
Exhibit 9
Gabelli & Company
10
CATALYSTS – Acquisitions/Mergers by REITs
GLPI Hypothetical Asset Purchase
Source: Company Reports, Gabelli & Company estimates
Figures in $ millions
Purchase Multiple 8.0x 9.0x 10.0xEBITDA 63 56 50
Purchase Price 500 500 500
Rent Coverage 2.0x 2.0x 2.0xRent Payment 31 28 25
Operators EBITDA 31 28 25Operator's Multiple 6.5x 6.5x 6.5x
Operator's Purchase Price 203 181 163
Real Estate EBITDA 31 28 25
Real Estate Purchase Price 297 319 338Friction Costs 50 50 50Total Transaction Cost 347 369 388
Real Estate Multiple 11.1x 13.3x 15.5x
Equity 50% 173 185 194Increm ental Shares @ $36.76 4.7 5.0 5.3
Debt 50% 173 185 194Increm ental Interest @ 6.0% 10 11 12
Transaction AFFO 21 17 132015 AFFO Guidance 320 320 320Pro Forma AFFO 341 337 333
Pro Form a Diluted Shares 122.7 123.0 123.3
2015 Guidance AFFO per share $2.71 $2.71 $2.71
Pro Form a AFFO per share $2.78 $2.74 $2.70
AFFO per share Accretion $0.07 $0.02 ($0.01)% Accretion 2.4% 0.9% (0.3%)
Key Takeaways
The difference between the multiples of REITs and regional casino operators permits REITs to make accretive acquisitions at valuations above the historic transaction range.
By spinning off operations and merging real estate assets with existing REITs, companies can realize REIT conversion benefits while avoiding many of the risks and fees associated.
Single Asset Acquisition
Due to its premium valuation, GLPI can make accretive acquisitions at higher valuations than peers and in various forms.
Casino Queen (December 2013) Asset purchase of $140 million, leased back to ESOP seller on
a triple-net basis for annual rent of $14 million, a 10% cap rate.
GLPI provided financing via a $43 million 5-yr, 7.0% loan.
Meadows Racetrack & Casino (May 2014) Purchase of real estate and operations for $465 million or 9.0x
EBITDA from Cannery Casino (backed by Oaktree & Crown).
In October 2014, GLPI filed a lawsuit alleging that Cannery’s executives distorted financial reports in order to conceal declining performance at the property.
Whether the transaction moves forward is yet to be determined, as GLPI is claiming a material adverse event.
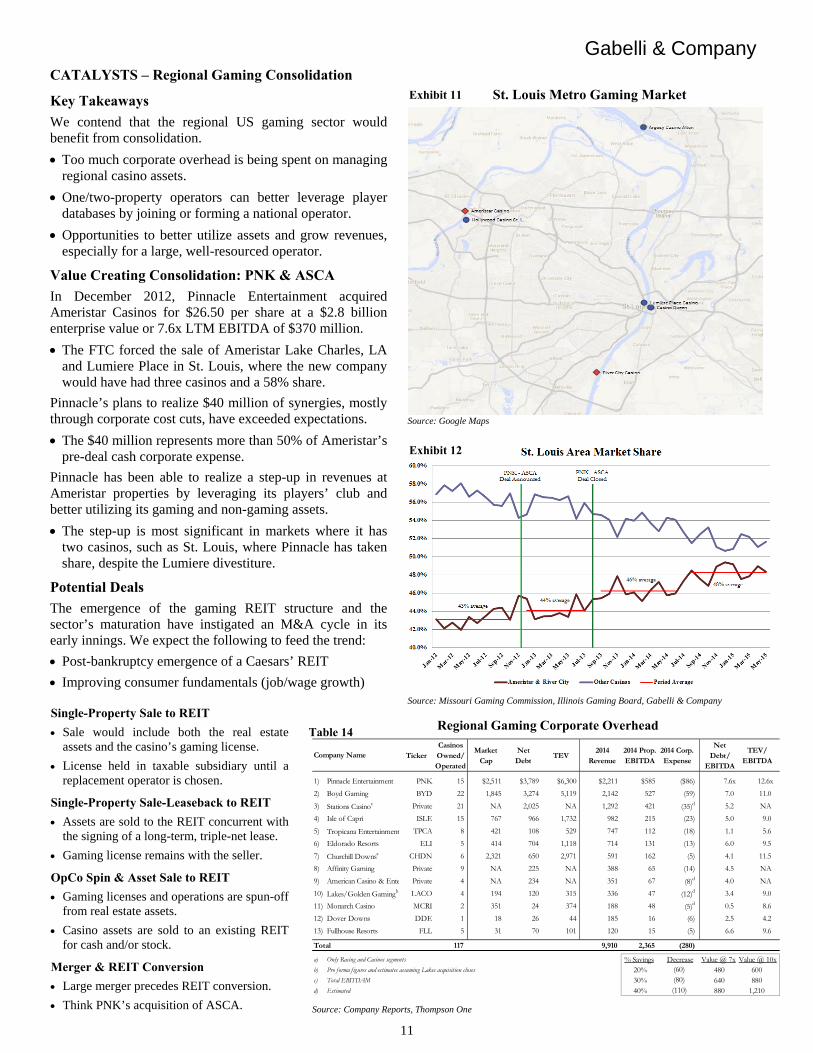
GLPI-PNK Deal Analysis
Source: GLPI Company Reports, Gabelli & Company estimates
GLPI's Original Offer (3/9/2015):
PF 2016 PNK OpCo EBITDA $244 Existing New Primary ExchangedTrading Multiple 7.5x GLPI Shares SharesPF OpCo. Ent. Value $1,833 Shares 118 25 36PF Net Debt & Other (953) Ownership % 66% 14% 20%PF OpCo. Equity Value $880PF OpCo. PS $13.64 AFFO Accretion Proforma
GLPI Stand-alone EBITDA 446PF 2016 GLPI EBITDA $810 Less: Interest Expense (110)Trading Multiple 14.7x GLPI Stand-alone AFFO 336PF GLPI Ent. Value $11,902 per share $2.90PF Net Debt & Other (4,745)PF GLPI Equity Value $7,157 PNK PropCo EBITDA 365Share Exchange Ratio 0.5517 Less: Increm. Interest Exp. (136)PNK Ownership 20% New GLPI AFFO 565PF PNK/GLPI PS $22.13 per share $3.15
PF OpCo. PS $13.64 AFFO Accretion 13%
PF PNK Deal Value $35.77 PNK PropCo EBITDA 10v. pre-GLPI Offer 32% New GLPI AFFO 575
per share $3.20PF GLPI Stock Price $40.10v. current price 14% Accretion w/ synergies 14%
Increased Offer (7/7/2015):
PF 2016 PNK Op. EBITDA $249 Existing New Primary GLPI Conv.Trading Multiple 7.5x GLPI Shares SharesPF OpCo. Ent. Value $1,868 Shares 117.9 30.6 56.5Plus: Belterra Land Value $75 Ownership % 58% 15% 28%Plus: Other Land Value $30PF Net Debt & Other (927) AFFO Accretion ProformaPF OpCo. Equity Value $1,046 GLPI Stand-alone EBITDA 446PF OpCo. PS $15.83 Less: Interest Expense (110)
GLPI Stand-alone AFFO 336PF 2016 GLPI EBITDA $823 per share $2.90Trading Multiple 14.7xPF GLPI Ent. Value $12,086 PNK PropCo EBITDA 377PF Net Debt & Other (4,456) Less: Increm. Interest Exp. (121)PF GLPI Equity Value $7,630 New GLPI AFFO 592Share Exchange Ratio 0.850 per share $2.90PNK Ownership 28%PF PNK/GLPI PS $31.65 AFFO Accretion 0%
PF OpCo. PS $15.83 PNK PropCo EBITDA 10New GLPI AFFO 602
PF PNK Deal Value $47.48 per share $2.95v. current price 21%
Accretion w/ synergies 5%PF GLPI Stock Price $37.25v. current price 5%
OpCo Spin & PropCo Merge: GLPI & PNK
In March of this year, GLPI made an unsolicited proposal to Pinnacle Entertainment (PNK), in which, GLPI urged the company to spin-off its operating business and merge its real estate assets into GLPI.
According to the proposal, each share PNK would receive 0.5517 shares of GLPI stock, which is valued at $22 per share assuming 14.7x GLPI PF 2016 EBITDA and 25 million new GLPI shares issued in order to reduce debt.
OpCo value is $13 per share or 7.5x PF 2016 EBITDA.
In total, the deal’s valuation of ~$36 per share or an EV of $5.7 billion is 9.7x LTM EBITDA of $585 million.
On July 7, 2015, GLPI announced a new and final offer amounting to $47.50 per share or 11.2x LTM EBITDA.
Regional Transaction Multiples
Source: Company Reports, Gabelli & Company
Date Acquiror Target (Location) Deal Deal Value Multiple
Jul-15 GLPI Pinnacle Entertainment $6,880 11.2xMay-14 GLPI Meadows Racino (Pittsburg) 465 9.0Dec-13 GLPI Casino Queen (East St. Louis) 140 10.0
GLPI Average 10.1x
Jul-13 Tropicana Entertainment Lumiere Place (St. Louis) $260 7.6xApr-13 Churchill Downs Oxford Casino (Maine) 160 7.5Jan-13 Rock Gaming Greektown Casino (Detroit) 440 7.4Oct-12 Churchill Downs Riverwalk Casino (Vicksburg) 141 7.4May-12 Pinnacle Entertainment Ameristar Casinos 2800 8.0May-12 Boyd Gaming Peninsula Gaming 1450 7.0May-12 Penn Gaming Harrah's Maryland Heights 610 7.8Mar-12 Landry's Restaurants Isle of Capri (Biloxi) 45 8.7
Regional Casino Acquirer Average 7.7x
Table 12
Table 13
Exhibit 10
Gabelli & Company
11
CATALYSTS – Regional Gaming Consolidation
Key Takeaways
We contend that the regional US gaming sector would benefit from consolidation.
Too much corporate overhead is being spent on managing regional casino assets.
One/two-property operators can better leverage player databases by joining or forming a national operator.
Opportunities to better utilize assets and grow revenues, especially for a large, well-resourced operator.
Value Creating Consolidation: PNK & ASCA
In December 2012, Pinnacle Entertainment acquired Ameristar Casinos for $26.50 per share at a $2.8 billion enterprise value or 7.6x LTM EBITDA of $370 million.
The FTC forced the sale of Ameristar Lake Charles, LA and Lumiere Place in St. Louis, where the new company would have had three casinos and a 58% share.
Pinnacle’s plans to realize $40 million of synergies, mostly through corporate cost cuts, have exceeded expectations.
The $40 million represents more than 50% of Ameristar’s pre-deal cash corporate expense.
Pinnacle has been able to realize a step-up in revenues at Ameristar properties by leveraging its players’ club and better utilizing its gaming and non-gaming assets.
The step-up is most significant in markets where it has two casinos, such as St. Louis, where Pinnacle has taken share, despite the Lumiere divestiture.
Potential Deals
The emergence of the gaming REIT structure and the sector’s maturation have instigated an M&A cycle in its early innings. We expect the following to feed the trend:
Post-bankruptcy emergence of a Caesars’ REIT
Improving consumer fundamentals (job/wage growth)
Single-Property Sale to REIT
Sale would include both the real estate assets and the casino’s gaming license.
License held in taxable subsidiary until a replacement operator is chosen.
Single-Property Sale-Leaseback to REIT
Assets are sold to the REIT concurrent with the signing of a long-term, triple-net lease.
Gaming license remains with the seller.
OpCo Spin & Asset Sale to REIT
Gaming licenses and operations are spun-off from real estate assets.
Casino assets are sold to an existing REIT for cash and/or stock.
Merger & REIT Conversion
Large merger precedes REIT conversion.
Think PNK’s acquisition of ASCA.
St. Louis Metro Gaming Market
Source: Google Maps
Source: Missouri Gaming Commission, Illinois Gaming Board, Gabelli & Company
Regional Gaming Corporate Overhead
Source: Company Reports, Thompson One
TickerCasinos Owned/ Operated
Market Cap
Net Debt
TEV2014
Revenue2014 Prop. EBITDA
2014 Corp. Expense
Net Debt/
EBITDA
TEV/ EBITDA
1) Pinnacle Entertainment PNK 15 $2,511 $3,789 $6,300 $2,211 $585 ($86) 7.6x 12.6x
2) Boyd Gaming BYD 22 1,845 3,274 5,119 2,142 527 (59) 7.0 11.0
3) Stations Casinoc Private 21 NA 2,025 NA 1,292 421 (35)d 5.2 NA
4) Isle of Capri ISLE 15 767 966 1,732 982 215 (23) 5.0 9.0
5) Tropicana Entertainment TPCA 8 421 108 529 747 112 (18) 1.1 5.6
6) Eldorado Resorts ELI 5 414 704 1,118 714 131 (13) 6.0 9.5
7) Churchill Downsa CHDN 6 2,321 650 2,971 591 162 (5) 4.1 11.5
8) Affinity Gaming Private 9 NA 225 NA 388 65 (14) 4.5 NA
9) American Casino & Ente Private 4 NA 234 NA 351 67 (8)d 4.0 NA
10) Lakes/Golden Gamingb LACO 4 194 120 315 336 47 (12)d 3.4 9.0
11) Monarch Casino MCRI 2 351 24 374 188 48 (5)d 0.5 8.6
12) Dover Downs DDE 1 18 26 44 185 16 (6) 2.5 4.2
13) Fullhouse Resorts FLL 5 31 70 101 120 15 (5) 6.6 9.6
117 9,910 2,365 (280)
a) Only Racing and Casinos segments % Savings Value @ 7x Value @ 10xb) Pro forma f igures and estimates assuming Lakes acquisition closes 20% 480 600c) Total EBITDAM 30% 640 880d) Estimated 40% 880 1,210(110)
(60)(80)
Decrease
Company Name
Total
Exhibit 11
Exhibit 12
Table 14

Gabelli & Company
12
MACAU: Market Overview
Source: Google Maps
Macau is comprised of a peninsula and an island, a little less than twelve square miles in total, which sits across the Pearl River Delta from Hong Kong. The province was settled by the Portuguese in the mid-16th century and operated under Portuguese control until it was handed back to China in December 1999. The area now operates as one of two Special Administrative Regions of China (SARs), with the other being Hong Kong. The SAR structure is based on the “One Country, Two Systems” principle, which was formulated to enable market-based economies to persist under the jurisdiction of communist China. As a SAR, Macau acts with a certain level of autonomy, possessing its own legislative, legal, and monetary institutions.
Gaming was first legalized in Macau in 1847, in an effort by the government to raise revenues. The market was comprised primarily of Fantan houses until 1937 when the government gave a monopoly license to the Hou Heng Company. In 1962, the government awarded the monopoly license to Sociedade de Turismo e Diversões de Macau (STDM), a company founded by Stanley Ho and a group of Hong Kong businessmen. Under STDM, Western games (specifically baccarat) were widely adopted. Ho’s monopoly was broken in 2001 as Macau’s government increased the number of gaming licenses to three with the goal of stimulating broader tourism development. A bidding process was held and concessions were awarded to SJM (a subsidiary of STDM), Galaxy Casinos, and Wynn Resorts. Less than a year later, the government altered the contracts to allow three sub-concession grants. Galaxy awarded their sub-concession to Las Vegas Sands, Wynn awarded a sub-concession to MGM, and SJM awarded a concession to Melco Crown.
Casino Summary Macau has 41 casinos and slot parlor properties currently operating with six new casino projects in various stages of development. Macau’s peninsula is home to twenty-nine properties including Wynn/Encore, MGM Grand, Sands Macao and the Grand Lisboa, SJM’s flagship property. Taipa, the northern section of Macau’s island, is home to five casinos. The remaining seven casinos are in Cotai, a section of reclaimed land that now links the once separate islands of Taipa and Coloane. The casinos of Cotai are larger than Macau’s other properties, similar to those on the Las Vegas Strip. With all of its new casino development, Cotai will become the center of gaming activity in Macau.
Visitors Summary Most of Macau’s visitors are from Mainland China, with the highest concentration coming from the adjacent Guangdong province, which has China’s largest province-level population (~107 million) and economy (US$1.1 trillion). The majority of visitors enter through the Goibei Gate at the top of the Peninsula. Due to a lack of hotel rooms, nearly one-half of Macau’s patrons visit on a day-trip. Hotel room supply growth in Cotai should help to increase the number of overnight visitors.
Macau Visitor Summary
Source: Macau Statistics and Census Service
Total Visitors 31 525 632 100%
Origin:
Guangdong 9,008,942 29%
Fujian 902,303 3%
Hunan 750,687 2%
Zhejiang 694,678 2%
Hubei 668,188 2%Other Provinces 9,227,612 29%
Mainland China 21,252,410 67%
Hong Kong 6,426,608 20%
Taiwan 953,753 3%
Other 2,892,861 9%
Foreign 10,273,222 33%
Arrived by:
Goibei Gate 15,573,944 49%
Harbor Ferry 7,836,189 25%
Taipa Ferry 4,244,354 13%
Airline 2,055,199 7%
Lotus Bridge 1,815,946 6%
Stay Lenght:Same-day 16,959,949 54%
Overnight 14,565,683 46%
Macau Property Summary
Source: Company Reports, Thompson One, Gabelli & Company
Hotel Rooms
Casino Sq/Ft
Slots TablesVIP % of total win
2014 Net Revenue
2014 EBITDA
EBITDA Margin
Venetian Macao 2,900 376,000 2,080 590 43% 4,041 1,539 38%Four Seasons Macao 360 105,000 150 140 75% 1,108 372 34%Sands Cotai Central 6,400 370,000 1,700 510 48% 3,134 993 32%
Sands Macao 289 241,000 910 270 38% 1,175 337 29%
Sands China 9,949 1,092,000 4,840 1,510 77% 9,457 3,241 34%
Casino Grand Lisboa 400 406,326 749 441 73% 3,897 578 15%
Other Casinos 389 - 2,107 1,325 53% 6,402 405 6%
SJM Holdings 789 NA 2,856 1,766 60% 10,300 983 10%
Galaxy Macau 3,550 644 1,454 68% 6,046 1,272 21%
Other Casinos 1,111 78% 3,069 472 15%
Galaxy Entertainment 4,661 - 644 1,454 71% 9,114 1,744 19%
City of Dreams 1,400 448,000 1,400 500 64% 3,849 1,166 30%
Other Casinos 216 173,000 1,266 120 91% 894 121 14%
Melco Crown 1,616 621,000 2,666 620 55% 4,743 1,287 27%
Wynn Macau 1,008 284,000 625 498 75% 3,796 1,208 32%
MGM China 582 274,000 423 1,197 70% 3,282 850 26%
Peninsula 3,779 1,378,326 6,080 3,851 66% 21,684 3,860 18%
Cotia/Taipa 14,826 1,472,000 7,240 3,314 60% 19,071 5,463 29%
Total Macau 18,605 2,850,326 13,320 7,165 63% 40,755 9,323 23%
Exhibit 13
Table 15
Table 16
Gabelli & Company
13
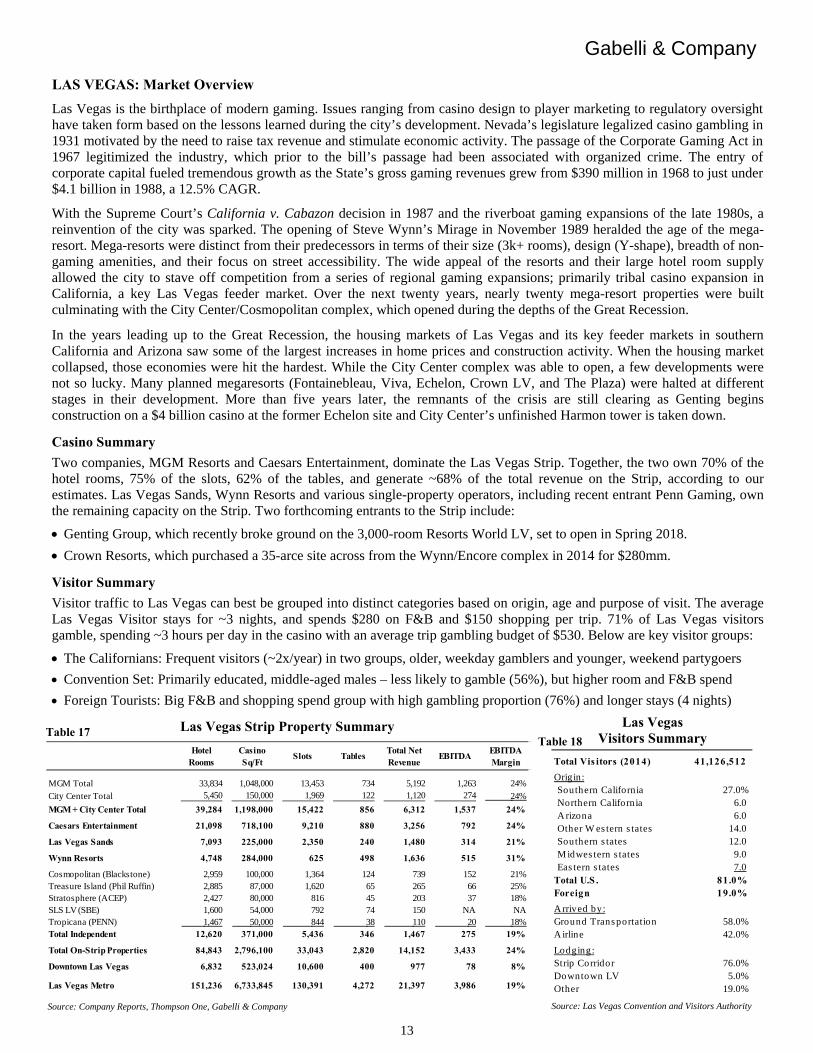
LAS VEGAS: Market Overview
Las Vegas is the birthplace of modern gaming. Issues ranging from casino design to player marketing to regulatory oversight have taken form based on the lessons learned during the city’s development. Nevada’s legislature legalized casino gambling in 1931 motivated by the need to raise tax revenue and stimulate economic activity. The passage of the Corporate Gaming Act in 1967 legitimized the industry, which prior to the bill’s passage had been associated with organized crime. The entry of corporate capital fueled tremendous growth as the State’s gross gaming revenues grew from $390 million in 1968 to just under $4.1 billion in 1988, a 12.5% CAGR. With the Supreme Court’s California v. Cabazon decision in 1987 and the riverboat gaming expansions of the late 1980s, a reinvention of the city was sparked. The opening of Steve Wynn’s Mirage in November 1989 heralded the age of the mega-resort. Mega-resorts were distinct from their predecessors in terms of their size (3k+ rooms), design (Y-shape), breadth of non-gaming amenities, and their focus on street accessibility. The wide appeal of the resorts and their large hotel room supply allowed the city to stave off competition from a series of regional gaming expansions; primarily tribal casino expansion in California, a key Las Vegas feeder market. Over the next twenty years, nearly twenty mega-resort properties were built culminating with the City Center/Cosmopolitan complex, which opened during the depths of the Great Recession.
In the years leading up to the Great Recession, the housing markets of Las Vegas and its key feeder markets in southern California and Arizona saw some of the largest increases in home prices and construction activity. When the housing market collapsed, those economies were hit the hardest. While the City Center complex was able to open, a few developments were not so lucky. Many planned megaresorts (Fontainebleau, Viva, Echelon, Crown LV, and The Plaza) were halted at different stages in their development. More than five years later, the remnants of the crisis are still clearing as Genting begins construction on a $4 billion casino at the former Echelon site and City Center’s unfinished Harmon tower is taken down.
Casino Summary
Two companies, MGM Resorts and Caesars Entertainment, dominate the Las Vegas Strip. Together, the two own 70% of the hotel rooms, 75% of the slots, 62% of the tables, and generate ~68% of the total revenue on the Strip, according to our estimates. Las Vegas Sands, Wynn Resorts and various single-property operators, including recent entrant Penn Gaming, own the remaining capacity on the Strip. Two forthcoming entrants to the Strip include:
Genting Group, which recently broke ground on the 3,000-room Resorts World LV, set to open in Spring 2018.
Crown Resorts, which purchased a 35-arce site across from the Wynn/Encore complex in 2014 for $280mm.
Visitor Summary
Visitor traffic to Las Vegas can best be grouped into distinct categories based on origin, age and purpose of visit. The average Las Vegas Visitor stays for ~3 nights, and spends $280 on F&B and $150 shopping per trip. 71% of Las Vegas visitors gamble, spending ~3 hours per day in the casino with an average trip gambling budget of $530. Below are key visitor groups:
The Californians: Frequent visitors (~2x/year) in two groups, older, weekday gamblers and younger, weekend partygoers
Convention Set: Primarily educated, middle-aged males – less likely to gamble (56%), but higher room and F&B spend
Foreign Tourists: Big F&B and shopping spend group with high gambling proportion (76%) and longer stays (4 nights)
Las Vegas Strip Property Summary
Source: Company Reports, Thompson One, Gabelli & Company
Hotel Rooms
Casino Sq/Ft
Slots TablesTotal Net Revenue
EBITDAEBITDA Margin
MGM Total 33,834 1,048,000 13,453 734 5,192 1,263 24%
City Center Total 5,450 150,000 1,969 122 1,120 274 24%
MGM + City Center Total 39,284 1,198,000 15,422 856 6,312 1,537 24%
Caesars Entertainment 21,098 718,100 9,210 880 3,256 792 24%
Las Vegas Sands 7,093 225,000 2,350 240 1,480 314 21%
Wynn Resorts 4,748 284,000 625 498 1,636 515 31%
Cosmopolitan (Blackstone) 2,959 100,000 1,364 124 739 152 21% Treasure Island (Phil Ruffin) 2,885 87,000 1,620 65 265 66 25% Stratosphere (ACEP) 2,427 80,000 816 45 203 37 18% SLS LV (SBE) 1,600 54,000 792 74 150 NA NATropicana (PENN) 1,467 50,000 844 38 110 20 18% Total Independent 12,620 371,000 5,436 346 1,467 275 19%
Total On-Strip Properties 84,843 2,796,100 33,043 2,820 14,152 3,433 24%
Downtown Las Vegas 6,832 523,024 10,600 400 977 78 8%
Las Vegas Metro 151,236 6,733,845 130,391 4,272 21,397 3,986 19%
Las Vegas Visitors Summary
Source: Las Vegas Convention and Visitors Authority
Total Vis itors (2014) 41,126,512
Origin:Southern California 27.0%Northern California 6.0A rizona 6.0Other W es tern s tates 14.0Southern s tates 12.0M idwes tern s tates 9.0Eas tern s tates 7.0
Total U.S . 81.0%Foreign 19.0%
A rrived by:Ground Transportation 58.0%A irline 42.0%
Lodging:Strip Corridor 76.0%Downtown LV 5.0%Other 19.0%
Table 17 Table 18
Gabelli & Company
14
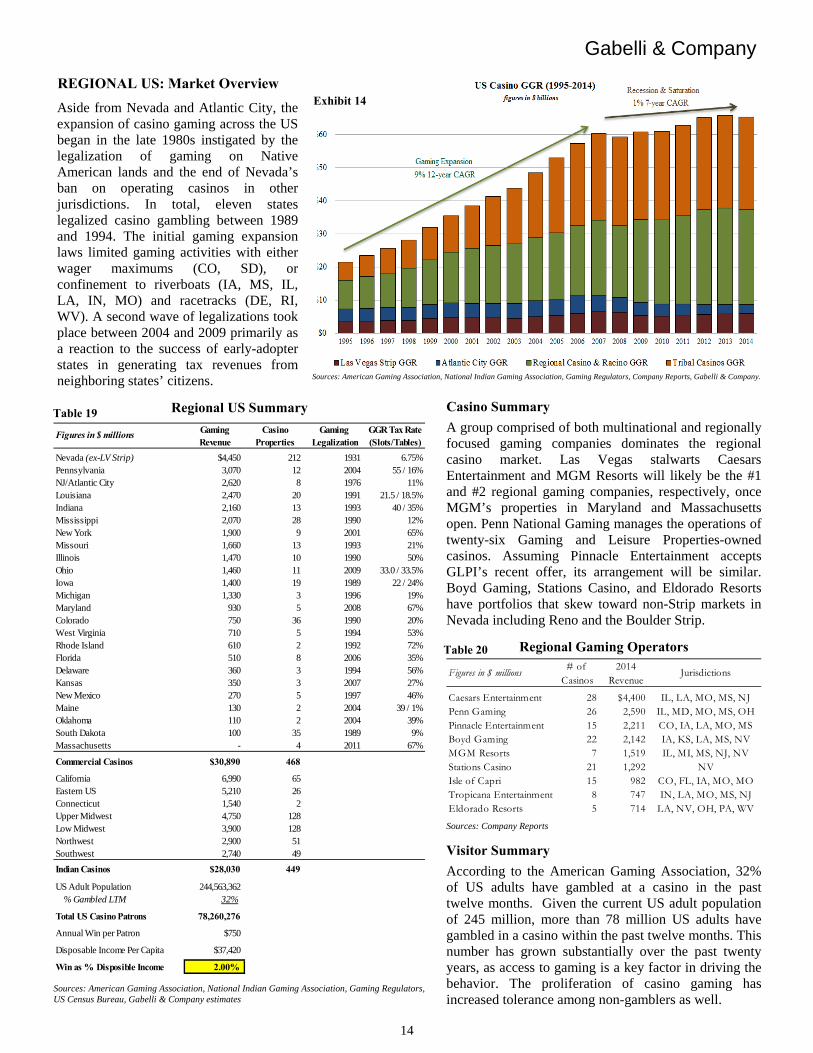
REGIONAL US: Market Overview Aside from Nevada and Atlantic City, the expansion of casino gaming across the US began in the late 1980s instigated by the legalization of gaming on Native American lands and the end of Nevada’s ban on operating casinos in other jurisdictions. In total, eleven states legalized casino gambling between 1989 and 1994. The initial gaming expansion laws limited gaming activities with either wager maximums (CO, SD), or confinement to riverboats (IA, MS, IL, LA, IN, MO) and racetracks (DE, RI, WV). A second wave of legalizations took place between 2004 and 2009 primarily as a reaction to the success of early-adopter states in generating tax revenues from neighboring states’ citizens.
Sources: American Gaming Association, National Indian Gaming Association, Gaming Regulators, Company Reports, Gabelli & Company.
Casino Summary
A group comprised of both multinational and regionally focused gaming companies dominates the regional casino market. Las Vegas stalwarts Caesars Entertainment and MGM Resorts will likely be the #1 and #2 regional gaming companies, respectively, once MGM’s properties in Maryland and Massachusetts open. Penn National Gaming manages the operations of twenty-six Gaming and Leisure Properties-owned casinos. Assuming Pinnacle Entertainment accepts GLPI’s recent offer, its arrangement will be similar. Boyd Gaming, Stations Casino, and Eldorado Resorts have portfolios that skew toward non-Strip markets in Nevada including Reno and the Boulder Strip.
Regional Gaming Operators
Sources: Company Reports
Visitor Summary
According to the American Gaming Association, 32% of US adults have gambled at a casino in the past twelve months. Given the current US adult population of 245 million, more than 78 million US adults have gambled in a casino within the past twelve months. This number has grown substantially over the past twenty years, as access to gaming is a key factor in driving the behavior. The proliferation of casino gaming has increased tolerance among non-gamblers as well.
# of 2014Casinos Revenue
Caesars Entertainment 28 $4,400 IL, LA, MO, MS, NJPenn Gaming 26 2,590 IL, MD, MO, MS, OHPinnacle Entertainment 15 2,211 CO, IA, LA, MO, MSBoyd Gaming 22 2,142 IA, KS, LA, MS, NVMGM Resorts 7 1,519 IL, MI, MS, NJ, NVStations Casino 21 1,292 NVIsle of Capri 15 982 CO, FL, IA, MO, MOTropicana Entertainment 8 747 IN, LA, MO, MS, NJEldorado Resorts 5 714 LA, NV, OH, PA, WV
Figures in $ millions Jurisdictions
Regional US Summary
Sources: American Gaming Association, National Indian Gaming Association, Gaming Regulators, US Census Bureau, Gabelli & Company estimates
Gaming Casino Gaming GGR Tax RateRevenue Properties Legalization (Slots/Tables)
Nevada (ex-LV Strip) $4,450 212 1931 6.75%Pennsylvania 3,070 12 2004 55 / 16%NJ/Atlantic City 2,620 8 1976 11%Louisiana 2,470 20 1991 21.5 / 18.5%Indiana 2,160 13 1993 40 / 35%Mississippi 2,070 28 1990 12%New York 1,900 9 2001 65%Missouri 1,660 13 1993 21%Illinois 1,470 10 1990 50%Ohio 1,460 11 2009 33.0 / 33.5%Iowa 1,400 19 1989 22 / 24%Michigan 1,330 3 1996 19%Maryland 930 5 2008 67%Colorado 750 36 1990 20%West Virginia 710 5 1994 53%Rhode Island 610 2 1992 72%Florida 510 8 2006 35%Delaware 360 3 1994 56%Kansas 350 3 2007 27%New Mexico 270 5 1997 46%Maine 130 2 2004 39 / 1%Oklahoma 110 2 2004 39%South Dakota 100 35 1989 9%Massachusetts - 4 2011 67%
Commercial Casinos $30,890 468
California 6,990 65Eastern US 5,210 26Connecticut 1,540 2Upper Midwest 4,750 128Low Midwest 3,900 128Northwest 2,900 51Southwest 2,740 49
Indian Casinos $28,030 449
US Adult Population 244,563,362% Gambled LTM 32%
Total US Casino Patrons 78,260,276
Annual Win per Patron $750
Disposable Income Per Capita $37,420
Win as % Disposible Income 2.00%
Figures in $ millions
Exhibit 14
Table 19
Table 20
Gabelli & Company
15
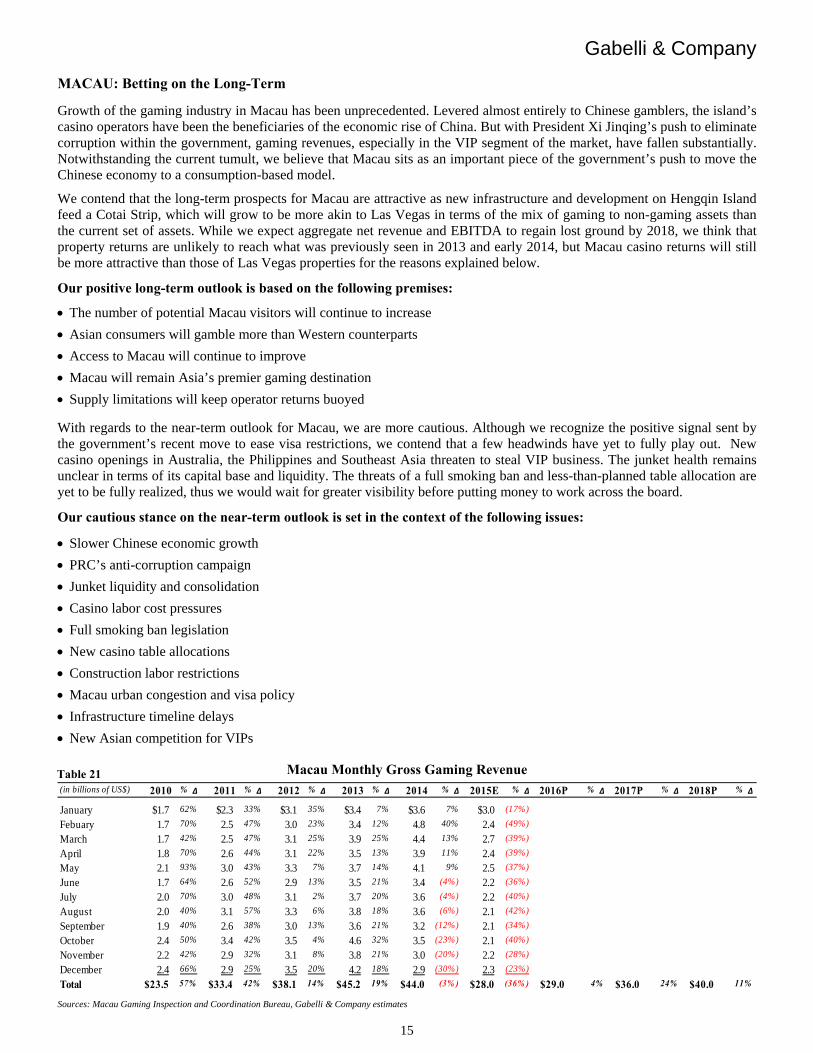
MACAU: Betting on the Long-Term
Growth of the gaming industry in Macau has been unprecedented. Levered almost entirely to Chinese gamblers, the island’s casino operators have been the beneficiaries of the economic rise of China. But with President Xi Jinqing’s push to eliminate corruption within the government, gaming revenues, especially in the VIP segment of the market, have fallen substantially. Notwithstanding the current tumult, we believe that Macau sits as an important piece of the government’s push to move the Chinese economy to a consumption-based model.
We contend that the long-term prospects for Macau are attractive as new infrastructure and development on Hengqin Island feed a Cotai Strip, which will grow to be more akin to Las Vegas in terms of the mix of gaming to non-gaming assets than the current set of assets. While we expect aggregate net revenue and EBITDA to regain lost ground by 2018, we think that property returns are unlikely to reach what was previously seen in 2013 and early 2014, but Macau casino returns will still be more attractive than those of Las Vegas properties for the reasons explained below.
Our positive long-term outlook is based on the following premises:
The number of potential Macau visitors will continue to increase
Asian consumers will gamble more than Western counterparts
Access to Macau will continue to improve
Macau will remain Asia’s premier gaming destination
Supply limitations will keep operator returns buoyed
With regards to the near-term outlook for Macau, we are more cautious. Although we recognize the positive signal sent by the government’s recent move to ease visa restrictions, we contend that a few headwinds have yet to fully play out. New casino openings in Australia, the Philippines and Southeast Asia threaten to steal VIP business. The junket health remains unclear in terms of its capital base and liquidity. The threats of a full smoking ban and less-than-planned table allocation are yet to be fully realized, thus we would wait for greater visibility before putting money to work across the board.
Our cautious stance on the near-term outlook is set in the context of the following issues:
Slower Chinese economic growth
PRC’s anti-corruption campaign
Junket liquidity and consolidation
Casino labor cost pressures
Full smoking ban legislation
New casino table allocations
Construction labor restrictions
Macau urban congestion and visa policy
Infrastructure timeline delays
New Asian competition for VIPs
Macau Monthly Gross Gaming Revenue
Sources: Macau Gaming Inspection and Coordination Bureau, Gabelli & Company estimates
(in billions of US$) 2010 % Δ 2011 % Δ 2012 % Δ 2013 % Δ 2014 % Δ 2015E % Δ 2016P % Δ 2017P % Δ 2018P % Δ
January $1.7 62% $2.3 33% $3.1 35% $3.4 7% $3.6 7% $3.0 (17%)
Febuary 1.7 70% 2.5 47% 3.0 23% 3.4 12% 4.8 40% 2.4 (49%)
March 1.7 42% 2.5 47% 3.1 25% 3.9 25% 4.4 13% 2.7 (39%)
April 1.8 70% 2.6 44% 3.1 22% 3.5 13% 3.9 11% 2.4 (39%)
May 2.1 93% 3.0 43% 3.3 7% 3.7 14% 4.1 9% 2.5 (37%)
June 1.7 64% 2.6 52% 2.9 13% 3.5 21% 3.4 (4%) 2.2 (36%)
July 2.0 70% 3.0 48% 3.1 2% 3.7 20% 3.6 (4%) 2.2 (40%)
August 2.0 40% 3.1 57% 3.3 6% 3.8 18% 3.6 (6%) 2.1 (42%)
September 1.9 40% 2.6 38% 3.0 13% 3.6 21% 3.2 (12%) 2.1 (34%)
October 2.4 50% 3.4 42% 3.5 4% 4.6 32% 3.5 (23%) 2.1 (40%)
November 2.2 42% 2.9 32% 3.1 8% 3.8 21% 3.0 (20%) 2.2 (28%)
December 2.4 66% 2.9 25% 3.5 20% 4.2 18% 2.9 (30%) 2.3 (23%)
Total $23.5 57% $33.4 42% $38.1 14% $45.2 19% $44.0 (3% ) $28.0 (36% ) $29.0 4% $36.0 24% $40.0 11%
Table 21
Gabelli & Company
16
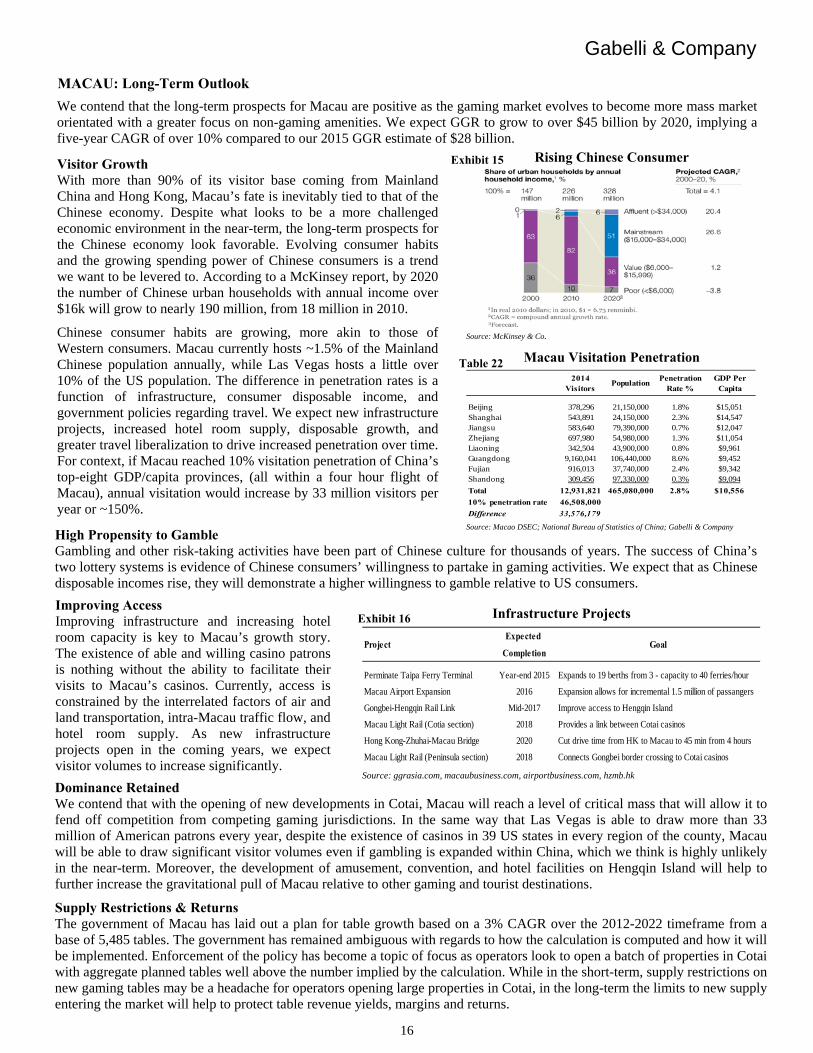
MACAU: Long-Term Outlook
High Propensity to Gamble Gambling and other risk-taking activities have been part of Chinese culture for thousands of years. The success of China’s two lottery systems is evidence of Chinese consumers’ willingness to partake in gaming activities. We expect that as Chinese disposable incomes rise, they will demonstrate a higher willingness to gamble relative to US consumers.
Visitor Growth With more than 90% of its visitor base coming from Mainland China and Hong Kong, Macau’s fate is inevitably tied to that of the Chinese economy. Despite what looks to be a more challenged economic environment in the near-term, the long-term prospects for the Chinese economy look favorable. Evolving consumer habits and the growing spending power of Chinese consumers is a trend we want to be levered to. According to a McKinsey report, by 2020 the number of Chinese urban households with annual income over $16k will grow to nearly 190 million, from 18 million in 2010.
Chinese consumer habits are growing, more akin to those of Western consumers. Macau currently hosts ~1.5% of the Mainland Chinese population annually, while Las Vegas hosts a little over 10% of the US population. The difference in penetration rates is a function of infrastructure, consumer disposable income, and government policies regarding travel. We expect new infrastructure projects, increased hotel room supply, disposable growth, and greater travel liberalization to drive increased penetration over time. For context, if Macau reached 10% visitation penetration of China’s top-eight GDP/capita provinces, (all within a four hour flight of Macau), annual visitation would increase by 33 million visitors per year or ~150%.
We contend that the long-term prospects for Macau are positive as the gaming market evolves to become more mass market orientated with a greater focus on non-gaming amenities. We expect GGR to grow to over $45 billion by 2020, implying a five-year CAGR of over 10% compared to our 2015 GGR estimate of $28 billion.
Improving Access Improving infrastructure and increasing hotel room capacity is key to Macau’s growth story. The existence of able and willing casino patrons is nothing without the ability to facilitate their visits to Macau’s casinos. Currently, access is constrained by the interrelated factors of air and land transportation, intra-Macau traffic flow, and hotel room supply. As new infrastructure projects open in the coming years, we expect visitor volumes to increase significantly.
Dominance Retained We contend that with the opening of new developments in Cotai, Macau will reach a level of critical mass that will allow it to fend off competition from competing gaming jurisdictions. In the same way that Las Vegas is able to draw more than 33 million of American patrons every year, despite the existence of casinos in 39 US states in every region of the county, Macau will be able to draw significant visitor volumes even if gambling is expanded within China, which we think is highly unlikely in the near-term. Moreover, the development of amusement, convention, and hotel facilities on Hengqin Island will help to further increase the gravitational pull of Macau relative to other gaming and tourist destinations.
Supply Restrictions & Returns The government of Macau has laid out a plan for table growth based on a 3% CAGR over the 2012-2022 timeframe from a base of 5,485 tables. The government has remained ambiguous with regards to how the calculation is computed and how it will be implemented. Enforcement of the policy has become a topic of focus as operators look to open a batch of properties in Cotai with aggregate planned tables well above the number implied by the calculation. While in the short-term, supply restrictions on new gaming tables may be a headache for operators opening large properties in Cotai, in the long-term the limits to new supply entering the market will help to protect table revenue yields, margins and returns.
Infrastructure Projects
Source: ggrasia.com, macaubusiness.com, airportbusiness.com, hzmb.hk
Expected
Completion
Perminate Taipa Ferry Terminal Year-end 2015 Expands to 19 berths from 3 - capacity to 40 ferries/hour
Macau Airport Expansion 2016 Expansion allows for incremental 1.5 million of passangers
Gongbei-Hengqin Rail Link Mid-2017 Improve access to Hengqin Island
Macau Light Rail (Cotia section) 2018 Provides a link between Cotai casinos
Hong Kong-Zhuhai-Macau Bridge 2020 Cut drive time from HK to Macau to 45 min from 4 hours
Macau Light Rail (Peninsula section) 2018 Connects Gongbei border crossing to Cotai casinos
Project Goal
Rising Chinese Consumer
Source: McKinsey & Co.
Macau Visitation Penetration
Source: Macao DSEC; National Bureau of Statistics of China; Gabelli & Company
2014 Visitors
PopulationPenetration
Rate %GDP Per
Capita
Beijing 378,296 21,150,000 1.8% $15,051Shanghai 543,891 24,150,000 2.3% $14,547Jiangsu 583,640 79,390,000 0.7% $12,047Zhejiang 697,980 54,980,000 1.3% $11,054Liaoning 342,504 43,900,000 0.8% $9,961Guangdong 9,160,041 106,440,000 8.6% $9,452Fujian 916,013 37,740,000 2.4% $9,342Shandong 309,456 97,330,000 0.3% $9,094
Total 12,931,821 465,080,000 2.8% $10,556
10% penetration rate 46,508,000
Difference 33,576,179
Exhibit 15
Table 22
Exhibit 16
Gabelli & Company
17
MACAU: Near-Term Concerns
While we estimate that the market is near a monthly GGR run rate base (of around US$2 billion) off of which it can grow as new properties open, profitability is still at risk. As the issues creating uncertainty and risk dissipate, we would expect Macau’s casino stocks to begin working higher. However, with a number of outstanding issues yet to be determined, we would wait for greater visibility before putting money to work across the board.
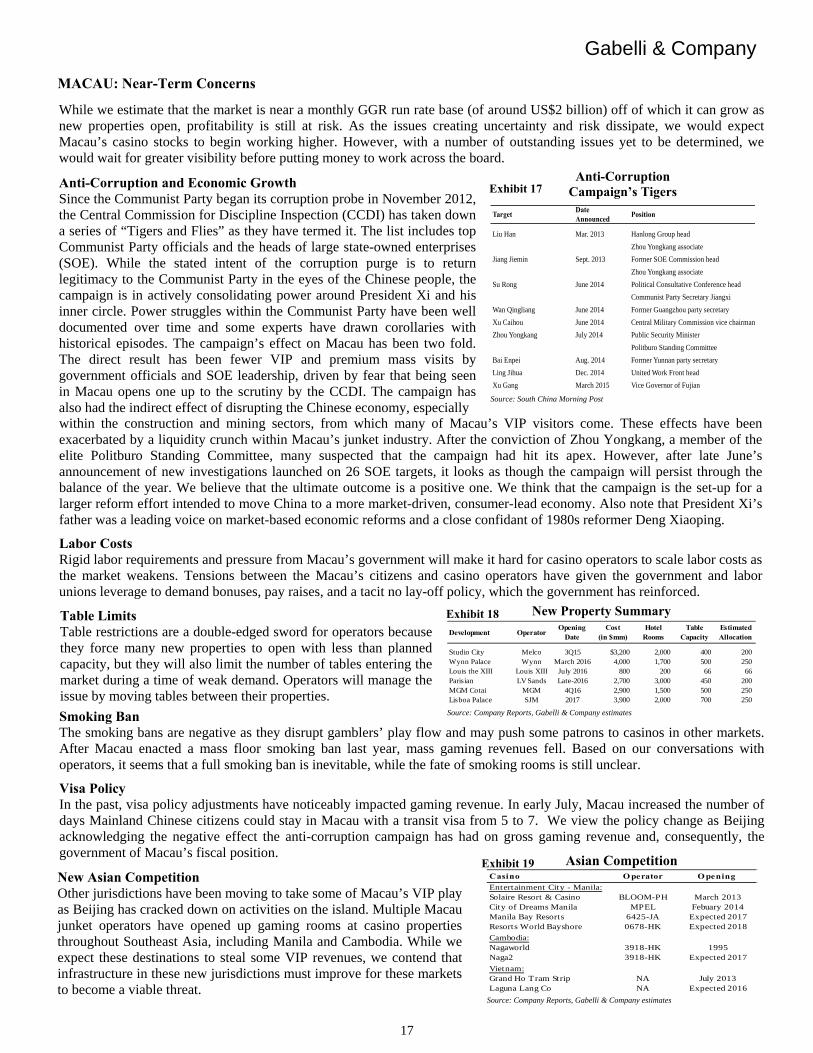
Anti-Corruption and Economic Growth Since the Communist Party began its corruption probe in November 2012, the Central Commission for Discipline Inspection (CCDI) has taken down a series of “Tigers and Flies” as they have termed it. The list includes top Communist Party officials and the heads of large state-owned enterprises (SOE). While the stated intent of the corruption purge is to return legitimacy to the Communist Party in the eyes of the Chinese people, the campaign is in actively consolidating power around President Xi and his inner circle. Power struggles within the Communist Party have been well documented over time and some experts have drawn corollaries with historical episodes. The campaign’s effect on Macau has been two fold. The direct result has been fewer VIP and premium mass visits by government officials and SOE leadership, driven by fear that being seen in Macau opens one up to the scrutiny by the CCDI. The campaign has also had the indirect effect of disrupting the Chinese economy, especially within the construction and mining sectors, from which many of Macau’s VIP visitors come. These effects have been exacerbated by a liquidity crunch within Macau’s junket industry. After the conviction of Zhou Yongkang, a member of the elite Politburo Standing Committee, many suspected that the campaign had hit its apex. However, after late June’s announcement of new investigations launched on 26 SOE targets, it looks as though the campaign will persist through the balance of the year. We believe that the ultimate outcome is a positive one. We think that the campaign is the set-up for a larger reform effort intended to move China to a more market-driven, consumer-lead economy. Also note that President Xi’s father was a leading voice on market-based economic reforms and a close confidant of 1980s reformer Deng Xiaoping.
Labor Costs Rigid labor requirements and pressure from Macau’s government will make it hard for casino operators to scale labor costs as the market weakens. Tensions between the Macau’s citizens and casino operators have given the government and labor unions leverage to demand bonuses, pay raises, and a tacit no lay-off policy, which the government has reinforced.
New Asian Competition Other jurisdictions have been moving to take some of Macau’s VIP play as Beijing has cracked down on activities on the island. Multiple Macau junket operators have opened up gaming rooms at casino properties throughout Southeast Asia, including Manila and Cambodia. While we expect these destinations to steal some VIP revenues, we contend that infrastructure in these new jurisdictions must improve for these markets to become a viable threat.
Anti-Corruption Campaign’s Tigers
Source: South China Morning Post
Target Date Announced
Position
Liu Han Mar. 2013 Hanlong Group head
Zhou Yongkang associate
Jiang Jiemin Sept. 2013 Former SOE Commission head
Zhou Yongkang associate
Su Rong June 2014 Political Consultative Conference head
Communist Party Secretary Jiangxi
Wan Qingliang June 2014 Former Guangzhou party secretary
Xu Caihou June 2014 Central Military Commission vice chairman
Zhou Yongkang July 2014 Public Security Minister
Politburo Standing Committee
Bai Enpei Aug. 2014 Former Yunnan party secretary
Ling Jihua Dec. 2014 United Work Front head
Xu Gang March 2015 Vice Governor of Fujian
Smoking Ban The smoking bans are negative as they disrupt gamblers’ play flow and may push some patrons to casinos in other markets. After Macau enacted a mass floor smoking ban last year, mass gaming revenues fell. Based on our conversations with operators, it seems that a full smoking ban is inevitable, while the fate of smoking rooms is still unclear.
Visa Policy In the past, visa policy adjustments have noticeably impacted gaming revenue. In early July, Macau increased the number of days Mainland Chinese citizens could stay in Macau with a transit visa from 5 to 7. We view the policy change as Beijing acknowledging the negative effect the anti-corruption campaign has had on gross gaming revenue and, consequently, the government of Macau’s fiscal position.
Table Limits Table restrictions are a double-edged sword for operators because they force many new properties to open with less than planned capacity, but they will also limit the number of tables entering the market during a time of weak demand. Operators will manage the issue by moving tables between their properties.
New Property Summary
Source: Company Reports, Gabelli & Company estimates
Development OperatorOpening
DateCost
(in $mm)Hotel
RoomsTable
CapacityEstimated Allocation
Studio City Melco 3Q15 $3,200 2,000 400 200Wynn Palace Wynn March 2016 4,000 1,700 500 250Louis the XIII Louis XIII July 2016 800 200 66 66Parisian LV Sands Late-2016 2,700 3,000 450 200MGM Cotai MGM 4Q16 2,900 1,500 500 250Lisboa Palace SJM 2017 3,900 2,000 700 250
Asian Competition
Source: Company Reports, Gabelli & Company estimates
Casino O perator O pening
Entertainment City - Manila:Solaire Resort & Casino BLOOM-PH March 2013City of Dreams Manila MPEL Febuary 2014Manila Bay Resorts 6425-JA Expected 2017Resorts World Bayshore 0678-HK Expected 2018
Cambodia:Nagaworld 3918-HK 1995Naga2 3918-HK Expected 2017
Vietnam:Grand Ho Tram Strip NA July 2013Laguna Lang Co NA Expected 2016
Exhibit 17
Exhibit 18
Exhibit 19

Gabelli & Company
18
LAS VEGAS: Looking Like a Safe Wager
Due in large part to the expansion of gambling across the US, growth in Las Vegas has been challenged as gaming revenue (excluding baccarat) have been stagnant for the past ten years. Hotel revenues make up an increasingly significant portion of incremental profit. With little new hotel room supply coming online over the next few years, we expect room ADRs to grow at a low-single digit rate over the next five years with occupancy increasing in tandem.
Hotel Room Supply Dynamics Since Cosmopolitan’s opening in 2010, hotel room supply growth on the Las Vegas Strip has been virtually non-existent, as the city is still in the process of clearing the mess caused by the financial crisis and ensuing recession. The recent Caesars’ bankruptcy filing and MGM’s settlement on the Harmon portion of the City Center complex are evidence of this recovery. The two significant prospects in terms of capacity expansion are Genting’s Resorts World development, a $4.0 billion
property across from Wynn/Encore, and a project from Crown Resorts, an Australian operator controlled by casino magnet James Packer with partial ownership in Macau concessionaire Melco Crown.
Both projects will seek to “grow the pie” leveraging their databases in an attempt to draw new visits to Las Vegas. With their China-themed property, Genting will likely focus on drawing Asian traffic, a good portion of whom will be
high-value players from its Singapore and Malaysian properties. Crown’s project, also located on the north end of the Strip, would likely seek to do the same at the high-end.
Another significant development is Penn National’s takeover of the Tropicana resort, located across from the Luxor. We view Penn’s entry as a slight negative for the rest of the Strip as it will likely seek to capture Vegas visits from
rated-players in its database that would otherwise visit other Strip properties. Although the near term picture is unclear, Caesars’ eventual move into a more sustainable operating structure may help to
moderate competition on room rates and casino comp levels.
Conventions & Events Events have become the major driver of visitation to Las Vegas. We contend that visitation by both convention and leisure travelers will continue to grow at low to mid-single digit rates through 2020 with limited supply growth helping to drive occupancy levels to the high-80% range and room rates above the prior peak of $132 per night, from $117 per night in 2014.
Most of the new development on the Strip will come in the form of event-focused facilities, which we believe will facilitate Strip visitation to grow to 46 million by 2020 from 41 million in 2014, representing a CAGR of 2.0%.
We believe attendance will reach its prior peak by 2019 due to a healthy business climate and capacity expansion.
Convention attendance in 2014 of 5.2 million is up 16%, from a low of 4.5 million in 2010, but still off 18% versus the 2006 peak of 6.3 million. The figure is highly correlated to mid-week occupancy, currently 84% versus 89% in 2007.
Longer term, the opening of the Las Vegas Visitors Authority’s Global Business District, which will include a 1.8 million square foot convention space expansion, will further solidify the Strip as the premier convention destination.
Millennials, Boomers, and the Future of Gaming With Baby Boomers aging and financially limited, engaging the Millennial consumer has become a key issue. High student debt, a weak economy, and changing social patterns have caused the economic maturation of Millennials to lag behind prior generations. Moreover, Millennial preferences have skewed away from slot machines and toward table games. But the industry is pushing for legislation that will enable slot makers to create games that have video game characteristics. The evolution of skill-based gaming, as it is called, is worth taking note of as it could pave the way for the future of the industry.
Strip Room Supply Projections
Source: Company Reports, Nevada Gaming Control Board, Gabelli & Company estimates
LV Strip Construction
Source: Las Vegas Visitors Authority
Rooms Opening Date Cost ($mm)
Riviera Closure (2,075) May 2015 NALinq Room Renovation 1,400 Aug. 2015 NAAll Net Resort 500 2017 NALucky Dragon Hotel & Casino 200 2017 NAResorts World (Phase I) 3,000 Spring 2018 $4,000Crown Resorts 2,000e 2019e NA
Convention /
Meeting Sq. Ft.
Mandalay Bay Expansion 350,000 Aug. 2015 $66Las Vegas Global Business District 1,800,000 +2020 2,300
Purpose Opening Date Cost ($mm)
Omnia Nightclub Club March 2015 $38Rock in Rio Festival Grounds Events May 2015 20Fashion Show Expansion Retail Fall 2015 NAToshiba Plaza Retail April 2016 50MGM Resorts Arena Events April 2016 375All Net Arena Events 2017 1,400
Opening Date Cost ($mm)
Exhibit 21 Exhibit 20
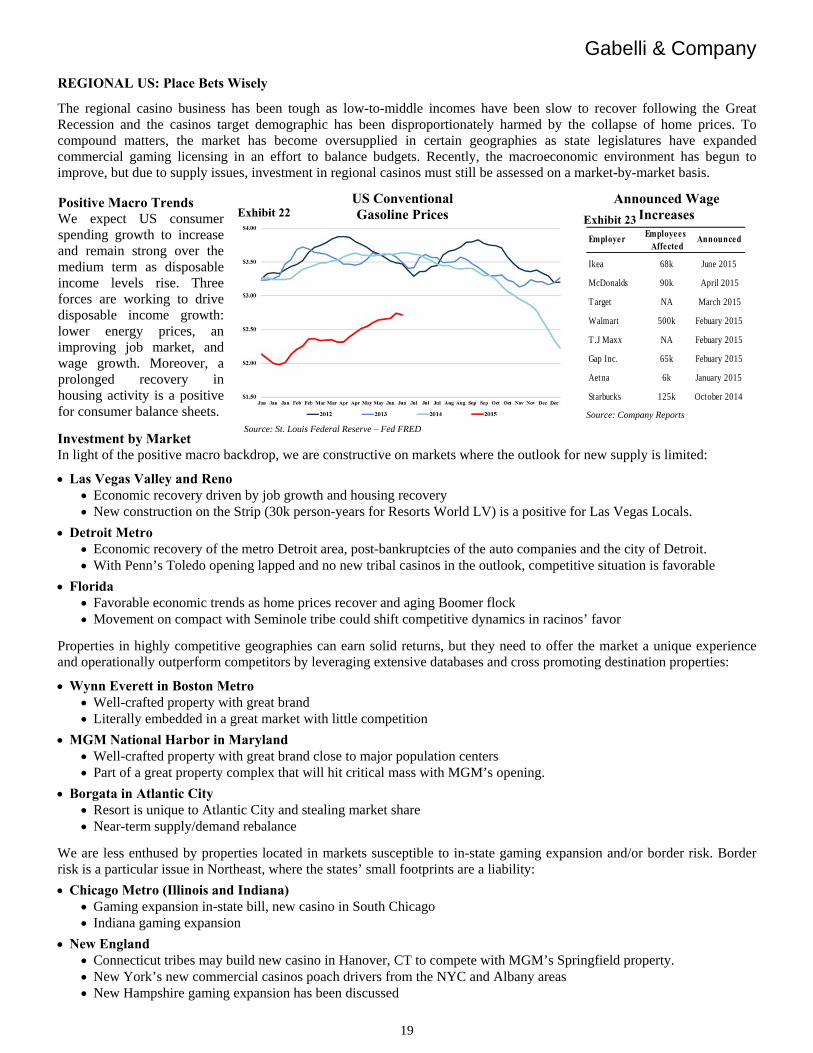
Gabelli & Company
19
REGIONAL US: Place Bets Wisely
The regional casino business has been tough as low-to-middle incomes have been slow to recover following the Great Recession and the casinos target demographic has been disproportionately harmed by the collapse of home prices. To compound matters, the market has become oversupplied in certain geographies as state legislatures have expanded commercial gaming licensing in an effort to balance budgets. Recently, the macroeconomic environment has begun to improve, but due to supply issues, investment in regional casinos must still be assessed on a market-by-market basis.
Investment by Market In light of the positive macro backdrop, we are constructive on markets where the outlook for new supply is limited:
Las Vegas Valley and Reno Economic recovery driven by job growth and housing recovery New construction on the Strip (30k person-years for Resorts World LV) is a positive for Las Vegas Locals.
Detroit Metro Economic recovery of the metro Detroit area, post-bankruptcies of the auto companies and the city of Detroit. With Penn’s Toledo opening lapped and no new tribal casinos in the outlook, competitive situation is favorable
Florida Favorable economic trends as home prices recover and aging Boomer flock Movement on compact with Seminole tribe could shift competitive dynamics in racinos’ favor
Properties in highly competitive geographies can earn solid returns, but they need to offer the market a unique experience and operationally outperform competitors by leveraging extensive databases and cross promoting destination properties:
Wynn Everett in Boston Metro Well-crafted property with great brand Literally embedded in a great market with little competition
MGM National Harbor in Maryland Well-crafted property with great brand close to major population centers Part of a great property complex that will hit critical mass with MGM’s opening.
Borgata in Atlantic City Resort is unique to Atlantic City and stealing market share Near-term supply/demand rebalance
We are less enthused by properties located in markets susceptible to in-state gaming expansion and/or border risk. Border risk is a particular issue in Northeast, where the states’ small footprints are a liability:
Chicago Metro (Illinois and Indiana) Gaming expansion in-state bill, new casino in South Chicago Indiana gaming expansion
New England Connecticut tribes may build new casino in Hanover, CT to compete with MGM’s Springfield property. New York’s new commercial casinos poach drivers from the NYC and Albany areas New Hampshire gaming expansion has been discussed
Positive Macro Trends We expect US consumer spending growth to increase and remain strong over the medium term as disposable income levels rise. Three forces are working to drive disposable income growth: lower energy prices, an improving job market, and wage growth. Moreover, a prolonged recovery in housing activity is a positive for consumer balance sheets.
Announced Wage Increases
Source: Company Reports
Employees Affected
Ikea 68k June 2015
McDonalds 90k April 2015
Target NA March 2015
Walmart 500k Febuary 2015
T .J Maxx NA Febuary 2015
Gap Inc. 65k Febuary 2015
Aetna 6k January 2015
Starbucks 125k October 2014
Employer Announced
US Conventional Gasoline Prices
Source: St. Louis Federal Reserve – Fed FRED
Exhibit 22 Exhibit 23

Gabelli & Company
20
I, Adam Trivison, the Research Analyst who prepared this report, hereby certify that the views expressed in this report accurately reflect the analyst’s personal views about the subject companies and their securities. The Research Analyst has not been, is not and will not be receiving direct or indirect compensation for expressing the specific recommendation or view in this report.
Adam Trivison (914) 921-5591 Gabelli & Company 2015
Important Disclosures
ONE CORPORATE CENTER RYE, NY 10580 GABELLI & COMPANY TEL (914) 921-5130 FAX (914) 921-5098 Gabelli & Company is the marketing name for the registered broker dealer G.research, Inc., which was formerly known as Gabelli & Company, Inc. Gabelli & Company (“we” or “us”) attempts to provide timely, value-added insights into companies or industry dynamics for institutional investors. Our research reports generally contain a recommendation of “buy,” “hold,” “sell” or “non-rated.” We do not undertake to “upgrade” or “downgrade” ratings after publishing a report. We currently have reports on 587 companies, of which 45%, 37%, 3% and 14% have a recommendation of buy, hold, sell or non-rated, respectively. The percentage of companies so rated for which we provided investment banking services within the past 12 months is 0%, 0%, 0% and less than 1%. Ratings Analysts’ ratings are largely (but not always) determined by our “private market value,” or PMV methodology. Our basic goal is to understand in absolute terms what a rational, strategic buyer would pay for an asset in an open, arms-length transaction. At the same time, analysts also look for underlying catalysts that could encourage those private market values to surface. A Buy rated stock is one that in our view is trading at a meaningful discount to our estimated PMV. We could expect a more modest private market value to increase at an accelerated pace, the discount of the public stock price to PMV to narrow through the emergence of a catalyst, or some combination of the two to occur. A Hold is a stock that may be trading at or near our estimated private market value. We may not anticipate a large increase in the PMV, or see some other factors at work. A Sell is a stock that may be trading at or above our estimated PMV. There may be little upside to the value, or limited opportunity to realize the value. Economic or sector risk could also be increasing. We prepared this report as a matter of general information. We do not intend for this report to be a complete description of any security or company and it is not an offer or solicitation to buy or sell any security. All facts and statistics are from sources we believe to be reliable, but we do not guarantee their accuracy. We do not undertake to advise you of changes in our opinion or information. Unless otherwise noted, all stock prices reflect the closing price on the business day immediately prior to the date of this report. We do not use “price targets” predicting future stock performance. We do refer to “private market value” or PMV, which is the price that we believe an informed buyer would pay to acquire 100% of a company. There is no assurance that there are any willing buyers of a company at this price and we do not intend to suggest that any acquisition is likely. Additional information is available on request. As of June 30, 2015, our affiliates beneficially own on behalf of their investment advisory clients or otherwise approximately 5.86% of Churchill Downs, 4.64% of Lakes Entertainment, 3.71% of Boyd Gaming, 2.38% of Dover Downs, 1.14% of Pinnacle Entertainment, 1.06% of Full House Resorts and less than 1% of all other companies mentioned. Because the portfolio managers at our affiliates make individual investment decisions with respect to the client accounts they manage, these accounts may have transactions inconsistent with the recommendations in this report. These portfolio managers may know the substance of our research reports prior to their publication as a result of joint participation in research meetings or otherwise. No part of my compensation was, is, or will be, directly or indirectly, related to the specific recommendations or views expressed in this research report. In addition, the undersigned lead analyst(s) has not and will not receive any compensation for providing a specific recommendation or view in this report. The analyst, who wrote this report, or members of his household, owns no shares of the above mentioned companies.
Other Companies Mentioned: Isle of Capri Casions (ISLE - NASDAQ)Boyd Gaming (BYD - NYSE) Lakes Entertainment (LACO - " )Caesars Entertainment (CZR - " ) Las Vegas Sands (LVS - NYSE)Churchill Downs (CHDN - NASDAQ) MGM Resorts International (MGM - " )Dover Downs (DDE - NYSE) Monarch Casino (MCRI - NASDAQ)Eldorado Resorts (ELI - " ) Tropicana Entertainment (TPCA - " )Fullhouse Resorts (FLL - " ) Penn National (PENN - " )Gaming & Leisure (GLPI - NASDAQ) Pinnacle Entertainment (PNK - NYSE)Genting (G13.SI - Singapore) Wynn Macau (1128 - Hong Kong)International Game Technology (IGT - NYSE) Wynn Resorts (WYNN - NASDAQ)
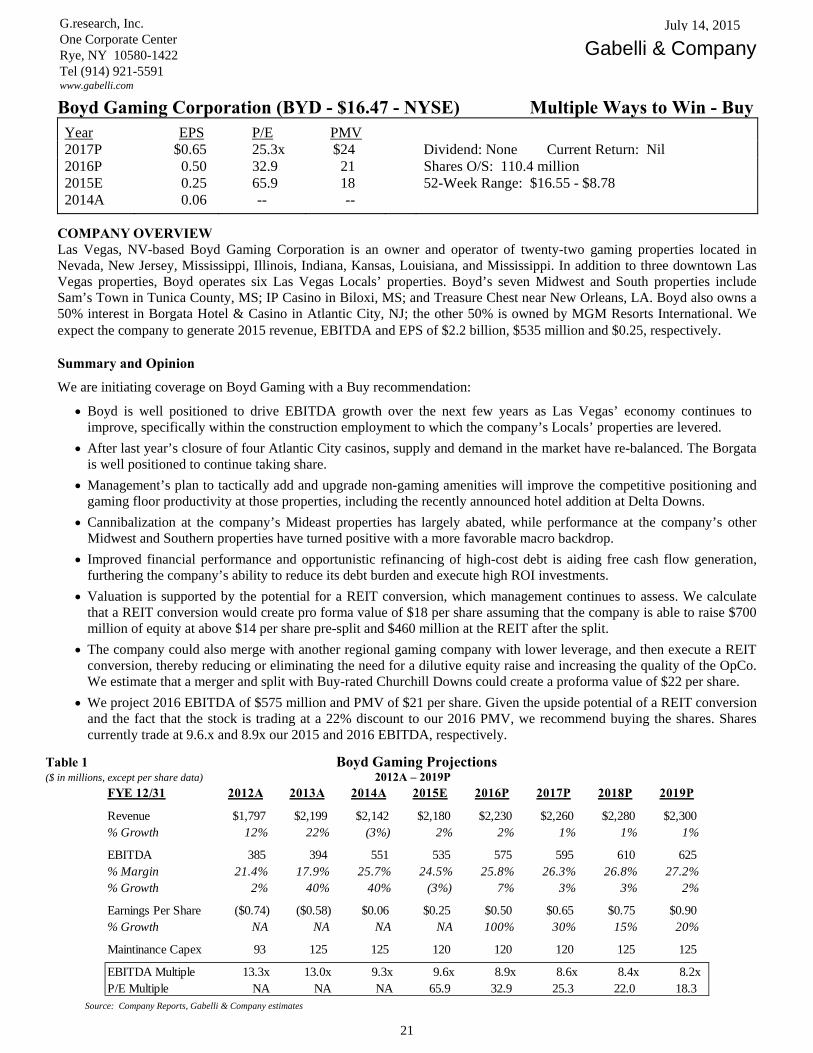
Gabelli & Company
21
Boyd Gaming Corporation (BYD - $16.47 - NYSE) Multiple Ways to Win - Buy Year EPS P/E PMV 2017P $0.65 25.3x $24 Dividend: None Current Return: Nil 2016P 0.50 32.9 21 Shares O/S: 110.4 million 2015E 0.25 65.9 18 52-Week Range: $16.55 - $8.78 2014A 0.06 -- --
COMPANY OVERVIEW Las Vegas, NV-based Boyd Gaming Corporation is an owner and operator of twenty-two gaming properties located in Nevada, New Jersey, Mississippi, Illinois, Indiana, Kansas, Louisiana, and Mississippi. In addition to three downtown Las Vegas properties, Boyd operates six Las Vegas Locals’ properties. Boyd’s seven Midwest and South properties include Sam’s Town in Tunica County, MS; IP Casino in Biloxi, MS; and Treasure Chest near New Orleans, LA. Boyd also owns a 50% interest in Borgata Hotel & Casino in Atlantic City, NJ; the other 50% is owned by MGM Resorts International. We expect the company to generate 2015 revenue, EBITDA and EPS of $2.2 billion, $535 million and $0.25, respectively. Summary and Opinion
We are initiating coverage on Boyd Gaming with a Buy recommendation:
Boyd is well positioned to drive EBITDA growth over the next few years as Las Vegas’ economy continues to improve, specifically within the construction employment to which the company’s Locals’ properties are levered.
After last year’s closure of four Atlantic City casinos, supply and demand in the market have re-balanced. The Borgata is well positioned to continue taking share.
Management’s plan to tactically add and upgrade non-gaming amenities will improve the competitive positioning and gaming floor productivity at those properties, including the recently announced hotel addition at Delta Downs.
Cannibalization at the company’s Mideast properties has largely abated, while performance at the company’s other Midwest and Southern properties have turned positive with a more favorable macro backdrop.
Improved financial performance and opportunistic refinancing of high-cost debt is aiding free cash flow generation, furthering the company’s ability to reduce its debt burden and execute high ROI investments.
Valuation is supported by the potential for a REIT conversion, which management continues to assess. We calculate that a REIT conversion would create pro forma value of $18 per share assuming that the company is able to raise $700 million of equity at above $14 per share pre-split and $460 million at the REIT after the split.
The company could also merge with another regional gaming company with lower leverage, and then execute a REIT conversion, thereby reducing or eliminating the need for a dilutive equity raise and increasing the quality of the OpCo. We estimate that a merger and split with Buy-rated Churchill Downs could create a proforma value of $22 per share.
We project 2016 EBITDA of $575 million and PMV of $21 per share. Given the upside potential of a REIT conversion and the fact that the stock is trading at a 22% discount to our 2016 PMV, we recommend buying the shares. Shares currently trade at 9.6.x and 8.9x our 2015 and 2016 EBITDA, respectively.
Table 1 Boyd Gaming Projections ($ in millions, except per share data) 2012A – 2019P
Source: Company Reports, Gabelli & Company estimates
FYE 12/31 2012A 2013A 2014A 2015E 2016P 2017P 2018P 2019P
Revenue $1,797 $2,199 $2,142 $2,180 $2,230 $2,260 $2,280 $2,300% Growth 12% 22% (3%) 2% 2% 1% 1% 1%
EBITDA 385 394 551 535 575 595 610 625% Margin 21.4% 17.9% 25.7% 24.5% 25.8% 26.3% 26.8% 27.2%% Growth 2% 40% 40% (3%) 7% 3% 3% 2%
Earnings Per Share ($0.74) ($0.58) $0.06 $0.25 $0.50 $0.65 $0.75 $0.90% Growth NA NA NA NA 100% 30% 15% 20%
Maintinance Capex 93 125 125 120 120 120 125 125
EBITDA Multiple 13.3x 13.0x 9.3x 9.6x 8.9x 8.6x 8.4x 8.2xP/E Multiple NA NA NA 65.9 32.9 25.3 22.0 18.3
G.research, Inc. One Corporate Center Rye, NY 10580-1422 Tel (914) 921-5591 www.gabelli.com
July 14, 2015
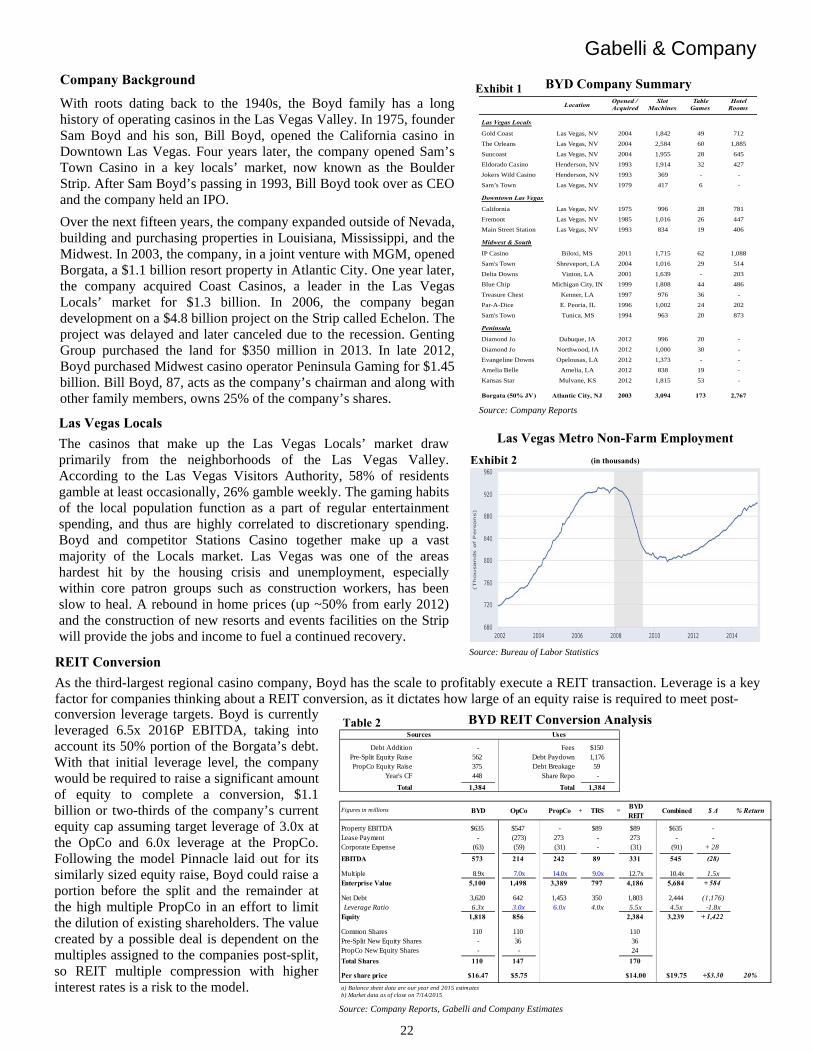
Gabelli & Company
22
BYD REIT Conversion Analysis
Source: Company Reports, Gabelli and Company Estimates
Debt Addition - Fees $150Pre-Split Equity Raise 562 Debt Paydown 1,176PropCo Equity Raise 375 Debt Breakage 59
Year's CF 448 Share Repo -
Total 1,384 Total 1,384
Figures in millions BYD OpCo PropCo + TRS =BYD REIT
Combined $ Δ % Return
Property EBITDA $635 $547 - $89 $89 $635 -Lease Payment - (273) 273 - 273 - -Corporate Expense (63) (59) (31) - (31) (91) + 28
EBITDA 573 214 242 89 331 545 (28)
Multiple 8.9x 7.0x 14.0x 9.0x 12.7x 10.4x 1.5xEnterprise Value 5,100 1,498 3,389 797 4,186 5,684 + 584
Net Debt 3,620 642 1,453 350 1,803 2,444 (1,176)Leverage Ratio 6.3x 3.0x 6.0x 4.0x 5.5x 4.5x -1.8x
Equity 1,818 856 2,384 3,239 + 1,422
Common Shares 110 110 110Pre-Split New Equity Shares - 36 36PropCo New Equity Shares - - 24
Total Shares 110 147 170
Per share price $16.47 $5.75 $14.00 $19.75 +$3.30 20%
a) Balance sheet data are our year end 2015 estimatesb) Market data as of close on 7/14/2015
Sources Uses
REIT Conversion
As the third-largest regional casino company, Boyd has the scale to profitably execute a REIT transaction. Leverage is a key factor for companies thinking about a REIT conversion, as it dictates how large of an equity raise is required to meet post-
conversion leverage targets. Boyd is currently leveraged 6.5x 2016P EBITDA, taking into account its 50% portion of the Borgata’s debt. With that initial leverage level, the company would be required to raise a significant amount of equity to complete a conversion, $1.1 billion or two-thirds of the company’s current equity cap assuming target leverage of 3.0x at the OpCo and 6.0x leverage at the PropCo. Following the model Pinnacle laid out for its similarly sized equity raise, Boyd could raise a portion before the split and the remainder at the high multiple PropCo in an effort to limit the dilution of existing shareholders. The value created by a possible deal is dependent on the multiples assigned to the companies post-split, so REIT multiple compression with higher interest rates is a risk to the model.
Las Vegas Locals
The casinos that make up the Las Vegas Locals’ market draw primarily from the neighborhoods of the Las Vegas Valley. According to the Las Vegas Visitors Authority, 58% of residents gamble at least occasionally, 26% gamble weekly. The gaming habits of the local population function as a part of regular entertainment spending, and thus are highly correlated to discretionary spending. Boyd and competitor Stations Casino together make up a vast majority of the Locals market. Las Vegas was one of the areas hardest hit by the housing crisis and unemployment, especially within core patron groups such as construction workers, has been slow to heal. A rebound in home prices (up ~50% from early 2012) and the construction of new resorts and events facilities on the Strip will provide the jobs and income to fuel a continued recovery.
Company Background
With roots dating back to the 1940s, the Boyd family has a long history of operating casinos in the Las Vegas Valley. In 1975, founder Sam Boyd and his son, Bill Boyd, opened the California casino in Downtown Las Vegas. Four years later, the company opened Sam’s Town Casino in a key locals’ market, now known as the Boulder Strip. After Sam Boyd’s passing in 1993, Bill Boyd took over as CEO and the company held an IPO.
Over the next fifteen years, the company expanded outside of Nevada, building and purchasing properties in Louisiana, Mississippi, and the Midwest. In 2003, the company, in a joint venture with MGM, opened Borgata, a $1.1 billion resort property in Atlantic City. One year later, the company acquired Coast Casinos, a leader in the Las Vegas Locals’ market for $1.3 billion. In 2006, the company began development on a $4.8 billion project on the Strip called Echelon. The project was delayed and later canceled due to the recession. Genting Group purchased the land for $350 million in 2013. In late 2012, Boyd purchased Midwest casino operator Peninsula Gaming for $1.45 billion. Bill Boyd, 87, acts as the company’s chairman and along with other family members, owns 25% of the company’s shares.
BYD Company Summary
Source: Company Reports
LocationOpened / Acquired
Slot Machines
Table Games
Hotel Rooms
Las Vegas Locals
Gold Coast Las Vegas, NV 2004 1,842 49 712
The Orleans Las Vegas, NV 2004 2,584 60 1,885
Suncoast Las Vegas, NV 2004 1,955 28 645
Eldorado Casino Henderson, NV 1993 1,914 32 427
Jokers Wild Casino Henderson, NV 1993 369 - -
Sam’s Town Las Vegas, NV 1979 417 6 -
Downtown Las Vegas
California Las Vegas, NV 1975 996 28 781
Fremont Las Vegas, NV 1985 1,016 26 447
Main Street Station Las Vegas, NV 1993 834 19 406
Midwest & South
IP Casino Biloxi, MS 2011 1,715 62 1,088
Sam's Town Shreveport, LA 2004 1,016 29 514
Delta Downs Vinton, LA 2001 1,639 - 203
Blue Chip Michigan City, IN 1999 1,808 44 486
Treasure Chest Kenner, LA 1997 976 36 -
Par-A-Dice E. Peoria, IL 1996 1,002 24 202
Sam's Town Tunica, MS 1994 963 20 873
Peninsula
Diamond Jo Dubuque, IA 2012 996 20 -
Diamond Jo Northwood, IA 2012 1,000 30 -
Evangeline Downs Opelousas, LA 2012 1,373 - -
Amelia Belle Amelia, LA 2012 838 19 -
Kansas Star Mulvane, KS 2012 1,815 53 -
Borgata (50% JV) Atlantic City, NJ 2003 3,094 173 2,767
Las Vegas Metro Non-Farm Employment
(in thousands)
Source: Bureau of Labor Statistics
Exhibit 1
Exhibit 2
Table 2
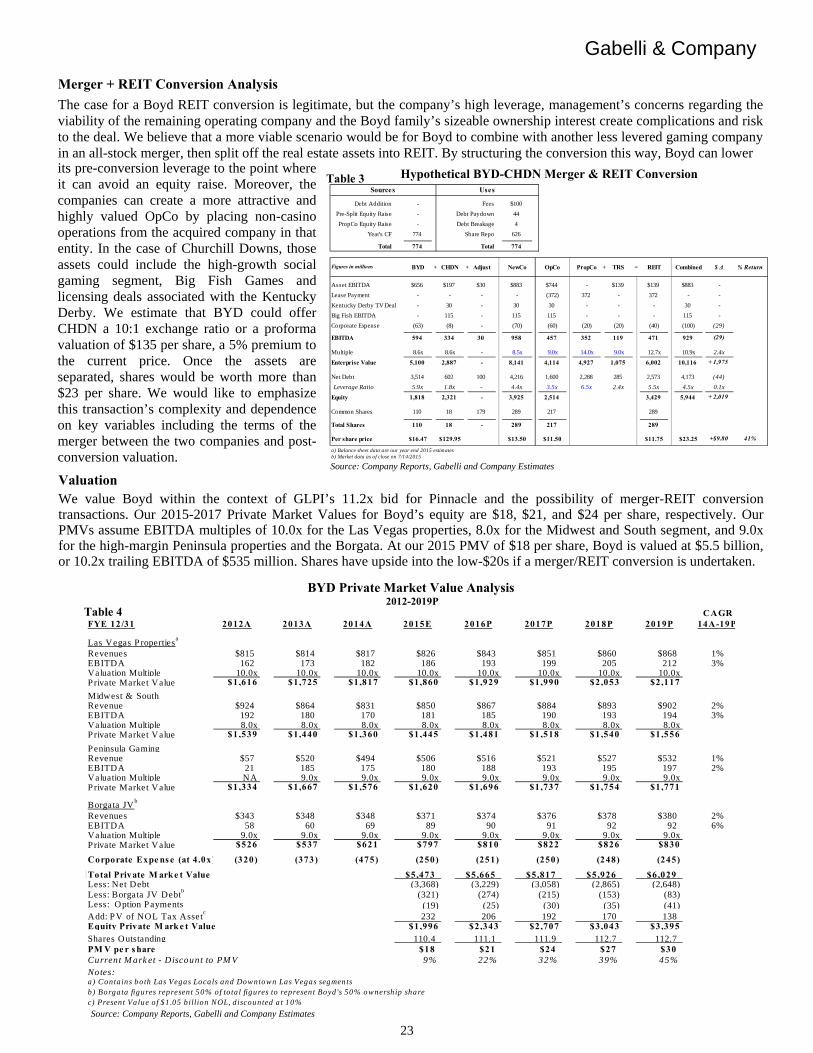
Gabelli & Company
23
Merger + REIT Conversion Analysis
The case for a Boyd REIT conversion is legitimate, but the company’s high leverage, management’s concerns regarding the viability of the remaining operating company and the Boyd family’s sizeable ownership interest create complications and risk to the deal. We believe that a more viable scenario would be for Boyd to combine with another less levered gaming company in an all-stock merger, then split off the real estate assets into REIT. By structuring the conversion this way, Boyd can lower
Valuation
We value Boyd within the context of GLPI’s 11.2x bid for Pinnacle and the possibility of merger-REIT conversion transactions. Our 2015-2017 Private Market Values for Boyd’s equity are $18, $21, and $24 per share, respectively. Our PMVs assume EBITDA multiples of 10.0x for the Las Vegas properties, 8.0x for the Midwest and South segment, and 9.0x for the high-margin Peninsula properties and the Borgata. At our 2015 PMV of $18 per share, Boyd is valued at $5.5 billion, or 10.2x trailing EBITDA of $535 million. Shares have upside into the low-$20s if a merger/REIT conversion is undertaken.
BYD Private Market Value Analysis 2012-2019P
Source: Company Reports, Gabelli and Company Estimates
CAGRFYE 12/31 2012A 2013A 2014A 2015E 2016P 2017P 2018P 2019P 14A-19P
Las Vegas P ropertiesa
Revenues $815 $814 $817 $826 $843 $851 $860 $868 1%EBITDA 162 173 182 186 193 199 205 212 3%Valuation Multiple 10.0x 10.0x 10.0x 10.0x 10.0x 10.0x 10.0x 10.0xPrivate Market Value $1,616 $1,725 $1,817 $1,860 $1,929 $1,990 $2,053 $2,117
Midwest & SouthRevenue $924 $864 $831 $850 $867 $884 $893 $902 2%EBITDA 192 180 170 181 185 190 193 194 3%Valuation Multiple 8.0x 8.0x 8.0x 8.0x 8.0x 8.0x 8.0x 8.0xPrivate Market Value $1,539 $1,440 $1,360 $1,445 $1,481 $1,518 $1,540 $1,556
Peninsula GamingRevenue $57 $520 $494 $506 $516 $521 $527 $532 1%EBITDA 21 185 175 180 188 193 195 197 2%Valuation Multiple NA 9.0x 9.0x 9.0x 9.0x 9.0x 9.0x 9.0xPrivate Market Value $1,334 $1,667 $1,576 $1,620 $1,696 $1,737 $1,754 $1,771
Borgata JVb
Revenues $343 $348 $348 $371 $374 $376 $378 $380 2%EBITDA 58 60 69 89 90 91 92 92 6%Valuation Multiple 9.0x 9.0x 9.0x 9.0x 9.0x 9.0x 9.0x 9.0xPrivate Market Value $526 $537 $621 $797 $810 $822 $826 $830
Corporate Expe ns e (at 4 .0x) (320) (373) (475) (250) (251) (250) (248) (245)
Total Private M arke t Value $5,473 $5,665 $5,817 $5,926 $6,029Less: Net Debt (3,368) (3,229) (3,058) (2,865) (2,648) Less: Borgata JV Debt
b(321) (274) (215) (153) (83)
Less: Option Payments (19) (25) (30) (35) (41) Add: PV of NOL Tax Asset
c232 206 192 170 138
Equity Private M ark e t Value $1,996 $2,343 $2,707 $3,043 $3,395Shares Outstanding 110.4 111.1 111.9 112.7 112.7 PM V pe r s hare $18 $21 $24 $27 $30Current M ark et - Discount to PM V 9% 22% 32% 39% 45%Notes:a) Contains both Las Vegas Locals and Downtown Las Vegas segmen tsb) Borgata figures represent 50% of to ta l figures to represent Boyd 's 50% ownership sharec) Present Value o f $1 .05 b illion NOL, d iscounted a t 10%
Hypothetical BYD-CHDN Merger & REIT Conversion
Source: Company Reports, Gabelli and Company Estimates
Debt Addition - Fees $100
Pre-Split Equity Raise - Debt Paydown 44
PropCo Equity Raise - Debt Breakage 4
Year's CF 774 Share Repo 626
Total 774 Total 774
Figures in millions BYD + CHDN + Adjust NewCo OpCo PropCo + TRS = REIT Combined $ Δ % Return
Asset EBITDA $656 $197 $30 $883 $744 - $139 $139 $883 -
Lease Payment - - - - (372) 372 - 372 - -
Kentucky Derby TV Deal - 30 - 30 30 - - - 30 -
Big Fish EBITDA - 115 - 115 115 - - - 115 -
Corporate Expense (63) (8) - (70) (60) (20) (20) (40) (100) (29)
EBITDA 594 334 30 958 457 352 119 471 929 (29)
Multiple 8.6x 8.6x - 8.5x 9.0x 14.0x 9.0x 12.7x 10.9x 2.4x
Enterprise Value 5,100 2,887 - 8,141 4,114 4,927 1,075 6,002 10,116 + 1,975
Net Debt 3,514 602 100 4,216 1,600 2,288 285 2,573 4,173 (44)
Leverage Ratio 5.9x 1.8x - 4.4x 3.5x 6.5x 2.4x 5.5x 4.5x 0.1x
Equity 1,818 2,321 - 3,925 2,514 3,429 5,944 + 2,019
Common Shares 110 18 179 289 217 289
Total Shares 110 18 - 289 217 289
Per share price $16.47 $129.95 $13.50 $11.50 $11.75 $23.25 +$9.80 41%
a) Balance sheet data are our year end 2015 estimatesb) Market data as of close on 7/14/2015
Sources Uses
its pre-conversion leverage to the point where it can avoid an equity raise. Moreover, the companies can create a more attractive and highly valued OpCo by placing non-casino operations from the acquired company in that entity. In the case of Churchill Downs, those assets could include the high-growth social gaming segment, Big Fish Games and licensing deals associated with the Kentucky Derby. We estimate that BYD could offer CHDN a 10:1 exchange ratio or a proforma valuation of $135 per share, a 5% premium to the current price. Once the assets are separated, shares would be worth more than $23 per share. We would like to emphasize this transaction’s complexity and dependence on key variables including the terms of the merger between the two companies and post-conversion valuation.
Table 3
Table 4
Gabelli & Company
24
Other Companies Mentioned: Churchill Downs (CHDN – NASDAQ) Pinnacle Entertainment (PNK – NYSE)
I, Adam Trivison, the Research Analyst who prepared this report, hereby certify that the views expressed in this report accurately reflect the analyst’s personal views about the subject companies and their securities. The Research Analyst has not been, is not and will not be receiving direct or indirect compensation for expressing the specific recommendation or view in this report. Adam Trivison (914) 921-5591 Gabelli & Company 2015
Important Disclosures
ONE CORPORATE CENTER RYE, NY 10580 GABELLI & COMPANY TEL (914) 921-5130 FAX (914) 921-5098 Gabelli & Company is the marketing name for the registered broker dealer G.research, Inc., which was formerly known as Gabelli & Company, Inc. Gabelli & Company (“we” or “us”) attempts to provide timely, value-added insights into companies or industry dynamics for institutional investors. Our research reports generally contain a recommendation of “buy,” “hold,” “sell” or “non-rated.” We do not undertake to “upgrade” or “downgrade” ratings after publishing a report. We currently have reports on 587 companies, of which 45%, 37%, 3% and 14% have a recommendation of buy, hold, sell or non-rated, respectively. The percentage of companies so rated for which we provided investment banking services within the past 12 months is 0%, 0%, 0% and less than 1%. Ratings Analysts’ ratings are largely (but not always) determined by our “private market value,” or PMV methodology. Our basic goal is to understand in absolute terms what a rational, strategic buyer would pay for an asset in an open, arms-length transaction. At the same time, analysts also look for underlying catalysts that could encourage those private market values to surface. A Buy rated stock is one that in our view is trading at a meaningful discount to our estimated PMV. We could expect a more modest private market value to increase at an accelerated pace, the discount of the public stock price to PMV to narrow through the emergence of a catalyst, or some combination of the two to occur. A Hold is a stock that may be trading at or near our estimated private market value. We may not anticipate a large increase in the PMV, or see some other factors at work. A Sell is a stock that may be trading at or above our estimated PMV. There may be little upside to the value, or limited opportunity to realize the value. Economic or sector risk could also be increasing. We prepared this report as a matter of general information. We do not intend for this report to be a complete description of any security or company and it is not an offer or solicitation to buy or sell any security. All facts and statistics are from sources we believe to be reliable, but we do not guarantee their accuracy. We do not undertake to advise you of changes in our opinion or information. Unless otherwise noted, all stock prices reflect the closing price on the business day immediately prior to the date of this report. We do not use “price targets” predicting future stock performance. We do refer to “private market value” or PMV, which is the price that we believe an informed buyer would pay to acquire 100% of a company. There is no assurance that there are any willing buyers of a company at this price and we do not intend to suggest that any acquisition is likely. Additional information is available on request. As of June 30, 2015, our affiliates beneficially own on behalf of their investment advisory clients or otherwise approximately 5.86% of Churchill Downs, 3.71% of Boyd Gaming and 1.14% of Pinnacle Entertainment. Because the portfolio managers at our affiliates make individual investment decisions with respect to the client accounts they manage, these accounts may have transactions inconsistent with the recommendations in this report. These portfolio managers may know the substance of our research reports prior to their publication as a result of joint participation in research meetings or otherwise. No part of my compensation was, is, or will be, directly or indirectly, related to the specific recommendations or views expressed in this research report. In addition, the undersigned lead analyst(s) has not and will not receive any compensation for providing a specific recommendation or view in this report. The analyst, who wrote this report, or members of his household, owns no shares of the above mentioned companies.

Gabelli & Company
25
Churchill Downs Inc. (CHDN - $129.95 - NASDAQ) Holding a Winning Hand - Buy
Year EPS P/E PMV 2017P $6.70 19.4x $195 Dividend: $1.00 Current Return: 0.8% 2016P 5.90 22.0 165 Shares O/S: 17.58 million 2015E 5.00 26.0 147 52-Week Range: $130.49 - $85.65 2014A 3.75 34.6 --
COMPANY OVERVIEW Louisville, KY-based Churchill Downs Inc.’s operations consist of two stand-alone race tracks, Churchill Downs Racetrack in Louisville, KY and Arlington Park Racecourse in Arlington Heights, IL; two racino properties, Calder Race Course in Miami Gardens, FL and Fair Grounds Race Course in New Orleans, LA; three stand-alone casinos, Harlow’s Casino in Greenville, Mississippi, Riverwalk Casino Hotel in Vicksburg, Mississippi, and Oxford Casino in Oxford, Maine; a pari-mutuel wagering website, TwinSpires; and a casual gaming company, Big Fish Games. The company also owns a 50% stake in Miami Valley Gaming, a racino in Lebanon, Ohio. We expect the company to generate 2015 revenue, EBITDA and EPS of $1.2 billion, $300 million and $5.00, respectively.
Summary and Opinion
We are initiating coverage on Churchill Downs with a Buy recommendation:
Churchill’s assets are under-appreciated as the company’s other loss-making racetrack assets dilute the high-quality cash flow of the Kentucky Derby. Around 75% of the Kentucky Derby’s EBITDA comes from sources with high visibility and pricing power such as TV licenses, sponsorship agreements, and contracted premium seating.
Big Fish is a growing business (1Q’15 bookings up 40%) with a sticky social casino product that can eventually be used to cross-market with CHDN’s casino properties. Management will not move to glean cost synergies until later this year, so healthy segment margins of ~22% could see upside in 2016.
Potential upside in shares from multiple sources: o Slots addition at Arlington Park provides $6-28 of upside to shares if Illinois gaming expansion bill is passed. o Slots addition at Churchill Downs provides $12-15 of upside to shares if Kentucky legalizes.
While too small to convert to a REIT, Churchill is an attractive candidate for a merger with another regional gaming company with the intention to gain scale, before spinning-off real estate assets into a REIT. We estimate that a merger and split with Buy-rated Boyd could create a proforma value of $225 per share and that a similar transaction with Buy-rated Isle of Capri could create a proforma value of $200 per share.
We project 2016 EBITDA of $330 million and a PMV of $165 per share. Given the upside potential of a REIT conversion and the fact that the stock is trading at a 21% discount to our 2016P PMV of $165 per share, we recommend buying the shares. Shares currently trade at 9.9x and 9.0x our 2015 and 2016 EBITDA, respectively.
Table 1 Churchill Downs Projections ($ in millions, except per share data) 2012A – 2019P
Source: Company Reports, Gabelli & Company estimates
FYE 12/31 2012A 2013A 2014A 2015E 2016P 2017P 2018P 2019P
Churchill Down $732 $780 $799 $790 $810 $820 $830 $840Big Fish 14 390 460 530 590 660Total Revenue 732 780 813 1,180 1,270 1,350 1,420 1,500% Growth 5% 6% 4% 45% 8% 6% 5% 6%
Churchill Down $151 $174 $198 $210 $217 $222 $227 $232Big Fish 4 85 110 130 155 180Total EBITDA 151 174 202 300 330 350 380 410% Margin 20.7% 22.4% 24.8% 25.4% 26.0% 25.9% 26.8% 27.3%% Growth 7% 15% 16% 49% 10% 6% 9% 8%
Earnings Per Share $3.17 $3.52 $3.75 $5.00 $5.90 $6.70 $7.50 $8.40% Growth 19% 11% 7% 33% 18% 14% 12% 12%
Maintinance Capex 17 15 20 30 30 30 35 35
EBITDA Multiple 19.6x 17.0x 14.7x 9.9x 9.0x 8.5x 7.8x 7.2xP/E Multiple 41.0 36.9 34.6 26.0 22.0 19.4 17.3 15.5
G.research, Inc. One Corporate Center Rye, NY 10580-1422 Tel (914) 921-5591 www.gabelli.com
July 14, 2015
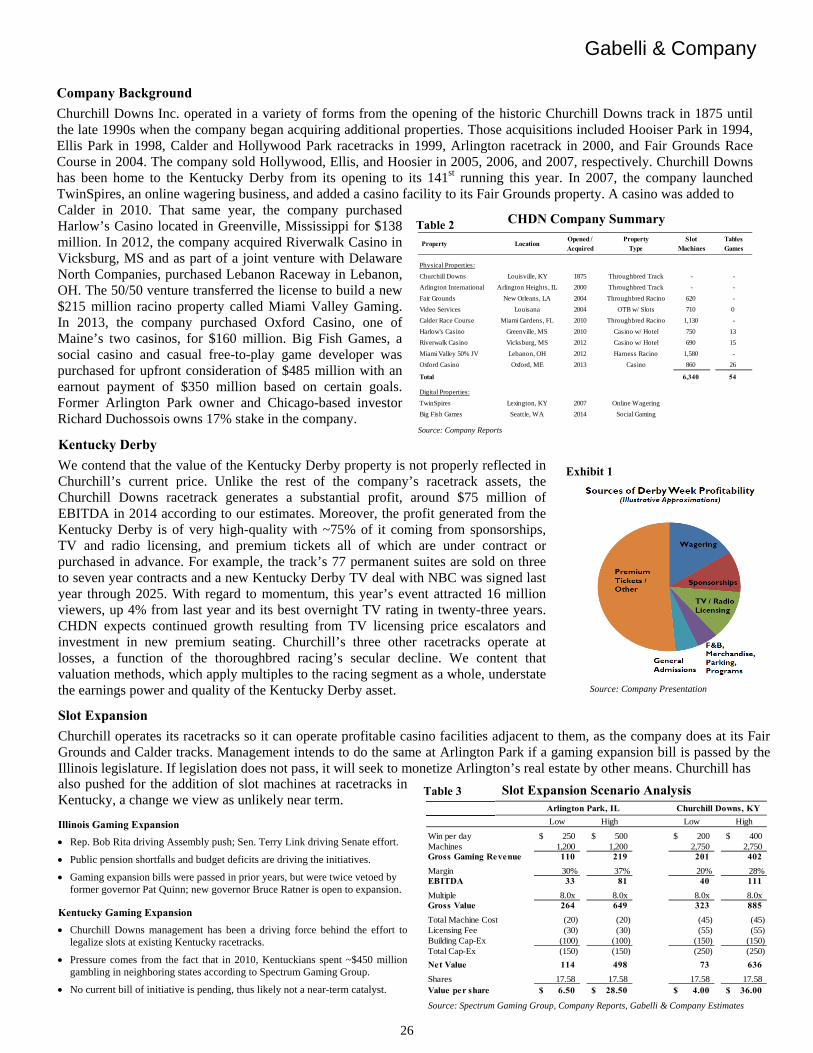
Gabelli & Company
26
Company Background
Churchill Downs Inc. operated in a variety of forms from the opening of the historic Churchill Downs track in 1875 until the late 1990s when the company began acquiring additional properties. Those acquisitions included Hooiser Park in 1994, Ellis Park in 1998, Calder and Hollywood Park racetracks in 1999, Arlington racetrack in 2000, and Fair Grounds Race Course in 2004. The company sold Hollywood, Ellis, and Hoosier in 2005, 2006, and 2007, respectively. Churchill Downs has been home to the Kentucky Derby from its opening to its 141st running this year. In 2007, the company launched TwinSpires, an online wagering business, and added a casino facility to its Fair Grounds property. A casino was added to
Kentucky Derby
We contend that the value of the Kentucky Derby property is not properly reflected in Churchill’s current price. Unlike the rest of the company’s racetrack assets, the Churchill Downs racetrack generates a substantial profit, around $75 million of EBITDA in 2014 according to our estimates. Moreover, the profit generated from the Kentucky Derby is of very high-quality with ~75% of it coming from sponsorships, TV and radio licensing, and premium tickets all of which are under contract or purchased in advance. For example, the track’s 77 permanent suites are sold on three to seven year contracts and a new Kentucky Derby TV deal with NBC was signed last year through 2025. With regard to momentum, this year’s event attracted 16 million viewers, up 4% from last year and its best overnight TV rating in twenty-three years. CHDN expects continued growth resulting from TV licensing price escalators and investment in new premium seating. Churchill’s three other racetracks operate at losses, a function of the thoroughbred racing’s secular decline. We content that valuation methods, which apply multiples to the racing segment as a whole, understate the earnings power and quality of the Kentucky Derby asset.
Source: Company Presentation
Slot Expansion
Churchill operates its racetracks so it can operate profitable casino facilities adjacent to them, as the company does at its Fair Grounds and Calder tracks. Management intends to do the same at Arlington Park if a gaming expansion bill is passed by the Illinois legislature. If legislation does not pass, it will seek to monetize Arlington’s real estate by other means. Churchill has also pushed for the addition of slot machines at racetracks in Kentucky, a change we view as unlikely near term. Illinois Gaming Expansion
Rep. Bob Rita driving Assembly push; Sen. Terry Link driving Senate effort.
Public pension shortfalls and budget deficits are driving the initiatives.
Gaming expansion bills were passed in prior years, but were twice vetoed by former governor Pat Quinn; new governor Bruce Ratner is open to expansion.
Kentucky Gaming Expansion
Churchill Downs management has been a driving force behind the effort to legalize slots at existing Kentucky racetracks.
Pressure comes from the fact that in 2010, Kentuckians spent ~$450 million gambling in neighboring states according to Spectrum Gaming Group.
No current bill of initiative is pending, thus likely not a near-term catalyst.
Slot Expansion Scenario Analysis
Source: Spectrum Gaming Group, Company Reports, Gabelli & Company Estimates
Low High Low High
Win per day 250$ 500$ 200$ 400$ Machines 1,200 1,200 2,750 2,750 Gross Gaming Revenue 110 219 201 402
Margin 30% 37% 20% 28%EBITDA 33 81 40 111
Multiple 8.0x 8.0x 8.0x 8.0x Gross Value 264 649 323 885
Total Machine Cost (20) (20) (45) (45) Licensing Fee (30) (30) (55) (55) Building Cap-Ex (100) (100) (150) (150) Total Cap-Ex (150) (150) (250) (250)
Net Value 114 498 73 636
Shares 17.58 17.58 17.58 17.58 Value per share 6.50$ 28.50$ 4.00$ 36.00$
Arlington Park, IL Churchill Downs, KY
CHDN Company Summary
Source: Company Reports
Opened / Property Slot TablesAcquired Type Machines Games
Physical Properties:
Churchill Downs Louisville, KY 1875 Throughbred Track - -
Arlington International Arlington Heights, IL 2000 Throughbred Track - -
Fair Grounds New Orleans, LA 2004 Throughbred Racino 620 -
Video Services Louisana 2004 OTB w/ Slots 710 0
Calder Race Course Miami Gardens, FL 2010 Throughbred Racino 1,130 -
Harlow's Casino Greenville, MS 2010 Casino w/ Hotel 750 13
Riverwalk Casino Vicksburg, MS 2012 Casino w/ Hotel 690 15
Miami Valley 50% JV Lebanon, OH 2012 Harness Racino 1,580 -
Oxford Casino Oxford, ME 2013 Casino 860 26
Total 6,340 54
Digital Properties:
TwinSpires Lexington, KY 2007 Online Wagering
Big Fish Games Seattle, WA 2014 Social Gaming
Property Location
Calder in 2010. That same year, the company purchased Harlow’s Casino located in Greenville, Mississippi for $138 million. In 2012, the company acquired Riverwalk Casino in Vicksburg, MS and as part of a joint venture with Delaware North Companies, purchased Lebanon Raceway in Lebanon, OH. The 50/50 venture transferred the license to build a new $215 million racino property called Miami Valley Gaming. In 2013, the company purchased Oxford Casino, one of Maine’s two casinos, for $160 million. Big Fish Games, a social casino and casual free-to-play game developer was purchased for upfront consideration of $485 million with an earnout payment of $350 million based on certain goals. Former Arlington Park owner and Chicago-based investor Richard Duchossois owns 17% stake in the company.
Table 3
Table 2
Exhibit 1
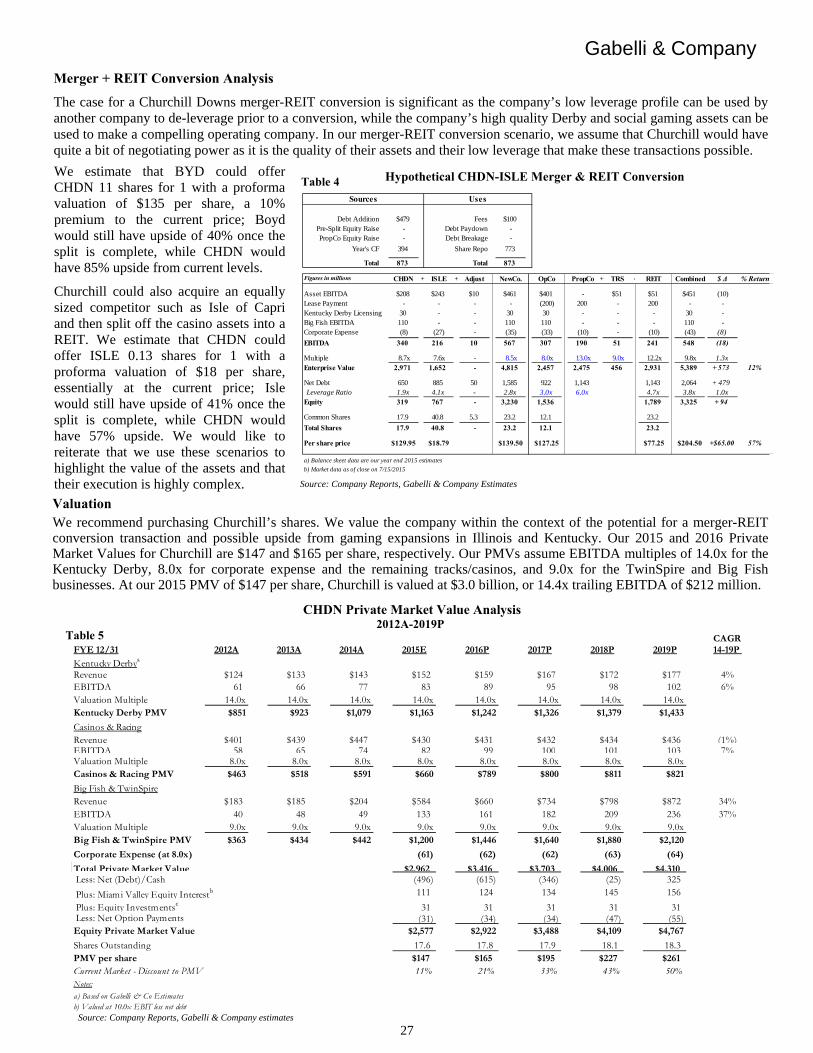
Gabelli & Company
27
Hypothetical CHDN-ISLE Merger & REIT Conversion
Source: Company Reports, Gabelli & Company Estimates
Debt Addition $479 Fees $100Pre-Split Equity Raise - Debt Paydown -PropCo Equity Raise - Debt Breakage -
Year's CF 394 Share Repo 773
Total 873 Total 873
Figures in millions CHDN + ISLE + Adjust NewCo. OpCo PropCo + TRS = REIT Combined $ Δ % Return
Asset EBITDA $208 $243 $10 $461 $401 - $51 $51 $451 (10)Lease Payment - - - - (200) 200 - 200 - -Kentucky Derby Licensing 30 - - 30 30 - - - 30 -Big Fish EBITDA 110 - - 110 110 - - - 110 -Corporate Expense (8) (27) - (35) (33) (10) - (10) (43) (8)
EBITDA 340 216 10 567 307 190 51 241 548 (18)
Multiple 8.7x 7.6x - 8.5x 8.0x 13.0x 9.0x 12.2x 9.8x 1.3xEnterprise Value 2,971 1,652 - 4,815 2,457 2,475 456 2,931 5,389 + 573 12%
Net Debt 650 885 50 1,585 922 1,143 1,143 2,064 + 479Leverage Ratio 1.9x 4.1x - 2.8x 3.0x 6.0x 4.7x 3.8x 1.0x
Equity 319 767 - 3,230 1,536 1,789 3,325 + 94
Common Shares 17.9 40.8 5.3 23.2 12.1 23.2
Total Shares 17.9 40.8 - 23.2 12.1 23.2
Per share price $129.95 $18.79 $139.50 $127.25 $77.25 $204.50 +$65.00 57%
a) Balance sheet data are our year end 2015 estimates
b) Market data as of close on 7/15/2015
Sources Uses
Merger + REIT Conversion Analysis
The case for a Churchill Downs merger-REIT conversion is significant as the company’s low leverage profile can be used by another company to de-leverage prior to a conversion, while the company’s high quality Derby and social gaming assets can be used to make a compelling operating company. In our merger-REIT conversion scenario, we assume that Churchill would have quite a bit of negotiating power as it is the quality of their assets and their low leverage that make these transactions possible.
Valuation
We recommend purchasing Churchill’s shares. We value the company within the context of the potential for a merger-REIT conversion transaction and possible upside from gaming expansions in Illinois and Kentucky. Our 2015 and 2016 Private Market Values for Churchill are $147 and $165 per share, respectively. Our PMVs assume EBITDA multiples of 14.0x for the Kentucky Derby, 8.0x for corporate expense and the remaining tracks/casinos, and 9.0x for the TwinSpire and Big Fish businesses. At our 2015 PMV of $147 per share, Churchill is valued at $3.0 billion, or 14.4x trailing EBITDA of $212 million.
CHDN Private Market Value Analysis 2012A-2019P
Source: Company Reports, Gabelli & Company estimates
CAGRFYE 12/31 2012A 2013A 2014A 2015E 2016P 2017P 2018P 2019P 14-19P
Kentucky Derbya
Revenue $124 $133 $143 $152 $159 $167 $172 $177 4%EBITDA 61 66 77 83 89 95 98 102 6%Valuation Multiple 14.0x 14.0x 14.0x 14.0x 14.0x 14.0x 14.0x 14.0xKentucky Derby PMV $851 $923 $1,079 $1,163 $1,242 $1,326 $1,379 $1,433
Casinos & RacingRevenue $401 $439 $447 $430 $431 $432 $434 $436 (1%)EBITDA 58 65 74 82 99 100 101 103 7%Valuation Multiple 8.0x 8.0x 8.0x 8.0x 8.0x 8.0x 8.0x 8.0xCasinos & Racing PMV $463 $518 $591 $660 $789 $800 $811 $821
Big Fish & TwinSpireRevenue $183 $185 $204 $584 $660 $734 $798 $872 34%EBITDA 40 48 49 133 161 182 209 236 37%Valuation Multiple 9.0x 9.0x 9.0x 9.0x 9.0x 9.0x 9.0x 9.0xBig Fish & TwinSpire PMV $363 $434 $442 $1,200 $1,446 $1,640 $1,880 $2,120
Corporate Expense (at 8.0x) (61) (62) (62) (63) (64)
Total Private Market Value $2,962 $3,416 $3,703 $4,006 $4,310 Less: Net (Debt)/Cash (496) (615) (346) (25) 325
Plus: Miami Valley Equity Interestb 111 124 134 145 156
Plus: Equity Investmentsc 31 31 31 31 31 Less: Net Option Payments (31) (34) (34) (47) (55) Equity Private Market Value $2,577 $2,922 $3,488 $4,109 $4,767
Shares Outstanding 17.6 17.8 17.9 18.1 18.3 PMV per share $147 $165 $195 $227 $261Current Market - Discount to PMV 11% 21% 33% 43% 50%Notes:
a) Based on Gabelli & Co Estimates b) Valued at 10.0x EBIT less net debt
We estimate that BYD could offer CHDN 11 shares for 1 with a proforma valuation of $135 per share, a 10% premium to the current price; Boyd would still have upside of 40% once the split is complete, while CHDN would have 85% upside from current levels.
Churchill could also acquire an equally sized competitor such as Isle of Capri and then split off the casino assets into a REIT. We estimate that CHDN could offer ISLE 0.13 shares for 1 with a proforma valuation of $18 per share, essentially at the current price; Isle would still have upside of 41% once the split is complete, while CHDN would have 57% upside. We would like to reiterate that we use these scenarios to highlight the value of the assets and that their execution is highly complex.
Table 5
Table 4
Gabelli & Company
28
Other Companies Mentioned: Boyd Gaming (BYD – NYSE) Isle of Capri Casinos (ISLE – NADSDAQ)
I, Adam Trivison, the Research Analyst who prepared this report, hereby certify that the views expressed in this report accurately reflect the analyst’s personal views about the subject companies and their securities. The Research Analyst has not been, is not and will not be receiving direct or indirect compensation for expressing the specific recommendation or view in this report. Adam Trivison (914) 921-5591 Gabelli & Company 2015
Important Disclosures
ONE CORPORATE CENTER RYE, NY 10580 GABELLI & COMPANY TEL (914) 921-5130 FAX (914) 921-5098 Gabelli & Company is the marketing name for the registered broker dealer G.research, Inc., which was formerly known as Gabelli & Company, Inc. Gabelli & Company (“we” or “us”) attempts to provide timely, value-added insights into companies or industry dynamics for institutional investors. Our research reports generally contain a recommendation of “buy,” “hold,” “sell” or “non-rated.” We do not undertake to “upgrade” or “downgrade” ratings after publishing a report. We currently have reports on 587 companies, of which 45%, 37%, 3% and 14% have a recommendation of buy, hold, sell or non-rated, respectively. The percentage of companies so rated for which we provided investment banking services within the past 12 months is 0%, 0%, 0% and less than 1%. Ratings Analysts’ ratings are largely (but not always) determined by our “private market value,” or PMV methodology. Our basic goal is to understand in absolute terms what a rational, strategic buyer would pay for an asset in an open, arms-length transaction. At the same time, analysts also look for underlying catalysts that could encourage those private market values to surface. A Buy rated stock is one that in our view is trading at a meaningful discount to our estimated PMV. We could expect a more modest private market value to increase at an accelerated pace, the discount of the public stock price to PMV to narrow through the emergence of a catalyst, or some combination of the two to occur. A Hold is a stock that may be trading at or near our estimated private market value. We may not anticipate a large increase in the PMV, or see some other factors at work. A Sell is a stock that may be trading at or above our estimated PMV. There may be little upside to the value, or limited opportunity to realize the value. Economic or sector risk could also be increasing. We prepared this report as a matter of general information. We do not intend for this report to be a complete description of any security or company and it is not an offer or solicitation to buy or sell any security. All facts and statistics are from sources we believe to be reliable, but we do not guarantee their accuracy. We do not undertake to advise you of changes in our opinion or information. Unless otherwise noted, all stock prices reflect the closing price on the business day immediately prior to the date of this report. We do not use “price targets” predicting future stock performance. We do refer to “private market value” or PMV, which is the price that we believe an informed buyer would pay to acquire 100% of a company. There is no assurance that there are any willing buyers of a company at this price and we do not intend to suggest that any acquisition is likely. Additional information is available on request. As of June 30, 2015, our affiliates beneficially own on behalf of their investment advisory clients or otherwise approximately 5.86% of Churchill Downs, 3.71% of Boyd Gaming and less than 1% of Isle of Capri Casinos. Because the portfolio managers at our affiliates make individual investment decisions with respect to the client accounts they manage, these accounts may have transactions inconsistent with the recommendations in this report. These portfolio managers may know the substance of our research reports prior to their publication as a result of joint participation in research meetings or otherwise. No part of my compensation was, is, or will be, directly or indirectly, related to the specific recommendations or views expressed in this research report. In addition, the undersigned lead analyst(s) has not and will not receive any compensation for providing a specific recommendation or view in this report. The analyst, who wrote this report, or members of his household, owns no shares of the above mentioned companies.

Gabelli & Company
29
Isle of Capri Casinos Inc. (ISLE - $18.79 - NASDAQ) Slots of Potential - Buy
Year EPS P/E PMV 2017P $1.10 17.1x $28 Dividend: None Current Return: Nil 2016P 1.00 18.8 25 Shares O/S: 40.0 million 2015E 0.85 22.1 23 52-Week Range: $21.17 - $6.25 2014A 0.13 -- --
COMPANY OVERVIEW St. Louis, MO-based Isle of Capri Casinos is an owner and operator of fifteen gaming properties located in Colorado, Florida, Iowa, Louisiana, Mississippi, Missouri, and Pennsylvania. The company operates their casino assets under the Isle of Capri and Lady Luck brands. Isle of Capri’s Midwest and Gulf Coast casino assets are, or once were, riverboat casinos, while its Florida property is a harness racetrack and casino. We expect the company to generate 2015 revenue, adjusted EBITDA and EPS of $1.0 billion, $210 million and $0.85, respectively.
Summary and Opinion
We are initiating coverage on Isle of Capri with a Buy recommendation:
With a mid-to-low end customer base, Isle is well positioned to benefit from lower gas prices and rising wages.
Isle management’s efforts to improve operational performance have driven cost savings at both the operating and corporate levels. With more work to be done, we expect the company to continue to drive EBITDA growth. Management’s new attitudes regarding capital spending and operational quality may also enable the company to narrow its persistent valuation gap relative to its peers.
Management has been candid about its desire to sell the company. With little competitive risk and room to improve financial performance, we believe the company could be an acquisition target for a gaming company looking to execute a REIT conversion. We estimate that merger-REIT conversion transactions with buy-rate Boyd Gaming and Churchill Downs could generate upside for Isle shares of 37% and 40%, respectively.
While Isle’s real estate is a potential target for Gaming and Leisure Properties, Isle management has expressed concern about the size of a resulting OpCo, which would have a market cap of less than $400 million by our estimates. Although, if GLPI is able to close on its acquisition of Pinnacle’s real estate assets, it could potentially buy Isle and find an operator at a later time (as it had intended to with the Meadows’ acquisition), without tripping the 25% level of the taxable REIT subsidiary.
We project 2016 EBITDA of $215 million and PMV of $25 per share. With recognition that the company is a likely acquisition target and that the stock is currently trading at a 16% discount to our 2015 PMV, we recommend buying ISLE stock. The shares currently trade at 8.0x and 7.8x our 2015 and 2016 EBITDA estimates, respectively.
Table 1 Isle of Capri Projections ($ in millions, except per share data) 2012A – 2019P
Source: Company Reports, Gabelli & Company estimates
FYE 4/30 2012A 2013A 2014A 2015E 2016P 2017P 2018P 2019P
Revenue $923 $955 $996 $1,020 $1,030 $1,040 $1,060 $1,070% Growth (6%) 3% 4% 2% 1% 1% 2% 1%
EBITDA 176 173 200 210 215 225 230 235% Margin 19.1% 18.2% 20.1% 20.6% 20.9% 21.6% 21.7% 22.0%% Growth (12%) (1%) 15% 5% 2% 5% 2% 2%
Earnings Per Share $0.23 ($0.06) $0.42 $0.85 $1.00 $1.10 $1.20 $1.30% Growth NA NA NA NA 18% 10% 9% 8%
Maintinance Capex 38 47 38 90 60 40 40 40
EBITDA Multiple 9.5x 9.7x 8.4x 8.0x 7.8x 7.4x 7.3x 7.1xP/E Multiple NA NA NA 22.1 18.8 17.1 15.7 14.5
G.research, Inc. One Corporate Center Rye, NY 10580-1422 Tel (914) 921-5591 www.gabelli.com
July 14, 2015
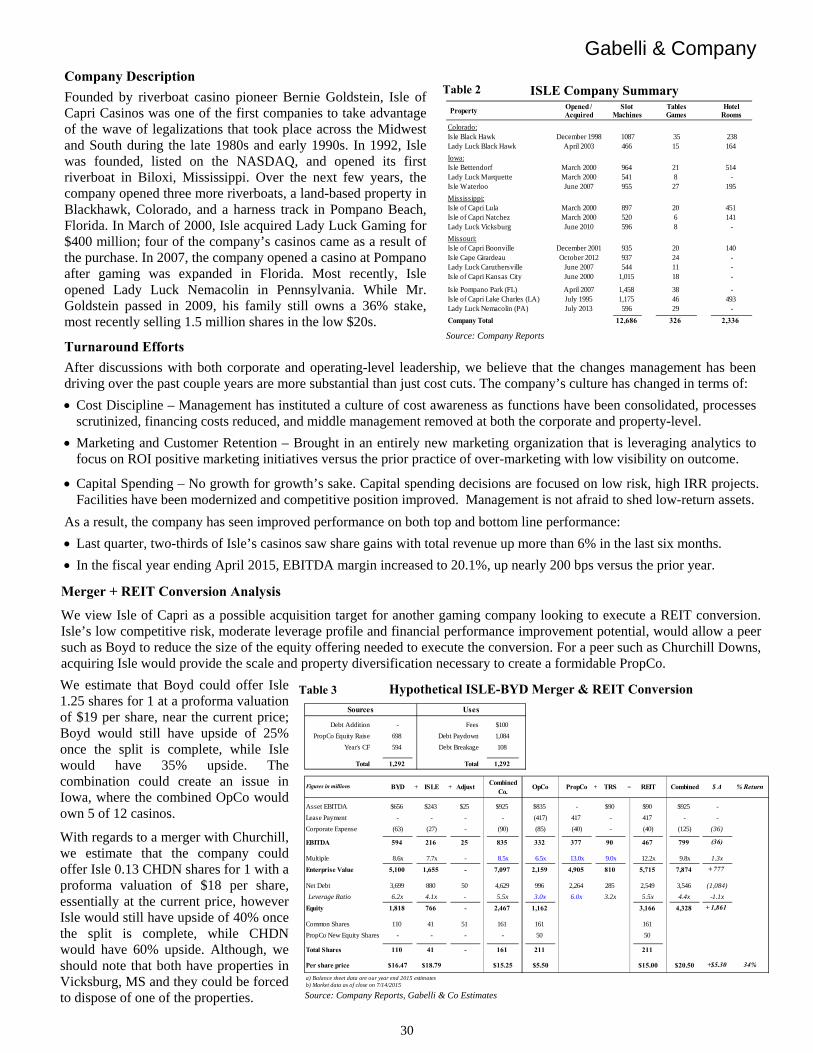
Gabelli & Company
30
Merger + REIT Conversion Analysis
We view Isle of Capri as a possible acquisition target for another gaming company looking to execute a REIT conversion. Isle’s low competitive risk, moderate leverage profile and financial performance improvement potential, would allow a peer such as Boyd to reduce the size of the equity offering needed to execute the conversion. For a peer such as Churchill Downs, acquiring Isle would provide the scale and property diversification necessary to create a formidable PropCo.
Hypothetical ISLE-BYD Merger & REIT Conversion
Source: Company Reports, Gabelli & Co Estimates
Debt Addition - Fees $100
PropCo Equity Raise 698 Debt Paydown 1,084
Year's CF 594 Debt Breakage 108
Total 1,292 Total 1,292
Figures in millions BYD + ISLE + AdjustCombined
Co.OpCo PropCo + TRS = REIT Combined $ Δ % Return
Asset EBITDA $656 $243 $25 $925 $835 - $90 $90 $925 -
Lease Payment - - - - (417) 417 - 417 - -
Corporate Expense (63) (27) - (90) (85) (40) - (40) (125) (36)
EBITDA 594 216 25 835 332 377 90 467 799 (36)
Multiple 8.6x 7.7x - 8.5x 6.5x 13.0x 9.0x 12.2x 9.8x 1.3x
Enterprise Value 5,100 1,655 - 7,097 2,159 4,905 810 5,715 7,874 + 777
Net Debt 3,699 880 50 4,629 996 2,264 285 2,549 3,546 (1,084)
Leverage Ratio 6.2x 4.1x - 5.5x 3.0x 6.0x 3.2x 5.5x 4.4x -1.1x
Equity 1,818 766 - 2,467 1,162 3,166 4,328 + 1,861
Common Shares 110 41 51 161 161 161
PropCo New Equity Shares - - - - 50 50
Total Shares 110 41 - 161 211 211
Per share price $16.47 $18.79 $15.25 $5.50 $15.00 $20.50 +$5.30 34%
a) Balance sheet data are our year end 2015 estimatesb) Market data as of close on 7/14/2015
Sources Uses
ISLE Company Summary
Source: Company Reports
Opened / Slot Tables HotelAcquired Machines Games Rooms
Colorado:Isle Black Hawk December 1998 1087 35 238Lady Luck Black Hawk April 2003 466 15 164
Iowa:Isle Bettendorf March 2000 964 21 514Lady Luck Marquette March 2000 541 8 -Isle Waterloo June 2007 955 27 195
Mississippi:Isle of Capri Lula March 2000 897 20 451Isle of Capri Natchez March 2000 520 6 141Lady Luck Vicksburg June 2010 596 8 -
Missouri:Isle of Capri Boonville December 2001 935 20 140Isle Cape Girardeau October 2012 937 24 -Lady Luck Caruthersville June 2007 544 11 -Isle of Capri Kansas City June 2000 1,015 18 -
Isle Pompano Park (FL) April 2007 1,458 38 -Isle of Capri Lake Charles (LA) July 1995 1,175 46 493Lady Luck Nemacolin (PA) July 2013 596 29 -
Company Total 12,686 326 2,336
Property
Company Description
Founded by riverboat casino pioneer Bernie Goldstein, Isle of Capri Casinos was one of the first companies to take advantage of the wave of legalizations that took place across the Midwest and South during the late 1980s and early 1990s. In 1992, Isle was founded, listed on the NASDAQ, and opened its first riverboat in Biloxi, Mississippi. Over the next few years, the company opened three more riverboats, a land-based property in Blackhawk, Colorado, and a harness track in Pompano Beach, Florida. In March of 2000, Isle acquired Lady Luck Gaming for $400 million; four of the company’s casinos came as a result of the purchase. In 2007, the company opened a casino at Pompano after gaming was expanded in Florida. Most recently, Isle opened Lady Luck Nemacolin in Pennsylvania. While Mr. Goldstein passed in 2009, his family still owns a 36% stake, most recently selling 1.5 million shares in the low $20s.
Turnaround Efforts
After discussions with both corporate and operating-level leadership, we believe that the changes management has been driving over the past couple years are more substantial than just cost cuts. The company’s culture has changed in terms of:
Cost Discipline – Management has instituted a culture of cost awareness as functions have been consolidated, processes scrutinized, financing costs reduced, and middle management removed at both the corporate and property-level.
Marketing and Customer Retention – Brought in an entirely new marketing organization that is leveraging analytics to focus on ROI positive marketing initiatives versus the prior practice of over-marketing with low visibility on outcome.
Capital Spending – No growth for growth’s sake. Capital spending decisions are focused on low risk, high IRR projects. Facilities have been modernized and competitive position improved. Management is not afraid to shed low-return assets.
As a result, the company has seen improved performance on both top and bottom line performance:
Last quarter, two-thirds of Isle’s casinos saw share gains with total revenue up more than 6% in the last six months.
In the fiscal year ending April 2015, EBITDA margin increased to 20.1%, up nearly 200 bps versus the prior year.
We estimate that Boyd could offer Isle 1.25 shares for 1 at a proforma valuation of $19 per share, near the current price; Boyd would still have upside of 25% once the split is complete, while Isle would have 35% upside. The combination could create an issue in Iowa, where the combined OpCo would own 5 of 12 casinos.
With regards to a merger with Churchill, we estimate that the company could offer Isle 0.13 CHDN shares for 1 with a proforma valuation of $18 per share, essentially at the current price, however Isle would still have upside of 40% once the split is complete, while CHDN would have 60% upside. Although, we should note that both have properties in Vicksburg, MS and they could be forced to dispose of one of the properties.
Table 2
Table 3
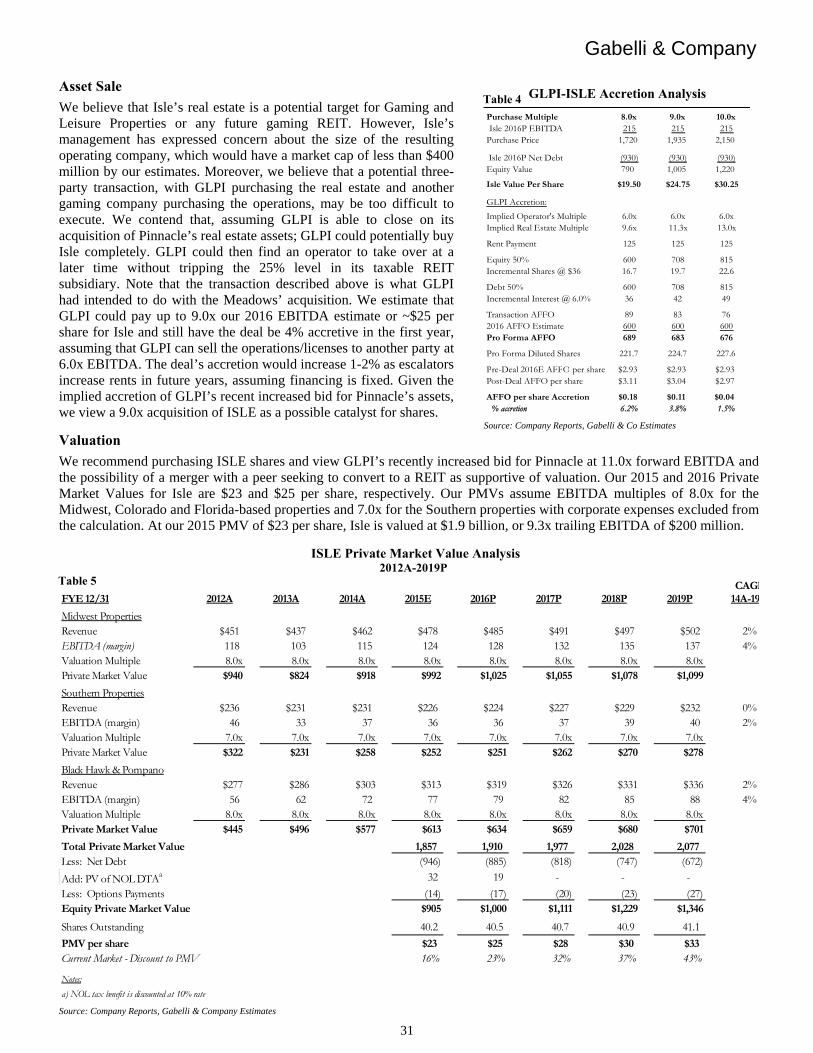
Gabelli & Company
31
Asset Sale
We believe that Isle’s real estate is a potential target for Gaming and Leisure Properties or any future gaming REIT. However, Isle’s management has expressed concern about the size of the resulting operating company, which would have a market cap of less than $400 million by our estimates. Moreover, we believe that a potential three-party transaction, with GLPI purchasing the real estate and another gaming company purchasing the operations, may be too difficult to execute. We contend that, assuming GLPI is able to close on its acquisition of Pinnacle’s real estate assets; GLPI could potentially buy Isle completely. GLPI could then find an operator to take over at a later time without tripping the 25% level in its taxable REIT subsidiary. Note that the transaction described above is what GLPI had intended to do with the Meadows’ acquisition. We estimate that GLPI could pay up to 9.0x our 2016 EBITDA estimate or ~$25 per share for Isle and still have the deal be 4% accretive in the first year, assuming that GLPI can sell the operations/licenses to another party at 6.0x EBITDA. The deal’s accretion would increase 1-2% as escalators increase rents in future years, assuming financing is fixed. Given the implied accretion of GLPI’s recent increased bid for Pinnacle’s assets, we view a 9.0x acquisition of ISLE as a possible catalyst for shares.
Valuation
We recommend purchasing ISLE shares and view GLPI’s recently increased bid for Pinnacle at 11.0x forward EBITDA and the possibility of a merger with a peer seeking to convert to a REIT as supportive of valuation. Our 2015 and 2016 Private Market Values for Isle are $23 and $25 per share, respectively. Our PMVs assume EBITDA multiples of 8.0x for the Midwest, Colorado and Florida-based properties and 7.0x for the Southern properties with corporate expenses excluded from the calculation. At our 2015 PMV of $23 per share, Isle is valued at $1.9 billion, or 9.3x trailing EBITDA of $200 million.
ISLE Private Market Value Analysis 2012A-2019P
Source: Company Reports, Gabelli & Company Estimates
CAGRFYE 12/31 2012A 2013A 2014A 2015E 2016P 2017P 2018P 2019P 14A-19
Midwest PropertiesRevenue $451 $437 $462 $478 $485 $491 $497 $502 2%EBITDA (margin) 118 103 115 124 128 132 135 137 4%Valuation Multiple 8.0x 8.0x 8.0x 8.0x 8.0x 8.0x 8.0x 8.0xPrivate Market Value $940 $824 $918 $992 $1,025 $1,055 $1,078 $1,099
Southern PropertiesRevenue $236 $231 $231 $226 $224 $227 $229 $232 0%EBITDA (margin) 46 33 37 36 36 37 39 40 2%Valuation Multiple 7.0x 7.0x 7.0x 7.0x 7.0x 7.0x 7.0x 7.0xPrivate Market Value $322 $231 $258 $252 $251 $262 $270 $278
Black Hawk & PompanoRevenue $277 $286 $303 $313 $319 $326 $331 $336 2%EBITDA (margin) 56 62 72 77 79 82 85 88 4%Valuation Multiple 8.0x 8.0x 8.0x 8.0x 8.0x 8.0x 8.0x 8.0xPrivate Market Value $445 $496 $577 $613 $634 $659 $680 $701
Total Private Market Value 1,857 1,910 1,977 2,028 2,077Less: Net Debt (946) (885) (818) (747) (672)
Add: PV of NOL DTAa 32 19 - - -
Less: Options Payments (14) (17) (20) (23) (27) Equity Private Market Value $905 $1,000 $1,111 $1,229 $1,346
Shares Outstanding 40.2 40.5 40.7 40.9 41.1
PMV per share $23 $25 $28 $30 $33Current Market - Discount to PMV 16% 23% 32% 37% 43%
Notes:
a) NOL tax benefit is discounted at 10% rate
GLPI-ISLE Accretion Analysis
Source: Company Reports, Gabelli & Co Estimates
Purchase Multiple 8.0x 9.0x 10.0xIsle 2016P EBITDA 215 215 215
Purchase Price 1,720 1,935 2,150
Isle 2016P Net Debt (930) (930) (930)Equity Value 790 1,005 1,220
Isle Value Per Share $19.50 $24.75 $30.25
GLPI Accretion:
Implied Operator's Multiple 6.0x 6.0x 6.0xImplied Real Estate Multiple 9.6x 11.3x 13.0x
Rent Payment 125 125 125
Equity 50% 600 708 815Incremental Shares @ $36 16.7 19.7 22.6
Debt 50% 600 708 815Incremental Interest @ 6.0% 36 42 49
Transaction AFFO 89 83 762016 AFFO Estimate 600 600 600Pro Forma AFFO 689 683 676
Pro Forma Diluted Shares 221.7 224.7 227.6
Pre-Deal 2016E AFFO per share $2.93 $2.93 $2.93Post-Deal AFFO per share $3.11 $3.04 $2.97
AFFO per share Accretion $0.18 $0.11 $0.04 % accretion 6.2% 3.8% 1.5%
Table 4
Table 5
Gabelli & Company
32
Other Companies Mentioned: Boyd Gaming (BYD – NASDAQ) Churchill Downs (CHDN – " ) Pinnacle Entertainment (PNK – NYSE)
I, Adam Trivison, the Research Analyst who prepared this report, hereby certify that the views expressed in this report accurately reflect the analyst’s personal views about the subject companies and their securities. The Research Analyst has not been, is not and will not be receiving direct or indirect compensation for expressing the specific recommendation or view in this report. Adam Trivison (914) 921-5591 Gabelli & Company 2015
Important Disclosures
ONE CORPORATE CENTER RYE, NY 10580 GABELLI & COMPANY TEL (914) 921-5130 FAX (914) 921-5098 Gabelli & Company is the marketing name for the registered broker dealer G.research, Inc., which was formerly known as Gabelli & Company, Inc. Gabelli & Company (“we” or “us”) attempts to provide timely, value-added insights into companies or industry dynamics for institutional investors. Our research reports generally contain a recommendation of “buy,” “hold,” “sell” or “non-rated.” We do not undertake to “upgrade” or “downgrade” ratings after publishing a report. We currently have reports on 587 companies, of which 45%, 37%, 3% and 14% have a recommendation of buy, hold, sell or non-rated, respectively. The percentage of companies so rated for which we provided investment banking services within the past 12 months is 0%, 0%, 0% and less than 1%. Ratings Analysts’ ratings are largely (but not always) determined by our “private market value,” or PMV methodology. Our basic goal is to understand in absolute terms what a rational, strategic buyer would pay for an asset in an open, arms-length transaction. At the same time, analysts also look for underlying catalysts that could encourage those private market values to surface. A Buy rated stock is one that in our view is trading at a meaningful discount to our estimated PMV. We could expect a more modest private market value to increase at an accelerated pace, the discount of the public stock price to PMV to narrow through the emergence of a catalyst, or some combination of the two to occur. A Hold is a stock that may be trading at or near our estimated private market value. We may not anticipate a large increase in the PMV, or see some other factors at work. A Sell is a stock that may be trading at or above our estimated PMV. There may be little upside to the value, or limited opportunity to realize the value. Economic or sector risk could also be increasing. We prepared this report as a matter of general information. We do not intend for this report to be a complete description of any security or company and it is not an offer or solicitation to buy or sell any security. All facts and statistics are from sources we believe to be reliable, but we do not guarantee their accuracy. We do not undertake to advise you of changes in our opinion or information. Unless otherwise noted, all stock prices reflect the closing price on the business day immediately prior to the date of this report. We do not use “price targets” predicting future stock performance. We do refer to “private market value” or PMV, which is the price that we believe an informed buyer would pay to acquire 100% of a company. There is no assurance that there are any willing buyers of a company at this price and we do not intend to suggest that any acquisition is likely. Additional information is available on request. As of June 30, 2015, our affiliates beneficially own on behalf of their investment advisory clients or otherwise approximately 5.86% of Churchill Downs, 3.71% of Boyd Gaming, 1.14% of Pinnacle Entertainment and less than 1% of Isle of Capri Casinos. Because the portfolio managers at our affiliates make individual investment decisions with respect to the client accounts they manage, these accounts may have transactions inconsistent with the recommendations in this report. These portfolio managers may know the substance of our research reports prior to their publication as a result of joint participation in research meetings or otherwise. No part of my compensation was, is, or will be, directly or indirectly, related to the specific recommendations or views expressed in this research report. In addition, the undersigned lead analyst(s) has not and will not receive any compensation for providing a specific recommendation or view in this report. The analyst, who wrote this report, or members of his household, owns no shares of the above mentioned companies.

Gabelli & Company
33
MGM Resorts International (MGM - $18.85 - NYSE) A Good Bet - Buy
Year EPS P/E PMV 2017P $1.05 10.7x $28 Dividend: None Current Return: Nil 2016P 0.70 16.1 25 Shares O/S: 563.0 million 2015E 0.30 12.5 24 52-Week Range: $27.64 - $17.25 2014A (0.67) -- --
COMPANY OVERVIEW Las Vegas-based MGM Resorts owns and operates fifteen casino resorts including the Bellagio, MGM Grand Las Vegas, The Mirage, Mandalay Bay, Luxor, New York-New York, Monte Carlo, and Excalibur, MGM also owns MGM Grand Detroit; 51% of MGM China Holdings Limited; a 50% interest in Borgata Hotel & Casino in Atlantic City, NJ; and 50% of CityCenter, a five property complex on the Las Vegas Strip. MGM Resorts is currently developing two regional US properties, MGM National Harbor in Maryland and MGM Springfield in southwest Massachusetts. Meanwhile, MGM China is developing a second Macau-based casino, MGM Cotai. We expect the company to generate ex-Macau 2015 revenue, EBITDA and EPS of $6.5 billion, $1.35 billion and $0.30, respectively. Summary and Opinion
We are initiating coverage on MGM Resorts with a Buy recommendation:
Negative news flow from Macau has been the major force behind MGM’s poor stock price performance over the past year. While we are not willing to call the bottom in Macau, MGM Resort’s exposure to their Macau assets is small enough for us to be comfortable buying shares.
The rest of MGM’s business is levered to assets that are set to perform well over the next few years including its Las Vegas Strip properties, City Center, MGM Detroit and the Borgata in Atlantic City, which is substantially healthier after last year’s closure of four casinos.
The company’s regional developments in Maryland and Massachusetts, which are not accounted for in the next two year’s estimates, both represent significant value for shareholders. Moreover, MGM’s government relations efforts give it an advantage in potential licensing scenarios in Atlanta, Japan, and other prospective gaming regions.
While activist fund Land and Buildings’ proposal for an REIT conversion fell flat, it did force management to actively explore restructuring options. We contend that due to high leverage and the small difference between the trading multiples of Las Vegas Strip assets and triple-net REITs, a REIT conversion is tough to justify. We see the sale of non-core regional assets and joint venture ownership stakes as a better route to unlocking value.
We project 2016 EBITDA ex-joint ventures of $1.55 billion and PMV of $25 per share. Given the upside potential of asset sales and the fact that the stock is trading at a 23% discount to our 2016P PMV, we recommend buying the shares. Shares currently trade at 12.5x and 9.7x our 2015 and 2016 ex-Macau EBITDA estimates, respectively.
Table 1 MGM Resorts Projections ($ in millions, except per share data) 2012A – 2019P
*Revenue and EBITDA figures exclude MGM China Source: Company data, Gabelli & Company estimates
FYE 12/31 2012A 2013A 2014A 2015E 2016P 2017P 2018P 2019P
Revenue $5,943 $6,053 $6,342 $6,470 $7,230 $7,560 $8,000 $8,420% Growth (7%) 2% 5% 2% 12% 5% 6% 5%
EBITDA 1,091 1,248 1,314 1,350 1,550 1,740 1,890 2,020% Margin 18.4% 20.6% 20.7% 20.9% 21.4% 23.0% 23.6% 24.0%% Growth (2%) 14% 5% 3% 15% 12% 9% 7%
Earnings Per Share ($0.27) ($0.13) ($0.67) $0.30 $0.70 $1.05 $1.30 $1.55% Growth NA NA NA NA 133% 50% 24% 19%
Maintinance Capex 367 374 381 370 420 510 570 590
EBITDA Multiple 15.5x 13.5x 12.8x 12.5x 10.9x 9.7x 8.9x 8.4xP/E Multiple NA NA NA 37.5 16.1 10.7 8.6 7.2
G.research, Inc. One Corporate Center Rye, NY 10580-1422 Tel (914) 921-5591 www.gabelli.com
July 14, 2015
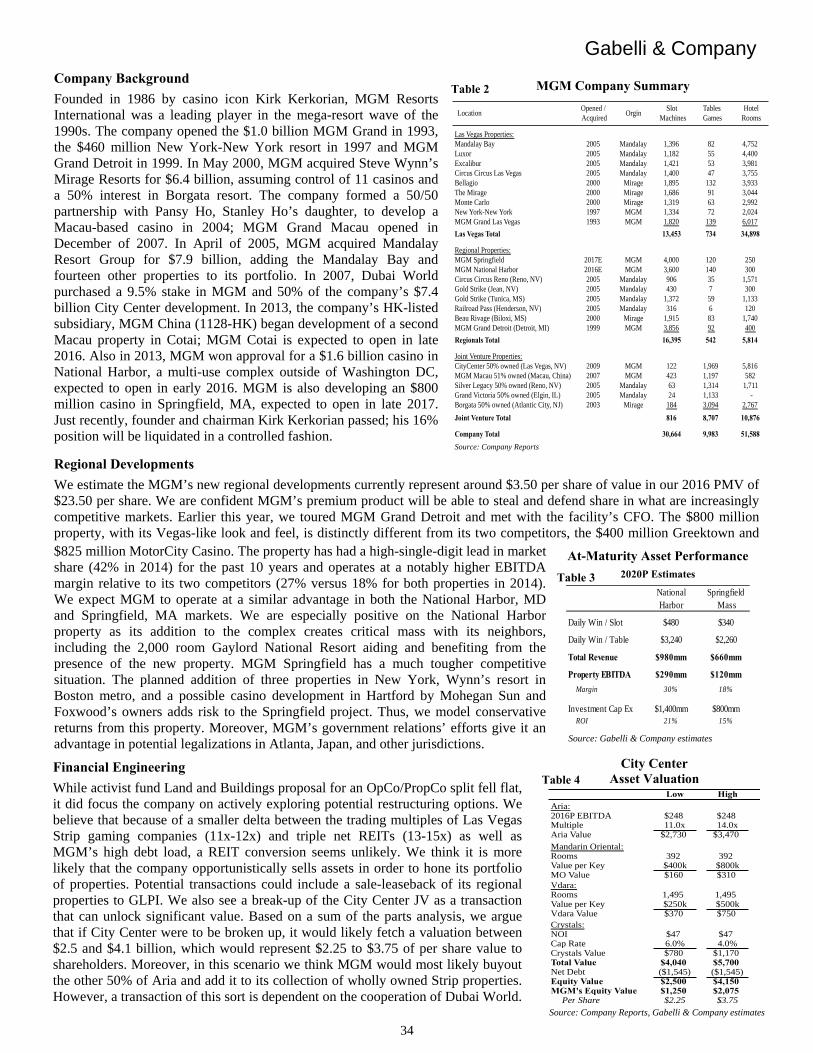
Gabelli & Company
34
Company Background
Founded in 1986 by casino icon Kirk Kerkorian, MGM Resorts International was a leading player in the mega-resort wave of the 1990s. The company opened the $1.0 billion MGM Grand in 1993, the $460 million New York-New York resort in 1997 and MGM Grand Detroit in 1999. In May 2000, MGM acquired Steve Wynn’s Mirage Resorts for $6.4 billion, assuming control of 11 casinos and a 50% interest in Borgata resort. The company formed a 50/50 partnership with Pansy Ho, Stanley Ho’s daughter, to develop a Macau-based casino in 2004; MGM Grand Macau opened in December of 2007. In April of 2005, MGM acquired Mandalay Resort Group for $7.9 billion, adding the Mandalay Bay and fourteen other properties to its portfolio. In 2007, Dubai World purchased a 9.5% stake in MGM and 50% of the company’s $7.4 billion City Center development. In 2013, the company’s HK-listed subsidiary, MGM China (1128-HK) began development of a second Macau property in Cotai; MGM Cotai is expected to open in late 2016. Also in 2013, MGM won approval for a $1.6 billion casino in National Harbor, a multi-use complex outside of Washington DC, expected to open in early 2016. MGM is also developing an $800 million casino in Springfield, MA, expected to open in late 2017. Just recently, founder and chairman Kirk Kerkorian passed; his 16% position will be liquidated in a controlled fashion.
MGM Company Summary
Source: Company Reports
Opened / Slot Tables Hotel Acquired Machines Games Rooms
Las Vegas Properties:Mandalay Bay 2005 Mandalay 1,396 82 4,752Luxor 2005 Mandalay 1,182 55 4,400Excalibur 2005 Mandalay 1,421 53 3,981Circus Circus Las Vegas 2005 Mandalay 1,400 47 3,755Bellagio 2000 Mirage 1,895 132 3,933The Mirage 2000 Mirage 1,686 91 3,044Monte Carlo 2000 Mirage 1,319 63 2,992New York-New York 1997 MGM 1,334 72 2,024MGM Grand Las Vegas 1993 MGM 1,820 139 6,017
Las Vegas Total 13,453 734 34,898
Regional Properties:MGM Springfield 2017E MGM 4,000 120 250MGM National Harbor 2016E MGM 3,600 140 300Circus Circus Reno (Reno, NV) 2005 Mandalay 906 35 1,571Gold Strike (Jean, NV) 2005 Mandalay 430 7 300Gold Strike (Tunica, MS) 2005 Mandalay 1,372 59 1,133Railroad Pass (Henderson, NV) 2005 Mandalay 316 6 120Beau Rivage (Biloxi, MS) 2000 Mirage 1,915 83 1,740MGM Grand Detroit (Detroit, MI) 1999 MGM 3,856 92 400
Regionals Total 16,395 542 5,814
Joint Venture Properties:CityCenter 50% owned (Las Vegas, NV) 2009 MGM 122 1,969 5,816MGM Macau 51% owned (Macau, China) 2007 MGM 423 1,197 582Silver Legacy 50% owned (Reno, NV) 2005 Mandalay 63 1,314 1,711Grand Victoria 50% owned (Elgin, IL) 2005 Mandalay 24 1,133 -Borgata 50% owned (Atlantic City, NJ) 2003 Mirage 184 3,094 2,767
Joint Venture Total 816 8,707 10,876
Company Total 30,664 9,983 51,588
OrginLocation
Regional Developments
We estimate the MGM’s new regional developments currently represent around $3.50 per share of value in our 2016 PMV of $23.50 per share. We are confident MGM’s premium product will be able to steal and defend share in what are increasingly competitive markets. Earlier this year, we toured MGM Grand Detroit and met with the facility’s CFO. The $800 million property, with its Vegas-like look and feel, is distinctly different from its two competitors, the $400 million Greektown and
Financial Engineering
While activist fund Land and Buildings proposal for an OpCo/PropCo split fell flat, it did focus the company on actively exploring potential restructuring options. We believe that because of a smaller delta between the trading multiples of Las Vegas Strip gaming companies (11x-12x) and triple net REITs (13-15x) as well as MGM’s high debt load, a REIT conversion seems unlikely. We think it is more likely that the company opportunistically sells assets in order to hone its portfolio of properties. Potential transactions could include a sale-leaseback of its regional properties to GLPI. We also see a break-up of the City Center JV as a transaction that can unlock significant value. Based on a sum of the parts analysis, we argue that if City Center were to be broken up, it would likely fetch a valuation between $2.5 and $4.1 billion, which would represent $2.25 to $3.75 of per share value to shareholders. Moreover, in this scenario we think MGM would most likely buyout the other 50% of Aria and add it to its collection of wholly owned Strip properties. However, a transaction of this sort is dependent on the cooperation of Dubai World.
At-Maturity Asset Performance
2020P Estimates
Source: Gabelli & Company estimates
National SpringfieldHarbor Mass
Daily Win / Slot $480 $340
Daily Win / Table $3,240 $2,260
Total Revenue $980mm $660mm
Property EBITDA $290mm $120mm
Margin 30% 18%
Investment Cap Ex $1,400mm $800mm ROI 21% 15%
$825 million MotorCity Casino. The property has had a high-single-digit lead in market share (42% in 2014) for the past 10 years and operates at a notably higher EBITDA margin relative to its two competitors (27% versus 18% for both properties in 2014). We expect MGM to operate at a similar advantage in both the National Harbor, MD and Springfield, MA markets. We are especially positive on the National Harbor property as its addition to the complex creates critical mass with its neighbors, including the 2,000 room Gaylord National Resort aiding and benefiting from the presence of the new property. MGM Springfield has a much tougher competitive situation. The planned addition of three properties in New York, Wynn’s resort in Boston metro, and a possible casino development in Hartford by Mohegan Sun and Foxwood’s owners adds risk to the Springfield project. Thus, we model conservative returns from this property. Moreover, MGM’s government relations’ efforts give it an advantage in potential legalizations in Atlanta, Japan, and other jurisdictions.
City Center
Asset Valuation
Source: Company Reports, Gabelli & Company estimates
Low High
Aria:2016P EBITDA $248 $248Multiple 11.0x 14.0xAria Value $2,730 $3,470
Mandarin Oriental:Rooms 392 392Value per Key $400k $800kMO Value $160 $310Vdara:Rooms 1,495 1,495Value per Key $250k $500kVdara Value $370 $750Crystals:NOI $47 $47Cap Rate 6.0% 4.0%Crystals Value $780 $1,170Total Value $4,040 $5,700Net Debt ($1,545) ($1,545)Equity Value $2,500 $4,150MGM's Equity Value $1,250 $2,075
Per Share $2.25 $3.75
Table 2
Table 3
Table 4

Gabelli & Company
35
Macau Exposure
MGM Resorts owns 3.8 million shares or 50% of Hong Kong-traded MGM China (2282-HK). With MGM China’s shares trading at HK$17.30, the holding represents $4.3 billion of market value, or $7.60 of MGM’s $18.88 of equity value per share. With such a large portion of the company’s market cap exposed to the value of MGM China, a valuation of MGM
Valuation
We contend that shares of MGM are very attractive at current levels. Based on our 2015 and 2016 Private Market Values for ex-Macau MGM equity of $16 and $17 per share, respectively, investors are getting the company’s MGM China holdings for free. Our PMVs assume EBITDA multiples of 12.0x for Las Vegas properties (including the company’s 50% stake in City Center), 9.0x for existing regional properties (including the company’s 50% stake in Borgata), and a 10.0x multiple on at-maturity EBITDA for the company’s projects in Maryland and Massachusetts. For the two regional developments, we assume they reach maturity in 2020. For prior periods, we discount the developments’ values at a 10% rate. At our 2015 ex-Macau PMV of $16 per share, MGM is valued at $17.2 billion, or 13.0x trailing ex-Macau EBITDA of $1.3 billion.
MGM Private Market Value Analysis 2012A-2019P
Source: Gabelli and Company Estimates
CAGRFYE 12/31 2012A 2013A 2014A 2015E 2016P 2017P 2018P 2019P 14A-19P
Las Vegas Strip PropertiesRevenues $4,744 $4,903 $5,192 $5,283 $5,386 $5,460 $5,537 $5,604 2%EBITDA 1,046 1,179 1,263 1,296 1,354 1,395 1,439 1,474 3%Valuation Multiple 11.0x 11.0x 11.0x 11.0x 11.0x 11.0x 11.0x 11.0x
Private Market Value $11,509 $12,972 $13,895 $14,253 $14,891 $15,348 $15,830 $16,210
Existing Regional US PropertiesRevenues $1,199 $1,150 $1,150 $1,189 $1,220 $1,248 $1,267 $1,279 2%EBITDA 279 263 255 277 292 303 310 315 4%Valuation Multiple 9.0x 9.0x 9.0x 9.0x 9.0x 9.0x 9.0x 9.0x
Private Market Value $2,511 $2,370 $2,296 $2,491 $2,626 $2,726 $2,786 $2,832
New Regional US PropertiesRevenues - $628 $849 $1,197 $1,537 NAEBITDA - 111 226 307 378 NAValuation Multiple - 25.6x 13.8x 11.0x 10.0x
Private Market Value $2,582 $2,840 $3,124 $3,376 $3,780
Corporate Expense (at 8.0x) (2,147) (2,167) (2,187) (2,207) (2,228)
Enterprise Private Market Value 17,179 18,191 19,011 19,785 20,595 Add: NPV of LV Arena JV Stake 82 90 99 109 120 Add: City Center Equity Value (at 12x) 1,154 1,274 1,432 1,625 1,801
Add: Borgata Equity Value (at 9x) 527 687 862 1,000 1,115 Add: Development Land & Other JVs 246 253 261 269 277 Less: Net Debt (10,801) (11,661) (11,580) (10,912) (9,964)
Less: Net Option Payments (109) (45) (80) (117) (163) Equity Private Market Value 8,894 9,613 11,222 13,216 15,532
Shares Outstanding 563 564 566 567 569 PMV Per Share $16 $17 $20 $23 $27Implied Market Discount to PMV 30% 34% 44% 52% 59%
MGM China Market Price (at market) HK$17.30 HK$17.30 HK$17.30 HK$17.30 HK$17.30Value to MGM Resorts (HK$mm) 33,527 33,527 33,527 33,527 33,527
Value to MGM Resorts (US$mm) 4,322 4,322 4,322 4,322 4,322
Per MGM Share $8 $8 $8 $8 $8
TOTAL PMV $24 $25 $28 $31 $35Current Market - Discount to PMV 20% 23% 31% 39% 46%
requires a valuation of MGM China shares. We estimate MGM China will generate $390 million of EBITDA in 2015, down 54% from 2014 EBITDA of $850 million. Currently, the stock looks expensive, trading at 18.3x our 2015 estimate. But with an expectation that China’s anti-corruption efforts begin to ease in 2016 and that the company is able to manage through a less-than-planned table allocation at MGM Cotai, we expect China to generate EBITDA of $435, $870, and $935 million in 2016, 2017, and 2018, respectively. We impute China per share value of $3, $4, $9 and $11, respectively, assigning a multiple 12.0x, in line with premium Las Vegas properties.
MGM China Valuation
Source: Gabelli and Company Estimates
(Figures in $ millions, except per share) 2015E 2016P 2017P 2018P
MGM Resorts (Ex-China):Ex-MGM China Equity PMV 8,894 9,613 11,222 13,216 Shares Outstanding 563 564 566 567 PMV Per Share 16$ 17$ 20$ 23$
MGM China:MGM Grand Macau $410 $400 $300 $340MGM Cotia - 140 870 980 MGM China EBITDA 410 540 1,170 1,320
Multiple 12.0x 12.0x 12.0x 12.0xMGM China PMV 4,920 6,480 14,040 15,840
Less: MGM China Net Debt (1,102) (2,073) (1,352) (604) MGM China Equity PMV 3,818 4,407 12,688 15,236
MGM's Equity Allocation 1,947 2,248 6,471 7,770China PMV Per MGM Share 3$ 4$ 11$ 14$
Total PMV 19$ 21$ 31$ 37$ Market Discount to PMV 3% 10% 40% 49%
Table 5
Table 6
Gabelli & Company
36
I, Adam Trivison, the Research Analyst who prepared this report, hereby certify that the views expressed in this report accurately reflect the analyst’s personal views about the subject companies and their securities. The Research Analyst has not been, is not and will not be receiving direct or indirect compensation for expressing the specific recommendation or view in this report. Adam Trivison (914) 921-5591 Gabelli & Company 2015
Important Disclosures
ONE CORPORATE CENTER RYE, NY 10580 GABELLI & COMPANY TEL (914) 921-5130 FAX (914) 921-5098 Gabelli & Company is the marketing name for the registered broker dealer G.research, Inc., which was formerly known as Gabelli & Company, Inc. Gabelli & Company (“we” or “us”) attempts to provide timely, value-added insights into companies or industry dynamics for institutional investors. Our research reports generally contain a recommendation of “buy,” “hold,” “sell” or “non-rated.” We do not undertake to “upgrade” or “downgrade” ratings after publishing a report. We currently have reports on 587 companies, of which 45%, 37%, 3% and 14% have a recommendation of buy, hold, sell or non-rated, respectively. The percentage of companies so rated for which we provided investment banking services within the past 12 months is 0%, 0%, 0% and less than 1%. Ratings Analysts’ ratings are largely (but not always) determined by our “private market value,” or PMV methodology. Our basic goal is to understand in absolute terms what a rational, strategic buyer would pay for an asset in an open, arms-length transaction. At the same time, analysts also look for underlying catalysts that could encourage those private market values to surface. A Buy rated stock is one that in our view is trading at a meaningful discount to our estimated PMV. We could expect a more modest private market value to increase at an accelerated pace, the discount of the public stock price to PMV to narrow through the emergence of a catalyst, or some combination of the two to occur. A Hold is a stock that may be trading at or near our estimated private market value. We may not anticipate a large increase in the PMV, or see some other factors at work. A Sell is a stock that may be trading at or above our estimated PMV. There may be little upside to the value, or limited opportunity to realize the value. Economic or sector risk could also be increasing. We prepared this report as a matter of general information. We do not intend for this report to be a complete description of any security or company and it is not an offer or solicitation to buy or sell any security. All facts and statistics are from sources we believe to be reliable, but we do not guarantee their accuracy. We do not undertake to advise you of changes in our opinion or information. Unless otherwise noted, all stock prices reflect the closing price on the business day immediately prior to the date of this report. We do not use “price targets” predicting future stock performance. We do refer to “private market value” or PMV, which is the price that we believe an informed buyer would pay to acquire 100% of a company. There is no assurance that there are any willing buyers of a company at this price and we do not intend to suggest that any acquisition is likely. Additional information is available on request. As of June 30, 2015, our affiliates beneficially own on behalf of their investment advisory clients or otherwise less than 1% of MGM Resorts. Because the portfolio managers at our affiliates make individual investment decisions with respect to the client accounts they manage, these accounts may have transactions inconsistent with the recommendations in this report. These portfolio managers may know the substance of our research reports prior to their publication as a result of joint participation in research meetings or otherwise. No part of my compensation was, is, or will be, directly or indirectly, related to the specific recommendations or views expressed in this research report. In addition, the undersigned lead analyst(s) has not and will not receive any compensation for providing a specific recommendation or view in this report. The analyst, who wrote this report, or members of his household, owns no shares of the above mentioned companies.