Cash to Classrooms — Where Do You Stand? Part 1: How are our schools funded?
18
1 Cash to Classrooms: Where Do You Stand? Part 1: How Are Our Schools Funded? June 10, 2013
-
Upload
deirdreconner -
Category
Education
-
view
25 -
download
0
Transcript of Cash to Classrooms — Where Do You Stand? Part 1: How are our schools funded?

1
Cash to Classrooms:Where Do You Stand?
Part 1: How Are Our Schools Funded?June 10, 2013

2
2012-2013 DCPS Budget:Overall
$1,614,405,768Total

3
2012-2013 DCPS Budget:General vs. Categorical
61%
39%General
Categorical

4
2012-2013 DCPS Budget Revenue Sources (in millions)
$218
$509
$513
$333
$540
$179
$392
$0 $200 $400 $600 $800 $1,000 $1,200 $1,400 $1,600
General Fund
Total BudgetState Local Other
Local Other
Federal
State

5
2012-2013 DCPS General Fund Revenue State Sources (49.77%)
70%
29%
1% 0%
FEFP
CSR OP
SRF
Other

6
2012-2013 DCPS General Fund Revenue Local Sources (32.61%)
93%
2% 3% 2%
Dist. School Taxes
Child Care fees
Misc. Local Sources
Other
7
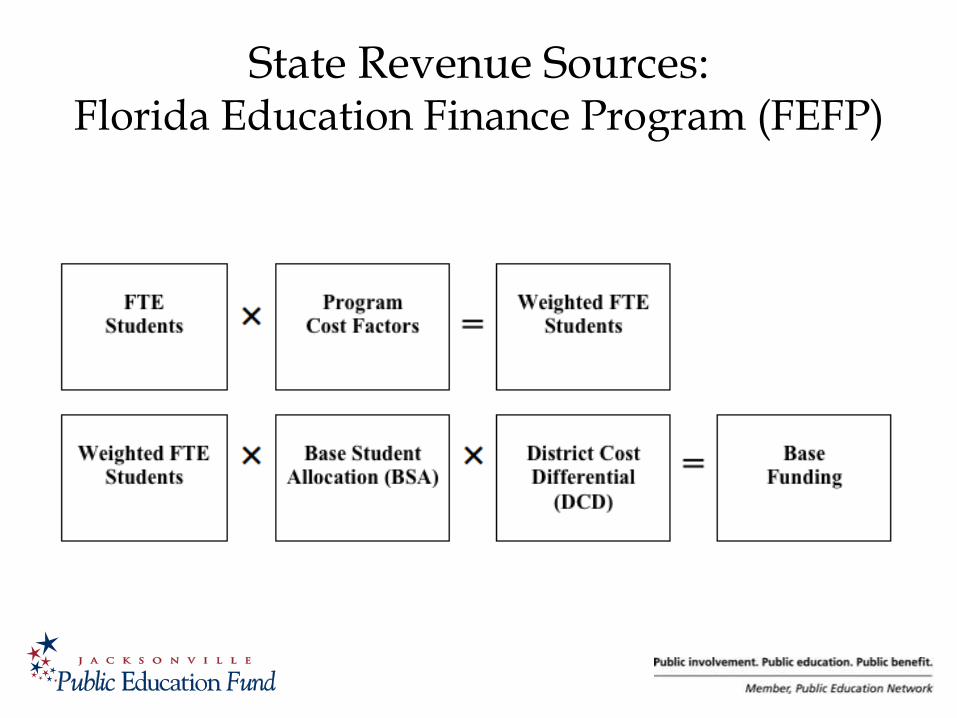
State Revenue Sources:Florida Education Finance Program (FEFP)

8
2008-2014 State Revenue InformationPer Pupil Funding
$4
,08
0
$3
,88
6
$3
,63
1
$3
,62
4
$3
,47
9
$3
,58
3
$3
,75
2
$7
,12
6
$6
,84
7
$6
,50
1
$6
,56
7
$6
,21
7
$6
,38
7
$6
,79
9
$2,000
$3,000
$4,000
$5,000
$6,000
$7,000
$8,000
2007-2008 2008-2009 2009-2010 2010-2011 2011-2012 2012-2013 2013-2014
Base Student Allocation Total Funds per FTE

9
Past 10 Years State Lottery Trust Fund Appropriations
53% 55%49%
41%46% 45% 46% 44% 43%
48%
11% 9%
9%
12%11%
8% 8% 10% 10%
13%
14% 11%13% 21% 16%
15% 14% 18% 18%
14%
22% 25% 29% 26% 27%32% 32% 28% 29% 25%
0%
10%
20%
30%
40%
50%
60%
70%
80%
90%
100%
03-04 04-05 05-06 06-07 07-08 08-09 09-10 10-11 11-12 12-13
Public Schools Community Colleges State Universities Other

10
State Lottery Trust Fund Appropriations for Public Schools
2012-2013Class Size Reduction: $104M
CSR Lottery Capital Outlay (Debt Service): $154M
Classrooms First Bond: $157M
FEFP: $123M
School Recognition & Discretionary: $135M
- School Recognition: $135M
- Discretionary: $0
2013-2014School Recognition & Discretionary: $135M
- School Recognition: $135M
- Discretionary: $0

11
Local Tax Revenue SourcesAuthority Type Used for 2012-2013
DCPS rateRoom to increase?
Max rate
StateRequired Local Effort Operations 5.2040 -- --
Prior period adjustment Operations 0.1480
Local (School Board)
Discretionary Operating Operations 0.7480 No 0.7480
Local capital improvement Capital improvements 1.5000 No 1.5000
Discretionary capital improvement Lease purchase payments/other critical fixed c.o. needs
-- Yes 0.2500
Local (Voter Ref.)
Critical operating needs Operations -- Yes* 0.2500
Critical capital outlay needs Capital improvements -- Yes* 0.2500
Additional operating Not specified -- Yes (Balance up to total 10 mills)
Additional capital improvement Not specified -- Yes (Balance up to total 10 mills)
Debt service Debt service -- Yes (Balance up to total 10 mills)
Total millage for education (2012-2013) 7.6000 Yes 10.000
Additional potential revenue
Local Sales Tax Option
-- Capital outlay/other -- Yes $0.005

12
2012-2013 DCPS General Fund Spending (in millions)
$179
$333
$509
$1
$1,022
$645
$66$61$59$48$44$28$15$56
-$100
$100
$300
$500
$700
$900
$1,100
Revenues General Fund Spending
Other (Multiple) Central Services Maintenance
Pupil Personnel Services Transportation School Administration
Instructional Support Services Operations Instruction
13
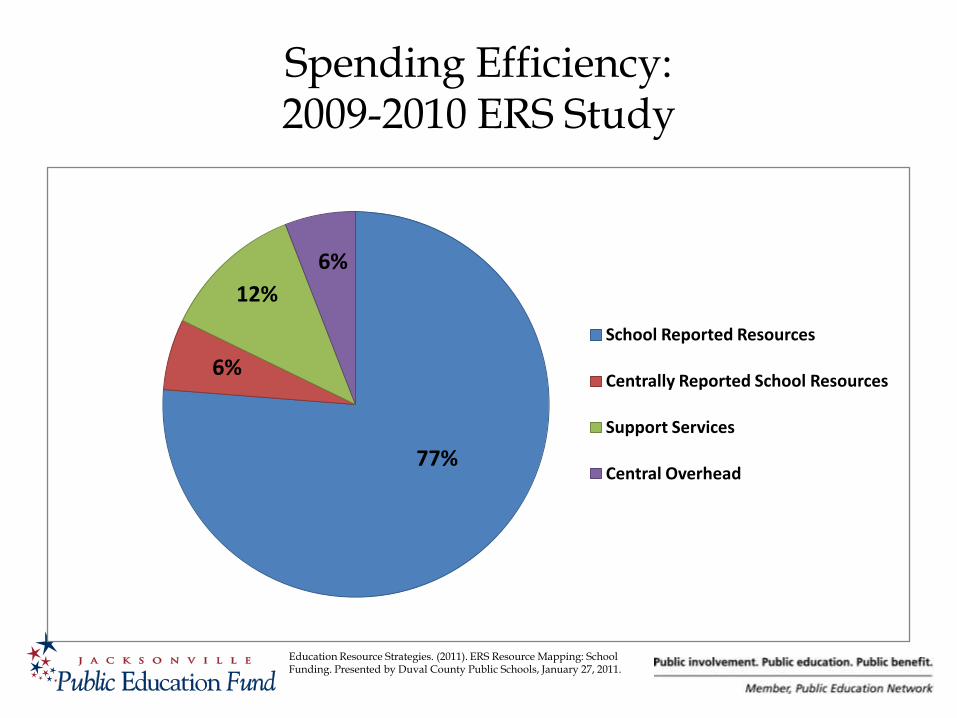
Spending Efficiency: 2009-2010 ERS Study
Education Resource Strategies. (2011). ERS Resource Mapping: School Funding. Presented by Duval County Public Schools, January 27, 2011.
77%
6%
12%
6%
School Reported Resources
Centrally Reported School Resources
Support Services
Central Overhead

14
Spending Efficiency: 2009-2010 ERS Study
Education Resource Strategies. (2011). ERS Resource Mapping: School Funding. Presented by Duval County Public Schools, January 27, 2011.
77% 77% 77%69% 66%
71%
58%
0%
10%
20%
30%
40%
50%
60%
70%
80%
% o
f ex
pe
nd
itu
res/
bu
dge
t
Cross District Comparison of the % of Resources Reported at
SCHOOL LEVEL

15
Spending Efficiency: 2009-2010 ERS Study
Education Resource Strategies. (2011). ERS Resource Mapping: School Funding. Presented by Duval County Public Schools, January 27, 2011.
8%
6%7%
6%8%
6%
12%
15%
11%10%
0%
5%
10%
15%
% o
f ex
pe
nd
itu
res/
bu
dge
t
% of K12 operating budget/expenditures spent on
CENTRAL OVERHEAD

16
Key Points from 2013-2014 State Budget
• $1.25B overall funding increase from 2012-2013
– $118M required due to increasing students
• Teacher Salary Bonus:
– $480M Statewide (Avg. $2500/teacher)
– $23M to Duval County
– NON-RECURRING
• $17M in new (non-FEFP) technology funds
• Charter School Capital Outlay: $91M
17
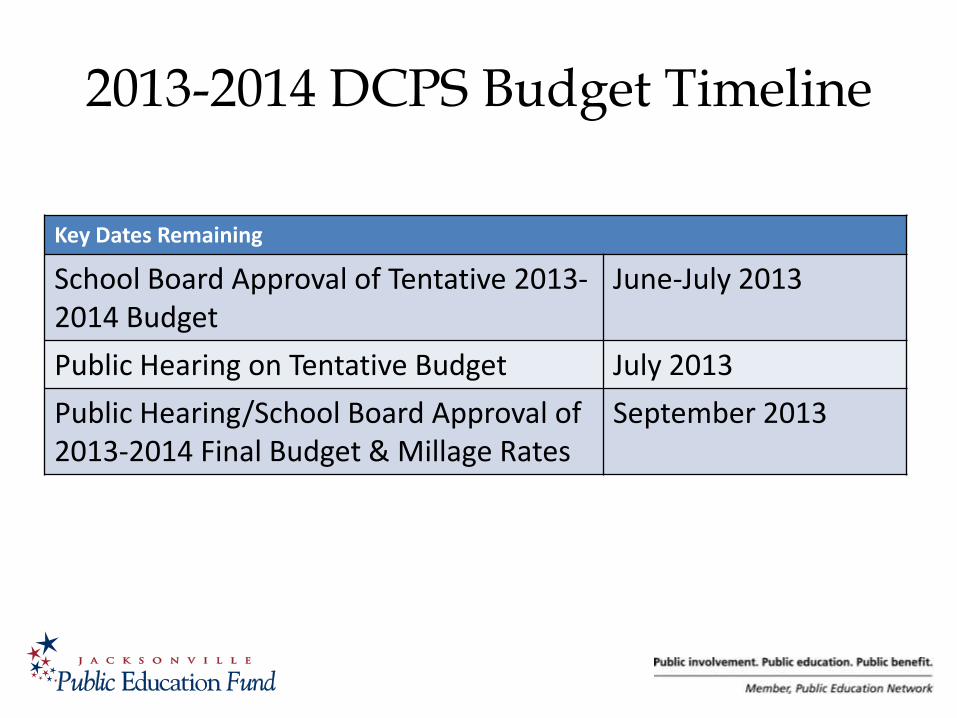
2013-2014 DCPS Budget Timeline
Key Dates Remaining
School Board Approval of Tentative 2013-2014 Budget
June-July 2013
Public Hearing on Tentative Budget July 2013
Public Hearing/School Board Approval of 2013-2014 Final Budget & Millage Rates
September 2013

18
Framing Questions
Develop Great Educators &
Leaders
Engage Parents,
Caregivers & Community
Ensure Effective,
Equitable, & Efficient Use of
Resources
Develop the Whole Child