2015 CASEL Guide: Effective Social and Emotional Learning ...
1889_03/15
MONTH YEAR
CASEL/NoVo Collaborating
Districts Initiative:
2014 Cross-District Outcome
Evaluation Report
AIR Evaluation Team
Principal Investigators
David Osher, Ph.D., Lawrence B. Friedman, Ph.D.,
Kimberly Kendziora, Ph.D.
Qualitative Team
Lisa Hoogstra, Ph.D., Manolya Tanyu, Ph.D., Mark
Garibaldi, Michelle Olivia, Andrea Boyle
Quantitative Team
Andrew Swanlund, Ph.D., Paul Bailey, Ph.D., Clare
Halloran, Matthew Burke
American Institutes for Research
MARCH 2015
Contents
Executive Summary .........................................................................................................................4
Introduction ......................................................................................................................................7
Structure of the CDI Intervention ..............................................................................................8
AIR’s Evaluation of the CDI .....................................................................................................9
Evaluation Questions .........................................................................................................10
Evaluation Designs for School and Student Outcomes .....................................................11
Methods..........................................................................................................................................14
Sample: Description of the Eight CDI Districts ......................................................................14
Evaluation Measures ................................................................................................................15
Measuring CDI: School Implementation and School and Student Outcomes ...................16
Staff SEL Survey ...............................................................................................................16
Measuring CDI Outcomes .................................................................................................18
Survey Administration .............................................................................................................19
Staff SEL Survey ...............................................................................................................19
Teacher Ratings of Students’ Social and Emotional Competence.....................................20
Student Self-Report of Social and Emotional Competence ...............................................21
Student Outcomes From Extant Student Record Data .............................................................22
School Contrasts: Comparison of SEL Focus With Non-SEL Focus Schools ........................23
Results ............................................................................................................................................25
School Implementation ............................................................................................................25
Staff SEL Survey ...............................................................................................................25
Staff SEL Survey: Change Over Time ...............................................................................31
Staff SEL Survey: Analysis of Responses by Grade Level ...............................................32
School Contrasts: Staff SEL Survey Ratings in Focus and Nonfocus Schools .................32
School Outcome: School Climate ............................................................................................33
Effect of the CDI on Student Perceptions of Climate in Anchorage and Cleveland .........34
Anchorage Results ...................................................................................................................34
Cleveland Results.....................................................................................................................35
Student Outcomes ....................................................................................................................36
Change in Student Social and Emotional Competence......................................................36
Student Social and Emotional Competence Outcomes in Anchorage ...............................37
School Contrasts: Change in Student Social and Emotional Competence in Focus
and Nonfocus Schools ......................................................................................................42
Association of School SEL Implementation Activities and Student Social and
Emotional Competence ....................................................................................................43
Student Outcomes From Extant Student Records ..............................................................44
School Contrasts: Student Outcomes From Extant Student Record Data .........................46
Association of School SEL Implementation Activities and Student Outcomes
From Extant Student Record Data ....................................................................................48
Implementation Contrasts ..................................................................................................48
General Discussion ........................................................................................................................49
School Implementation ............................................................................................................49
School Outcome: School Climate ............................................................................................50
Student Outcomes ....................................................................................................................51
Implications..............................................................................................................................52
Next Steps ................................................................................................................................54
References ......................................................................................................................................56
Appendix A. CASEL’s District-Level Theory of Action ..............................................................58
Appendix B. CASEL’s School-Level Theory of Action ...............................................................60
Appendix C. Analytic Methods and Limitations ...........................................................................61
Analytic Methods: Student Outcomes From Extant Student Record Data ..............................61
Analytic Methods: School Climate Outcomes .........................................................................64
Analytic Methods: Student Social and Emotional Competence Outcomes .............................64
Analytic Methods: Student Social and Emotional Competence Outcomes in
Anchorage...............................................................................................................................65
Analytic Methods: Association of School SEL Implementation Activities and Student
Social and Emotional Competence .........................................................................................66
Analytic Methods: School Contrasts .......................................................................................66
Analytic Methods: School Contrasts on Student SEL Scores .................................................67
Limitations ...............................................................................................................................68
Appendix D. District Characteristics .............................................................................................71
Appendix E. District Context and Implementation Summary .......................................................75

Cohort 1 Districts ...............................................................................................................75
Cohort 2 Districts ...............................................................................................................77
Appendix F. Implementation and Outcome Measures by Level ...................................................82
Appendix E. Staff SEL Survey Scaling and Standard Setting .......................................................88

American Institutes for Research Collaborating Districts Initiative: 2015 Outcome Evaluation Report — 4
Executive Summary
This report presents findings about the implementation of the Collaborating Districts Initiative
(CDI) as of the end of June 2014. The CDI is a complex eight-district demonstration project
designed to learn about as well and show how and to what end school districts can make social
and emotional learning (SEL) an essential part of every student’s education. Three districts
entered the initiative in 2011 (Cohort 1) and five more entered in 2012 (Cohort 2). All districts
began with a selection visit and a roughly eight-month planning phase before starting their first
implementation year.
The American Institutes for Research (AIR) is evaluating this initiative, and this report (along
with a related implementation report) is a summative report of our first three years of work
evaluating the initiative. The goals of AIR’s work were and are to evaluate (1) implementation of
activities described in the CDI district theory of action as it relates to the implementation of
systemic SEL; (2) district outcomes, including systemwide climate, commitment to SEL, and
clarity of roles and responsibilities for SEL; (3) school implementation and school climate; and
(4) student outcomes, including students’ academic performance, attendance, and suspensions, as
well as social and emotional competence. The evaluation design was developed around a theory
of action that CASEL developed in 2011–12, and
the first three years of work enabled AIR to
develop and refine (in collaboration with CASEL)
instruments to measure implementation and social
and emotional competence and to see whether our
designs that were aligned to the theory of action
would hold as both districts and CASEL evolved
their practice. We found that although our
districtwide design works, our attempt to add
additional rigor by contrasting outcomes in schools
on which the district SEL leadership focused with
non-focus schools may have been weakened by the
effects of districtwide activities which included
board, superintendent, and chief academic officer
leadership; integration of and/or alignment SEL
into and with other district initiatives; embedding
SEL into staff development and other human
resource activities, and the natural movement of
students and teachers across schools.
I’ve just been interviewing and doing the
end of year eval for some of our chiefs
and some of our principals and to hear
them talk about the way in which they’ve
been changing their school culture and
the impact that social emotional learning
has had directly in the classroom that
allows for teachers to teach, you know
something good is happening and that the
impact is much stronger than I probably
would have anticipated….This is core and
fundamental to the work that we’re doing.
The partnership helps to sustain the effort
too. I think sometimes you get incredibly
lonely trying to do it, but you know that
there are other armies of believers out
there who are doing and engaged in this
work, so no. As long as I’m in the seat
we’re going to be here for the long haul.
—A district superintendent, 2014
American Institutes for Research Collaborating Districts Initiative: 2015 Outcome Evaluation Report — 5
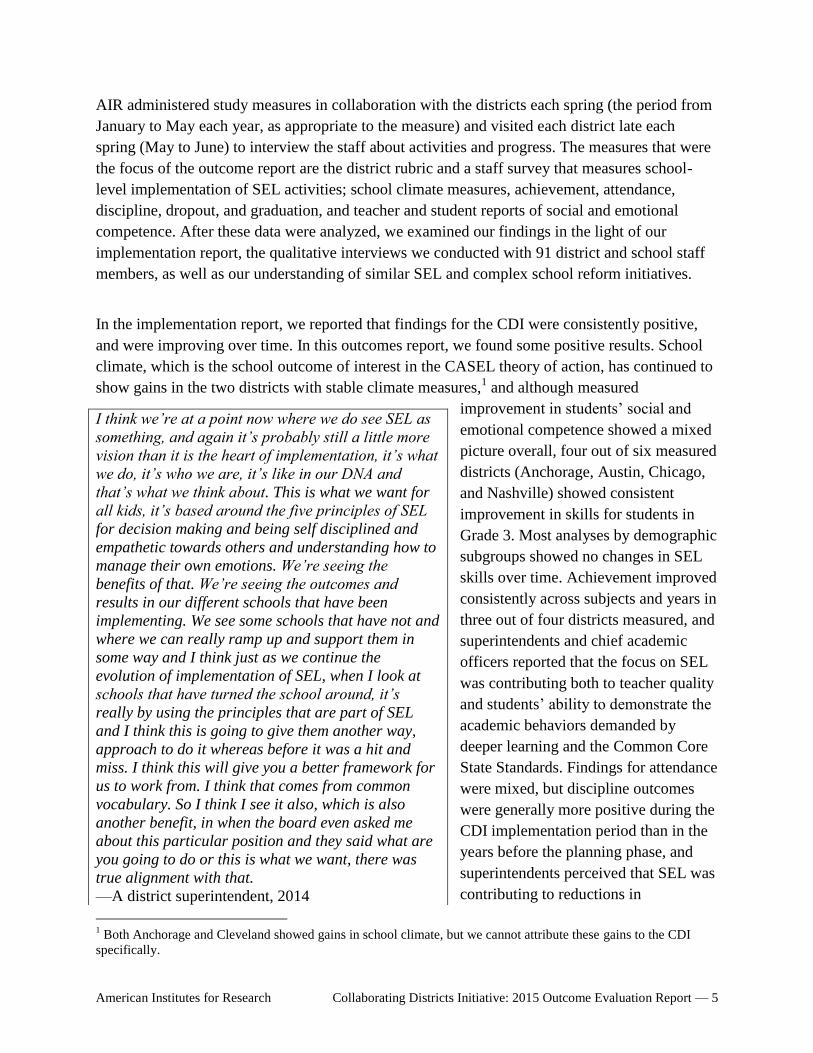
AIR administered study measures in collaboration with the districts each spring (the period from
January to May each year, as appropriate to the measure) and visited each district late each
spring (May to June) to interview the staff about activities and progress. The measures that were
the focus of the outcome report are the district rubric and a staff survey that measures school-
level implementation of SEL activities; school climate measures, achievement, attendance,
discipline, dropout, and graduation, and teacher and student reports of social and emotional
competence. After these data were analyzed, we examined our findings in the light of our
implementation report, the qualitative interviews we conducted with 91 district and school staff
members, as well as our understanding of similar SEL and complex school reform initiatives.
In the implementation report, we reported that findings for the CDI were consistently positive,
and were improving over time. In this outcomes report, we found some positive results. School
climate, which is the school outcome of interest in the CASEL theory of action, has continued to
show gains in the two districts with stable climate measures,1 and although measured
improvement in students’ social and
emotional competence showed a mixed
picture overall, four out of six measured
districts (Anchorage, Austin, Chicago,
and Nashville) showed consistent
improvement in skills for students in
Grade 3. Most analyses by demographic
subgroups showed no changes in SEL
skills over time. Achievement improved
consistently across subjects and years in
three out of four districts measured, and
superintendents and chief academic
officers reported that the focus on SEL
was contributing both to teacher quality
and students’ ability to demonstrate the
academic behaviors demanded by
deeper learning and the Common Core
State Standards. Findings for attendance
were mixed, but discipline outcomes
were generally more positive during the
CDI implementation period than in the
years before the planning phase, and
superintendents perceived that SEL was
contributing to reductions in
1 Both Anchorage and Cleveland showed gains in school climate, but we cannot attribute these gains to the CDI
specifically.
I think we’re at a point now where we do see SEL as
something, and again it’s probably still a little more
vision than it is the heart of implementation, it’s what
we do, it’s who we are, it’s like in our DNA and
that’s what we think about. This is what we want for
all kids, it’s based around the five principles of SEL
for decision making and being self disciplined and
empathetic towards others and understanding how to
manage their own emotions. We’re seeing the
benefits of that. We’re seeing the outcomes and
results in our different schools that have been
implementing. We see some schools that have not and
where we can really ramp up and support them in
some way and I think just as we continue the
evolution of implementation of SEL, when I look at
schools that have turned the school around, it’s
really by using the principles that are part of SEL
and I think this is going to give them another way,
approach to do it whereas before it was a hit and
miss. I think this will give you a better framework for
us to work from. I think that comes from common
vocabulary. So I think I see it also, which is also
another benefit, in when the board even asked me
about this particular position and they said what are
you going to do or this is what we want, there was
true alignment with that.
—A district superintendent, 2014
American Institutes for Research Collaborating Districts Initiative: 2015 Outcome Evaluation Report — 6
exclusionary discipline. These findings are not surprising for the second and third year of
implementation of a complex districtwide initiative, but underscore the importance of execution
at a district, school, and ultimately classroom level.
Classroom and school implementation matter. When we examined how student outcomes related
to implementation, we found that for two out of three districts where we could do these analyses,
implementation was significantly related to student outcomes. Districtwide capacity building
also matters, and capacity depends upon the motivation of all stakeholders, strategic drivers,
general capacity to implement and improvement, and SEL-specific capacities. Our quantitative
findings are limited by less-than ideal response rates, the nature of self-report instruments, and
gaps in the data available to us. Our qualitative interviews suggest that districts sustained,
deepened and broadened their commitment to SEL over the course of their participation in the
CDI. Participation in the CDI as well as district-initiated activities have enhanced the readiness
of the districts and their schools to implement and sustain SEL. More staff and stakeholders
know about it and want it, and SEL has been embedded as a pillar in strategic plans. Further,
SEL is increasingly being aligned with other districtwide activities with which it was under-
aligned during the first years of the CDI. These activities include professional development,
human resources, implementation of the Common Core State Standards, college and career
readiness programs, and attempts to elevate achievement of particular groups of students,
approaches to restorative practice, PBIS, RTI, family engagement, and teacher and administrator
social and emotional learning.
American Institutes for Research Collaborating Districts Initiative: 2015 Outcome Evaluation Report — 7
Introduction
Social and emotional learning (SEL) is the process through which children learn the skills to
handle themselves, their relationships, and their work effectively and ethically. These skills
include recognizing and managing emotions, developing caring and concern for others,
establishing positive relationships, making responsible decisions, and handling challenging
situations constructively. They are the skills that allow children to calm themselves when angry,
make friends, resolve conflicts respectfully, and make ethical and safe choices (Collaborative for
Academic, Social, and Emotional Learning [CASEL], 2012).
School districts are increasingly recognizing the value of addressing SEL as an essential part of
education for all students. School-based SEL programs (1) enhance students’ social and
emotional skills and classroom behavior; (2) improve attachment and attitudes toward school;
(3) decrease rates of violence and aggression, disciplinary referrals, and substance use; and
(4) improve academic performance (Durlak, Weissberg, Dymnicki, Taylor, & Schellinger, 2011).
To advance knowledge of how school districts can make SEL an integral part of every students’
education, CASEL and the NoVo Foundation launched the Collaborating Districts Initiative
(CDI). The CDI is aimed at building capacity in eight large school districts to implement SEL in
all schools, for all students. At the same time, CASEL hopes to leverage lessons learned in these
collaborating districts to strengthen the research base and to use the CDI to develop and refine
practical tools that will promote the effective implementation and assessment of SEL in other
districts.
The initiative formally began in November 2010 with a cohort of three districts; five additional
districts were selected to join the CDI in December 2011. Each district received an initial grant
of $125,000 from NoVo for a six-month planning phase. Planning phase activities included
building an SEL team and planning internally and in collaboration with CASEL; conducting a
needs and resource assessment; traveling to observe SEL in other districts; attending conferences
on SEL practices and research; and purchasing SEL-related materials, curricula, and assessment
tools. The outcome of the planning phase was a district SEL implementation plan and NoVo
implementation grants of up to $250,000 per year. Cohort 1 districts began their CDI planning in
February 2011 and their implementation in the 2011–12 school year; Cohort 2 districts began
planning in February 2012 and began implementation in the 2012–13 school year. As long as
each district makes sufficient progress, implementation support will continue for three years.
Through the CDI, CASEL and NoVo offer the following to participating districts:
District systems development consultation. Each collaborating district works closely
with a pair of consultants: a senior systems development advisor with experience
facilitating systemic change in large school districts and an SEL content specialist. These
consultant teams are well versed in current research and policy relevant to district reform.
The consultants also function as coaches to those directly responsible for the
implementation of SEL in each district. Each consultant provides about 45 days of
consultation to each district per year, and most have face-to-face visits monthly.
Staff development consultation. Consistent with each district’s plan, CASEL provides
workshops (e.g., orientation to SEL theory, research, and practice) and assistance in
American Institutes for Research Collaborating Districts Initiative: 2015 Outcome Evaluation Report — 8
developing coherent, sustainable staff development plans for school leaders and
personnel. All districts received consultation on staff development consistent with their
plans.
Communities of practice. In October 2011, November 2012, and November 2013,
CASEL convened all CDI member districts at a host district site to (1) establish
connections and relationships, (2) share learning and problem solving, and (3) provide a
support network for district staff. The meetings included visits to schools in host districts
to observe SEL practices as well as presentations by district staff on the strengths and
challenges of their CDI work. Out of these meetings, informal learning communities
between districts (Oakland and Washoe, Austin and Sacramento, Nashville and Chicago)
have emerged.
Connections to external partners. NoVo has provided support to developers of social
and emotional learning programs to build capacity to support SEL program
implementation in CDI and other districts. CASEL has systematically reviewed evidence-
based SEL programs and shares information about findings with districts and encourages
connections between the districts and SEL providers.
Planning and implementation tools. CASEL supports SEL implementation through the
development of conceptual frameworks, training materials, and planning and monitoring
templates. Information from CASEL consultant logs indicates that the primary tools in
use by the districts to date have been the district rubric; the district strengths inventory;
and CASEL research articles, briefs, and videos.
Opportunity for grant funding. NoVo committed to providing each collaborating
district with an annual grant of $250,000 contingent on the district continuing to make
progress toward systemic implementation of high-quality SEL. Beyond the first three
years, NoVo will provide up to an additional three years of funding at a level
commensurate with progress and need. CASEL and consultants also support other
fundraising efforts to support SEL in districts.
Structure of the CDI Intervention
The CDI began with an application and selection process that involved a multiday site visit led
by CASEL (site visit teams included an evaluator from AIR, who served as a participant
observer). To prepare for this visit, districts reviewed and compiled information about their work
related to SEL, and they were asked to begin to articulate their vision for how a systemic focus
on SEL would help their district. AIR’s interviews have indicated that the process of change
started as districts prepared for the site visit and continued as they responded to it. After the
visits, CASEL staff prepared reports for each district identifying initial strengths and challenges;
these reports were the basis for the districts’ grant applications to the NoVo Foundation, which
were developed with support from CASEL consultants.
The funded period of the CDI is structured as two phases: a planning phase and an
implementation phase. The goal during the planning phase was for districts to develop an
ambitious yet feasible plan for implementing SEL for three years. Specific activities during the
planning phase generally include establishing leadership structures for SEL activities (and hiring
as necessary), identifying points of intersection and integrating SEL with other district initiatives,
American Institutes for Research Collaborating Districts Initiative: 2015 Outcome Evaluation Report — 9
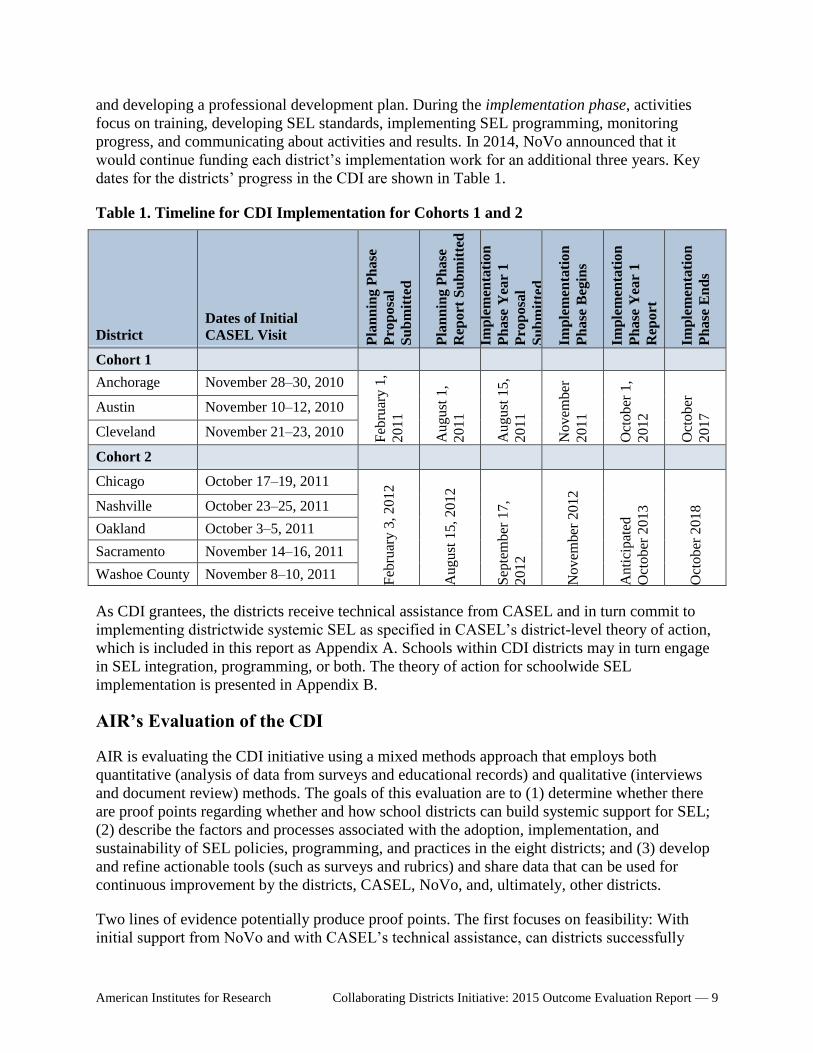
and developing a professional development plan. During the implementation phase, activities
focus on training, developing SEL standards, implementing SEL programming, monitoring
progress, and communicating about activities and results. In 2014, NoVo announced that it
would continue funding each district’s implementation work for an additional three years. Key
dates for the districts’ progress in the CDI are shown in Table 1.
Table 1. Timeline for CDI Implementation for Cohorts 1 and 2
District
Dates of Initial
CASEL Visit Pla
nn
ing P
ha
se
Pro
po
sal
Su
bm
itte
d
Pla
nn
ing P
ha
se
Rep
ort
Su
bm
itte
d
Imp
lem
enta
tio
n
Ph
ase
Yea
r 1
Pro
po
sal
Su
bm
itte
d
Imp
lem
enta
tio
n
Ph
ase
Beg
ins
Imp
lem
enta
tio
n
Ph
ase
Yea
r 1
Rep
ort
Imp
lem
enta
tio
n
Ph
ase
En
ds
Cohort 1
Anchorage November 28–30, 2010 F
ebru
ary 1
,
2011
August
1,
2011
August
15,
2011
Novem
ber
2011
Oct
ober
1,
2012
Oct
ober
201
7 Austin November 10–12, 2010
Cleveland November 21–23, 2010
Cohort 2
Chicago October 17–19, 2011
Feb
ruar
y 3
, 2012
August
15,
2012
Sep
tem
ber
17,
2012
Novem
ber
2012
Anti
cipat
ed
Oct
ober
2013
Oct
ober
201
8 Nashville October 23–25, 2011
Oakland October 3–5, 2011
Sacramento November 14–16, 2011
Washoe County November 8–10, 2011
As CDI grantees, the districts receive technical assistance from CASEL and in turn commit to
implementing districtwide systemic SEL as specified in CASEL’s district-level theory of action,
which is included in this report as Appendix A. Schools within CDI districts may in turn engage
in SEL integration, programming, or both. The theory of action for schoolwide SEL
implementation is presented in Appendix B.
AIR’s Evaluation of the CDI
AIR is evaluating the CDI initiative using a mixed methods approach that employs both
quantitative (analysis of data from surveys and educational records) and qualitative (interviews
and document review) methods. The goals of this evaluation are to (1) determine whether there
are proof points regarding whether and how school districts can build systemic support for SEL;
(2) describe the factors and processes associated with the adoption, implementation, and
sustainability of SEL policies, programming, and practices in the eight districts; and (3) develop
and refine actionable tools (such as surveys and rubrics) and share data that can be used for
continuous improvement by the districts, CASEL, NoVo, and, ultimately, other districts.
Two lines of evidence potentially produce proof points. The first focuses on feasibility: With
initial support from NoVo and with CASEL’s technical assistance, can districts successfully

American Institutes for Research Collaborating Districts Initiative: 2015 Outcome Evaluation Report — 10
implement policies and practices that make SEL an essential part of education? The second
involves impact: Does participation in the CDI result in better outcomes for students? Outcomes
of interest include students’ social and emotional competence, attendance, achievement,
suspensions, dropout, and graduation. Based on experience evaluating and doing research on
complex systemic initiatives (Aladjem et al., 2006; Borman, Hewes, Overman, & Brown, 2003;
Osher, Kelly, Tolani-Brown, Shors, & Chen, 2009) , the researchers hypothesized that while it
would take six or more years to fully establish proof points, the first three years of
implementation would provide rich data on these questions.
Evaluation Questions
In a separate report, the AIR evaluation team addressed questions related to implementation:
What strategies did districts use to introduce a focus on SEL, and how was this focus reflected in
schools? The prior report’s findings focused on district activities and outcomes,2 with
information based on a series of structured and semistructured interviews and document review.
Implementation findings for districts were strongly positive. Figure 1 shows the progress of the
CDI districts as measured by a rubric based on the CASEL logic model co-developed by CASEL
and AIR. The dominant finding is that districts are progressing both in their enactment and
deepening of CDI activities and in their realization of outcomes, and are continuing to achieve
higher levels of SEL overall implementation each year; and (2) that this progress includes
intentionally integrating and/or aligning SEL into or with other district activities such as
academic instruction, student support, discipline, human resources, family engagement, and
cultural competence.
2 The district rubric was developed to measure benchmarks toward more fully operationalizing the CDI theory of
action for districts. The 10 activities measured are resources and needs, vision, central office expertise, professional
development programs, alignment of resources, communications, SEL standards for PK–12, evidence-based
programs, integration of SEL with other initiatives, and continuous improvement. Three district outcomes measured
were positive climate, stakeholder commitment, and roles and responsibilities for SEL.

American Institutes for Research Collaborating Districts Initiative: 2015 Outcome Evaluation Report — 11
Figure 1. Averaged Rubric Scores Across 10 Activity Items and Three Outcome Items for
Each District, 2011–14
The ultimate goal of the outcome evaluation is to determine whether the studied sites
individually or collectively qualify as proof points that show incorporation of a strong focus on
SEL can improve outcomes for schools and students in large, urban districts. The specific school
outcome of interest, according to the CASEL school-level theory of action developed in 2011–
12, is positive climate, which was also identified as being of major importance to district leaders
across all districts, is also of increasing interest nationally. Evaluation questions addressed in this
report are as follows:
At the school level, to what extent and in what respects is school climate associated with
the school-level implementation of the district SEL reform initiatives?
Student-level questions:
• Does students’ social and emotional competence change over time? Were changes, if
any, related to the degree to which schools implemented SEL activities?
• Does students’ academic functioning (achievement, attendance, suspensions) improve
after the CDI was implemented compared with the period before the initiative began?
• How do outcomes differ for demographic subgroups of students (gender and racial
groups)?
Evaluation Designs for School and Student Outcomes
AIR has developed the most rigorous possible approach3 to estimate effects from the CDI for
schools and students. We use an interrupted time series (ITS) design to examine change in the
school and student outcomes specified in our evaluation questions, with the point of interruption
3 Random assignment of districts or schools was not a feasible approach for this demonstration project because the
interventions are not yet well specified, depend on willing principals and school leaders, and are dynamic over time.
1.0
1.5
2.0
2.5
3.0
3.5
4.0
2011 2012 2013 2014
Outcomes
Avera
ge o
f 3
Dis
tric
t O
utc
om
e S
co
res
ASD
AISD
CMSD
CPS
MNPS
OUSD
SCUSD
WCSD
1.0
1.5
2.0
2.5
3.0
3.5
4.0
2011 2012 2013 2014
Activities
Avera
ge o
f 1
0 D
isst
ric
t A
cti
vit
y S
co
res
ASD
AISD
CMSD
CPS
MNPS
OUSD
SCUSD
WCSD

American Institutes for Research Collaborating Districts Initiative: 2015 Outcome Evaluation Report — 12
as the onset of the NoVo grant implementation (Bloom, 1999; Bloom, 2001; Shadish, Cook, &
Campbell, 2002). If we use achievement as an example, an ITS design estimates intervention
effects on achievement by examining the trajectory in standardized test scores for a number of
annual student cohorts after an intervention is launched and by comparing them with the trend in
the scores of cohorts from several years before the reform was initiated (the baseline period). The
analytic model projects what student performance would have been in the absence of the
intervention during a multiyear follow-up period after the program was introduced. The pattern
of school performance during the multiyear baseline period is projected into the postintervention
period. The difference between the actual and projected school performances provides an
estimate of the effect of the intervention. Even with the most rigorous available design in this
situation, the ITS design is subject to threats of history, attrition, and changes in instrumentation.
Data that can be included in an ITS design come from measures that have been in place for at
least three time points before the initiative began (e.g., student achievement, attendance,
behavior, school climate) and stay in place throughout the initiative. In this study, the ideal
baseline for Cohort 1 districts would be 2007–08, 2008–09, and 2009–10 because the planning
phase began in the 2010–11 school year and implementation began in 2011–12.
When we developed our initial design it appeared that all but one district would be rolling the
initiative out by focusing on clusters of schools. In our initial design we tried to take advantage
of districts’ SEL rollout plans to identify contrasts across schools (that is, CDI schools and
comparison schools) within districts. The schools that each district identified as their CDI
schools would be “focus” schools, and presumably would be engaged in CDI-specific
professional learning opportunities and may have coaching supports or SEL materials made
available to them differentially. We planned to contrast these focus schools with other schools to
which the districts had not yet rolled out the school-based activities in their implementation
plans, and this contrast would shed light on CDI-specific effects. It was also a component of our
original design that we would supplement these analyses with models that examine the
relationship between implementation measures and outcomes. The logic of this approach arose
from the experimental research tradition, in which units that are “assigned” to a “condition” are
always analyzed as belonging to that condition, regardless of actual implementation. For this
reason, these kinds of analyses are called “intent-to-treat,” since they reflect intended
intervention status. The secondary analyses comparing implementation and outcomes are called
“treatment on the treated” analyses because they examine our best estimate of “treatment as
delivered” instead of just “as assigned.”
As the CDI has unfolded, district, school, and staff activities progressively diluted this planned
contrast. The reasons include: (1) a greater focus on integrating SEL implementation with
districtwide reform efforts and school improvement efforts (e.g., Common Core State Standards
and professional development activities); (2) district leaders visibly and consistently
communicating the importance of SEL in their messaging and behavior (e.g., districts defining
SEL as a strategic pillar for all learning; (4) districts expanding the purview of the SEL office
(e.g., to include restorative practices and diversity initiatives); (5) districts creating universal
interventions (e.g., SEL standards or an SEL website); (6) intra-district staff and student
mobility; and (6) local school initiatives. Consequently, the school contrasts are unlikely to be a
clean test of the CDI. Therefore, although we present the findings for our school contrast
analyses in this report, we want to point out the limits of this approach, which was sensible two
American Institutes for Research Collaborating Districts Initiative: 2015 Outcome Evaluation Report — 13
years ago, but weakened due to effects of the CDI and related activities which, according to
superintendents, has captured the attention and interests of more teachers, more administrators,
more parents, and more community members. Consequently during the next year we will refine
our design to address the broadening penetration of SEL activities.

American Institutes for Research Collaborating Districts Initiative: 2015 Outcome Evaluation Report — 14
Methods
In this section, we briefly describe the districts that are part of the CDI. We then describe our
measures and how they relate to the theory of action for the initiative we are evaluating. We
describe our data collection procedures (including response rates for the various surveys that we
administered) as well as the de-identified data from student educational records that we gathered
from the districts. Our analytic strategy—including its strengths and limitations—are presented
in detail, including specifications for our statistical models, in Appendix C.
Sample: Description of the Eight CDI Districts
The CDI was launched with three school districts that form Cohort 1: Anchorage, Alaska—
Anchorage School District (ASD); Austin, Texas—Austin Independent School District (AISD);
and Cleveland, Ohio—Cleveland Metropolitan School District (CMSD). These districts were
recruited and selected based on their relationships with leaders in the field of SEL and because
they already had some activities in place related to developing students’ social and emotional
capacities. These three districts can be distinguished from Cohort 2 districts in that both the
initiative and the evaluation were still in relatively early developmental stages when their work
began. Procedures and expectations were not yet well codified.
In late 2011, CASEL began work to establish the CDI Cohort 2 districts. Districts that either
responded to an interest survey or were nominated by knowledgeable sources (e.g., CASEL staff
or consultants or SEL program providers) were ranked according to how well they demonstrated
commitment to high-quality, systemwide implementation of evidence-based SEL approaches.
Five districts were selected for site visits in fall 2011: Chicago, Illinois—Chicago Public Schools
(CPS); Nashville, Tennessee—Metropolitan Nashville Public Schools (MNPS); Oakland,
California—Oakland Unified School District (OUSD); Sacramento, California—Sacramento
City Unified School District (SCUSD); and Washoe County, Nevada (Reno/Lake Tahoe area)—
Washoe County School District (WCSD). Site visits were completed in November 2011, and all
five districts were awarded planning grants in February 2012. These five districts (Cohort 2)
submitted implementation proposals to NoVo in September 2012; all were awarded
implementation grants.
Although we include results for Cleveland alongside those from other districts in this report, we
acknowledge that AIR’s relationship with this district is very different from the one we have
with the other districts. The lead principal investigator for the AIR evaluation, David Osher,
Ph.D., has had a consulting relationship with Cleveland since early 2008, when he led an audit of
the district’s safety and student support services (Humanware). Because of this prior and
continuing relationship, Dr. Osher has a dual role in Cleveland that must be acknowledged in our
evaluation work. Since Dr. Osher’s involvement in Cleveland deepens his perspective of this
work, we treat Cleveland as a research and development site and are conscientious about
acknowledging the AIR staff’s complex role there. In this report, for readers’ convenience, we
share results and data from Cleveland together with that from other districts.
The eight districts composing the CDI are all moderate-to-large urban districts (although Washoe
County includes some rural areas as well as the city of Reno). Four districts have between 37,000
and 49,000 students (Cleveland, Sacramento, Oakland, and Anchorage, in order from smaller to
American Institutes for Research Collaborating Districts Initiative: 2015 Outcome Evaluation Report — 15
larger). The next three districts are larger: Washoe County has 63,000 students, Nashville has
81,000, and Austin has 86,000. Chicago has the most students, with roughly 395,000, but is
concentrating most of its school-based CDI work in 30 K–8 and 26 high schools.
A statistical summary of the eight CDI districts for the 2013–14 school year is presented in
Appendix D; additional detail about district context, priorities, and SEL implementation
approaches is presented in Appendix E. The districts present notable demographic differences.
For example, Austin and Cleveland are the only CDI districts to have a majority of students from
a single ethnic group (Latino and African-American, respectively). Cleveland has the largest
proportion of students with disabilities; Cleveland and Oakland both provide free meals to 100
percent of their students and therefore do not document eligibility for the free or reduced-price
lunch program each year. Oakland, Austin, and Sacramento have identified at least a fifth of their
students as English language learners. Oakland and Cleveland both have graduation rates below
65 percent; Austin, Sacramento, and Nashville have rates at or above 85 percent (Nashville’s rate
is 86.3 percent).
Evaluation Measures
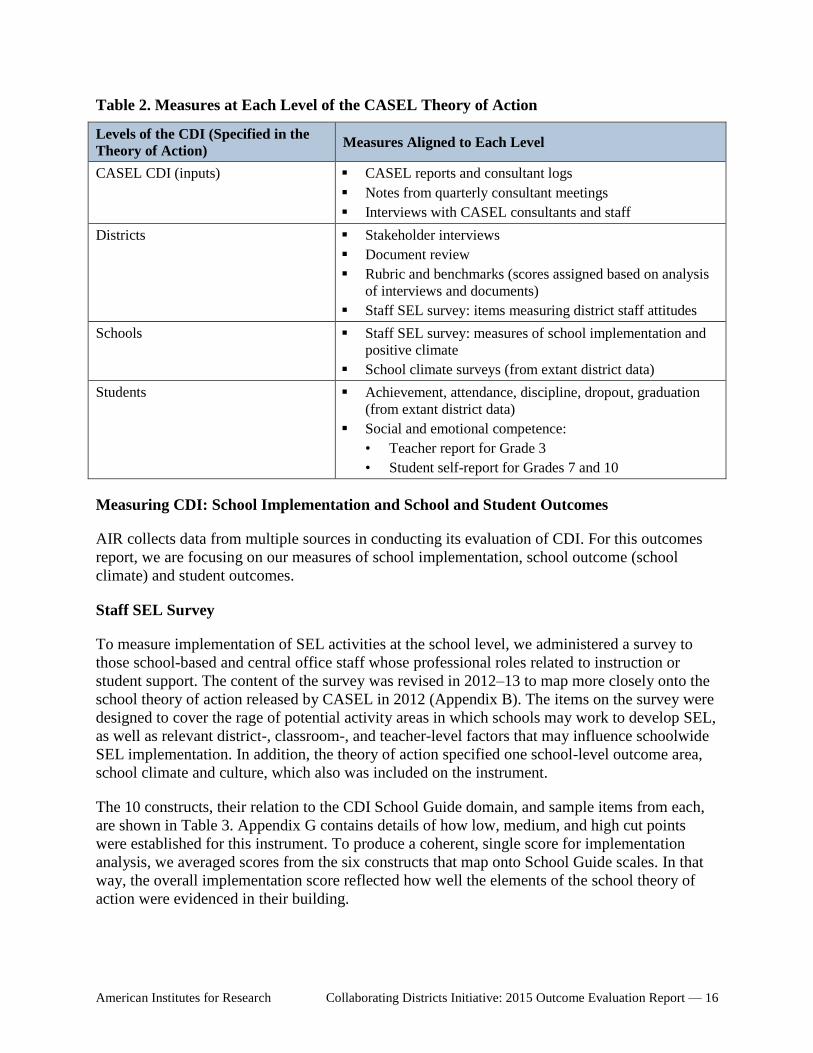
The measures and the data collection plan are shown in Table 2; greater detail about all of the
measures, including the variables yielded by each, is presented in Appendix F. The measures
themselves are presented in the companion Measures Appendix. The major elements in the CDI
district-level theory of action are shown in the left column of Table 2; the right column lists the
measures that align with each component of the theory of action. Although the CDI primarily
operates at the district level, the theory of action specifies that districts will provide training and
support at the school level for SEL integration and implementation; these school activities are
hypothesized to influence student outcomes. Although the CASEL theory of action, as it has
developed and been elaborated, includes attention to classroom-level implementation, the
evaluation as designed cannot at this time represent the classroom level substantially given the
extremely large number of schools involved in the study.
American Institutes for Research Collaborating Districts Initiative: 2015 Outcome Evaluation Report — 16
Table 2. Measures at Each Level of the CASEL Theory of Action
Levels of the CDI (Specified in the
Theory of Action) Measures Aligned to Each Level
CASEL CDI (inputs) CASEL reports and consultant logs
Notes from quarterly consultant meetings
Interviews with CASEL consultants and staff
Districts Stakeholder interviews
Document review
Rubric and benchmarks (scores assigned based on analysis
of interviews and documents)
Staff SEL survey: items measuring district staff attitudes
Schools Staff SEL survey: measures of school implementation and
positive climate
School climate surveys (from extant district data)
Students Achievement, attendance, discipline, dropout, graduation
(from extant district data)
Social and emotional competence:
• Teacher report for Grade 3
• Student self-report for Grades 7 and 10
Measuring CDI: School Implementation and School and Student Outcomes
AIR collects data from multiple sources in conducting its evaluation of CDI. For this outcomes
report, we are focusing on our measures of school implementation, school outcome (school
climate) and student outcomes.
Staff SEL Survey
To measure implementation of SEL activities at the school level, we administered a survey to
those school-based and central office staff whose professional roles related to instruction or
student support. The content of the survey was revised in 2012–13 to map more closely onto the
school theory of action released by CASEL in 2012 (Appendix B). The items on the survey were
designed to cover the rage of potential activity areas in which schools may work to develop SEL,
as well as relevant district-, classroom-, and teacher-level factors that may influence schoolwide
SEL implementation. In addition, the theory of action specified one school-level outcome area,
school climate and culture, which also was included on the instrument.
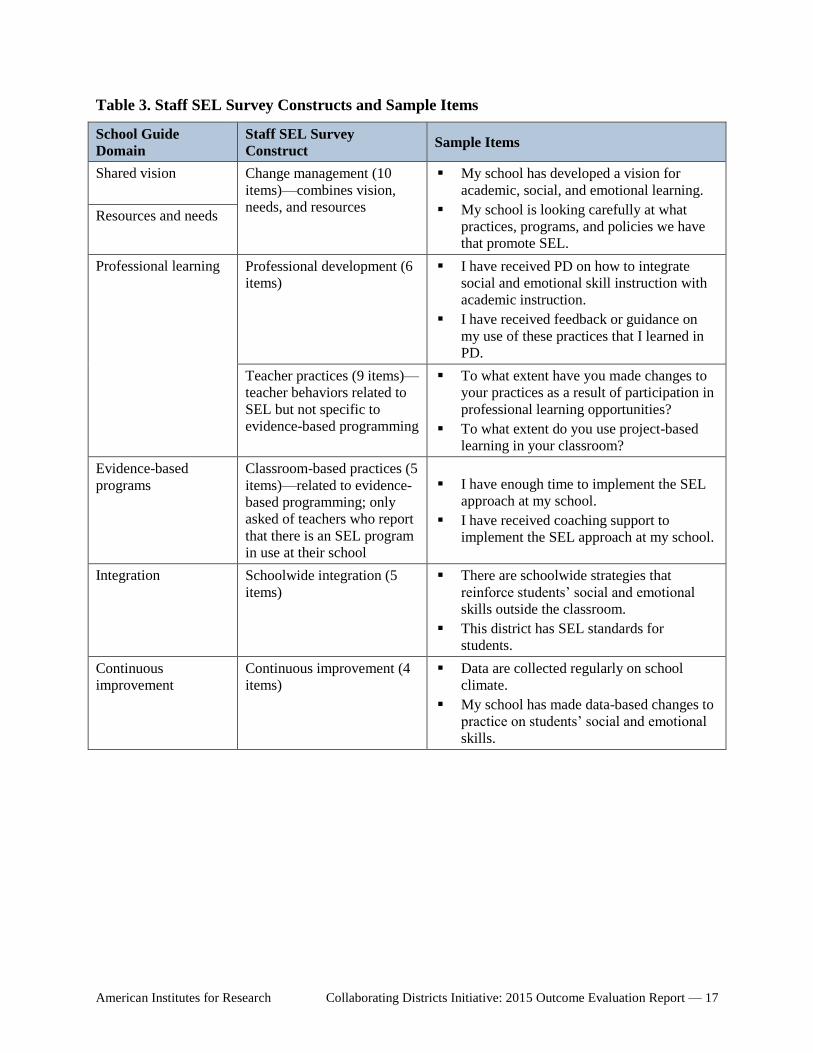
The 10 constructs, their relation to the CDI School Guide domain, and sample items from each,
are shown in Table 3. Appendix G contains details of how low, medium, and high cut points
were established for this instrument. To produce a coherent, single score for implementation
analysis, we averaged scores from the six constructs that map onto School Guide scales. In that
way, the overall implementation score reflected how well the elements of the school theory of
action were evidenced in their building.
American Institutes for Research Collaborating Districts Initiative: 2015 Outcome Evaluation Report — 17
Table 3. Staff SEL Survey Constructs and Sample Items
School Guide
Domain
Staff SEL Survey
Construct Sample Items
Shared vision Change management (10
items)—combines vision,
needs, and resources
My school has developed a vision for
academic, social, and emotional learning.
My school is looking carefully at what
practices, programs, and policies we have
that promote SEL.
Resources and needs
Professional learning Professional development (6
items)
I have received PD on how to integrate
social and emotional skill instruction with
academic instruction.
I have received feedback or guidance on
my use of these practices that I learned in
PD.
Teacher practices (9 items)—
teacher behaviors related to
SEL but not specific to
evidence-based programming
To what extent have you made changes to
your practices as a result of participation in
professional learning opportunities?
To what extent do you use project-based
learning in your classroom?
Evidence-based
programs
Classroom-based practices (5
items)—related to evidence-
based programming; only
asked of teachers who report
that there is an SEL program
in use at their school
I have enough time to implement the SEL
approach at my school.
I have received coaching support to
implement the SEL approach at my school.
Integration Schoolwide integration (5
items)
There are schoolwide strategies that
reinforce students’ social and emotional
skills outside the classroom.
This district has SEL standards for
students.
Continuous
improvement
Continuous improvement (4
items)
Data are collected regularly on school
climate.
My school has made data-based changes to
practice on students’ social and emotional
skills.
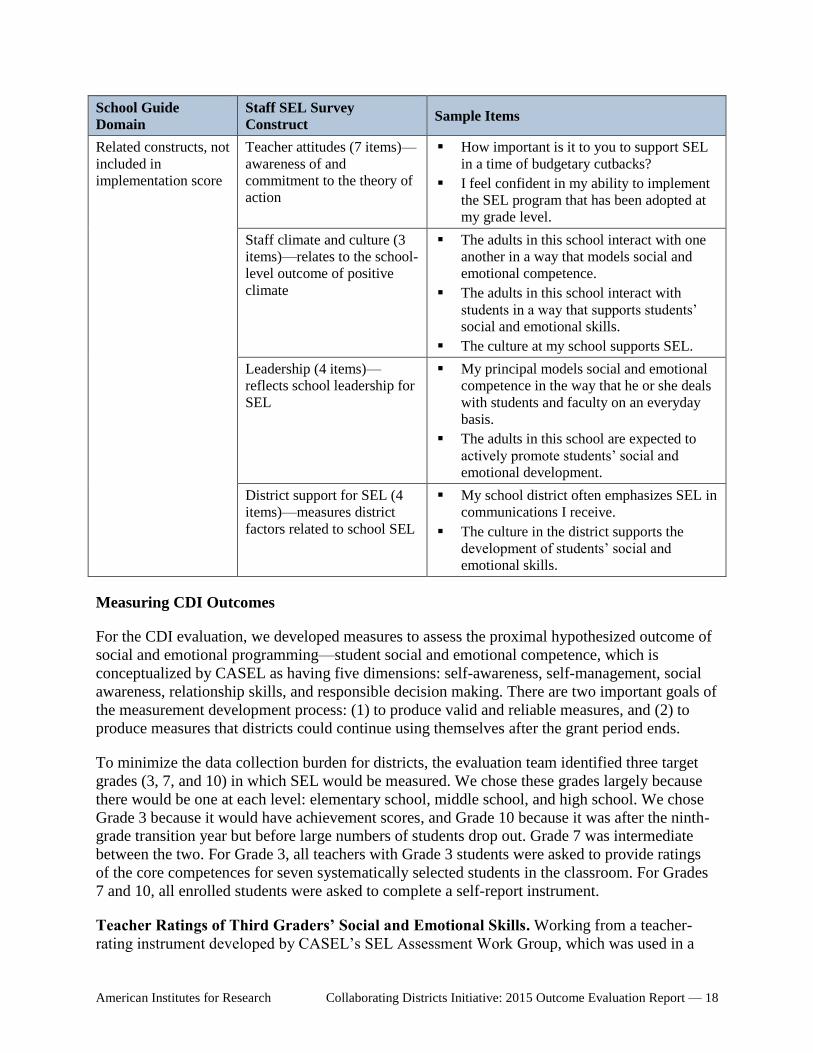
American Institutes for Research Collaborating Districts Initiative: 2015 Outcome Evaluation Report — 18
School Guide
Domain
Staff SEL Survey
Construct Sample Items
Related constructs, not
included in
implementation score
Teacher attitudes (7 items)—
awareness of and
commitment to the theory of
action
How important is it to you to support SEL
in a time of budgetary cutbacks?
I feel confident in my ability to implement
the SEL program that has been adopted at
my grade level.
Staff climate and culture (3
items)—relates to the school-
level outcome of positive
climate
The adults in this school interact with one
another in a way that models social and
emotional competence.
The adults in this school interact with
students in a way that supports students’
social and emotional skills.
The culture at my school supports SEL.
Leadership (4 items)—
reflects school leadership for
SEL
My principal models social and emotional
competence in the way that he or she deals
with students and faculty on an everyday
basis.
The adults in this school are expected to
actively promote students’ social and
emotional development.
District support for SEL (4
items)—measures district
factors related to school SEL
My school district often emphasizes SEL in
communications I receive.
The culture in the district supports the
development of students’ social and
emotional skills.
Measuring CDI Outcomes
For the CDI evaluation, we developed measures to assess the proximal hypothesized outcome of
social and emotional programming—student social and emotional competence, which is
conceptualized by CASEL as having five dimensions: self-awareness, self-management, social
awareness, relationship skills, and responsible decision making. There are two important goals of
the measurement development process: (1) to produce valid and reliable measures, and (2) to
produce measures that districts could continue using themselves after the grant period ends.
To minimize the data collection burden for districts, the evaluation team identified three target
grades (3, 7, and 10) in which SEL would be measured. We chose these grades largely because
there would be one at each level: elementary school, middle school, and high school. We chose
Grade 3 because it would have achievement scores, and Grade 10 because it was after the ninth-
grade transition year but before large numbers of students drop out. Grade 7 was intermediate
between the two. For Grade 3, all teachers with Grade 3 students were asked to provide ratings
of the core competences for seven systematically selected students in the classroom. For Grades
7 and 10, all enrolled students were asked to complete a self-report instrument.
Teacher Ratings of Third Graders’ Social and Emotional Skills. Working from a teacher-
rating instrument developed by CASEL’s SEL Assessment Work Group, which was used in a
American Institutes for Research Collaborating Districts Initiative: 2015 Outcome Evaluation Report — 19
study of SEL in Cleveland (Faria, Kendziora, Brown, & Osher, 2013), AIR and CASEL adapted
a 20-item rating scale for teachers to rate their students’ social and emotional skills.
Each of the five SEL competencies was measured by four items:
Self-awareness (e.g., Understands his or her own strengths or weaknesses)
Self-management (e.g., Accepts when things do not go his or her way)
Social awareness (e.g., Responds with empathy to others who are upset)
Relationship skills (e.g., Works well with others)
Responsible decision making (e.g., Takes responsibility for his or her own actions)
Students’ Self-Report of Social and Emotional Competence. In collaboration with CASEL,
AIR developed student self-report measures of social and emotional skills based on items from
prior surveys. The same five SEL skills covered on the teacher rating instrument also were
measured using self-report:
Self-awareness (six items, e.g., I understand my moods and feelings)
Self-management (seven items, e.g., I try hard to do well in school)
Social awareness (six items, e.g., I listen carefully to what other students say to me)
Relationship skills (six items, e.g., I am able to work well with others)
Responsible decision making (five items, e.g., I take responsibility for my mistakes)
Psychometric properties of these scales were adequate for analysis.
Survey Administration
In this section, we describe the approach to the administration of each survey.
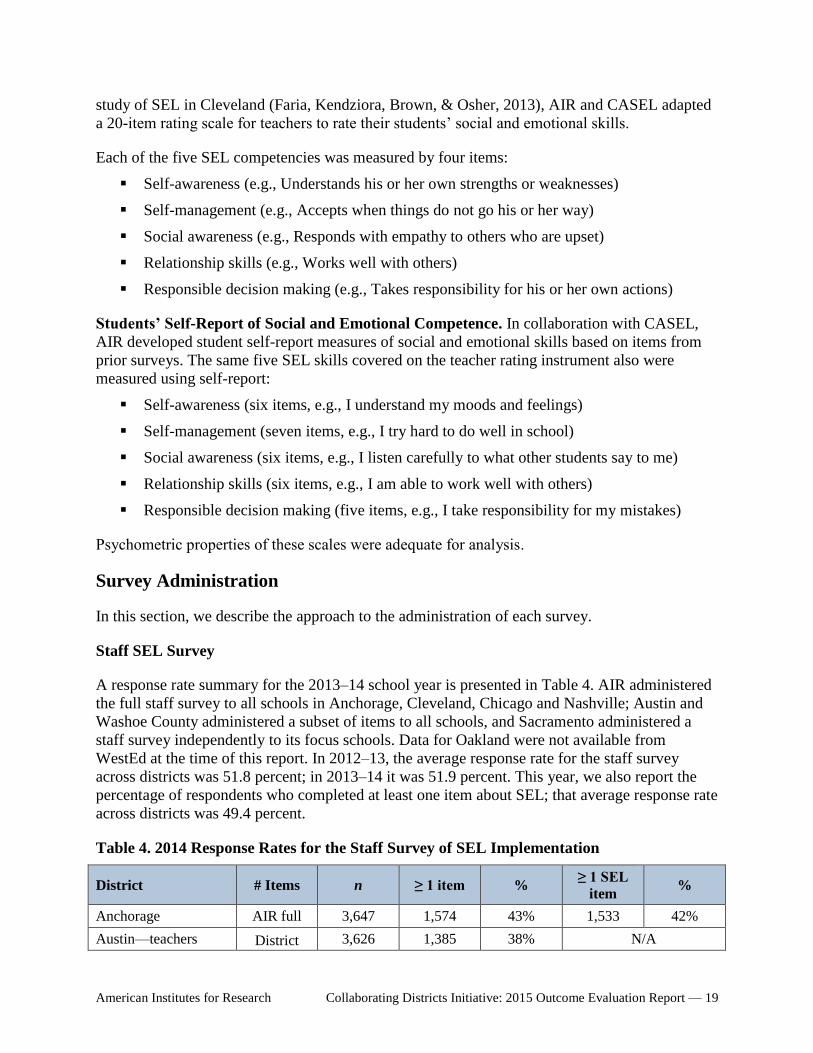
Staff SEL Survey
A response rate summary for the 2013–14 school year is presented in Table 4. AIR administered
the full staff survey to all schools in Anchorage, Cleveland, Chicago and Nashville; Austin and
Washoe County administered a subset of items to all schools, and Sacramento administered a
staff survey independently to its focus schools. Data for Oakland were not available from
WestEd at the time of this report. In 2012–13, the average response rate for the staff survey
across districts was 51.8 percent; in 2013–14 it was 51.9 percent. This year, we also report the
percentage of respondents who completed at least one item about SEL; that average response rate
across districts was 49.4 percent.
Table 4. 2014 Response Rates for the Staff Survey of SEL Implementation
District # Items n ≥ 1 item % ≥ 1 SEL
item %
Anchorage AIR full 3,647 1,574 43% 1,533 42%
Austin—teachers District 3,626 1,385 38% N/A

American Institutes for Research Collaborating Districts Initiative: 2015 Outcome Evaluation Report — 20
District # Items n ≥ 1 item % ≥ 1 SEL
item %
Austin—
administrators
survey, 20
items 118 61 52% N/A
Austin—nonteaching
professionals 576 297 52% N/A
Cleveland AIR full 3,269 2,011 62% 1,749 54%
Chicago AIR full 1,740 895 51% 883 51%
Nashville AIR full 6,257 3,267 52% 3,208 51%
Oakland N/A
Sacramento
57 20 SEL
schools; N
unknown
154 N/A N/A
Washoe County District
survey, 18
items
5,959 3,677 62% 3,543 59%
Overall 25,192 13,167 52%
Note. The denominators for all districts were the numbers of personnel identified by each district as having a role
related to instruction or student support. Austin staff were sampled by role to complete 16 SEL items as part of the
district’s Employee Coordinated Survey.
Teacher Ratings of Students’ Social and Emotional Competence
For the CDI evaluation, we developed measures to assess the most proximal hypothesized
outcome of social and emotional programming—student social and emotional competence,
which CASEL conceptualizes as having five dimensions: self-awareness, self-management,
social awareness, relationship skills, and responsible decision making. Two important goals of
the measurement development process were to produce valid and reliable measures and to
produce measures that districts could continue using themselves after the grant period ends.
To minimize the data collection burden for districts, the evaluation team identified three target
grades (3, 7, and 10) in which SEL would be measured. For Grade 3, all teachers with Grade 3
students were asked to provide ratings of the core competences for seven systematically selected
students in the classroom. For Grades 7 and 10, all enrolled students were asked to complete a
self-report instrument.
Between January and May 2014, third-grade teachers in six districts (all but Anchorage and
Sacramento) were asked to complete ratings of social and emotional competence for seven
systematically selected students in their classrooms.4 An administration summary for the teacher
ratings, including the numbers of respondents for each district and response rates, is presented in
Table 5. In Anchorage, the student version of the School Climate and Connectedness Survey
4 Teachers whose birthdays were in the first half of the calendar year were asked to rate the first seven students on
the alphabetical classroom roster; those with second-half birthdays were asked to rate the last seven students. In
Washoe County, the year was divided into thirds, and teachers were asked to rate students 1–7, 8–14, or 15–21 on
their rosters.

American Institutes for Research Collaborating Districts Initiative: 2015 Outcome Evaluation Report — 21
contains a 16-item SEL scale that maps onto their SEL standards; students in Grades 3 and 4
complete this instrument, so we did not ask teachers in Anchorage to complete ratings.
Table 5. 2014 Response Rates for Teacher Ratings of Students' Social and Emotional
Competence
District n ≥ 1 item % ≥ 1 SEL item %
Anchorage N/A—we use self-report data at Grade 3 collected by district since 2008
Austin 389 248 64% 227 58%
Cleveland 269 174 65% 156 58%
Chicago 49 26 53% 26 53%
Nashville 384 274 71% 252 66%
Oakland 165 111 67% 100 61%
Sacramento N/A—not administered
Washoe County Grade 3 217 138 64% 124 57%
Washoe County Grade 5 177 114 64% 99 56%
Overall 1,650 1085 66% 984 60%
Student Self-Report of Social and Emotional Competence
For this evaluation, wee invited middle and high school age students to provide information
about their own social and emotional skills. In two districts (Austin and Chicago), students in
Grades 7 and 10 were invited to complete a 30-item online survey at school. In Washoe County,
a slightly altered5 version of these 30 items was administered as part of the district’s Student
Climate Survey. In Cleveland, a shorter set of these items was administered as part of the
district’s Conditions for Learning Survey. Finally, Anchorage has a 15-item SEL scale as part of
the Grades 5–12 School Climate and Connectedness Survey that has been administered
districtwide since 2006; AIR did not administer the CDI measure there, preferring to leverage the
district’s own data to identify longitudinal trends. An administration summary (numbers of
respondents by district and response rates) is presented in Table 6. Student data were either not
currently available or not appropriate for longitudinal analysis for Oakland, Nashville, or
Sacramento. When possible, we will include analyses of these data in later reports.6
5 At the request of the district’s lawyers, all references to “anger” were removed from the WCSD student survey.
6 In Oakland, district staff developed and administered their own measure of social and emotional competence; at
the time of this report, AIR had not received data that could be used to identify the social and emotional competence
items due to missing identifiers in the files. In Nashville, student items were included in the Tennessee Student
Climate Survey; however, the state closed the survey for all participating districts as a result of an issue related to
family consent. As a result, Nashville was not able to collect any usable student data for the 2013–14 school year.
Finally, AIR received Grade 5 climate data from Sacramento, from which AIR identified a single SEL construct;
however, the survey items were administered only in 2013–14, so these data cannot be compared to other years and
therefore cannot be used for longitudinal analyses.
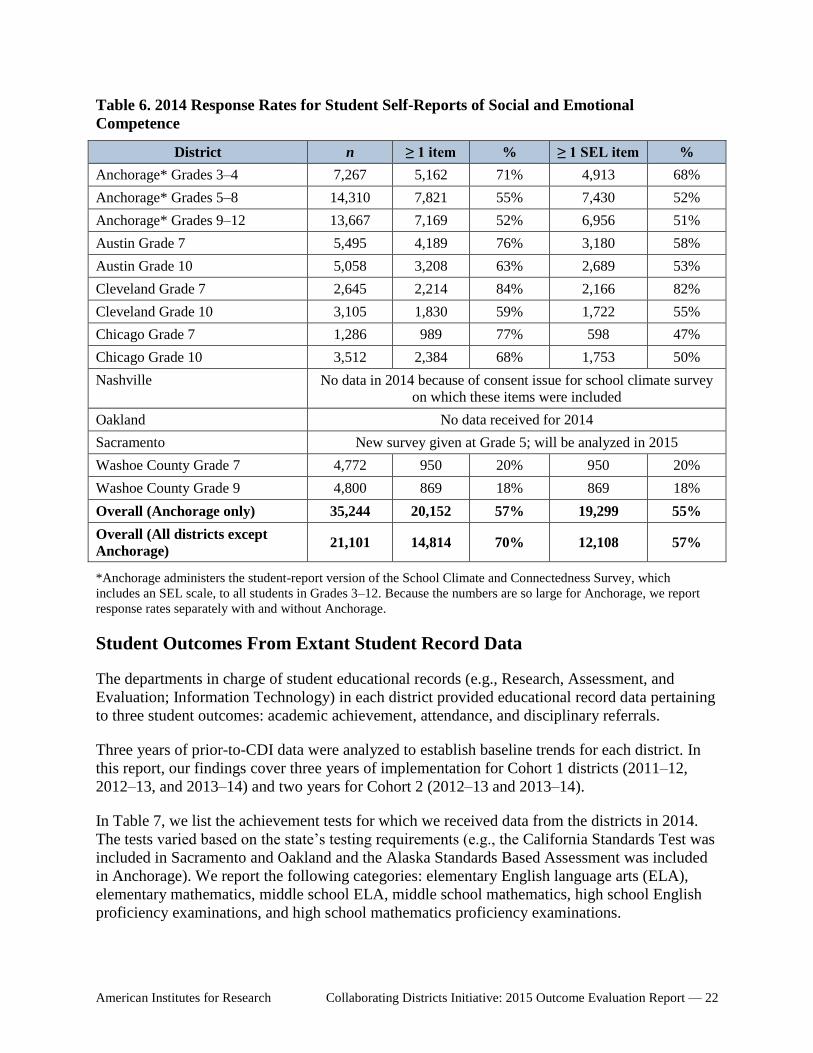
American Institutes for Research Collaborating Districts Initiative: 2015 Outcome Evaluation Report — 22
Table 6. 2014 Response Rates for Student Self-Reports of Social and Emotional
Competence
District n ≥ 1 item % ≥ 1 SEL item %
Anchorage* Grades 3–4 7,267 5,162 71% 4,913 68%
Anchorage* Grades 5–8 14,310 7,821 55% 7,430 52%
Anchorage* Grades 9–12 13,667 7,169 52% 6,956 51%
Austin Grade 7 5,495 4,189 76% 3,180 58%
Austin Grade 10 5,058 3,208 63% 2,689 53%
Cleveland Grade 7 2,645 2,214 84% 2,166 82%
Cleveland Grade 10 3,105 1,830 59% 1,722 55%
Chicago Grade 7 1,286 989 77% 598 47%
Chicago Grade 10 3,512 2,384 68% 1,753 50%
Nashville No data in 2014 because of consent issue for school climate survey
on which these items were included
Oakland No data received for 2014
Sacramento New survey given at Grade 5; will be analyzed in 2015
Washoe County Grade 7 4,772 950 20% 950 20%
Washoe County Grade 9 4,800 869 18% 869 18%
Overall (Anchorage only) 35,244 20,152 57% 19,299 55%
Overall (All districts except
Anchorage) 21,101 14,814 70% 12,108 57%
*Anchorage administers the student-report version of the School Climate and Connectedness Survey, which
includes an SEL scale, to all students in Grades 3–12. Because the numbers are so large for Anchorage, we report
response rates separately with and without Anchorage.
Student Outcomes From Extant Student Record Data
The departments in charge of student educational records (e.g., Research, Assessment, and
Evaluation; Information Technology) in each district provided educational record data pertaining
to three student outcomes: academic achievement, attendance, and disciplinary referrals.
Three years of prior-to-CDI data were analyzed to establish baseline trends for each district. In
this report, our findings cover three years of implementation for Cohort 1 districts (2011–12,
2012–13, and 2013–14) and two years for Cohort 2 (2012–13 and 2013–14).
In Table 7, we list the achievement tests for which we received data from the districts in 2014.
The tests varied based on the state’s testing requirements (e.g., the California Standards Test was
included in Sacramento and Oakland and the Alaska Standards Based Assessment was included
in Anchorage). We report the following categories: elementary English language arts (ELA),
elementary mathematics, middle school ELA, middle school mathematics, high school English
proficiency examinations, and high school mathematics proficiency examinations.

American Institutes for Research Collaborating Districts Initiative: 2015 Outcome Evaluation Report — 23
Table 7. Academic Achievement Tests Used for Elementary, Middle, and High School
Students in Each District
District Achievement Test for Students in Grades 3–8 High School Proficiency Test
Anchorage Alaska Standards Based Assessment (SBA) Alaska High School Graduation
Qualifying Exam (HSGQE)
Austin State of Texas Assessments of Academic
Readiness (STAAR), starting in 2012; Texas
Assessment of Knowledge and Skills (TAKS)
End of Course Exams
Cleveland Ohio Achievement Assessment (OAA) Ohio Graduation Test (OGT)
Chicago Illinois Standards Achievement Test (ISAT) Prairie State Achievement
Examination
Nashville Tennessee Comprehensive Assessment Program
(TCAP)
End of Course Exams
Oakland California Standardized Testing and Reporting
(STAR)
California High School Exit Exam
(CAHSEE)
Sacramento California STAR CAHSEE
Washoe
County
Nevada Criterion Referenced Tests (CRTs) Nevada High School Proficiency
Examination
AIR also collected district records for student attendance and disciplinary actions (suspensions,
expulsions when available). These data elements are comparable across districts and are not
defined here.
School Contrasts: Comparison of SEL Focus With Non-SEL Focus Schools
In seven of the CDI districts, school-level SEL programming was rolled out to a subset of
schools at a time. The districts chose schools based on a variety of local factors, often including
principal willingness. The numbers of schools selected generally were guided by the numbers
that the district’s SEL team could support. The selected schools, which we call “focus” schools
in this report, were not necessarily intended to be the only schools in the district working on
SEL, but the schools so identified by the district were hypothesized to reflect CDI-related efforts.
The nature of the programming varied by district. In some districts, the SEL focus schools were
engaged in a schoolwide process to improve social and emotional competence; in some places,
schools were implementing evidence-based SEL programs; in others, they were engaged in
awareness building and beginning some efforts to improve climate and connection. Some
districts had multiple cohorts of school implementers, introducing SEL activities and supports to
additional schools each year.
For this report, we present the results of our school contrast analyses, even though we
acknowledge the concerns that stakeholders have expressed about the validity of these contrasts.
Table 8 lists for each district whether the rollout of the CDI allowed for within-district contrasts.
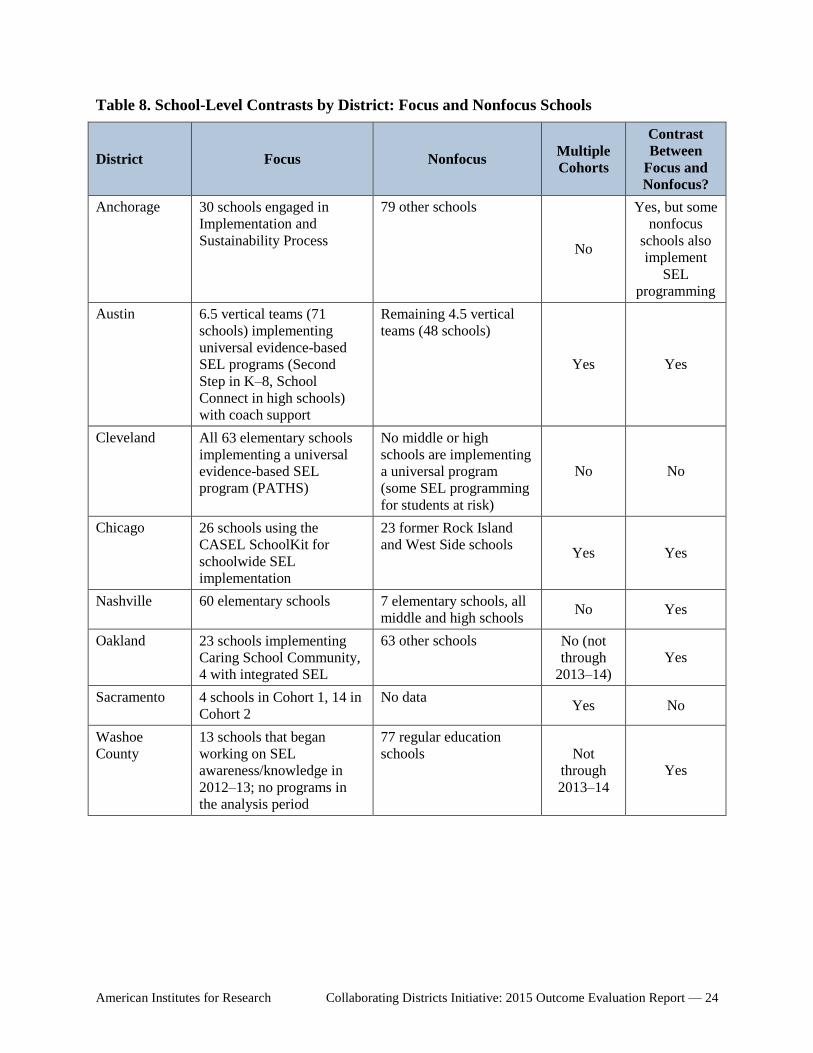
American Institutes for Research Collaborating Districts Initiative: 2015 Outcome Evaluation Report — 24
Table 8. School-Level Contrasts by District: Focus and Nonfocus Schools
District Focus Nonfocus Multiple
Cohorts
Contrast
Between
Focus and
Nonfocus?
Anchorage 30 schools engaged in
Implementation and
Sustainability Process
79 other schools
No
Yes, but some
nonfocus
schools also
implement
SEL
programming
Austin 6.5 vertical teams (71
schools) implementing
universal evidence-based
SEL programs (Second
Step in K–8, School
Connect in high schools)
with coach support
Remaining 4.5 vertical
teams (48 schools)
Yes Yes
Cleveland All 63 elementary schools
implementing a universal
evidence-based SEL
program (PATHS)
No middle or high
schools are implementing
a universal program
(some SEL programming
for students at risk)
No No
Chicago 26 schools using the
CASEL SchoolKit for
schoolwide SEL
implementation
23 former Rock Island
and West Side schools Yes Yes
Nashville 60 elementary schools 7 elementary schools, all
middle and high schools No Yes
Oakland 23 schools implementing
Caring School Community,
4 with integrated SEL
63 other schools No (not
through
2013–14)
Yes
Sacramento 4 schools in Cohort 1, 14 in
Cohort 2
No data Yes No
Washoe
County
13 schools that began
working on SEL
awareness/knowledge in
2012–13; no programs in
the analysis period
77 regular education
schools Not
through
2013–14
Yes
American Institutes for Research Collaborating Districts Initiative: 2015 Outcome Evaluation Report — 25
Results
In this section, we describe results for school implementation, school outcomes, and student
outcomes. We discuss the specific results in this section as they are presented; a general
discussion is provided in the next section.
School Implementation
In this section, we review results from the measures of implementation covered on the staff
survey. We acknowledge limitations to our knowledge here because not all schools had sufficient
numbers of staff respond, and we do not know whether the most knowledgeable staff responded.
Staff SEL Survey
CDI evaluation team members worked with staff from CASEL and district consultants to
develop a set of standards for the 10 constructs derived from the survey to delineate levels of
implementation: (1) low implementation, (2) medium implementation, or (3) high
implementation. These categories were designed to identify schools that were just starting to
implement SEL initiatives; schools that were partially, but not fully, implementing SEL
initiatives; and schools that were implementing fully. In a process driven by the expertise and
experience of CASEL staff and CASEL consultants, cut scores for each of the performance
levels were established and were applied to the data. The percentage of schools in the low,
medium, and high implementation category for each construct was then calculated.
Four districts administered complete versions of the staff survey during 2013–14: Anchorage,
Chicago, Cleveland, and Nashville. Across these districts, the majority of schools achieved a
moderate rating on the nine implementation activity constructs and one school climate outcome
construct measured by this survey. Overall, professional development was the construct on
which districts were highest, with 74 percent of schools in Anchorage, 66 percent of schools in
Chicago, and 43 percent of schools in Cleveland achieving high ratings. Anchorage and Chicago
schools also had relatively large proportions of their staff members rate their schools in the high
implementation range for teacher attitudes, schoolwide integration, and classroom practices. The
percentage of staff rating their schools in the low-implementation range was very small overall.
In the following sections, we describe each construct measured on the staff survey and present
results for the four districts. The constructs are presented in the order in which they appear in the
CASEL theory of action for schools, which was updated in 2014. Although we present the data
by district, it is important to understand that districts vary in terms of local and state contexts,
CDI history, implementation strategies, and types of evidence-based programs that are
implemented.
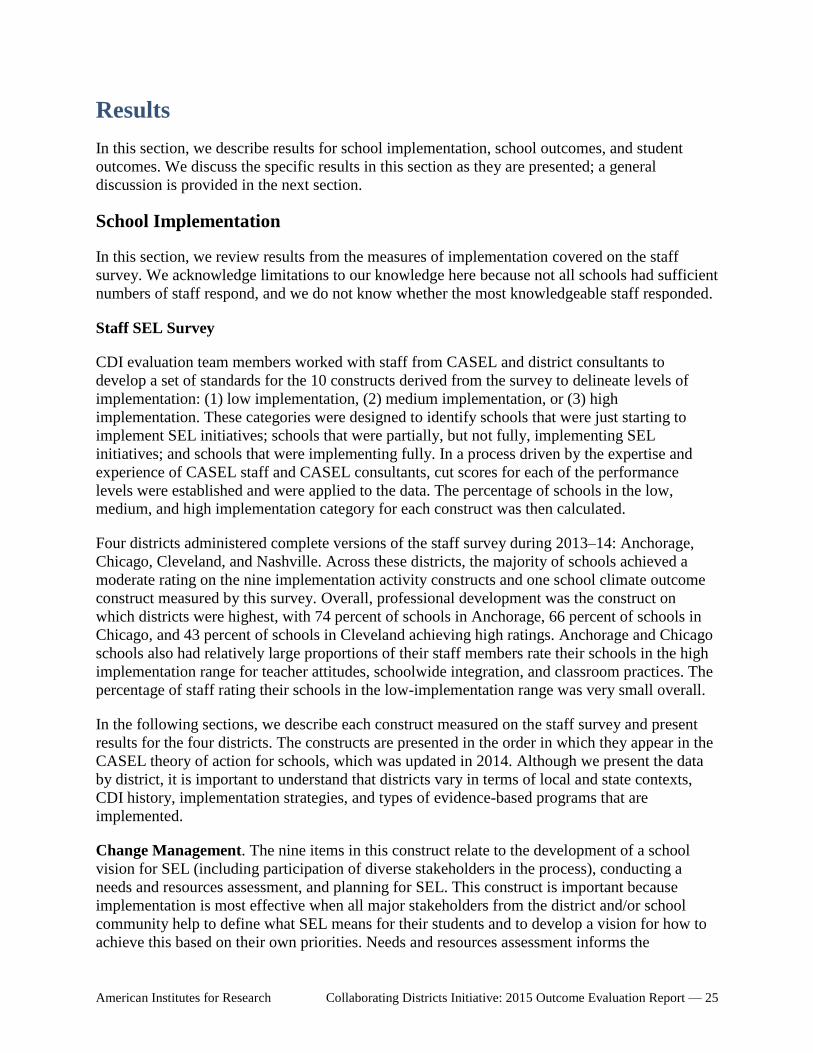
Change Management. The nine items in this construct relate to the development of a school
vision for SEL (including participation of diverse stakeholders in the process), conducting a
needs and resources assessment, and planning for SEL. This construct is important because
implementation is most effective when all major stakeholders from the district and/or school
community help to define what SEL means for their students and to develop a vision for how to
achieve this based on their own priorities. Needs and resources assessment informs the
American Institutes for Research Collaborating Districts Initiative: 2015 Outcome Evaluation Report — 26
development of specific and measurable goals for SEL. Results for the four districts are shown in
Figure 2.
Figure 2. 2014 Staff SEL Survey Results: Change Management
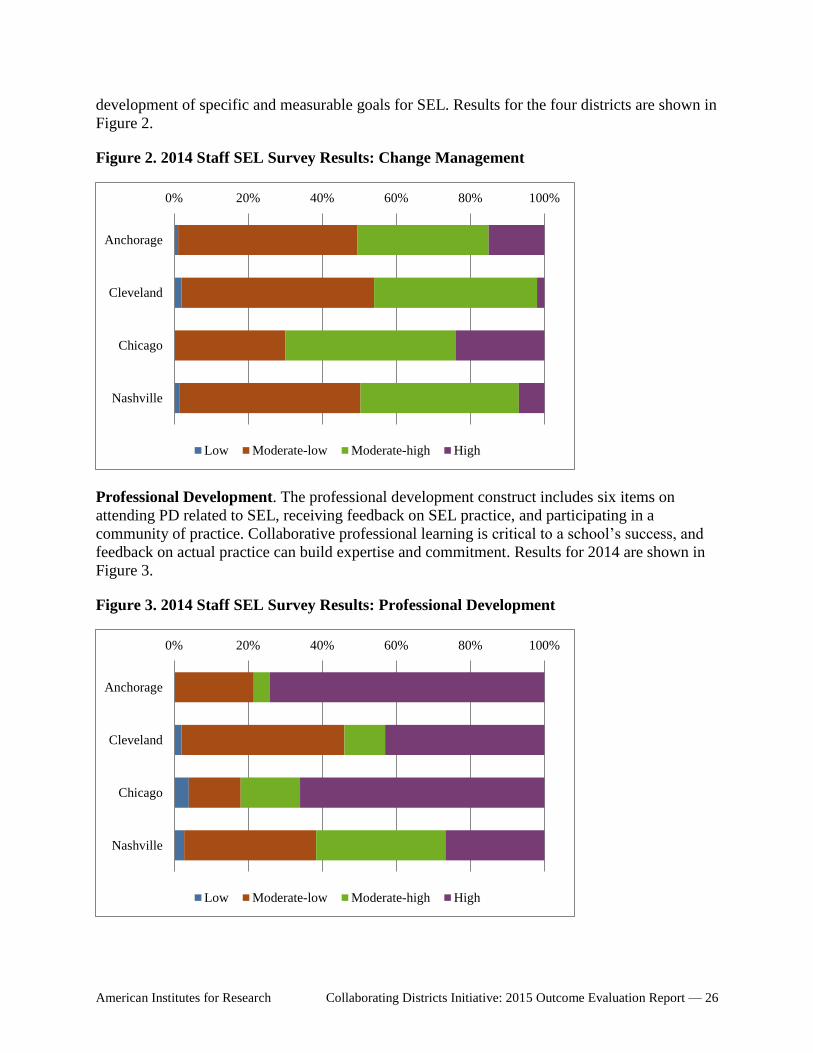
Professional Development. The professional development construct includes six items on
attending PD related to SEL, receiving feedback on SEL practice, and participating in a
community of practice. Collaborative professional learning is critical to a school’s success, and
feedback on actual practice can build expertise and commitment. Results for 2014 are shown in
Figure 3.
Figure 3. 2014 Staff SEL Survey Results: Professional Development
0% 20% 40% 60% 80% 100%
Anchorage
Cleveland
Chicago
Nashville
Low Moderate-low Moderate-high High
0% 20% 40% 60% 80% 100%
Anchorage
Cleveland
Chicago
Nashville
Low Moderate-low Moderate-high High
American Institutes for Research Collaborating Districts Initiative: 2015 Outcome Evaluation Report — 27
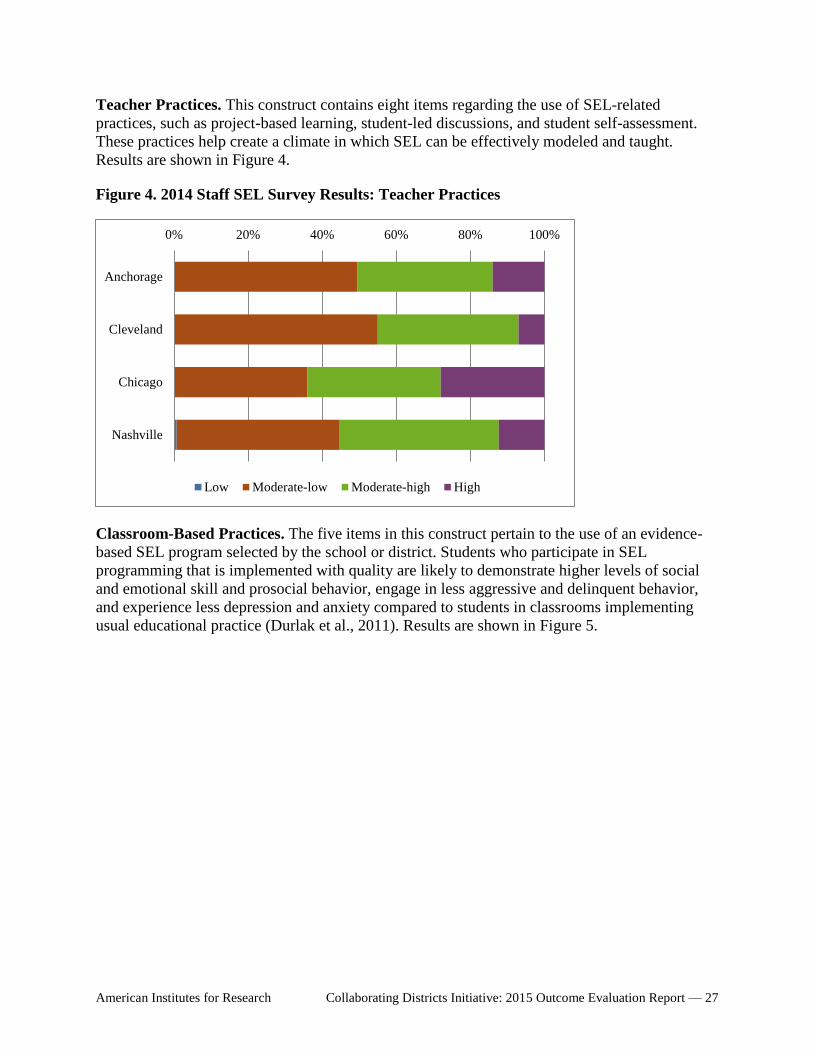
Teacher Practices. This construct contains eight items regarding the use of SEL-related
practices, such as project-based learning, student-led discussions, and student self-assessment.
These practices help create a climate in which SEL can be effectively modeled and taught.
Results are shown in Figure 4.
Figure 4. 2014 Staff SEL Survey Results: Teacher Practices
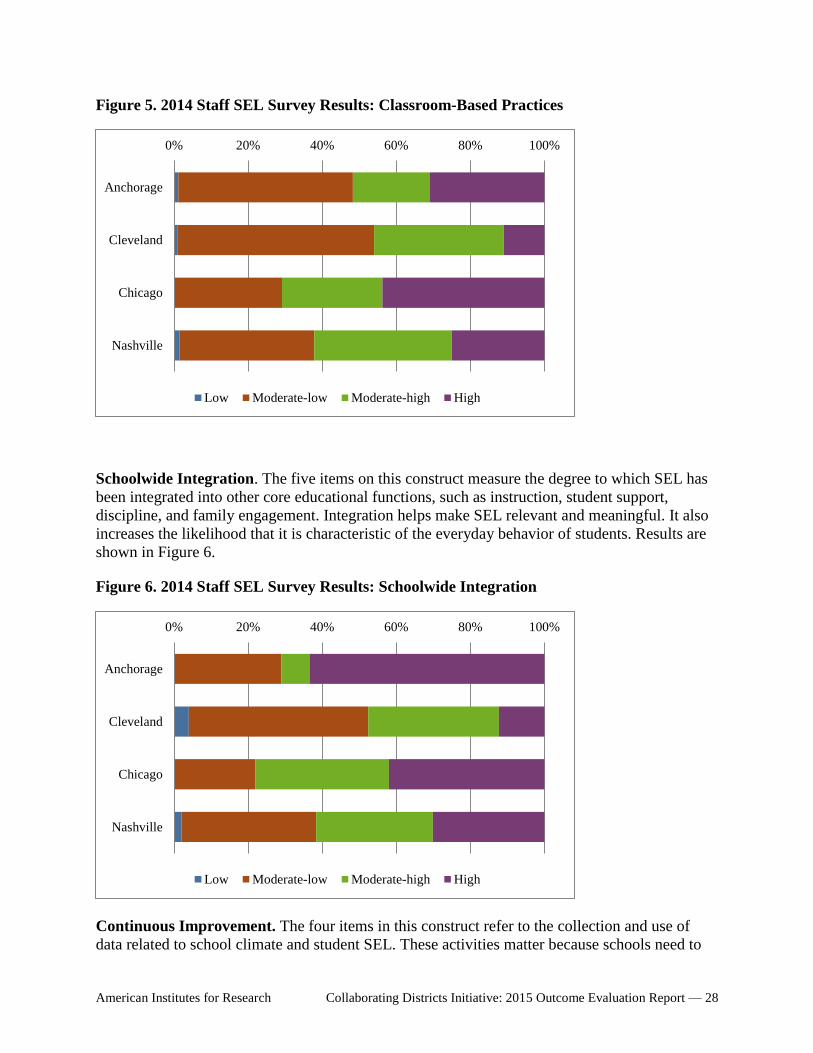
Classroom-Based Practices. The five items in this construct pertain to the use of an evidence-
based SEL program selected by the school or district. Students who participate in SEL
programming that is implemented with quality are likely to demonstrate higher levels of social
and emotional skill and prosocial behavior, engage in less aggressive and delinquent behavior,
and experience less depression and anxiety compared to students in classrooms implementing
usual educational practice (Durlak et al., 2011). Results are shown in Figure 5.
0% 20% 40% 60% 80% 100%
Anchorage
Cleveland
Chicago
Nashville
Low Moderate-low Moderate-high High
American Institutes for Research Collaborating Districts Initiative: 2015 Outcome Evaluation Report — 28
Figure 5. 2014 Staff SEL Survey Results: Classroom-Based Practices
Schoolwide Integration. The five items on this construct measure the degree to which SEL has
been integrated into other core educational functions, such as instruction, student support,
discipline, and family engagement. Integration helps make SEL relevant and meaningful. It also
increases the likelihood that it is characteristic of the everyday behavior of students. Results are
shown in Figure 6.
Figure 6. 2014 Staff SEL Survey Results: Schoolwide Integration
Continuous Improvement. The four items in this construct refer to the collection and use of
data related to school climate and student SEL. These activities matter because schools need to
0% 20% 40% 60% 80% 100%
Anchorage
Cleveland
Chicago
Nashville
Low Moderate-low Moderate-high High
0% 20% 40% 60% 80% 100%
Anchorage
Cleveland
Chicago
Nashville
Low Moderate-low Moderate-high High
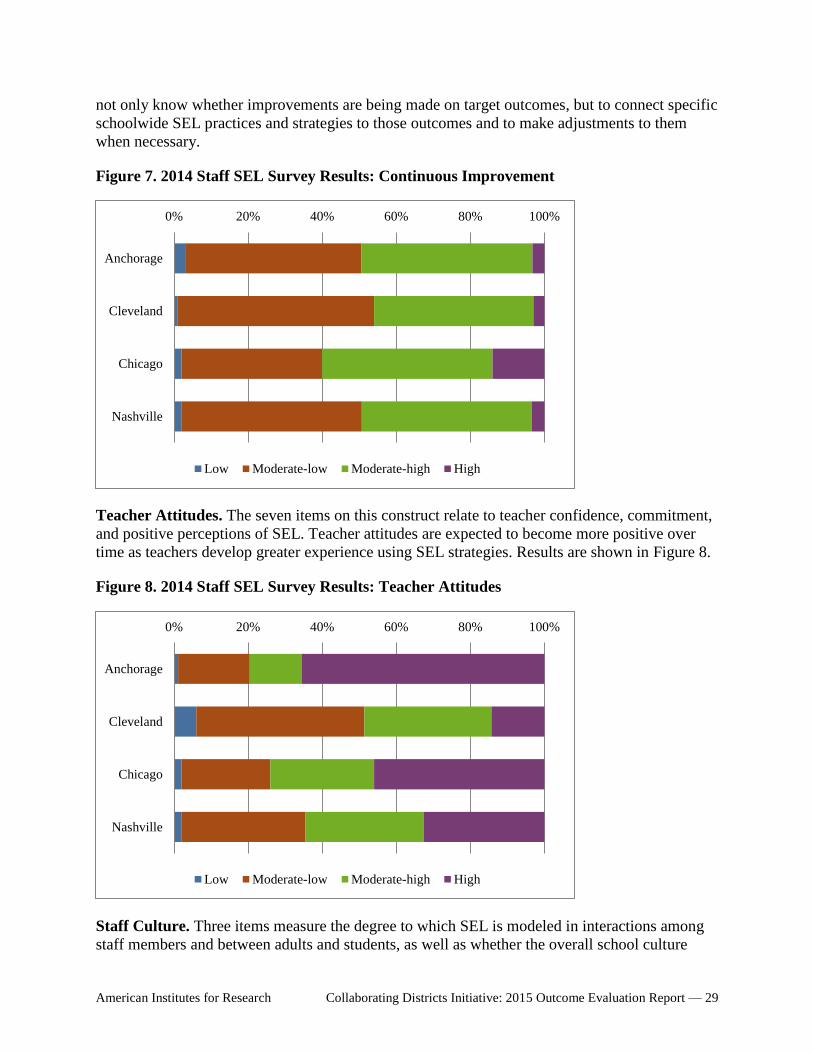
American Institutes for Research Collaborating Districts Initiative: 2015 Outcome Evaluation Report — 29
not only know whether improvements are being made on target outcomes, but to connect specific
schoolwide SEL practices and strategies to those outcomes and to make adjustments to them
when necessary.
Figure 7. 2014 Staff SEL Survey Results: Continuous Improvement
Teacher Attitudes. The seven items on this construct relate to teacher confidence, commitment,
and positive perceptions of SEL. Teacher attitudes are expected to become more positive over
time as teachers develop greater experience using SEL strategies. Results are shown in Figure 8.
Figure 8. 2014 Staff SEL Survey Results: Teacher Attitudes
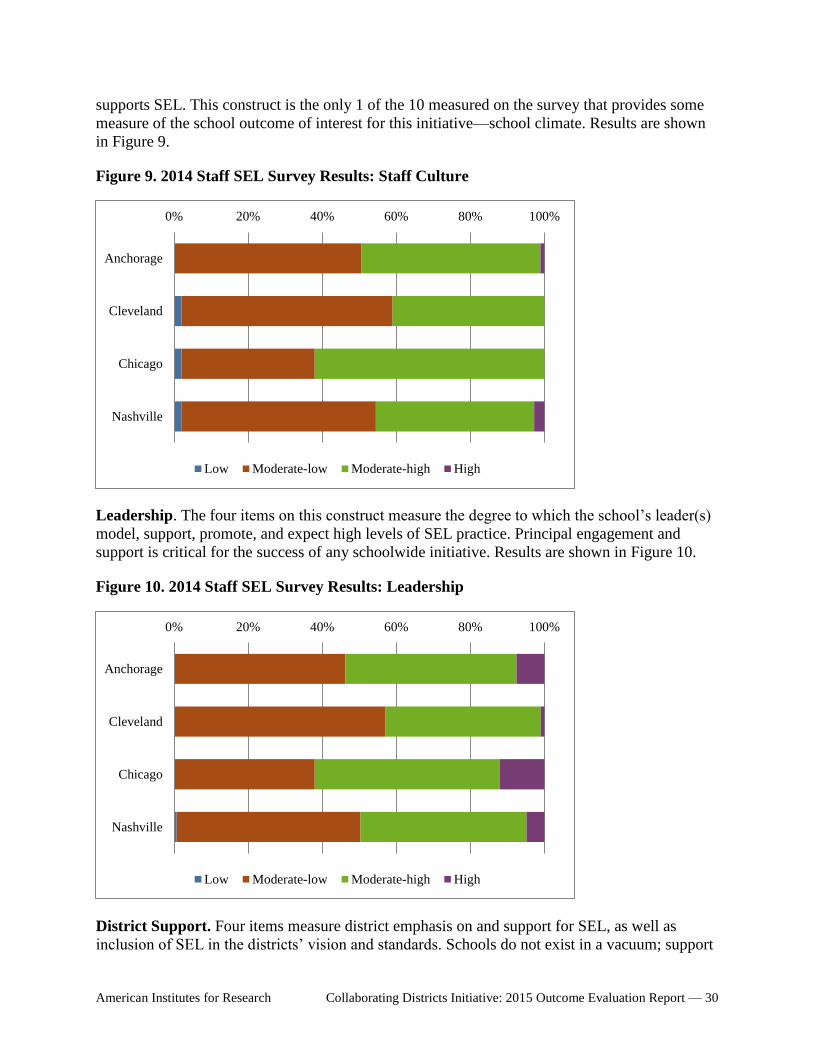
Staff Culture. Three items measure the degree to which SEL is modeled in interactions among
staff members and between adults and students, as well as whether the overall school culture
0% 20% 40% 60% 80% 100%
Anchorage
Cleveland
Chicago
Nashville
Low Moderate-low Moderate-high High
0% 20% 40% 60% 80% 100%
Anchorage
Cleveland
Chicago
Nashville
Low Moderate-low Moderate-high High
American Institutes for Research Collaborating Districts Initiative: 2015 Outcome Evaluation Report — 30
supports SEL. This construct is the only 1 of the 10 measured on the survey that provides some
measure of the school outcome of interest for this initiative—school climate. Results are shown
in Figure 9.
Figure 9. 2014 Staff SEL Survey Results: Staff Culture
Leadership. The four items on this construct measure the degree to which the school’s leader(s)
model, support, promote, and expect high levels of SEL practice. Principal engagement and
support is critical for the success of any schoolwide initiative. Results are shown in Figure 10.
Figure 10. 2014 Staff SEL Survey Results: Leadership
District Support. Four items measure district emphasis on and support for SEL, as well as
inclusion of SEL in the districts’ vision and standards. Schools do not exist in a vacuum; support
0% 20% 40% 60% 80% 100%
Anchorage
Cleveland
Chicago
Nashville
Low Moderate-low Moderate-high High
0% 20% 40% 60% 80% 100%
Anchorage
Cleveland
Chicago
Nashville
Low Moderate-low Moderate-high High
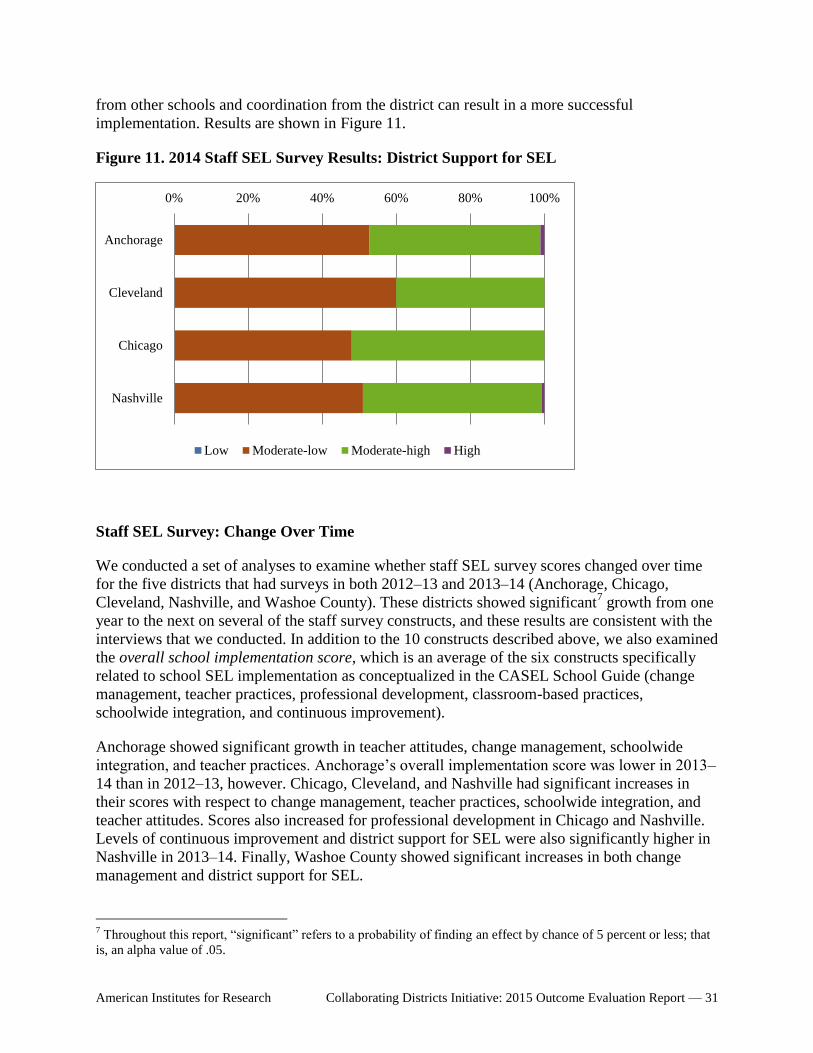
American Institutes for Research Collaborating Districts Initiative: 2015 Outcome Evaluation Report — 31
from other schools and coordination from the district can result in a more successful
implementation. Results are shown in Figure 11.
Figure 11. 2014 Staff SEL Survey Results: District Support for SEL
Staff SEL Survey: Change Over Time
We conducted a set of analyses to examine whether staff SEL survey scores changed over time
for the five districts that had surveys in both 2012–13 and 2013–14 (Anchorage, Chicago,
Cleveland, Nashville, and Washoe County). These districts showed significant7 growth from one
year to the next on several of the staff survey constructs, and these results are consistent with the
interviews that we conducted. In addition to the 10 constructs described above, we also examined
the overall school implementation score, which is an average of the six constructs specifically
related to school SEL implementation as conceptualized in the CASEL School Guide (change
management, teacher practices, professional development, classroom-based practices,
schoolwide integration, and continuous improvement).
Anchorage showed significant growth in teacher attitudes, change management, schoolwide
integration, and teacher practices. Anchorage’s overall implementation score was lower in 2013–
14 than in 2012–13, however. Chicago, Cleveland, and Nashville had significant increases in
their scores with respect to change management, teacher practices, schoolwide integration, and
teacher attitudes. Scores also increased for professional development in Chicago and Nashville.
Levels of continuous improvement and district support for SEL were also significantly higher in
Nashville in 2013–14. Finally, Washoe County showed significant increases in both change
management and district support for SEL.
7 Throughout this report, “significant” refers to a probability of finding an effect by chance of 5 percent or less; that
is, an alpha value of .05.
0% 20% 40% 60% 80% 100%
Anchorage
Cleveland
Chicago
Nashville
Low Moderate-low Moderate-high High
American Institutes for Research Collaborating Districts Initiative: 2015 Outcome Evaluation Report — 32
Staff SEL Survey: Analysis of Responses by Grade Level
AIR examined the extent to which staff teaching different grades levels of students reported
higher or lower implementation across the 10 survey constructs8 as well as the overall
implementation score (the standardized average of the six constructs mapping to the School
Guide). Overall, there were very few differences in SEL implementation constructs as measured
by the staff survey across grade levels. There were many tests conducted in this analysis (4 grade
bands 10 construct scores + 1 computed implementation score = 44 tests for each district),
which increases the chance that some findings may be significant due to chance.
In Anchorage, prekindergarten and elementary school staff scored significantly higher with
respect to teacher attitudes than staff at middle or high schools. Implementation scores were not
statistically significant, but they were higher for the lower grades than for the higher grades.
In Cleveland, implementation and construct scores were generally higher for prekindergarten
staff in comparison to K–12 staff. The differences for professional development and overall
implementation were statistically significant, but the other nine constructs showed no
differences. With respect to implementation, prekindergarten was the highest, and grades in
middle and high schools were relatively lower. This pattern of findings matches what we have
learned from qualitative data collection in the district about implementation. Namely, most SEL
work has been done at PK–8, and relatively little at middle or high school grades. This pattern of
findings suggests that our measure is working as expected.
Chicago analyses included only 51 schools that were originally in the Rock Island and West
Side networks; the whole district was not included. Overall implementation and construct level
scores tended to be higher for staff at the prekindergarten and middle school grade levels than for
staff in elementary or high school grades. However, the only statistically significant difference
based on grade level was for the teacher practice construct. Middle school teachers in Chicago
reported higher implementation of this construct; the other nine were not different across grade
levels.
In Nashville, there were no significant differences across grade levels for nine of the measured
constructs. However, there was a statistically significant difference across grade levels with
respect to teacher attitudes. Prekindergarten was the highest, followed by elementary grades,
with middle and high school grades reporting the lowest scores for teacher attitudes.
School Contrasts: Staff SEL Survey Ratings in Focus and Nonfocus Schools
AIR analyzed the 2014 data for the 10 staff survey constructs and overall implementation score
for differences between SEL focus and nonfocus schools. We included four districts (Anchorage,
Chicago, Nashville and Washoe County) in our analysis. Cleveland administered the staff
survey, but did not have any contrasts available for SEL focus because all elementary schools
implement the PATHS SEL program.
8 The 10 staff survey constructs are described in Table 4. The first six are standardized and averaged together to
form an overall implementation score. The constructs are change management, professional development, teacher
practices, classroom-based practices, schoolwide integration, continuous improvement, teacher attitudes, staff
climate and culture, school leadership, and district support for SEL.
American Institutes for Research Collaborating Districts Initiative: 2015 Outcome Evaluation Report — 33
Across the three districts where we had both focus schools and staff survey data, there were
generally very few differences in staff-reported SEL implementation activities based on whether
the district identified a school as having a particular focus on SEL as part of their CDI work. In
Chicago where there were some differences, the results varied by cohort. As noted in the
description of the study design earlier in this report, the contrast between focus and nonfocus
schools may be weakened if there are effects of districtwide SEL activities in nonfocus schools
(such as new teacher training that includes a focus on SEL, district communications about SEL,
or SEL standards).
Results for specific districts are detailed in the following paragraphs.
In Anchorage, there were 30 SEL focus schools. Significant differences in change management
scores were found when comparing these focus schools to nonfocus schools. No other
statistically significant differences were observed for the 2013–14 staff survey.
In Chicago, there were two cohorts of SEL focus schools. One cohort of 15 schools started in
2012–13 and another 11 in 2013–14. With respect to the computed overall implementation score,
2013–14 focus schools were significantly lower than nonfocus schools and schools that
implemented in 2012–13. Furthermore, significant differences were found based on
implementation status (2012–13, 2013–14, or nonfocus) for 6 of the 10 staff survey constructs.
For five of these six constructs (change management, schoolwide integration, continuous
improvement, teacher practices, and staff culture), 2013–14 focus schools were significantly
lower than nonfocus schools and 2012–13 implementers; the 2012–13 schools were not
significantly different than the nonfocus schools. Schools that implemented in 2012–13 showed
significantly higher professional development scores than nonfocus schools and schools that
implemented in 2013–14.
In Nashville, there were no differences in the computed overall implementation score based on
whether a school was a focus or nonfocus school. Although overall implementation scores did
not differ by group, in general, SEL focus schools were higher on nine of the 10 survey
constructs (except for continuous improvement). Of these nine differences, only one was
statistically significant. Teacher attitudes were higher in SEL focus schools in 2013–14 than in
nonfocus schools.
Washoe County administered enough of the staff survey to have scores for six of the 10 survey
constructs (but not overall implementation). There were no significant differences across these
constructs based on school group.
School Outcome: School Climate
Based on the theory of action for the CDI, the school outcome of interest is school climate. We
know from work we have done in a variety of districts that other school level outcomes are
relevant to the implementation of systemic SEL in school districts, such as school discipline. We
expect to be able to study these in future years for this sample.
In 2014, the AIR team had school climate data that were suitable for ITS analyses from two
districts: Anchorage and Cleveland. In some districts, school climate measures were consistent

American Institutes for Research Collaborating Districts Initiative: 2015 Outcome Evaluation Report — 34
over time, but data were not available for each year (e.g., Oakland, Sacramento). In other
districts, the instrument has changed during the CDI implementation period, limiting the ability
to conduct a longitudinal analysis (e.g., Austin, Chicago, Washoe County). In Nashville, climate
data collection was interrupted due to issues regarding consent.
Effect of the CDI on Student Perceptions of Climate in Anchorage and Cleveland
Longitudinal, student-level data were available for both Anchorage and Cleveland regarding
student perceptions of school climate. In Anchorage, students were administered the School
Climate and Connectedness Survey, with data available from 2005–06 to 2013–14. In Cleveland,
students responded to the Conditions for Learning Survey, for which data were available from
2007–08 through 2013–14.
Each of these surveys measured multiple constructs, which are listed in Table 9.
Table 9. Student School Climate Constructs by District
Anchorage Cleveland
Overall Climate Safe and Respectful Climate
Overall Connectedness Challenge and High Expectations
High Expectations Student Support
School Safety Peer Social and Emotional Competence
School Leadership and Student Involvement
Respectful Climate
Peer Climate
Caring Adults
Parent and Community Involvement
SEL
Student Delinquent Behavior
Student Drug and Alcohol Use
Overall Climate
Anchorage Results
We share the results for Anchorage with a strong caveat: there were anomalies in the numbers of
students taking the survey across years (see Table 10). Starting in 2011, many fewer (about a
third fewer) students took the survey. The same schools participated, but fewer students per
school completed the measure. The drop may be related to the survey having been administered
online beginning that year. The caution we offer is that we cannot sort out whether changes
observed are due to real changes in school climate or due to different students completing the
survey or selection bias as a product of changing the mode of survey administration.
Table 10. Anchorage Students Completing the School Climate and Connectedness Survey
Year Grade 3 Grade 7 Grade 10

American Institutes for Research Collaborating Districts Initiative: 2015 Outcome Evaluation Report — 35
Number of
Students
Change
From Prior
Year
Number of
Students
Change
From Prior
Year
Number of
Students
Change
From Prior
Year
2006 0 3,030 2,581
2007 0 2,562 -15% 2,519 -2%
2008 3,138 2,590 1% 3,025 20%
2009 3,318 6% 2,470 -5% 2,683 -11%
2010 3,180 -4% 2,668 8% 2,427 -10%
2011 2,606 -18% 2,260 -15% 1,490 -39%
2012 2,357 -10% 2,440 8% 2,129 43%
2013 2,395 2% 2,395 -2% 2,292 8%
2014 2,591 8% 1,903 -21% 2,239 -2%
We analyzed student survey scale scores for the 12 constructs on the Climate and Connectedness
Survey. These scores were modeled with a three-level hierarchical linear model, with students
nested in cohorts (school years) and in schools. The model included a linear time trend and
student demographics (gender and race/ethnicity). The model examined the extent to which
student scores deviated from the preintervention trend after the introduction of CDI. The results
of these analyses are summarized here.
After the introduction of CDI:
Students provided significantly higher ratings for overall climate, overall connectedness,
high expectations, school safety, peer climate, caring adults, parent and community
involvement, and social-emotional learning.
Students indicated that there were significantly lower levels of delinquent behavior and
drug and alcohol use in their schools.
Student data showed no statistically significant change for the school-leadership and
student-involvement scale and the respectful-climate scale.
Cleveland Results
For Cleveland, student ratings were available for four constructs on the Conditions for Learning
Survey. Student responses were rated as either “needs improvement,” “adequate,” or “excellent.”
These ratings were modeled with a three-level hierarchical generalized linear model (logistic
ordinal mixed-effects regression), with students nested in cohorts (school years) and in schools.
The model included student demographics (gender, race/ethnicity, student disability status, and
free/reduced-price lunch eligibility status). The model examined the extent to which student
scores deviated from the preintervention trend after the introduction of CDI.
We found that after the introduction of CDI, student reports were significantly higher with
respect to all four elements of school climate measured: safe and respectful climate, challenge,
student support, and peer social and emotional climate.
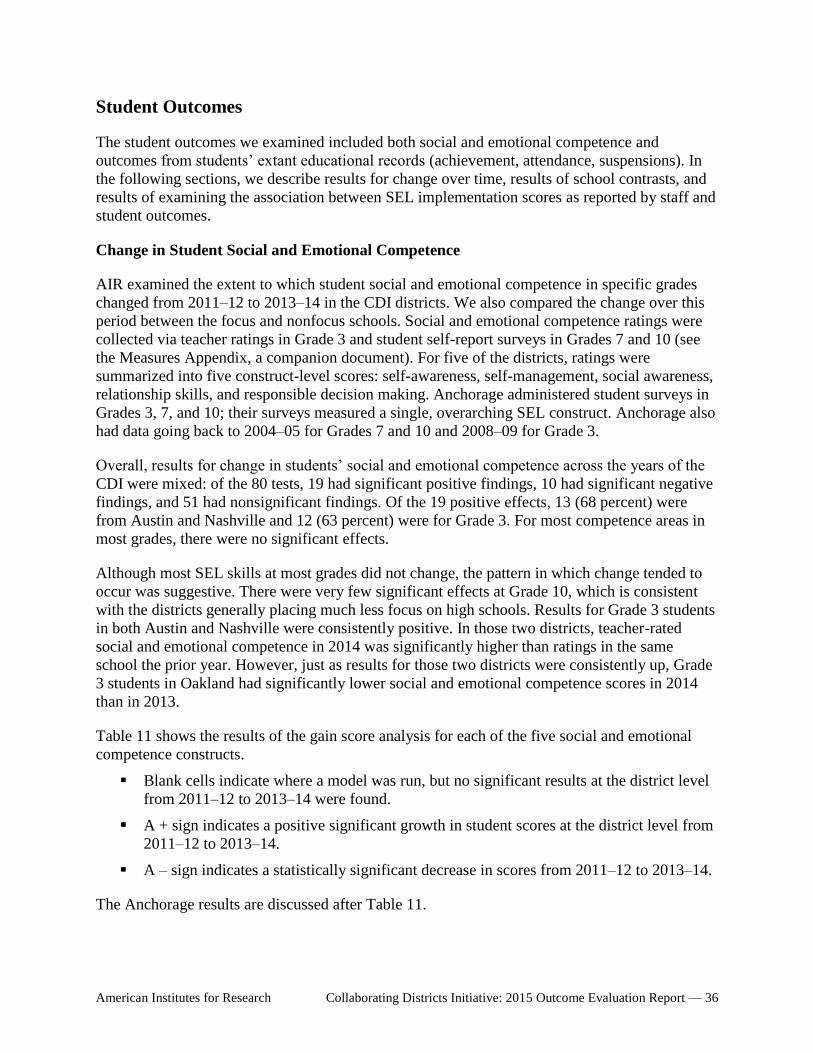
American Institutes for Research Collaborating Districts Initiative: 2015 Outcome Evaluation Report — 36
Student Outcomes
The student outcomes we examined included both social and emotional competence and
outcomes from students’ extant educational records (achievement, attendance, suspensions). In
the following sections, we describe results for change over time, results of school contrasts, and
results of examining the association between SEL implementation scores as reported by staff and
student outcomes.
Change in Student Social and Emotional Competence
AIR examined the extent to which student social and emotional competence in specific grades
changed from 2011–12 to 2013–14 in the CDI districts. We also compared the change over this
period between the focus and nonfocus schools. Social and emotional competence ratings were
collected via teacher ratings in Grade 3 and student self-report surveys in Grades 7 and 10 (see
the Measures Appendix, a companion document). For five of the districts, ratings were
summarized into five construct-level scores: self-awareness, self-management, social awareness,
relationship skills, and responsible decision making. Anchorage administered student surveys in
Grades 3, 7, and 10; their surveys measured a single, overarching SEL construct. Anchorage also
had data going back to 2004–05 for Grades 7 and 10 and 2008–09 for Grade 3.
Overall, results for change in students’ social and emotional competence across the years of the
CDI were mixed: of the 80 tests, 19 had significant positive findings, 10 had significant negative
findings, and 51 had nonsignificant findings. Of the 19 positive effects, 13 (68 percent) were
from Austin and Nashville and 12 (63 percent) were for Grade 3. For most competence areas in
most grades, there were no significant effects.
Although most SEL skills at most grades did not change, the pattern in which change tended to
occur was suggestive. There were very few significant effects at Grade 10, which is consistent
with the districts generally placing much less focus on high schools. Results for Grade 3 students
in both Austin and Nashville were consistently positive. In those two districts, teacher-rated
social and emotional competence in 2014 was significantly higher than ratings in the same
school the prior year. However, just as results for those two districts were consistently up, Grade
3 students in Oakland had significantly lower social and emotional competence scores in 2014
than in 2013.
Table 11 shows the results of the gain score analysis for each of the five social and emotional
competence constructs.
Blank cells indicate where a model was run, but no significant results at the district level
from 2011–12 to 2013–14 were found.
A + sign indicates a positive significant growth in student scores at the district level from
2011–12 to 2013–14.
A – sign indicates a statistically significant decrease in scores from 2011–12 to 2013–14.
The Anchorage results are discussed after Table 11.

American Institutes for Research Collaborating Districts Initiative: 2015 Outcome Evaluation Report — 37
Table 11. Significant Positive or Negative Within-School Change in Social and Emotional
Competence Over Two or Three CDI Implementation Years
District Gra
de
# Y
ears
# S
cho
ols
Sel
f -
Aw
are
nes
s
Sel
f-
Ma
na
gem
ent
So
cial
Aw
are
nes
s
Rel
ati
on
ship
Sk
ills
Res
po
nsi
ble
Dec
isio
n
Ma
kin
g
Austin 3 3 74 + + + + +
7 3 16 –
10 3 9
Cleveland 3 2 68
7 2 66 – –
10 2 26 +
Chicago 3 3 21 + +
7 3 17 – +
10 3 21 –
Nashville 3 3 73 + + + + +
7 2 30 + + +
10 2 14
Oakland 3 2 41 – – – – –
Washoe
County
3 3 41
7 2 74 + +
10 2 16
Note. Cleveland implemented universal SEL programming only at the elementary level; programming was not
available for all students at Grades 7 or 10. Cleveland’s SEL measures from 2012 were not comparable to 2013 or
2014. Oakland provided data for Grade 3 only. Sacramento did not have a consistent measure in use across years.
Anchorage produced a single overall SEL score analyzed at Grades 3, 7, and 10.
Student Social and Emotional Competence Outcomes in Anchorage
Because Anchorage uses a different measure to assess students’ SEL, we analyze this district
separately. Anchorage has used the same SEL scale since 2006, and the pattern of data
availability allow for analysis through ITS. Descriptively, there was quite a large discontinuity
from 2009–10 to 2010–11: starting in 2011, 30 percent fewer students took the survey, more of
those were female, and there was a large increase in SEL scores (a range of 0.14 to 0.35 standard
deviations, averaging 0.24 standard deviations across all grades). The time series analysis
confirmed significant gains between the three CDI implementation years and the three years
before the planning phase for all grades, including the three grades modeled for this evaluation.
The improvement over time was largest in Grade 7.
The changes in the numbers of students responding to this survey over time, particularly the drop
from 19,212 respondents in 2010 to 13,531 in 2011 (when the survey mode changed from paper

American Institutes for Research Collaborating Districts Initiative: 2015 Outcome Evaluation Report — 38
to online) make it difficult to interpret the results with confidence. The change was not plausibly
driven by the CDI, since the large increase occurred before the planning phase began.
Subgroup Findings for Change in Social and Emotional Competence
The change analyses described above aim to determine whether there was change for students
overall. In addition, we look for variation in impact by student gender and ethnicity. In
particular, we looked at social and emotional competence for female, male, African-American,
Alaska Native/American Indian, Hispanic/Latino, and White students. Table 12 shows the
results. Of 450 tests run for these subgroup analyses, 343 (76 percent) showed no statistically
significant change over time; 71 (16 percent) showed positive change over time; and 36 (8
percent) showed declines over time.
Table 12. Subgroup Results: Significant Positive or Negative Change in Social and
Emotional Competence
District Su
bgro
up
Gra
de
n
Sel
f-
Aw
are
nes
s
Sel
f-
Man
agem
ent
Soci
al
Aw
are
nes
s
Rel
ati
on
ship
Sk
ills
Res
pon
sib
le
Dec
isio
n
Mak
ing
Austin Female 3 1,578
7 3,776 –
10 2,011 + + +
Male 3 1,614 + + + + +
7 3,378
10 1,808
African
American
3 283
7 433 –
10 247
Alaska
Native or
American
Indian
7 39
10 10
Latino 3 1,790 + + + + +
7 4,088
10 2,004
White 3 988
7 1,958
10 1,214
Cleveland Female 3 900
7 2,173 –
10 1,936 + –
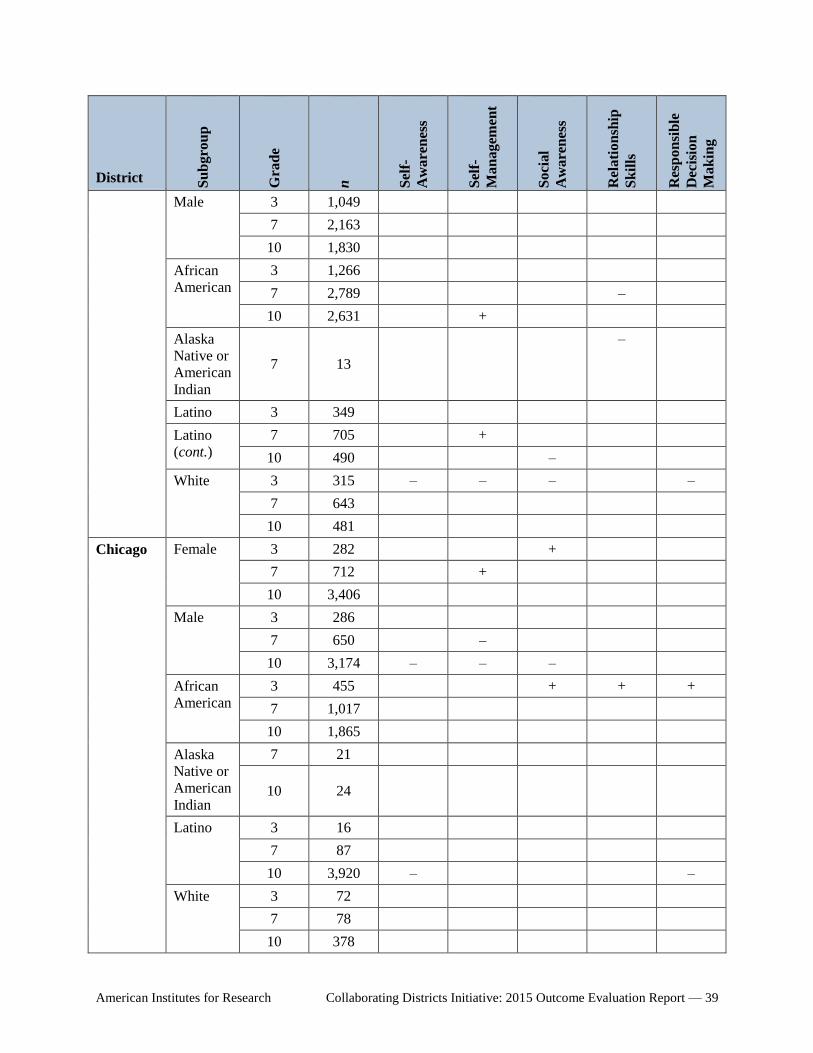
American Institutes for Research Collaborating Districts Initiative: 2015 Outcome Evaluation Report — 39
District Su
bg
rou
p
Gra
de
n
Sel
f-
Aw
are
nes
s
Sel
f-
Ma
na
gem
ent
So
cial
Aw
are
nes
s
Rel
ati
on
ship
Sk
ills
Res
po
nsi
ble
Dec
isio
n
Ma
kin
g
Male 3 1,049
7 2,163
10 1,830
African
American
3 1,266
7 2,789 –
10 2,631 +
Alaska
Native or
American
Indian
7 13
–
Latino 3 349
Latino
(cont.)
7 705 +
10 490 –
White 3 315 – – – –
7 643
10 481
Chicago Female 3 282 +
7 712 +
10 3,406
Male 3 286
7 650 –
10 3,174 – – –
African
American
3 455 + + +
7 1,017
10 1,865
Alaska
Native or
American
Indian
7 21
10 24
Latino 3 16
7 87
10 3,920 – –
White 3 72
7 78
10 378
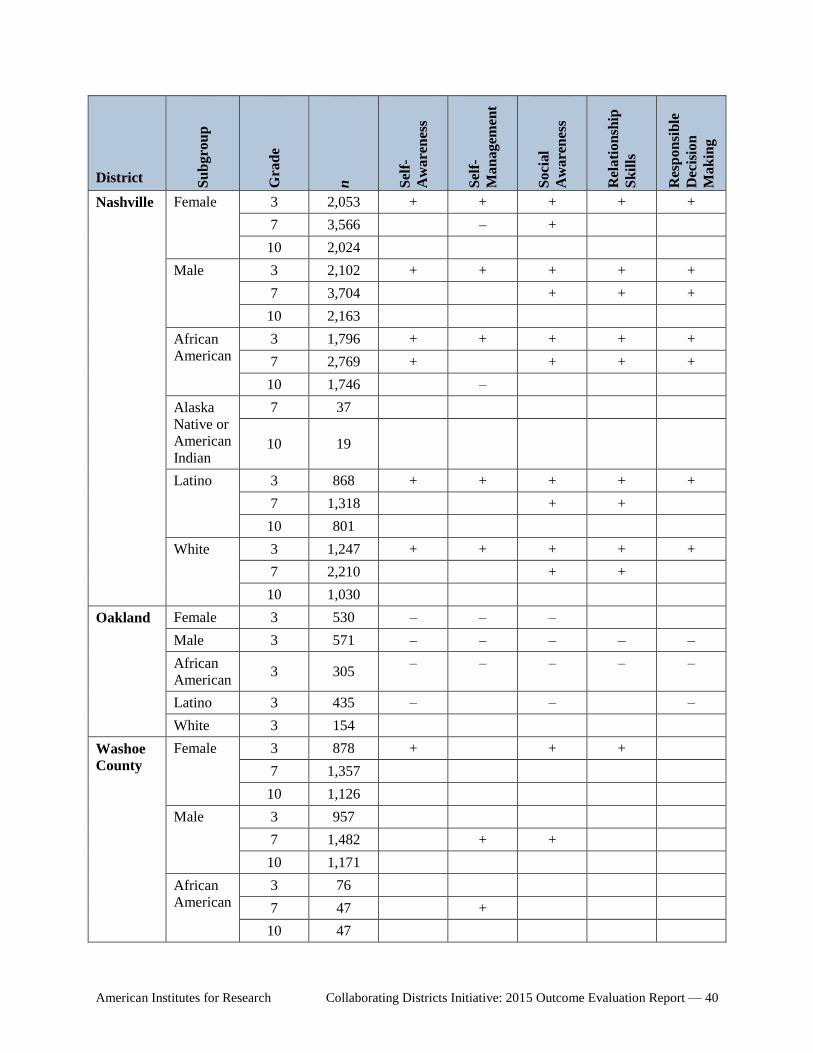
American Institutes for Research Collaborating Districts Initiative: 2015 Outcome Evaluation Report — 40
District Su
bg
rou
p
Gra
de
n
Sel
f-
Aw
are
nes
s
Sel
f-
Ma
na
gem
ent
So
cial
Aw
are
nes
s
Rel
ati
on
ship
Sk
ills
Res
po
nsi
ble
Dec
isio
n
Ma
kin
g
Nashville Female 3 2,053 + + + + +
7 3,566 – +
10 2,024
Male 3 2,102 + + + + +
7 3,704 + + +
10 2,163
African
American
3 1,796 + + + + +
7 2,769 + + + +
10 1,746 –
Alaska
Native or
American
Indian
7 37
10 19
Latino 3 868 + + + + +
7 1,318 + +
10 801
White 3 1,247 + + + + +
7 2,210 + +
10 1,030
Oakland Female 3 530 – – –
Male 3 571 – – – – –
African
American 3 305
– – – – –
Latino 3 435 – – –
White 3 154
Washoe
County
Female 3 878 + + +
7 1,357
10 1,126
Male 3 957
7 1,482 + +
10 1,171
African
American
3 76
7 47 +
10 47
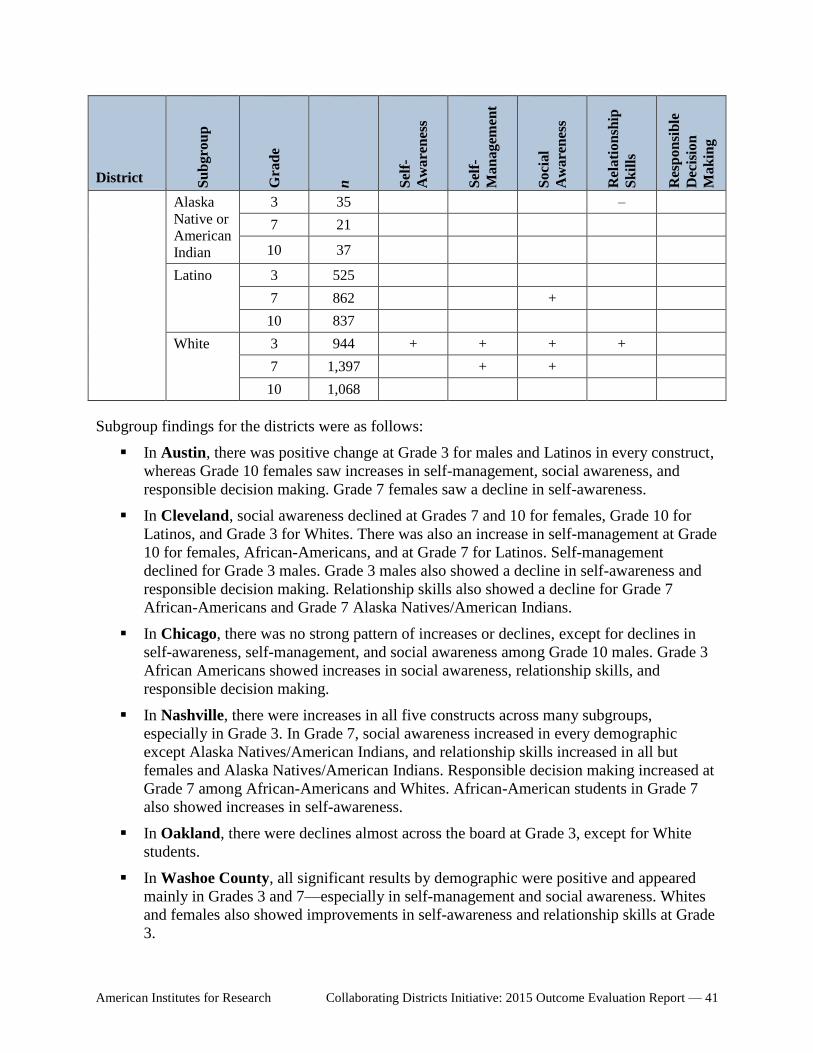
American Institutes for Research Collaborating Districts Initiative: 2015 Outcome Evaluation Report — 41
District Su
bg
rou
p
Gra
de
n
Sel
f-
Aw
are
nes
s
Sel
f-
Ma
na
gem
ent
So
cial
Aw
are
nes
s
Rel
ati
on
ship
Sk
ills
Res
po
nsi
ble
Dec
isio
n
Ma
kin
g
Alaska
Native or
American
Indian
3 35 –
7 21
10 37
Latino 3 525
7 862 +
10 837
White 3 944 + + + +
7 1,397 + +
10 1,068
Subgroup findings for the districts were as follows:
In Austin, there was positive change at Grade 3 for males and Latinos in every construct,
whereas Grade 10 females saw increases in self-management, social awareness, and
responsible decision making. Grade 7 females saw a decline in self-awareness.
In Cleveland, social awareness declined at Grades 7 and 10 for females, Grade 10 for
Latinos, and Grade 3 for Whites. There was also an increase in self-management at Grade
10 for females, African-Americans, and at Grade 7 for Latinos. Self-management
declined for Grade 3 males. Grade 3 males also showed a decline in self-awareness and
responsible decision making. Relationship skills also showed a decline for Grade 7
African-Americans and Grade 7 Alaska Natives/American Indians.
In Chicago, there was no strong pattern of increases or declines, except for declines in
self-awareness, self-management, and social awareness among Grade 10 males. Grade 3
African Americans showed increases in social awareness, relationship skills, and
responsible decision making.
In Nashville, there were increases in all five constructs across many subgroups,
especially in Grade 3. In Grade 7, social awareness increased in every demographic
except Alaska Natives/American Indians, and relationship skills increased in all but
females and Alaska Natives/American Indians. Responsible decision making increased at
Grade 7 among African-Americans and Whites. African-American students in Grade 7
also showed increases in self-awareness.
In Oakland, there were declines almost across the board at Grade 3, except for White
students.
In Washoe County, all significant results by demographic were positive and appeared
mainly in Grades 3 and 7—especially in self-management and social awareness. Whites
and females also showed improvements in self-awareness and relationship skills at Grade
3.

American Institutes for Research Collaborating Districts Initiative: 2015 Outcome Evaluation Report — 42
It is worth emphasizing that these change analyses do not follow individual students over time,
but rather track the SEL skills for students in the same grades each year. These analyses are
appropriate over multiple years, since the unit of interest for this broad initiative is the school,
not the particular student. However, changes in the composition of student cohorts over shorter
periods of time may influence these results. With more years of data going forward, we expect
this source of noise in our data to stabilize.
School Contrasts: Change in Student Social and Emotional Competence in Focus and
Nonfocus Schools
The AIR evaluation team examined the social and emotional competence scores for students in
focus schools in comparison with students in nonfocus schools in Chicago and Washoe County.
Data availability was limited as described earlier. Scores were modeled to look for differences
between the two school types in overall scores. These analyses addressed the question, “Does
social and emotional competence change more in focus schools within the CDI districts?”
The results showed that the difference between focus schools and nonfocus schools was not
significant in any district or grade for any of the five SEL skills. There were two marginally
significant results: in Washoe County at Grade 10 self-awareness and self-management showed
marginally significant (p < 0.10) differences in the rate of improvement over the years measured.
School Contrasts: Subgroup Results for Change in Social and Emotional Competence
Social and emotional competence across the five constructs in focus and nonfocus schools was
analyzed by student subgroup. Overall, every demographic showed largely no difference
between the focus and nonfocus schools either in level or in change over time. This is similar to
the results shown earlier when students were aggregated across subgroups.
Subgroup findings for the districts were as follows:
In Chicago, there were positive differences between focus and nonfocus schools at Grade
7 in self-awareness for Latinos and negative differences in the increase in student SEL for
the same group. There was a positive, marginally significant difference (p < 0.10), at
Grade 10 for African Americans in social awareness and a negative marginally
significant difference in the same group in the increase in social awareness as well as an
increase in relationship skills. Continuing to compare focus to nonfocus schools, students
identified as Alaska Natives or American Indian also showed a negative difference in the
increase of responsible decision making as well as a marginally significant decrease in
relationship skills.
In Washoe County, there were no statistically significant (p < 0.05) differences between
focus and non-focus schools in either the level of student SEL or the increase in student
SEL for any subgroup in Washoe County. There were several marginally significant (p <
0.10) differences between student SEL in focus and non-focus schools, including a
negative difference in student SEL at grade 10 in self-management and relationship skills
as well as a positive difference in the increase in self-awareness at Grade 10 for males
and in the increase in self-management at Grade 10 for whites.

American Institutes for Research Collaborating Districts Initiative: 2015 Outcome Evaluation Report — 43
Association of School SEL Implementation Activities and Student Social and Emotional
Competence
A consistent body of research has indicated that implementation is a critical factor in whether an
initiative implemented at a higher level of organization, such as a district or a school, is
successful in realizing improvements at the student level (Berends, Bodilly, & Kirby, 2002;
Cuban, 2010; Garet et al., 2008). To determine whether schools engaged in higher levels of SEL
implementation had students with higher levels of social and emotional skills, we examined the
relation between school aggregate SEL implementation scores (the combined measure of school
implementation constructs and Staff Climate and Culture) and student social and emotional
outcomes in Grades 3, 7, and 10 (measured via teacher report in Grade 3 and student self-report
in Grades 7 and 10). Student SEL competence scores were calculated for all five constructs: self-
awareness, self-management, social awareness, relationship skills, and responsible decision
making. In Anchorage, a different SEL measure was administered, and only a single, overall
SEL construct score was generated. Models were fit for each grade for each of six districts
(Anchorage, Cleveland, Chicago, Nashville, and Washoe County) and included the social and
emotional competence scores.
Table 13 shows the results of our analysis. Overall, the results show a positive association
between staff-reported SEL implementation and student SEL competence scores. There were no
negative effects, only significantly positive relations or associations that were not significant.
There was variation within district between grades, although no pattern for particular grades
emerged. In districts where the staff SEL implementation score was positively correlated with
almost every construct, the only construct that did not show such a correlation was self-
awareness.
Grades in districts with entirely positive or almost entirely positive results include Grade 10 in
Anchorage (not shown in table), Grade 3 in Cleveland, Grades 3 and 7 in Chicago, Grade 10 in
Nashville, and Grades 3 and 10 in Washoe County.
Table 13. Association of School SEL Implementation Activities and Student Social and
Emotional Competence
District Gra
de
# Y
ears
in
An
aly
sis
# S
cho
ols
in
An
aly
sis
Sel
f -
Aw
are
nes
s
Sel
f-
Ma
na
gem
ent
So
cial
Aw
are
nes
s
Rel
ati
on
ship
Sk
ills
Res
po
nsi
ble
Dec
isio
n
Ma
kin
g
Cleveland 3 2 67 + + + + +
7 2 69
10 2 27
Chicago 3 3 25 + + + + +
7 3 23
+ + + +
10 3 24
Nashville 3 3 77

American Institutes for Research Collaborating Districts Initiative: 2015 Outcome Evaluation Report — 44
District Gra
de
# Y
ears
in
An
aly
sis
# S
cho
ols
in
An
aly
sis
Sel
f -
Aw
are
nes
s
Sel
f-
Ma
na
gem
ent
So
cial
Aw
are
nes
s
Rel
ati
on
ship
Sk
ills
Res
po
nsi
ble
Dec
isio
n
Ma
kin
g
7 2 38
10 2 19 + + + + +
Washoe
County
3 2 51 + + + + +
7 2 69
10 2 20 + + + +
Note. Anchorage has a single SEL construct that has shown positive change in the three CDI implementation years
relative to the trend in the three years prior to the CDI. This analysis is described in the text.
Student Outcomes From Extant Student Records
The impact of CDI on student academic and behavioral outcomes was analyzed for all eight
districts in the study. Academic outcomes include reading and mathematics standardized test
scores and grade point average (GPA). Behavioral outcomes include attendance, suspensions,
and expulsions. The available outcomes (with sufficient longitudinal data) vary across district.
The outcomes included for each district are listed in earlier in this report in the Methods section
(Table 15).
These districtwide analyses constitute a relatively blunt test of the CDI. No district was targeting
every school for improvement in SEL, and in all districts other initiatives (e.g., Common Core
State Standards, changes in teacher and school leader evaluation systems) and historical factors
(e.g., local recession and recovery) likely influenced these outcomes. The purpose of these
districtwide intent-to-treat analyses is to discern whether there are common patterns of change
across different districts, each with its own context, as they implement the CDI in their own
ways. Overall, we saw that findings for students’ academic performance were more positive in
CDI implementation years than in the three years before CDI in Cleveland, Chicago, and
Nashville. In Washoe County, achievement was higher in the first year, but lower in the second.
Findings for attendance were mixed, but outcomes for discipline9 were more positive (Austin and
Cleveland showed improvements; there was no change in Nashville; in Washoe County,
suspensions were higher after the CDI started).
The change in student outcomes since the inception of CDI is presented separately for each
district.
Anchorage. As a Cohort 1 district, Austin started planning in 2010–11, and therefore has
three years of implementation extant data (2011–12, 2012–13, and 2013–14). AIR had
sufficient data to examine changes at the district level in reading and mathematics
achievement (Grades 3–8 SBA proficiency and Grades 10–12 HSGQE proficiency),
student graduation, the number of disciplinary referrals, and dropouts.
9 Note that when we discuss discipline outcomes, we are referring to counts of suspensions or expulsions. This
report does not examine disparities in discipline outcomes.

American Institutes for Research Collaborating Districts Initiative: 2015 Outcome Evaluation Report — 45
• The number of disciplinary referrals was significantly higher in the first two years
after implementation of CDI.
• There was a higher dropout rate in the first year after CDI implementation, but no
significant differences in the two following years from the pretrend.
• Mathematics SBA proficiency rates (Grades 3–10) were significantly higher in the
second year of implementation, but not significantly different from baseline in years 1
or 3 post implementation.
• Mathematics HSGQE proficiency (Grades 10–12) was significantly lower in all three
postimplementation years.
• Reading SBA proficiency rates (Grades 3–10) were significantly lower in year 2 and
significantly higher in Year 3.
• Reading HSGQE proficiency (Grades 10–12) was significantly lower in all three
postimplementation years.
Austin. As a Cohort 1 district, Austin started planning in 2010–11, and therefore has
three years of implementation extant data (2011–12, 2012–13, and 2013–14). AIR was
able to examine changes in attendance, suspensions, and expulsions in Austin. Because
Texas switched achievement tests from TAKS to STAAR at the same time of the
intervention, the district-level ITS could not examine changes in achievement (due to the
change in test score metric). However, achievement changes are examined within-district
(with respect to SEL focus and non-SEL focus schools) later in this report.
• The attendance rate was significantly higher in the first two years after
implementation of CDI than it was prior to implementation. In the third year,
attendance was significantly lower than pre-CDI.
• The number of students suspended at least once were significantly lower in all
postimplementation years.
• Expulsions were significantly lower in the second and third years after
implementation.
Cleveland. As a Cohort 1 district, Cleveland started planning in 2010–11, and has three
years of implementation extant data (2011–12, 2012–13, and 2013–14). Extant data from
Cleveland included reading and mathematics achievement scores, GPA, and suspensions.
• Reading and mathematics scale scores were significantly higher in all three years
after CDI implementation in comparison to scores prior to CDI implementation.
• Student GPAs were higher in all three years after CDI implementation. The first two
years, although higher, were only marginally statistically significant. Year 3 was
significantly higher than the pre-CDI average GPA.
• Student suspensions were significantly lower in the first and third year after CDI
implementation. However, in the second year after CDI (2012–13), the number of
students suspended at least once was significantly higher than in the years prior to
CDI.
American Institutes for Research Collaborating Districts Initiative: 2015 Outcome Evaluation Report — 46
Chicago. As a Cohort 2 district, Chicago started planning in 2011–12, and has two years
of implementation extant data (2012–13 and 2013–14). AIR had sufficient data to
measure post-CDI changes in reading and mathematics achievement, GPA, and
attendance.
• Reading and mathematics scores were significantly higher in both the first and second
year after CDI implementation than in the years prior to implementation.
• GPA was significantly higher in both years after implementation of the initiative.
• Attendance rates were significantly lower in both post-implementation years
Nashville. As a Cohort 2 district, Nashville began planning in 2011–12 and has two years
of implementation data (2012–13 and 2013–14). AIR was able to examine changes in
reading and mathematics scores, Algebra 1 scores, English 1 and 2 scores, GPA,
attendance, suspensions, and expulsions.
• Scores for Algebra 1, English 1, Reading (Grades 3–8), and Mathematics (Grades 3–
8) were significantly higher in both years after the implementation in CDI than in
years prior to the initiative. English 2 scores were also significantly higher in the
second year after implementation.
• GPA was significantly higher the second year after CDI implementation.
• The attendance rate was significantly higher both years after the implementation of
CDI than prior to CDI.
• There were no significant changes observed for either suspensions or expulsions.
Washoe County. As a Cohort 2 district, Washoe County began planning during 2011–12
and has two years of implementation data (2012–13 and 2013–14). Longitudinal data
existed to examine student outcomes with respect to reading and mathematics
achievement scores, as well as student suspensions.
• Changes in reading and mathematics scores after the implementation of CDI were
mixed. Scores were significantly higher in the first post-CDI year, but significantly
lower in the second year postimplementation.
• Suspensions were significantly higher in the first two years after the implementation
of CDI than in the years prior to the initiative.
School Contrasts: Student Outcomes From Extant Student Record Data
In addition to the main ITS models for each district, AIR also examined the extent to which post
CDI-implementation change in student academic and behavioral outcomes differed between
those schools identified by the districts as having an SEL focus, and other schools. As described
in the methods section of this report, these analyses were conducted using multiple baseline
CITS models. Results are presented for the six districts with SEL focus schools (Cleveland and
Oakland do not have contrasts available).
As reported earlier, the schools that the districts have labeled as focusing on SEL did not have
different staff-reported SEL implementation scores than did other schools. The contrasts may
have been weakened by districtwide effects, other schools may be engaged in their own SEL
American Institutes for Research Collaborating Districts Initiative: 2015 Outcome Evaluation Report — 47
efforts, or some focus schools may have had low levels of SEL implementation. The analyses
show that schools with focus or nonfocus designations were not very different with respect to
students’ educational outcomes.
Anchorage. There are two separate cohorts of SEL focus schools in Anchorage (starting
in 2011–12 and 2012–13).
• Schools implementing an SEL-focused approach (called the SEL Implementation and
Sustainability Process, or ISP) in 2011–12 had higher graduation rates in the CDI
implementation period than schools not implementing the CDI-related ISP.
• Reading proficiency rates were significantly higher in the CDI implementation period
(Grades 7 and 8) for schools starting an SEL-focused approach in 2012–13 in
comparison to schools not implementing such an approach.
Austin. There were three separate cohorts of SEL-focused schools in Austin (starting in
2011–12, 2012–13, and 2013–14).
• There were no significant differences between SEL focus and non-SEL focus schools
with respect to reading and mathematics achievement, suspensions, or expulsions.
• Attendance differences between SEL focus and non-SEL focus schools were mixed.
During their first year of SEL implementation, focus schools showed significantly
higher attendance rates. However, in the second year of implementation, attendance
was significantly lower. Schools in their third year of implementation of SEL focus
activities showed no significant changes from preimplementation in comparison to
non-SEL focus schools.
Chicago. Chicago had two cohorts of SEL focus schools (starting in 2012–13 and 2013–
14).
• There were no significant differences between SEL focus and non-SEL focus schools
with respect to reading test scores, mathematics test scores, or GPA.
• During their second year of implementation, attendance was significantly lower in
SEL focus schools than in non-SEL focus schools.
Nashville. There was a single cohort of SEL focus implementing schools which started in
2013–14 in Nashville.
• Attendance was higher in SEL focus schools post CDI implementation, although the
result was only marginally significant.
• Mathematics scores were significantly higher in 2012–13 for SEL focus schools in
comparison to nonfocus schools. However, no significant differences were found for
2013–14. There were no significant differences for ELA.
Washoe County: There was one cohort of SEL focus schools, which started in 2012–13
in Washoe County. No significant differences were found based on school group with
respect to reading scores, mathematics scores, or suspensions.

American Institutes for Research Collaborating Districts Initiative: 2015 Outcome Evaluation Report — 48
Association of School SEL Implementation Activities and Student Outcomes From Extant
Student Record Data
AIR analyzed the extent to which implementation scores based on the staff survey predicted
student academic and behavior scores. To conduct this analysis, implementation scores from the
staff survey from 2012–13 and 2013–14 were aggregated to the school level and then fit as
predictors of student outcomes in a multilevel regression model, which controlled for student
demographics. Four districts administered the full staff survey in 2013–14, allowing for
calculation of the overall implementation score (Anchorage, Chicago, Cleveland, and Nashville).
Anchorage. In 2013–14, schools with higher implementation scores tended to have
significantly lower numbers of disciplinary referrals than schools with lower
implementation scores.
Cleveland. Schools with higher implementation scores tended to have significantly
higher reading and mathematics scores on state achievement tests. In addition, GPAs
were higher and suspensions were lower in schools with greater overall implementation
scores.
Chicago. There were no significant differences in students reading scores, mathematics
scores, attendance, or GPA in relation to the overall school SEL implementation score
from the staff survey.
Nashville. GPAs and mathematics scores (but not reading scores) were significantly
higher in schools with higher implementation scores. Attendance was higher and
suspensions were lower in schools with greater overall implementation scores. However,
Algebra 1 scores were significantly lower in higher-implementing schools.
Implementation Contrasts
To extend our understanding of how our measure of implementation was related to students’
educational outcomes, we conducted an exploratory analysis that involved identifying the 20
percent of schools with the highest implementation scores and contrasting outcomes with those
schools that were in the lowest 20 percent for SEL implementation. We then applied our quasi-
experimental CITS model, which includes student-level covariates (for gender and
race/ethnicity), cohort-level covariates, and random effects at the school level. Results for each
district with data appropriate for this analysis are as follows:
In Anchorage, there were no significant differences between high- and low-
implementation schools with respect to any extant variable.
In Cleveland, high-implementation schools were significantly higher in mathematics (all
Grades 3–8), but significantly lower in GPA in the years following CDI implementation.
In Chicago, high-implementation schools were significantly higher in reading (all Grades
3–8) and GPA in the second year of implementation.
In Nashville, high-implementation schools were significantly higher in English 1
proficiency in the second year of CDI implementation.

American Institutes for Research Collaborating Districts Initiative: 2015 Outcome Evaluation Report — 49
General Discussion
The implementation report stated that “Implementation findings for the CDI are consistently
positive,” and that based upon AIR’s examination of the implementation rubric, that districts are
progressing overall and are continuing to achieve higher levels of SEL implementation each
year.” This outcomes report, based on two and three years of implementation of this district-level
initiative, has begun to show some positive results as well as continuing to show a larger number
of non-significant and a few negative findings. School climate which was the one school level
indicator of interest in the CASEL theory of action, has continued to show gains in the two
districts with stable climate measures. Although improvement in students’ social and emotional
competence showed a mixed picture overall, four measured districts (Anchorage, Austin,
Chicago, and Nashville) showed consistent improvement in skills for students in Grade 3. Most
analyses by demographic subgroups showed no changes in SEL skills over time. Achievement
improved consistently across subjects and years in three out of four districts measured and
superintendents and chief academic officers reported that the focus on SEL was contributing
both to teacher quality and student’s ability to demonstrate the academic behaviors demanded by
the deeper learning and the Common Core State Standards. Findings for attendance were mixed,
but discipline outcomes generally were more positive during the CDI implementation period than
in the years before the planning phase, and superintendents perceived that SEL was contributing
to reductions in exclusionary discipline. Implementation appears to matter, and when we
examined how student outcomes related to implementation, we found that for two out of three
districts where we could do these analyses, there were positive associations between
implementation and student outcomes. Our analyses did not discern significant differences
between the focus and non-focus schools in terms of teacher survey reports and student
outcomes.
In this section, we dig more deeply into the quantitative results from our analysis of school and
student outcomes. Our analysis plan involved the systematic progression from intent-to-treat
analyses to analyses of outcomes as a function of school implementation. The broadest tests were
of districtwide effects on student educational outcomes. These were followed by tests (where
feasible) of schools that districts had identified as having an SEL focus as part of the CDI work
(the school contrasts). Finally, we tested the relationship of school SEL implementation to
student outcomes. We address implications of these findings for practice and research.
School Implementation
According to the CDI theory of action, for the district-level initiative to make a difference for
students, it must change practice at the school level. Findings to date showed that a large
majority of schools were rated by their staff members as being in the moderate level of
implementation. Empirically based standards are not available to help us know whether this is a
“good enough” level of implementation, nor do we understand fully how our measure of school
implementation relates to local standards for fidelity and dosage, but we hope that three more
years of data will provide insight into these matters. We did observe that on our measure,
Anchorage and Chicago schools in particular were rated quite highly for professional
development, teacher attitudes, schoolwide integration, and classroom-based practices.
American Institutes for Research Collaborating Districts Initiative: 2015 Outcome Evaluation Report — 50
In both Cleveland and Chicago, staff who identified their level of instruction as prekindergarten
had significantly higher SEL scores than did staff at other instructional levels. This result is
consistent with other research and practice knowledge that indicates a stronger emphasis on
social and emotional skills in preschool compared to K–12 settings. Some evidence for a strong
focus on social and emotional development in preschool is evidenced by the far more common
establishment of standards for social and emotional learning in preschool (Dusenbury,
Weissberg, Goren, & Domitrovich, 2014).
Examining the staff SEL survey scores across focus and nonfocus schools serves as a sort of
implementation check: Are schools identified by the district’s social and emotional learning
leaders in fact engaging in more SEL activities than schools not so identified? We must note that
there may be effects of districtwide activities appearing in the nonfocus schools, and this is
suggested by the interviews we conducted in 2014. Results of the focus school analysis showed
relatively few differences. In both Nashville and in Washoe County, the large majority of
differences between focus and nonfocus schools were not statistically significant. In Chicago, the
focus schools were significantly higher than nonfocus schools in the first implementation year
(2012–13), but in 2013–14 the focus schools were not only lower than they had been in 2012–13,
but they were also significantly lower than the nonfocus schools in 2013–14.
A second implementation check involves looking
not at whether the district identified a school as
having an SEL focus, but at the scores from that
school on the staff SEL survey. Regardless of
intended implementation status, this measure tells
us (the degree that respondents are representative
of their schools) how well respondents think their
school is doing at implementing SEL activities
that are in the CDI’s school theory of action.
Schools that are not identified as having an SEL
focus may be engaged in meaningful activities related to developing their students’ social and
emotional skills. Although the school contrasts may not pick this up, analyses by staff SEL
survey scores should do so.
We found that for half of the 12 grades measured across four districts, there was a consistently
positive, statistically significant association between SEL implementation and student social and
emotional competence. Although this relation is not causal, and it was only seen in half the
observed grades, it still suggests that higher implementation of SEL activities sometimes
covaries with student SEL outcomes, and this is consistent with many studies of implementation.
School Outcome: School Climate
In a prior study of the PATHS SEL program implementation in Grades PK–5 in Cleveland, we
observed that in the second year of implementation (2011–12), as teacher ratings of
implementation increased, so too did elementary students’ report of safety, challenge, teacher
support, and peers’ social competence. As the implementation of social and emotional learning
improved, so did students’ perception of the quality of school climate. These findings suggest
that schools with better implementation of PATHS also had better school climate.
The steady improvement in district-level
implementation of the CDI theory of
action is not yet evident at the school
level. Schools are still at moderate levels
of SEL implementation overall. However,
in about half the schools that implement
SEL more fully, student SEL tends to be
higher.
American Institutes for Research Collaborating Districts Initiative: 2015 Outcome Evaluation Report — 51
Last year, we saw that in Anchorage and Cleveland, school climate in the first two years of CDI
implementation was significantly higher than in the two years before planning began. This year,
we were able to replicate these effects: Both districts continued to show consistent gains in
school climate in the CDI implementation years compared to the three years prior to CDI
implementation. However, unusual patterns of student participation in the Anchorage survey
require that we express caution about interpreting the findings for that district.
Student Outcomes
The CASEL theory of action for the CDI posits that positive changes in students’ social and
emotional competence is a proximal outcome, and academic outcomes (student achievement,
attendance, suspensions) are distal. We have seen that implementation of SEL activities remains
moderate in most schools and is not significantly associated with whether a school has a district-
identified SEL focus. However, our measure of implementation was significantly positively
associated with students’ social and emotional competence in half of the grades tested.
Given that school-level SEL implementation remains
modest overall, it is consistent with the theory of
action that for the most part, we did not see
significant change over time in students’ social and
emotional competence across districts and grades.
However, in two of four measured districts, a
majority of SEL outcomes were positive for one or two of the three grades tested. In both Austin
and Nashville, there was significant positive change in Grade 3 over the CDI period for all
measured social and emotional competencies. Nashville seventh-graders also showed statistically
significant improvement in three out of five competence areas. These findings are consistent with
the expectation that the use in each of these districts of an evidence-based social and emotional
learning program in the elementary grades (Second Step in Austin and Responsive Classroom in
Nashville) should influence students’ social and emotional skills.
Cleveland, which also uses an evidence-based program for all elementary schools (PATHS), did
not show improvement in measured student social and emotional competence from 2013 to 2014.
This could be because the CDI-related interventions poorly implemented or are not effective.
Alternatively, it may be because Cleveland began implementing PATHS before the CDI started
and the timing of gains mismatches the CDI analysis. An earlier evaluation of that program by
AIR (using an older version of the teacher rating instrument) did show improvement in the first
two years of full PK–5 PATHS implementation. Student scores did not change over the last two
years of CDI implementation, but that may simply mean that they remained at a posttreatment
level. Anchorage also showed improvement in SEL for students in all grades. Given the observed
peak in SEL scores in 2011, this change appears to predate the CDI implementation by one year.
There were few changes in student social and emotional competence in high school, consistent
with this being less of a focus by most districts.
Students’ academic and behavioral outcomes in the CDI implementation years, compared to
the years prior to CDI implementation, continued to be positive overall when examined
districtwide. In three out of four districts where academic performance could be measured (i.e.,
performance on state achievement tests and GPA where available), outcomes were significantly
Although overall there is not consistent
change in students’ social and emotional
competence, both Austin and Nashville
showed improvement in Grade 3.
American Institutes for Research Collaborating Districts Initiative: 2015 Outcome Evaluation Report — 52
higher in the CDI implementation years. In the fourth district, outcomes were higher in the first
year, but lower in the second. Findings for attendance were mixed, but outcomes for discipline
were more consistently positive (except in Washoe County). When student educational outcomes
were examined as a function of staff-reported implementation of SEL activities, in Cleveland and
Nashville, student outcomes in the areas of achievement, attendance, and behavior were all more
positive when school SEL implementation was higher. We did not see this association in the
Chicago CDI schools.
For student outcomes from educational records, whether a school was supposed to be focusing
on SEL activities did not seem to make a meaningful difference in achievement, attendance, or
discipline. This was true for both staff survey results (except in Chicago CDI schools) and
student social and emotional competence. Again, our interview data suggest the importance of
districtwide activities such as integrating SEL with the Danielson pedagogical framework and
SEL standards with the Common Core State Standards. These contrasts may be weakened by
effects of districtwide SEL leadership and professional development activities influencing
nonfocus schools, or nonfocus schools having a focus on SEL apart from the CDI work.
The more positive findings for the relationship of our school SEL implementation measure to
student outcomes suggests that the focus/nonfocus designation, which is an intent-to-treat status,
may not matter as much as actual implementation. This is particularly the case when the
superintendents focused on the importance of districtwide leadership and activities. One
superintendent told us, “I think that once you dedicate an entire office to this work, people
understand that it’s important. It’s embedded in what I think our district culture and our theory of
action is. Every opportunity I have I’m talking about it and how it benefits our children. I’ve
tried to take it away from it’s the thing to do for poor minority children who are acting out, that
it’s good for all our children.”
Implications
This report comes at a time when the Cohort 2 districts have not yet finished their first three
years of implementation, and all of the districts have another three to four years of CDI work
ahead. It is still early in the process to expect notable change at the student level from this
district-level initiative. Ideally, summative statements about this initiative would not be made
before five to seven years of implementation.
It may be helpful to compare the course of the CDI to another complex, multicomponent reform
effort: comprehensive school reform (CSR) (Borman, Hewes, Overman, & Brown, 2003). A
meta-analysis of CSR effects of showed that schools implementing these models for five years
showed achievement advantages that were nearly twice those for CSR schools implemented for
fewer years. After seven years of implementation, the effects were more than 2½ times the
magnitude of the overall CSR impact (d = .15). In addition, schools that had implemented CSR
for three to five years were more likely to experience statistically significant associations
between implementation and achievement (Aladjem et al., 2006). Effects were most likely to be
observed when three conditions were met—high levels of implementation, implementing the
model well during Years 3–5, and uniformity of implementation across components. Based on
these experiences with the implementation of complex changes in schools, it seems reasonable
that CDI effects on students could possibly take more time to develop.
American Institutes for Research Collaborating Districts Initiative: 2015 Outcome Evaluation Report — 53
At this time, our report of the evaluation of the CDI is designed to determine the extent to which
proof points exist regarding systemic support for SEL in districts. The first proof point relates to
feasibility and usefulness: With support from NoVo and with CASEL’s technical assistance, can
districts successfully implement policies and practices that make SEL an essential part of
education? As reported in the implementation report, the answer is yes: Districts can implement
SEL practices systemically and improve in the quality of this implementation over time. The
second proof point relates to impact: Does participation in the CDI result in better outcomes for
students? Overall, the quantitative answer is still emerging. The social competence outcomes in
Austin and Nashville were positive at Grade 3, as were the educational outcomes in those two
districts as well as Cleveland. However, school implementation is not yet at a high level in most
schools, and positive student results were not yet evident across most grades or most measured
outcomes in any district.
Although the quantitative proof point is still emerging, our qualitative findings are already
compelling. Districts have sustained and in fact deepened their commitment to SEL in spite of
changes in the superintendency in all eight districts. Language from two superintendents, the first
from a Cohort 1 district, the second from a Cohort 2 district, neither of whom were
superintendents when the district joined the CDI, suggest the importance and promise of this
work, both within and across districts:
I think we’re at a point now where we do see SEL as something, and again it’s probably
still a little more vision than it is the heart of implementation, it’s what we do, it’s who
we are, it’s like in our DNA and that’s what we think about. This is what we want for all
kids, it’s based around the five principles of SEL for decision making and being self
disciplined and empathetic towards others and understanding how to manage their own
emotions. We’re seeing the benefits of that. We’re seeing the outcomes and results in our
different schools that have been implementing. We see some schools that have not and
where we can really ramp up and support them in some way and I think just as we
continue the evolution of implementation of SEL, when I look at schools that have turned
the school around, it’s really by using the principles that are part of SEL and I think this
is going to give them another way, approach to do it whereas before it was a hit and miss.
I think this will give you a better framework for us to work from. I think that comes from
common vocabulary. So I think I see it also, which is also another benefit, in when the
board even asked me about this particular position and they said what are you going to do
or this is what we want, there was true alignment with that.
I’ve just been interviewing and doing the end of year eval for some of our chiefs and
some of our principals and to hear them talk about the way in which they’ve been
changing their school culture and the impact that social emotional learning has had
directly in the classroom that allows for teachers to teach, you know something good is
happening and that the impact is much stronger than I probably would have
anticipated….This is core and fundamental to the work that we’re doing. The partnership
helps to sustain the effort too. I think sometimes you get incredibly lonely trying to do it,
but you know that there are other armies of believers out there who are doing and
engaged in this work, so no. As long as I’m in the seat we’re going to be here for the long
haul.
American Institutes for Research Collaborating Districts Initiative: 2015 Outcome Evaluation Report — 54
Next Steps
The results of the outcome evaluation this year suggest that there is good and effective work
going on in the CDI, yet more remains to be done. Some questions with which we must grapple
as we move forward include the following:
1. Why did the focus/nonfocus school distinction fail to show expected differences? The
within-district quasi-experimental analyses were intended to be a strong test of the effects
of the CDI on schools and students. Yet results this year showed that district-identified
focus schools were not very different from nonfocus schools for either measures of
school SEL implementation or for student outcomes. What does this mean for the CDI
model if focus schools did not have higher SEL implementation than nonfocus schools?
Can any SEL implementation be attributed to the school-level CDI work? In 2015, we
have proposed collecting additional information (as suggested by our technical advisory
group) from district informants about the quality of school implementation. It also may
be helpful to develop a strategy for targeted school visits to deepen our knowledge of the
important construct of school implementation.
2. What does it mean that achievement has improved in four districts out of five
tested? Last year, we documented improved achievement from the period prior to the
CDI to the first year of CDI implementation for all three Cohort 1 districts. This year, we
could not test achievement change quantitatively in Austin due to a change in
achievement tests, and we did not receive Anchorage data in time for analysis for this
draft report. For Cleveland, Chicago, and Nashville (but not Washoe County), academic
performance during the CDI implementation period was significantly higher than in the
three years prior to the CDI. Is this a reflection of national trends toward higher
achievement? Is there something common across these diverse districts that is driving this
trend? Might that something be related in some way to becoming a part of the CDI?
3. What does the pattern of results for social and emotional competence mean? Although 64 percent of the tests for change in social and emotional competence were not
statistically significant, 24 percent were positive and 13 percent were negative. This does
not include the analysis for change in SEL in Anchorage, where change for all grades was
significantly positive, but the meaning of these effects is clouded by large changes in
student participation. The positive effects were clustered in Austin and Nashville,
particularly for Grade 3; there was a cluster of negative effects for Oakland’s Grade 3.
Does this pattern speak to the use of an evidence-based SEL program? If so, why were
there no effects in Cleveland, where prior evaluation has shown PATHS to be effective in
improving students’ SEL scores? Does the lack of findings for high school, where
relatively few districts have concentrated efforts, suggest that our measure is working as
expected?
4. Is there a conceptual foundation for the pattern of school implementation findings?
One of the most striking findings in this outcome analysis was the generally consistent
relationship between our measure of school SEL implementation (from the staff survey)
and student outcomes (both social and emotional and educational record outcomes). We
saw that in schools where staff report higher levels of SEL implementation, student
outcomes tended to be higher, even when controlling for student demographics. These
associations are not causal, though, and it is possible that unmeasured variables may be
American Institutes for Research Collaborating Districts Initiative: 2015 Outcome Evaluation Report — 55
driving both measures. We can conduct additional analyses to examine the correlates of
measured SEL implementation and their pattern across the districts. We are also planning
to validate the staff survey against informant reports of school SEL implementation.
Last year, we found significant improvements in school climate in the two districts we were able
to test and significant improvements for achievement, attendance, and discipline in the three
Cohort 1 districts. The large majority of findings for social and emotional competence in each
district were nonsignificant last year. Compared to these 2013 results, the findings this year are
incrementally more positive. School climate results were consistent with last year, with both
Anchorage and Cleveland continuing to show gains over time. This year, the generally positive
changes seen for Cohort 1 districts’ educational outcomes were evident in two out of the three
Cohort 2 districts measured. The findings for social and emotional competence were still
somewhat mixed this year and about half the tests showed no significant change over time, but
there was a more discernible pattern of change, with positive and negative findings clustering
together.

American Institutes for Research Collaborating Districts Initiative: 2015 Outcome Evaluation Report — 56
References
Aladjem, D. K., LeFloch, K. C., Zhang, Y., Kurki, A., Boyle, A., Taylor, J. E., et al. (2006).
Models matter—The final report of the National Longitudinal Evaluation of
Comprehensive School Reform. Washington, DC: American Institutes for Research.
Berends, M., Bodilly, S., & Kirby, S. N. (2002). Facing the challenges of whole-school reform:
New American Schools After a decade. Santa Monica, CA: RAND (MR-1498-EDU).
Bloom, H. (1999). Estimating program impacts on student achievement using “short”
interrupted time series. New York: Manpower Demonstration Research Corporation.
Bloom, H. (2001). Measuring the impacts of whole-school reforms: Methodological lessons from
an evaluation of accelerated schools. New York: Manpower Demonstration Research
Corporation.
Borman, G., Hewes, G. M., Overman, L. T., & Brown, S. (2003). Comprehensive school reform
and achievement: A meta-analysis. Review of Educational Research, 73(2), 125–230.
Collaborative for Academic, Social, and Emotional Learning. (2012). What is SEL? Retrieved
from http://casel.org/why-it-matters/what-is-sel/
Cuban, L. (2010). As good as it gets: What school reform brought to Austin. Cambridge, MA:
Harvard University Press.
Durlak, J. A., Weissberg, R. P., Dymnicki, A. B., Taylor, R. D., & Schellinger, K. B. (2011). The
impact of enhancing students’ social and emotional learning: A meta-analysis of school-
based universal interventions. Child Development, 82(1), 405–432.
Dusenbury, L., Weissberg, R. P., Goren, P., & Domitrovich, C. (2014). State standards to
advance social and emotional learning: Findings from state scan of social and emotional
learning standards, preschool through high school, 2014. Chicago, IL: Collaborative for
Academic, Social, and Emotional Learning.
Garet, M. S., Cronen, S., Eaton, M., Kurki, A., Ludwig, M., Jones, W., Uekawa, K., Falk, A.,
Bloom, H., Doolittle, F., Zhu, P., & Sztejnberg, L. (2008). The impact of two professional
development interventions on early reading instruction and achievement (NCEE 2008-
4030). Washington, DC: Institute of Education Sciences, U.S. Department of Education.
Faria, A. M., Kendziora, K., Brown, L., O’Brien, B., & Osher, D. (2013). PATHS
implementation and outcome study in the Cleveland Metropolitan School District: Final
report. Washington, DC: American Institutes for Research.
Kendziora, K., & Osher, D. (2009). Starting to turn schools around: The academic outcomes of
the Safe Schools, Successful Students Initiative. Washington, DC: American Institutes for
Research.

American Institutes for Research Collaborating Districts Initiative: 2015 Outcome Evaluation Report — 57
National Center for Education Statistics. (n.d.). The nation’s report card: The official site for
results from the National Assessment of Educational Progress. Washington, DC: U.S.
Department of Education, Institute of Education Sciences. Retrieved from
http://nationsreportcard.gov/tuda.asp
Osher, D., Kelly, D. L., Tolani-Brown, N., Shors, L., & Chen, Chen-Su. (2009). UNICEF child
friendly schools programming: Global evaluation final report. Washington, DC:
American Institutes for Research.
Shadish, W. R., Cook, T. D., & Campbell, D. T. (2002). Experimental and quasi-experimental
designs for generalized causal inference. Boston, MA: Houghton Mifflin.
Winkler, A. M., Scull, J., & Zeehandelaar, D. (2012, October). How strong are U.S. teacher
unions? A state-by-state comparison. Washington, DC: Thomas B. Fordham Institute.
Retrieved from http://www.edexcellence.net/publications/how-strong-are-us-teacher-
unions.html
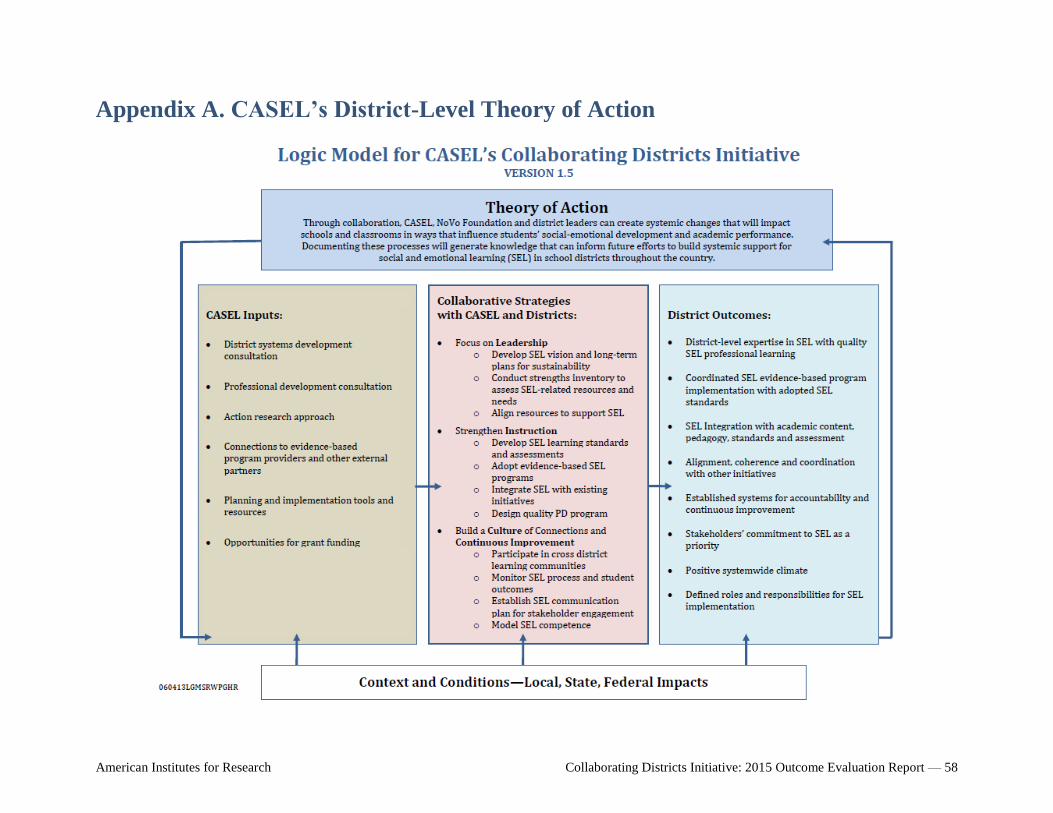
American Institutes for Research Collaborating Districts Initiative: 2015 Outcome Evaluation Report — 58
Appendix A. CASEL’s District-Level Theory of Action

American Institutes for Research Collaborating Districts Initiative: 2015 Outcome Evaluation Report — 59

American Institutes for Research Collaborating Districts Initiative: 2015 Outcome Evaluation Report — 60
Appendix B. CASEL’s School-Level Theory of Action
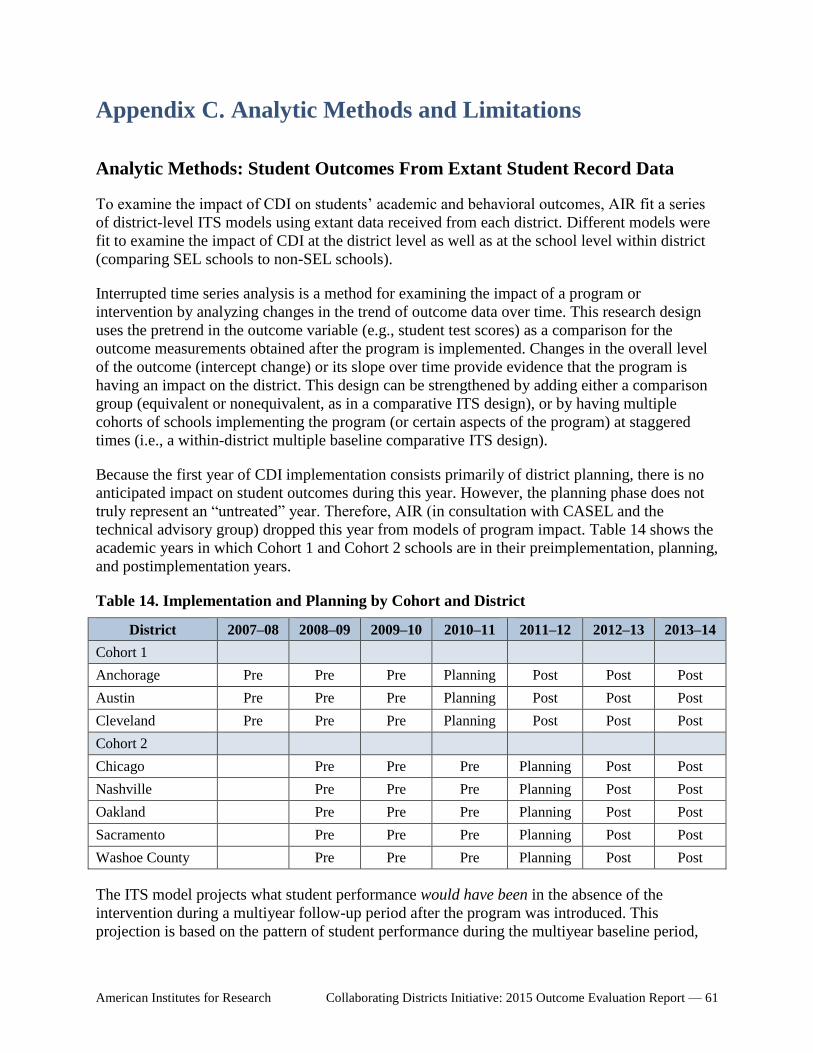
American Institutes for Research Collaborating Districts Initiative: 2015 Outcome Evaluation Report — 61
Appendix C. Analytic Methods and Limitations
Analytic Methods: Student Outcomes From Extant Student Record Data
To examine the impact of CDI on students’ academic and behavioral outcomes, AIR fit a series
of district-level ITS models using extant data received from each district. Different models were
fit to examine the impact of CDI at the district level as well as at the school level within district
(comparing SEL schools to non-SEL schools).
Interrupted time series analysis is a method for examining the impact of a program or
intervention by analyzing changes in the trend of outcome data over time. This research design
uses the pretrend in the outcome variable (e.g., student test scores) as a comparison for the
outcome measurements obtained after the program is implemented. Changes in the overall level
of the outcome (intercept change) or its slope over time provide evidence that the program is
having an impact on the district. This design can be strengthened by adding either a comparison
group (equivalent or nonequivalent, as in a comparative ITS design), or by having multiple
cohorts of schools implementing the program (or certain aspects of the program) at staggered
times (i.e., a within-district multiple baseline comparative ITS design).
Because the first year of CDI implementation consists primarily of district planning, there is no
anticipated impact on student outcomes during this year. However, the planning phase does not
truly represent an “untreated” year. Therefore, AIR (in consultation with CASEL and the
technical advisory group) dropped this year from models of program impact. Table 14 shows the
academic years in which Cohort 1 and Cohort 2 schools are in their preimplementation, planning,
and postimplementation years.
Table 14. Implementation and Planning by Cohort and District
District 2007–08 2008–09 2009–10 2010–11 2011–12 2012–13 2013–14
Cohort 1
Anchorage Pre Pre Pre Planning Post Post Post
Austin Pre Pre Pre Planning Post Post Post
Cleveland Pre Pre Pre Planning Post Post Post
Cohort 2
Chicago Pre Pre Pre Planning Post Post
Nashville Pre Pre Pre Planning Post Post
Oakland Pre Pre Pre Planning Post Post
Sacramento Pre Pre Pre Planning Post Post
Washoe County Pre Pre Pre Planning Post Post
The ITS model projects what student performance would have been in the absence of the
intervention during a multiyear follow-up period after the program was introduced. This
projection is based on the pattern of student performance during the multiyear baseline period,
American Institutes for Research Collaborating Districts Initiative: 2015 Outcome Evaluation Report — 62
which is projected into the postintervention period. The difference between the actual and
projected student performance provides an estimate of the effect of the reform. We estimate
treatment effects for the first year of intervention and separately for each subsequent year that
postintervention data are available. We are then able to track intervention impact over time as the
intervention is fully implemented and students gain intervention exposure.
A three-level mixed modeling framework follows for the baseline mean model (students nested
in cohorts nested in schools) for the whole district analysis10
. The ITS design for the whole
district model is a within-school comparison, with precohorts of students untreated, and
postimplementation cohorts as the treatment group.
10
The model presented here includes a single post-CDI effect to reduce the models’ complexity. The models fit as
part of the 2013–14 analysis include two or three follow-up year effects, depending on the district.
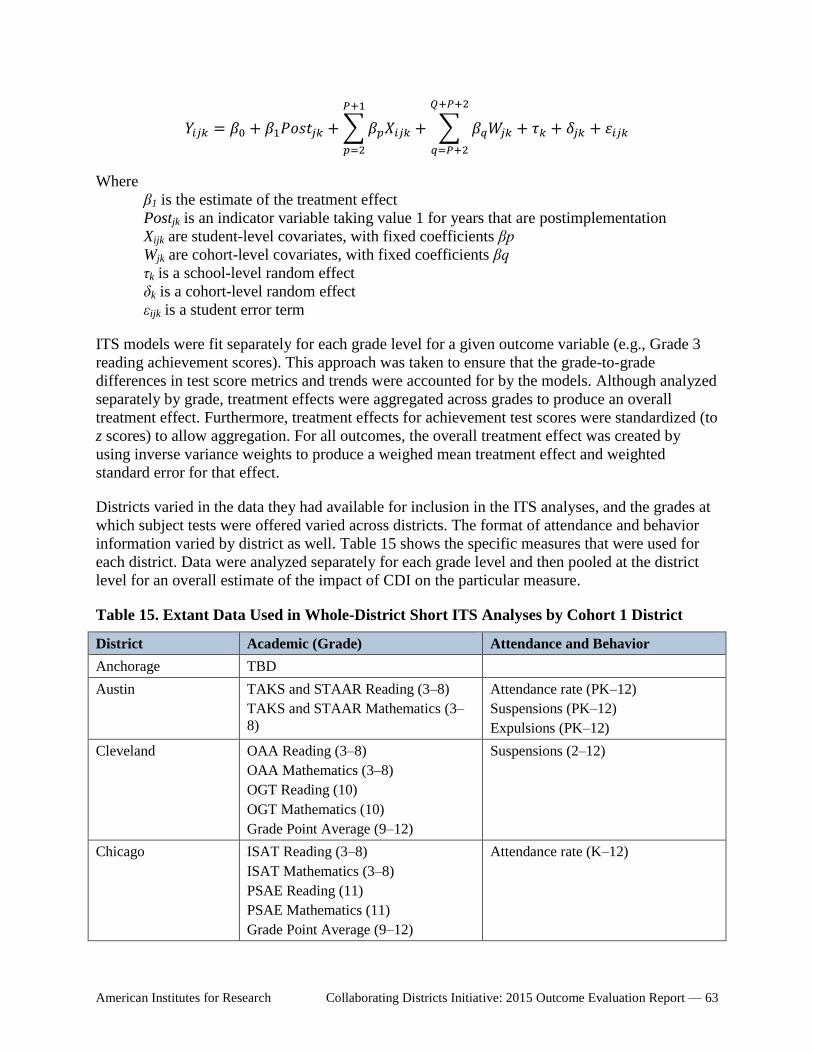
American Institutes for Research Collaborating Districts Initiative: 2015 Outcome Evaluation Report — 63
𝑌𝑖𝑗𝑘 = 𝛽0 + 𝛽1𝑃𝑜𝑠𝑡𝑗𝑘 + ∑ 𝛽𝑝𝑋𝑖𝑗𝑘
𝑃+1
𝑝=2
+ ∑ 𝛽𝑞𝑊𝑗𝑘
𝑄+𝑃+2
𝑞=𝑃+2
+ 𝜏𝑘 + 𝛿𝑗𝑘 + 휀𝑖𝑗𝑘
Where
β1 is the estimate of the treatment effect
Postjk is an indicator variable taking value 1 for years that are postimplementation
Xijk are student-level covariates, with fixed coefficients βp
Wjk are cohort-level covariates, with fixed coefficients βq
τk is a school-level random effect
δk is a cohort-level random effect
εijk is a student error term
ITS models were fit separately for each grade level for a given outcome variable (e.g., Grade 3
reading achievement scores). This approach was taken to ensure that the grade-to-grade
differences in test score metrics and trends were accounted for by the models. Although analyzed
separately by grade, treatment effects were aggregated across grades to produce an overall
treatment effect. Furthermore, treatment effects for achievement test scores were standardized (to
z scores) to allow aggregation. For all outcomes, the overall treatment effect was created by
using inverse variance weights to produce a weighed mean treatment effect and weighted
standard error for that effect.
Districts varied in the data they had available for inclusion in the ITS analyses, and the grades at
which subject tests were offered varied across districts. The format of attendance and behavior
information varied by district as well. Table 15 shows the specific measures that were used for
each district. Data were analyzed separately for each grade level and then pooled at the district
level for an overall estimate of the impact of CDI on the particular measure.
Table 15. Extant Data Used in Whole-District Short ITS Analyses by Cohort 1 District
District Academic (Grade) Attendance and Behavior
Anchorage TBD
Austin TAKS and STAAR Reading (3–8)
TAKS and STAAR Mathematics (3–
8)
Attendance rate (PK–12)
Suspensions (PK–12)
Expulsions (PK–12)
Cleveland OAA Reading (3–8)
OAA Mathematics (3–8)
OGT Reading (10)
OGT Mathematics (10)
Grade Point Average (9–12)
Suspensions (2–12)
Chicago ISAT Reading (3–8)
ISAT Mathematics (3–8)
PSAE Reading (11)
PSAE Mathematics (11)
Grade Point Average (9–12)
Attendance rate (K–12)
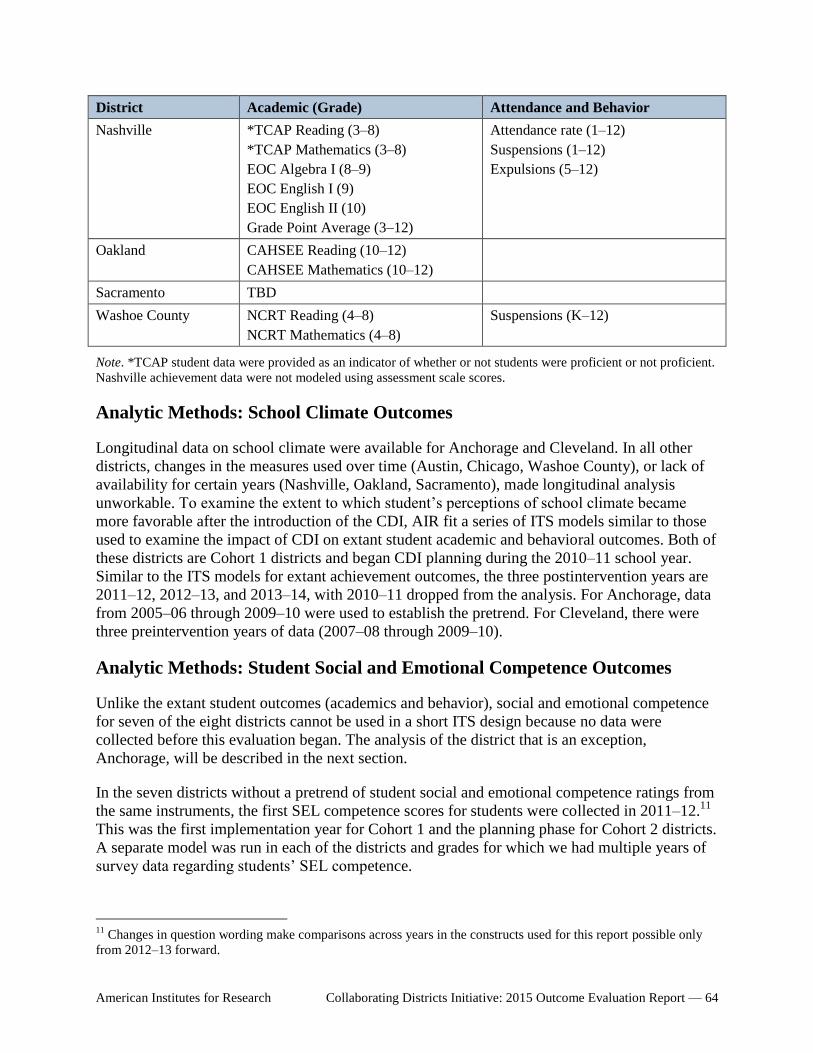
American Institutes for Research Collaborating Districts Initiative: 2015 Outcome Evaluation Report — 64
District Academic (Grade) Attendance and Behavior
Nashville *TCAP Reading (3–8)
*TCAP Mathematics (3–8)
EOC Algebra I (8–9)
EOC English I (9)
EOC English II (10)
Grade Point Average (3–12)
Attendance rate (1–12)
Suspensions (1–12)
Expulsions (5–12)
Oakland CAHSEE Reading (10–12)
CAHSEE Mathematics (10–12)
Sacramento TBD
Washoe County NCRT Reading (4–8)
NCRT Mathematics (4–8)
Suspensions (K–12)
Note. *TCAP student data were provided as an indicator of whether or not students were proficient or not proficient.
Nashville achievement data were not modeled using assessment scale scores.
Analytic Methods: School Climate Outcomes
Longitudinal data on school climate were available for Anchorage and Cleveland. In all other
districts, changes in the measures used over time (Austin, Chicago, Washoe County), or lack of
availability for certain years (Nashville, Oakland, Sacramento), made longitudinal analysis
unworkable. To examine the extent to which student’s perceptions of school climate became
more favorable after the introduction of the CDI, AIR fit a series of ITS models similar to those
used to examine the impact of CDI on extant student academic and behavioral outcomes. Both of
these districts are Cohort 1 districts and began CDI planning during the 2010–11 school year.
Similar to the ITS models for extant achievement outcomes, the three postintervention years are
2011–12, 2012–13, and 2013–14, with 2010–11 dropped from the analysis. For Anchorage, data
from 2005–06 through 2009–10 were used to establish the pretrend. For Cleveland, there were
three preintervention years of data (2007–08 through 2009–10).
Analytic Methods: Student Social and Emotional Competence Outcomes
Unlike the extant student outcomes (academics and behavior), social and emotional competence
for seven of the eight districts cannot be used in a short ITS design because no data were
collected before this evaluation began. The analysis of the district that is an exception,
Anchorage, will be described in the next section.
In the seven districts without a pretrend of student social and emotional competence ratings from
the same instruments, the first SEL competence scores for students were collected in 2011–12.11
This was the first implementation year for Cohort 1 and the planning phase for Cohort 2 districts.
A separate model was run in each of the districts and grades for which we had multiple years of
survey data regarding students’ SEL competence.
11
Changes in question wording make comparisons across years in the constructs used for this report possible only
from 2012–13 forward.
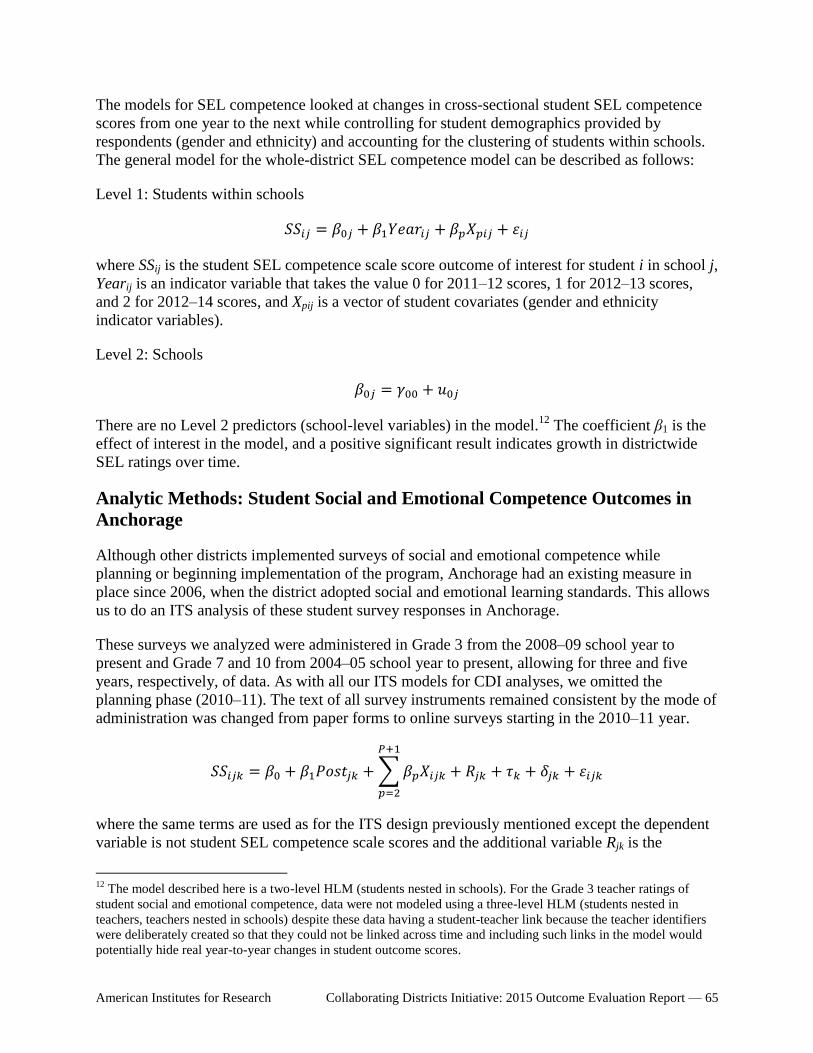
American Institutes for Research Collaborating Districts Initiative: 2015 Outcome Evaluation Report — 65
The models for SEL competence looked at changes in cross-sectional student SEL competence
scores from one year to the next while controlling for student demographics provided by
respondents (gender and ethnicity) and accounting for the clustering of students within schools.
The general model for the whole-district SEL competence model can be described as follows:
Level 1: Students within schools
𝑆𝑆𝑖𝑗 = 𝛽0𝑗 + 𝛽1𝑌𝑒𝑎𝑟𝑖𝑗 + 𝛽𝑝𝑋𝑝𝑖𝑗 + 휀𝑖𝑗
where SSij is the student SEL competence scale score outcome of interest for student i in school j,
Yearij is an indicator variable that takes the value 0 for 2011–12 scores, 1 for 2012–13 scores,
and 2 for 2012–14 scores, and Xpij is a vector of student covariates (gender and ethnicity
indicator variables).
Level 2: Schools
𝛽0𝑗 = 𝛾00 + 𝑢0𝑗
There are no Level 2 predictors (school-level variables) in the model.12
The coefficient β1 is the
effect of interest in the model, and a positive significant result indicates growth in districtwide
SEL ratings over time.
Analytic Methods: Student Social and Emotional Competence Outcomes in
Anchorage
Although other districts implemented surveys of social and emotional competence while
planning or beginning implementation of the program, Anchorage had an existing measure in
place since 2006, when the district adopted social and emotional learning standards. This allows
us to do an ITS analysis of these student survey responses in Anchorage.
These surveys we analyzed were administered in Grade 3 from the 2008–09 school year to
present and Grade 7 and 10 from 2004–05 school year to present, allowing for three and five
years, respectively, of data. As with all our ITS models for CDI analyses, we omitted the
planning phase (2010–11). The text of all survey instruments remained consistent by the mode of
administration was changed from paper forms to online surveys starting in the 2010–11 year.
𝑆𝑆𝑖𝑗𝑘 = 𝛽0 + 𝛽1𝑃𝑜𝑠𝑡𝑗𝑘 + ∑ 𝛽𝑝𝑋𝑖𝑗𝑘
𝑃+1
𝑝=2
+ 𝑅𝑗𝑘 + 𝜏𝑘 + 𝛿𝑗𝑘 + 휀𝑖𝑗𝑘
where the same terms are used as for the ITS design previously mentioned except the dependent
variable is not student SEL competence scale scores and the additional variable Rjk is the
12
The model described here is a two-level HLM (students nested in schools). For the Grade 3 teacher ratings of
student social and emotional competence, data were not modeled using a three-level HLM (students nested in
teachers, teachers nested in schools) despite these data having a student-teacher link because the teacher identifiers
were deliberately created so that they could not be linked across time and including such links in the model would
potentially hide real year-to-year changes in student outcome scores.

American Institutes for Research Collaborating Districts Initiative: 2015 Outcome Evaluation Report — 66
response rate at school j in cohort year k, and is fitted as a fixed effect. The Rjk term is defined as
the current year response rate divided by the mean response rate in the years prior to
implementation. The term is added to attempt to account for the decreased response rates after
the move to online forms.
Analytic Methods: Association of School SEL Implementation Activities and
Student Social and Emotional Competence
Models were fit to examine the relationship between school aggregate staff SEL implementation
scores on 10 constructs and student SEL ratings in Grades 3, 7, and 10.13
Student SEL scores
were calculated for five constructs: self-awareness, self-management, social awareness,
relationship skills, and responsible decision making. In Anchorage, a different survey was
administered, and only a single, overarching SEL scale score was generated. Models were fit for
three target grades in each of six sites (Anchorage, Cleveland, Chicago, Nashville, Sacramento,
and Washoe County).
The data were analyzed using a hierarchical linear model with students nested in schools. An
implementation score, based on the average standardized scale score for six of the 10 constructs
in the staff survey, was aggregated to the school level and used as predictors in the models.
Separate models were fit for each grade, district, and student social and emotional competence
construct. All school aggregate staff SEL survey scores were included in the model
simultaneously. The HLM can be described as follows:
Level 1: Students within schools
𝑆𝑆𝑖𝑗 = 𝛽0𝑗 + 휀𝑖𝑗
where SSjk is the student social and emotional competence scale score outcome of interest for
student i in school j.
Level 2: Schools
𝛽0𝑗 = 𝛾00 + 𝛾0𝑋𝑗 + 𝑢0𝑗
where the Xj is the summary of the staff SEL predictors aggregated to the school level. If the
coefficient γ0 is statistically significant, it indicates that a relationship exists between the staff
survey implementation score and student SEL competence.
Analytic Methods: School Contrasts
To test for differences in variables between SEL-focus and nonfocus schools, we used models
similar to the whole-district models described earlier. For these within-district comparative ITS
models (CITS), it is necessary to add additional terms to the model. In the simple model
13
For Washoe County only, the district did not administer the SEL survey to Grade 10 students, so Grade 9
students—who were surveyed—are used in the analysis instead.
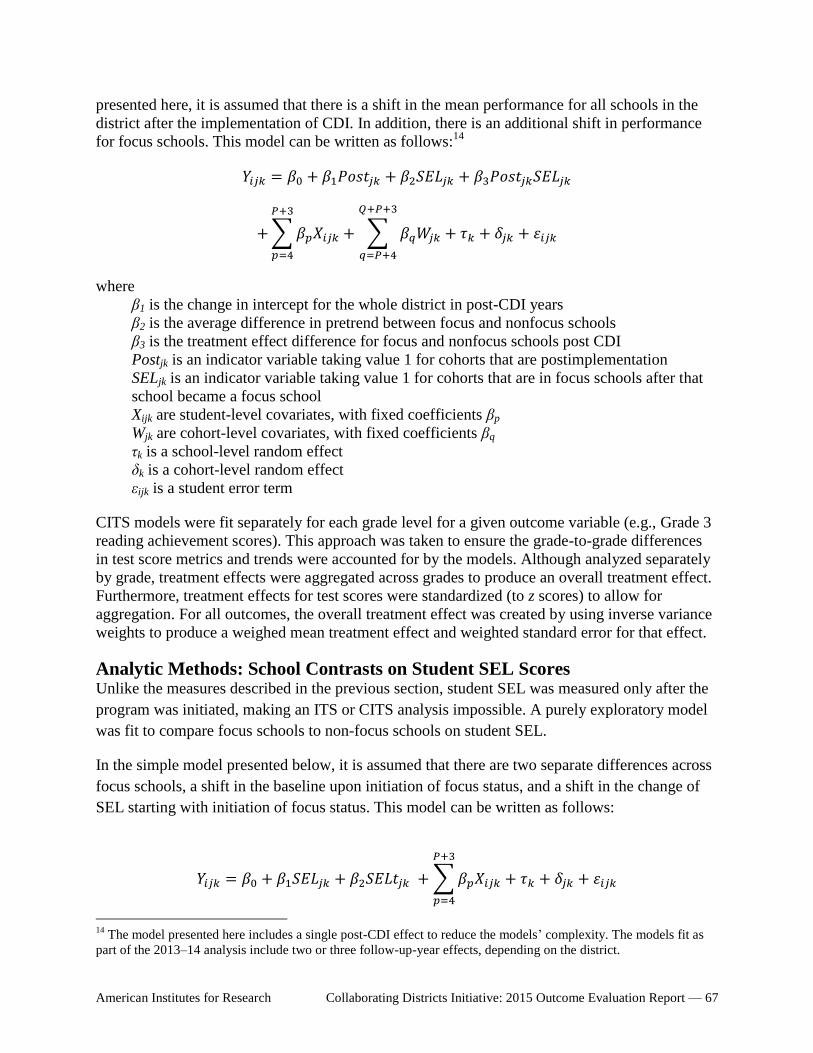
American Institutes for Research Collaborating Districts Initiative: 2015 Outcome Evaluation Report — 67
presented here, it is assumed that there is a shift in the mean performance for all schools in the
district after the implementation of CDI. In addition, there is an additional shift in performance
for focus schools. This model can be written as follows:14
𝑌𝑖𝑗𝑘 = 𝛽0 + 𝛽1𝑃𝑜𝑠𝑡𝑗𝑘 + 𝛽2𝑆𝐸𝐿𝑗𝑘 + 𝛽3𝑃𝑜𝑠𝑡𝑗𝑘𝑆𝐸𝐿𝑗𝑘
+ ∑ 𝛽𝑝𝑋𝑖𝑗𝑘
𝑃+3
𝑝=4
+ ∑ 𝛽𝑞𝑊𝑗𝑘
𝑄+𝑃+3
𝑞=𝑃+4
+ 𝜏𝑘 + 𝛿𝑗𝑘 + 휀𝑖𝑗𝑘
where
β1 is the change in intercept for the whole district in post-CDI years
β2 is the average difference in pretrend between focus and nonfocus schools
β3 is the treatment effect difference for focus and nonfocus schools post CDI
Postjk is an indicator variable taking value 1 for cohorts that are postimplementation
SELjk is an indicator variable taking value 1 for cohorts that are in focus schools after that
school became a focus school
Xijk are student-level covariates, with fixed coefficients βp
Wjk are cohort-level covariates, with fixed coefficients βq
τk is a school-level random effect
δk is a cohort-level random effect
εijk is a student error term
CITS models were fit separately for each grade level for a given outcome variable (e.g., Grade 3
reading achievement scores). This approach was taken to ensure the grade-to-grade differences
in test score metrics and trends were accounted for by the models. Although analyzed separately
by grade, treatment effects were aggregated across grades to produce an overall treatment effect.
Furthermore, treatment effects for test scores were standardized (to z scores) to allow for
aggregation. For all outcomes, the overall treatment effect was created by using inverse variance
weights to produce a weighed mean treatment effect and weighted standard error for that effect.
Analytic Methods: School Contrasts on Student SEL Scores Unlike the measures described in the previous section, student SEL was measured only after the
program was initiated, making an ITS or CITS analysis impossible. A purely exploratory model
was fit to compare focus schools to non-focus schools on student SEL.
In the simple model presented below, it is assumed that there are two separate differences across
focus schools, a shift in the baseline upon initiation of focus status, and a shift in the change of
SEL starting with initiation of focus status. This model can be written as follows:
𝑌𝑖𝑗𝑘 = 𝛽0 + 𝛽1𝑆𝐸𝐿𝑗𝑘 + 𝛽2𝑆𝐸𝐿𝑡𝑗𝑘 + ∑ 𝛽𝑝𝑋𝑖𝑗𝑘
𝑃+3
𝑝=4
+ 𝜏𝑘 + 𝛿𝑗𝑘 + 휀𝑖𝑗𝑘
14
The model presented here includes a single post-CDI effect to reduce the models’ complexity. The models fit as
part of the 2013–14 analysis include two or three follow-up-year effects, depending on the district.

American Institutes for Research Collaborating Districts Initiative: 2015 Outcome Evaluation Report — 68
Where
β1 is the change in intercept for the focus schools in post-focus years
β2 is the change in slope for the focus schools in the post-focus years
SELjk is an indicator variable taking value 1 for cohorts that are in focus schools after that
school became a focus school
SELtjk is a slope variable taking a value of 1 for the first year a school is a focus school
and incrementing up one per year after that.
Xijk are student-level covariates, with fixed coefficients βp
τk is a school-level random effect
δk is a cohort-level random effect
εijk is a student error term
This model was fit separately for each grade-level for a given SEL construct (e.g., Grade 3 self-
awareness). This approach was taken to ensure the grade to grade differences in test score
metrics and trends were accounted for by the models.
Limitations
There are limitations that should be considered when reviewing the results of the statistical
models included in this report. There are three main types of models used: (1) ITS or CITS
models for Cohort 1 district extant academic and behavioral outcomes; (2) gain score or
difference-in-difference models for student SEL competence scores; and (3) descriptive HLM
models looking at the relationship among various survey constructs, implementation, and student
social- and emotional-competence measures.
1. ITS or CITS models for extant academic and behavioral outcomes. For the whole-
district models, we had no comparison districts within the state where we could conduct
parallel measurement. This means that we cannot rule out the possibility that policy
changes or other interventions that occurred simultaneously in the district could have led
to the changes that are described here. The CITS models examining the differences
between SEL focus schools and non-SEL focus schools do control for districtwide
changes that occurred at the time of CDI implementation. However, they cannot control
for any changes that occurred in one of the school groups and not the other, or identify
the factors that contribute to the development of social and emotional competence.
2. Gain score or difference-in-difference models. The models for student social and
emotional competence use two or three years of student SEL scores to look at both
change in scores from available data between the 2011–12 school year and the 2013–14
school year (at the whole-district level) and differential change based on school
implementation status (focus versus nonfocus schools). These models must be considered
exploratory rather than causal; the models simply show trends through time for the
districts after implementing CDI.
3. Descriptive HLM models. The predictive models included in this report include those
looking at differences in student and staff SEL survey ratings in focus and nonfocus
schools and those examining the relationship between staff survey scores, student SEL

American Institutes for Research Collaborating Districts Initiative: 2015 Outcome Evaluation Report — 69
ratings, and extant data. These models are exploratory in nature, and no causal inference
should be drawn from their results.
In addition, we must note important caveats in our work because of low response rates we
obtained on a few of our data collections and selection bias for school contrasts.
4. Low response rates for surveys. Although all but one of the 2013–14 CDI surveys
administered by AIR had response rates above 50 percent, many of the earlier survey
response rates were low, particularly in 2011–12, when the average response rate across
all surveys was 37 percent (see Table 16). The average increase in response rates from
2011–12 to 2013–14 across all surveys was 23 percent (ranging from a 14 percent
average increase at Grade 7 to a 27 percent average increase for Grade 3).
Table 16. Response Rates for AIR-administered Surveys Across Districts, 2012–14
District Survey
2011–12
Response
Rate
2012–13
Response
Rate
2013–14
Response
Rate
Anchorage Staff 50% 57% 43%
Austin Grade 3 teacher ratings 15% 53% 64%
Grade 7 student self-report 37% 42% 76%
Grade 10 student self-report 2% 37% 63%
Cleveland Grade 3 teacher ratings 75% 54% 65%
Staff 50% 55% 62%
Chicago Grade 3 teacher ratings 41% 67% 53%
Grade 7 student self-report 54% 57% 77%
Grade 10 student self-report 56% 83% 68%
Staff 30% 70% 51%
Nashville Grade 3 teacher ratings 23% 78% 71%
Grade 7 student self-report 57% 73% —
Grade 10 student self-report 27% 58% —
Staff 50% 27% 52%
Oakland Grade 3 teacher ratings — 62% 67%
Staff 18% — —
Sacramento Grade 3 teacher ratings — 22% —
Staff 22% 23% —
Washoe County Grade 3 teacher ratings 28% 55% 64%
Average Grade 3 36% 61% 63%
Average Grade 7 37% 43% 51%
Average Grade 10 21% 45% 44%
Average Staff 37% 46% 52%
American Institutes for Research Collaborating Districts Initiative: 2015 Outcome Evaluation Report — 70
In our analyses of social and emotional competence, we used a regression adjustment procedure
to achieve better school estimates, which accounts for changes in the composition if the only
factors affecting response rates are the demographics that are controlled for in that regression;
this is unlikely. Where our response rates were lower, the potential for selection bias is greater.
Where our analyses include data for which the response rate was low, we must allow that
differences may not be in the construct of interest, but rather in the samples responding to the
surveys. As always, caution is advised when interpreting findings for which response rates are
low.
5. In this report, implementation and outcome measures are examined across contrasting
groups of schools: some schools that are engaged in intentional SEL implementation
efforts and other schools that were not identified by the district as focusing on SEL as
part of the CDI grant. It is important to understand that none of these groups were created
by random assignment; there is selection bias present for every school contrast
examined. Focus schools may be inherently different from nonfocus schools, and
differences in SEL outcomes may be due to that preexisting difference rather than to
CDI. For example, in Austin, vertical teams applied to the district to implement SEL, and
they were selected based on a competitive process. In Washoe County, schools were
selected based on the SEL expertise of the area administrator as well as principal
willingness to participate. Any of these background factors, rather than SEL
implementation itself, could be responsible for any group differences observed.

American Institutes for Research Collaborating Districts Initiative: 2015 Outcome Evaluation Report — 71
Appendix D. District Characteristics
In this appendix, we present additional detail about the characteristics of the 8 CDI districts. In Error! Reference source not
ound.we present salient facts and figures. In this appendix we also describe issues of policy, the role of teachers unions, and
differences in achievement levels.
Table 17. Demographics, Achievement, and Graduation Rates for CDI Districts, by Cohort
District Size Ethnicity (%) Subgroups (%) Achievement
Rate (%)*
Graduation
Rate (%)
#
Schools
Total
Enrollment
African
American Asian Latino White SWD ELL FRPL
ELA %
Proficient
Math %
Proficient Graduates
Cohort 1
Anchorage
(ASD)1
109 48,229 6 16 11 44 14.1 10.8 42 78.9 70.5 73.5
Austin
(AISD)2
129 86,233 8.7 3.4 60.4 24.8 10.0 27.4 63.0 80 81 84.9
Cleveland
(CMSD)3
120 37,967 66.3 1.1 14.8 14.9 23.9 8.0 100§ 58.3 48.0 64.3
Cohort 2
Chicago
(CPS)4
672 395,071 40.5 3.4 45.0 9.1 13.3 17.0 85.7 48.0 50.1 69.2
Nashville
(MNPS)5
154 81,134 45.3 4.0 18.6 31.8 12.0 14.7 72.4 40.0 42.5 86.3
Oakland
(OUSD)6
129 47,194 28 15 43 10 10.8 31 100§ 45 44 62.8
Sacramento
(SCUSD)7
87 47,031 17.4 17.3 37.7 18.5 21.3 21.7 73.2 48 47 85.3
Washoe
County
(WCSD)8
104 62,986 2.4 4.4 38.9 46.4 13.5 15.9 47.7 65 62 72.6
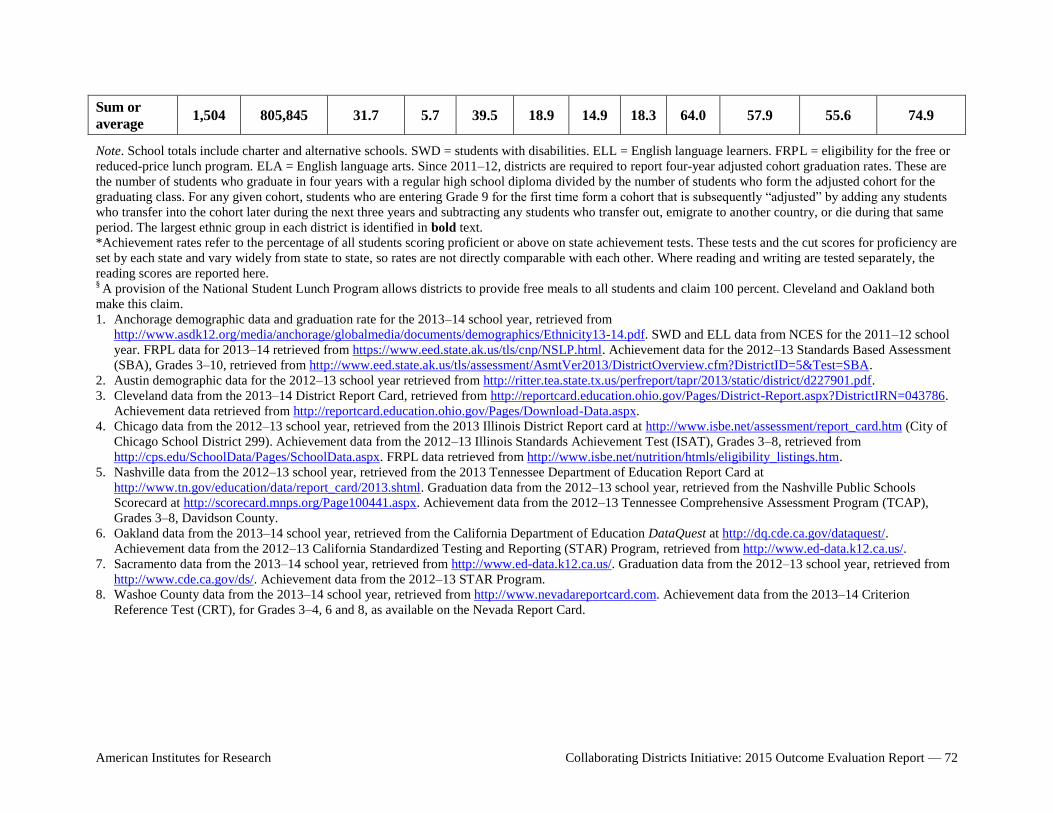
American Institutes for Research Collaborating Districts Initiative: 2015 Outcome Evaluation Report — 72
Sum or
average 1,504 805,845 31.7 5.7 39.5 18.9 14.9 18.3 64.0 57.9 55.6 74.9
Note. School totals include charter and alternative schools. SWD = students with disabilities. ELL = English language learners. FRPL = eligibility for the free or
reduced-price lunch program. ELA = English language arts. Since 2011–12, districts are required to report four-year adjusted cohort graduation rates. These are
the number of students who graduate in four years with a regular high school diploma divided by the number of students who form the adjusted cohort for the
graduating class. For any given cohort, students who are entering Grade 9 for the first time form a cohort that is subsequently “adjusted” by adding any students
who transfer into the cohort later during the next three years and subtracting any students who transfer out, emigrate to another country, or die during that same
period. The largest ethnic group in each district is identified in bold text.
*Achievement rates refer to the percentage of all students scoring proficient or above on state achievement tests. These tests and the cut scores for proficiency are
set by each state and vary widely from state to state, so rates are not directly comparable with each other. Where reading and writing are tested separately, the
reading scores are reported here. § A provision of the National Student Lunch Program allows districts to provide free meals to all students and claim 100 percent. Cleveland and Oakland both
make this claim.
1. Anchorage demographic data and graduation rate for the 2013–14 school year, retrieved from
http://www.asdk12.org/media/anchorage/globalmedia/documents/demographics/Ethnicity13-14.pdf. SWD and ELL data from NCES for the 2011–12 school
year. FRPL data for 2013–14 retrieved from https://www.eed.state.ak.us/tls/cnp/NSLP.html. Achievement data for the 2012–13 Standards Based Assessment
(SBA), Grades 3–10, retrieved from http://www.eed.state.ak.us/tls/assessment/AsmtVer2013/DistrictOverview.cfm?DistrictID=5&Test=SBA.
2. Austin demographic data for the 2012–13 school year retrieved from http://ritter.tea.state.tx.us/perfreport/tapr/2013/static/district/d227901.pdf.
3. Cleveland data from the 2013–14 District Report Card, retrieved from http://reportcard.education.ohio.gov/Pages/District-Report.aspx?DistrictIRN=043786.
Achievement data retrieved from http://reportcard.education.ohio.gov/Pages/Download-Data.aspx.
4. Chicago data from the 2012–13 school year, retrieved from the 2013 Illinois District Report card at http://www.isbe.net/assessment/report_card.htm (City of
Chicago School District 299). Achievement data from the 2012–13 Illinois Standards Achievement Test (ISAT), Grades 3–8, retrieved from
http://cps.edu/SchoolData/Pages/SchoolData.aspx. FRPL data retrieved from http://www.isbe.net/nutrition/htmls/eligibility_listings.htm.
5. Nashville data from the 2012–13 school year, retrieved from the 2013 Tennessee Department of Education Report Card at
http://www.tn.gov/education/data/report_card/2013.shtml. Graduation data from the 2012–13 school year, retrieved from the Nashville Public Schools
Scorecard at http://scorecard.mnps.org/Page100441.aspx. Achievement data from the 2012–13 Tennessee Comprehensive Assessment Program (TCAP),
Grades 3–8, Davidson County.
6. Oakland data from the 2013–14 school year, retrieved from the California Department of Education DataQuest at http://dq.cde.ca.gov/dataquest/.
Achievement data from the 2012–13 California Standardized Testing and Reporting (STAR) Program, retrieved from http://www.ed-data.k12.ca.us/.
7. Sacramento data from the 2013–14 school year, retrieved from http://www.ed-data.k12.ca.us/. Graduation data from the 2012–13 school year, retrieved from
http://www.cde.ca.gov/ds/. Achievement data from the 2012–13 STAR Program.
8. Washoe County data from the 2013–14 school year, retrieved from http://www.nevadareportcard.com. Achievement data from the 2013–14 Criterion
Reference Test (CRT), for Grades 3–4, 6 and 8, as available on the Nevada Report Card.
American Institutes for Research Collaborating Districts Initiative: 2015 Outcome Evaluation Report — 73
With respect to issues that affect educational policy, the districts are also diverse. Two districts
(Nashville and Cleveland) are in states that won Race to the Top grants from the U.S.
Department of Education. These districts experience increased demand to address federal
education reform targets, such as changing the way teacher and principal performances are
reviewed, turning around low-performing schools, adopting rigorous standards and assessments,
and adopting data systems to support improved instruction. All districts except Austin are
implementing Common Core State Standards and are preparing for new and dramatically
different achievement tests in 2015; Austin just experienced a change in achievement tests in
2012. Two districts are under mayoral control, in which the city’s mayor appoints the school
board and school superintendent and controls the budget: Chicago, since 1995, and Cleveland,
since 1998, when the district emerged from receivership. Oakland was in receivership from 2003
through 2009 but regained local control in 2009.
The role of teachers’ unions also varies by district. According to a report produced by the
Fordham Foundation (Winkler, Scull, & Zeehandelaar, 2012), four CDI districts are in the top 12
states in the country for teachers’ union strength (Oakland, Sacramento, Chicago, and
Cleveland), whereas Austin is in a state that prohibits both collective bargaining and collection
of agency fees (union dues as a condition of employment). District relations with the teacher
unions also vary. For example, in 2012 Chicago experienced a seven-day teacher strike, whereas
Cleveland’s union collaborated with Cleveland and the mayor to secure state support of the so-
called Cleveland Plan and had local support for the first tax levy in 16 years.
Although information on state achievement test performance is included in Table 17, note that
except for Oakland and Sacramento, the scores reflect different state assessments, each with its
own cut score for proficiency. Three of the districts (Austin, Chicago, and Cleveland) have
participated in the National Assessment of Educational Progress Trial Urban District Assessment
(NAEP TUDA; NCES, n.d.), which allows for direct comparison of district achievement for
descriptive purposes. Results from these assessments are shown in Figure 12. Austin performs at
or above the national average for all public schools and above the average for large cities.
Chicago is below the large city average but has improved in recent years, particularly in
mathematics. Among the 21 urban districts participating in NAEP TUDA, Cleveland is among
the lower scoring districts (along with Detroit; Washington, D.C.; Milwaukee; Fresno,
California; and Baltimore). Cleveland’s performance levels have been essentially flat over time.

American Institutes for Research Collaborating Districts Initiative: 2015 Outcome Evaluation Report — 74
Figure 12. NAEP TUDA Results for Austin, Chicago, and Cleveland, Compared With All
Public Schools and With Large Cities
Source: NCES, n.d.

American Institutes for Research Collaborating Districts Initiative: 2015 Outcome Evaluation Report — 75
Appendix E. District Context and Implementation Summary
This appendix presents the key facts, current priorities, and major challenges for each district.
Districts are organized alphabetically by cohort.
Cohort 1 Districts
Anchorage (ASD). Anchorage students speak 91 different languages at home, the five most
common of which are Spanish, Hmong, Samoan, Tagalog, and Yup'ik. In 2012–13, after having
one superintendent in place for 12 years, Anchorage hired a new superintendent, Dr. Jim
Browder. Dr. Browder’s tenure was marked by sharp budget cuts and consequent central office
reorganization, the development of a new strategic plan for the district (Destination 2020), and a
more directive role for the central office in providing direction for schools. To the surprise of
many, Dr. Browder announced his retirement in March 2013. The board replaced him with the
former chief academic officer (CAO), Mr. Ed Graff, as of March 18, 2013—after less than 10
months on the job. Mr. Graff has stated that as superintendent he intends to continue to pursue
the priorities set by Dr. Browder as defined in the strategic plan. These priorities include
Response to Instruction (RTI), Common Core State Standards, and a new K–8 mathematics
curriculum. SEL is not a stated objective in the plan, although Mr. Graff noted that it was
embedded and integrated in the other objectives.
The centerpiece of Anchorage’s SEL implementation plan is the SEL Implementation and
Sustainability Process, which is a continuing-education-credit-bearing class offered to 16
elementary, 6 middle, and 8 high schools. School teams, often including school leaders, attend
monthly three-hour workshops. Another major focus of Anchorage’s work under the CDI has
been integration. In the past year, reading strategies in three content areas have been aligned with
SEL (the Reading Apprenticeship initiative), the second-grade social studies curriculum was
rewritten with SEL and cultural standards embedded within lessons, and SEL was integrated
with Response to Instruction.
District challenges include pressure to improve student academic performance. In 2011–12, the
district failed to make adequate yearly progress (AYP) for the seventh consecutive year. In
August 2011, the school board approved the adoption of a set of performance measures and goals
against which to measure district progress in improving student achievement, reducing
achievement gaps, and increasing graduation rates. Budget cuts, staffing reductions, and changes
in leadership also continue to be challenges for the district. The ASD budget was cut by more
than $20 million in 2012–13, and the proposed budget for 2013–14 includes an additional $25
million in cuts. A significant factor in the district’s budget deficit is a continued decline in
federal funding as reductions required by the Budget Control Act of 2011 (“the sequester”) take
effect. Several changes in SEL organization and staffing also occurred during the past year. The
district’s SEL coordinator left, and the SEL PD coach retired last summer. Neither position was
filled because of budget constraints. The SEL Department was incorporated into the Professional
Learning Department this year, and the Executive Director of Professional Learning now has
SEL coordination as part of her duties. The number of central office SEL staff has gone from
nine to four in the last year.
American Institutes for Research Collaborating Districts Initiative: 2015 Outcome Evaluation Report — 76
Austin (AISD). Austin serves students from a range of cultural and socioeconomic backgrounds
and is the CDI’s one majority Latino district. It is also the highest performing CDI district
academically; in 2011,15
92 percent of schools in Austin met or exceeded state accountability
standards, but as documented in Cuban (2010), Austin has struggled over time with poor
academic outcomes for children of color from economically disadvantaged neighborhoods. Prior
to the CDI, Austin had a Safe Schools/Healthy Students grant that focused in part on positive
behavioral supports. Two important current efforts are No Place for Hate, which addresses racial
and ethnic disparities and the use of Child Study Teams to address the needs of students who
need additional support and are at risk for poor school outcomes. Austin has an overarching
Whole Child, Every Child framework, which integrates whole-child, student-centered,
collaborative, cooperative, and constructivist teaching and learning principles and practices into
the curriculum, culture, and climate of the school.
Austin is rolling out the CDI by vertical team (a vertical team is a high school and all its feeder
elementary and middle schools). The number of schools in which SEL is being implemented
more than doubled in Year 2 from 27 to 57 schools, exceeding earlier expectations; currently,
five out of eleven vertical teams in the district are engaged in CDI implementation work. The
district uses Second Step in K–8 together with Peace Paths and No Place for Hate. CASEL
consultants reported that SEL implementation is going “spectacularly.” In particular, district
coaching expertise has expanded this year as new SEL staff were added.
Challenges faced by Austin (in common with many other CDI districts) include budget-driven
layoffs that went into effect in 2011–12, state pressures to focus more on achievement test
scores, and lack of operational cohesion among multiple initiatives, although there have been
improvements this year in coordination across initiatives and central office departments. There
have also been several changes in district leadership this year, including a new CAO, a new
Chief of Staff, and a new Associate Superintendent for Academics. According to interviewees,
new district staff are supportive of SEL. Four new members were elected to the nine-member
AISD Board of Trustees in November 2012; SEL remains a priority in the board’s goal
statements. During the past year, the SEL Department moved out of the Division of Special
Programs and is now housed in the Curriculum Division of the Office of Academics. With the
help of highly supportive local philanthropic investments, SEL staff doubled in number—from
four to seven in the 2012–13 school year and then to nine for the 2013–14 school year.
Cleveland (CMSD). Cleveland is the one CDI district with a student population that is majority
African American. It has very high levels of need. For example, 24 percent of its students are
classified as students with disabilities, and all students in Cleveland receive free meals at school.
Among the CDI districts, it is the lowest performing district academically. A series of academic
reforms beginning with the Academic Transformation Plan in 2010 and the Cleveland Plan in
2012 are beginning to show early signs of promise.
Cleveland is in its fifth year of implementing the comprehensive Humanware initiative that
focuses on improving conditions for learning through a public health approach that combines and
aligns SEL with the systematic use of student support interventions and services for students who
are at higher levels of risk. Major district initiatives include the adoption of the Common Core
15
There were no school accountability ratings in 2012 because of changes in the state achievement tests.

American Institutes for Research Collaborating Districts Initiative: 2015 Outcome Evaluation Report — 77
State Standards and the development of a new teacher evaluation system, which will include a
focus on the conditions for learning, and the designation of 13 low-performing schools as
Investment Schools targeted for investments to make rapid improvement. These schools were
selected based on their academic standing, SEL needs, and special education designations. SEL
staff have begun to look at school climate data from the Conditions for Learning survey,
planning center information, and student support information from these schools to determine
how to provide support next year. Cleveland continues to implement an evidence-based social
and emotional learning program (Promoting Alternative Thinking Strategies [PATHS]) in all
elementary schools.
Cleveland has been challenged by an ongoing budget crisis that has necessitated school closings
and staff layoffs. These challenges have been addressed by downsizing in 2011, the passage of a
levy in November 2012, and the sale of a district administration building in 2013. Cleveland has
also experienced leadership changes. The district changed CEOs in 2011. The new CEO was the
former CAO, who led Humanware and advocated for the universal implementation of their
elementary evidence-based SEL program (PATHS). A new CAO started in August 2012, after
the position had been vacant for a year. The former interim director of the Humanware
department was appointed the Executive Director of the department this year.
Cohort 2 Districts
Chicago (CPS). CPS is the third largest school district in the United States and the largest
district by far in the CDI. It is focusing most of its work for this initiative in 2 of its 19 networks,
which, when combined, equal roughly half the size of the smallest CDI district (56 schools and
27,700 students). Major Chicago initiatives include the adoption of the Common Core State
Standards, the new teacher evaluation system, and the adoption of an extended school day. Like
Cleveland, Chicago is under mayoral control. Labor relations are more contentious in Chicago,
however, as indicated by a teacher strike in September 2012. Additional challenges include a
large budget deficit that resulted in the closing of 54 schools. Two of the schools in the Rock
Island Network, one the networks participating in the CDI, were identified for school closing in
June 2013.
Chicago seated a new CEO in October 2012; the prior CEO had been in office for 17 months
and, according to our interviews, had demonstrated to staff his commitment to SEL as a vehicle
for changing the school system—a vision that is shared by many of the CDI superintendents. The
new CEO has made a strong commitment to continuing the CDI work and recently released a
five-year action plan that included an emphasis on SEL.
CPS has established a 15-member SEL implementation team in the central office to guide their
programming and integration efforts. CPS has adopted an instructional framework that shows the
connections among Common Core State Standards, 21st Century Skills, SEL learning standards,
and other initiatives such as Full School Day with the district’s teacher support and evaluation
system. Implementation of systemic SEL in schools has focused on Wave 1 schools in the Rock
Island (n=9) and West Side (n=7) Networks. These schools have been engaged in a pilot of
CASEL’s SchoolKit, which is an implementation support process for schoolwide SEL. CPS
identifies three pillars for integrating SEL in schools: positive school climate, adult modeling of
SEL competences, and explicit instruction. The network schools tend to focus primarily on one

American Institutes for Research Collaborating Districts Initiative: 2015 Outcome Evaluation Report — 78
of these three—that is, they may implement Foundations/PBIS (school climate), or they may
choose to focus on adult modeling of SEL skills or integration of SEL skills into the school’s
mission or vision.
CPS continues to be characterized by ongoing change. The school board approved several
cabinet-level appointments in December 2012. New appointments include the Chief Officer of
Teaching and Learning, the Chief Officer of Network Quality, the Chief Accountability Officer,
the Chief Innovations and Incubation Officer, and the Chief Officer of Strategic School Support.
In addition, the Director of Youth Development and Positive Behavior Supports, who served as
one of the SEL leaders for the district, resigned at the end of the school year. According to
multiple interviewees, the new CEO is considering a restructuring plan that would reorganize
schools into fewer regions rather than the current 19 networks, which would result in a major
shift in the current structure.
Nashville (MNPS). Nashville’s students are 46 percent African American, 33.5 percent White,
and 16.4 percent Latino; 72.4 percent of the students are economically disadvantaged. The
district’s major reform initiative (MNPS Achieves) targets transformation in 10 areas, each
addressed by a Transformational Leadership Group. Process-oriented groups include those
focused on topics such as human capital, communications, and information technology;
performance-focused groups include groups working to improve outcomes for disadvantaged
youth, students with special needs, ELLs, and middle and high school students.
MNPS reorganized during the 2012–13 school year; the Director of Schools (i.e., superintendent)
now has 6 direct reports (rather than 12). The former Associate Superintendent of High Schools
is now the CAO; he oversees the Executive Officers for elementary schools, instructional
support, and innovation. The former Executive Officer for Instructional Support, who was the
district’s SEL leader and who was instrumental in elevating SEL and bringing CASEL to MNPS,
retired at the end of June 2013. The new SEL Director started working in MNPS in the summer
of 2012.
Nashville’s plan for systemic SEL implementation includes a strong focus on integration with
other initiatives (particularly project-based learning). Nashville has decided to support five SEL
programs: Responsive Classroom, Ripple Effects, School Connect, Caring School Community,
and Zaner-Bloser’s Voices Literature and Writing. Each of these programs offers professional
learning opportunities that expand on the general SEL learning opportunities provided for central
office staff, principals, and school staff. Twelve teachers will be selected as district Responsive
Classroom trainers and will train other teachers during the 2013–14 school year.
The district currently benefits financially from Tennessee’s Race to the Top initiative (called
First to the Top in Tennessee), as well as from its Safe and Supportive Schools Initiative, which
focuses on the collection and use of data to improve school climate. The state received $500
million in federal funding, $30.3 million of which was allocated to Nashville for 2010–14. To
comply with Tennessee’s First to the Top Act, Nashville is implementing a new teacher
evaluation system and is adopting new goals in the areas of teachers and leaders, standards, data,
science/technology/engineering/mathematics, and school turnaround. In part because of the Race
to the Top award, MNPS staff report feeling overwhelmed with too many initiatives. They have
placed a priority on integrating SEL with academic initiatives, such as project-based learning.

American Institutes for Research Collaborating Districts Initiative: 2015 Outcome Evaluation Report — 79
Oakland (OUSD). Approximately 69 percent of Oakland’s student population qualifies for free
or reduced-price lunch (FRPL). A plurality of students are Latino (38.5 percent); 31 percent are
African American, 14 percent are Asian, and 11 percent are White. Oakland’s former
superintendent, who left in 2013, made it a priority to address the history of disparity,
disadvantage, and disenfranchisement faced by the district’s students. In 2009, OUSD
established a five-year strategic plan (Community Schools, Thriving Students) and a long-term
vision that “serves the whole child, eliminates inequity, and provides each child with excellent
teachers every day” (OUSD, 2011). The district bases this vision and strategy on three areas of
focus: (1) high-quality instructional core, (2) social and emotional health and well-being, and
(3) equitable opportunities for learning. On its website, the district reports that it is “California’s
most improved urban school district over the last eight years.” Although the district failed to
meet AYP in ELA and mathematics for the past three years, there is consistent improvement in
the districts’ Academic Performance Index16
(API; from 651 in 2006 to 728 in 2012; statewide
API in 2012 was 788).
Oakland’s work in the CDI is guided by an SEL Design Team and is focused on SEL as a
process for learning and on the development of adult social emotional competence. The district
has focused on developing Pre K–adult SEL learning standards and a process for communicating
and embedding those standards. The district facilitated a two-day standards institute with
teachers from across the district. Oakland intends to make SEL adult learning standards an
integral part of the Effective Teaching Task Force and Effective Leadership Task Force, which
will define high-quality teaching and leading. After the SEL learning standards are approved by
the board, the district will align recommendations for evidenced-based programs with the
learning standards. Thereafter, schools will be encouraged to adopt a recommended program.
Oakland has also done extensive work integrating SEL with academics and academic staff
development.
As a result of severe state budget shortfalls since 2008, district funding levels have been falling
each year. Passage of a November 2012 ballot measure alleviated the financial strain to some
extent. Interviewees reported numerous, ongoing initiatives and minimal cross-departmental
collaboration in the central office to facilitate districtwide SEL implementation. Employee
turnover is also a challenge. Several district administrators recently retired or transferred to other
districts. The superintendent also announced his resignation, effective June 30, 2013. A former
board member has been selected as acting superintendent. The acting superintendent supports the
district’s strategic plan, and the board president also reaffirmed the board’s commitment to the
plan.
In August 2013, Oakland and Sacramento (and six other California districts) received No Child
Left Behind waivers from the U.S. Department of Education, which provides substantial funding
flexibility for Title I funds. In addition, under the waiver, nonacademic factors are worth 40
percent of a school’s grade (20 percent based on SEL metrics and 20 percent based on climate).
In the coming year, we will see how this flexibility has been used.
16
The API is a single number, ranging from a low of 200 to a high of 1,000, which indicates performance on
statewide testing. Its purpose is to measure the academic performance and growth of schools.
American Institutes for Research Collaborating Districts Initiative: 2015 Outcome Evaluation Report — 80
Sacramento (SCUSD). Sacramento’s student population is more evenly distributed across races
than are the other CDI districts, with 18 percent African American, 18 percent Asian, 18.6
percent White, and 36.5 percent Latino students. Almost 70 percent of students qualify for
FRPL. Although the district failed to meet AYP in English language arts and mathematics for the
past three years, there has been consistent API growth over the past several years. Sacramento’s
Strategic Plan 2010–2014: Putting Children First has launched initiatives to meet commitments
to the community in three focus areas: (1) career- and college-ready students, (2) family and
community engagement, and (3) organizational transformation. Although SEL-related
components are integrated throughout these focal areas, the district is still in the early stages of
establishing a vision for SEL.
After considerable leadership turnover for SEL in Sacramento, management has stabilized and
SEL has gained traction. The SEL leadership team consists of 30 personnel from across the
district and meets monthly. The four McClatchy Network schools are mentoring and guiding the
next cohort of 14 schools that will be implementing SEL. Programming varies across schools,
and includes Second Step, Restorative Justice, bullying prevention, and PBIS. Sacramento is
integrating SEL core competences with 21st Century Skills to improve college and career
readiness through Linked Learning.
Challenges include budgetary constraints, which are, in part, related to the same state budgetary
crisis that Oakland faces—numerous ongoing initiatives and turnover in key staff positions that
have disrupted program development and continuity. There has been turnover in the SEL
Director position during the first half of the year. The current SEL Director came on as the part-
time interim director in January 2013 and expects to continue through at least December 2013.
The former Chief Family and Community Engagement Officer and SEL Director is now chief of
staff, which has elevated the importance of SEL in the district. The solid leadership structure for
SEL has been a significant indicator of progress in the CDI.
Washoe County, Nevada (WCSD). Washoe County is the only CDI district that is not solely
urban. The county is roughly 200 miles long and 35 miles wide, bordering California and
Oregon; most of the population is concentrated in the south. The northern half of the county is
rural. Washoe County has the highest percentage of White students of any CDI district (48
percent). Another 37.5 percent are Latino, 4.7 percent are Asian, and 2.6 percent are African
American; 44 percent of students are economically disadvantaged.
Since 2010, Washoe County’s strategic plan has guided improvement efforts, including its three
major initiatives: (1) Common Core State Standards, (2) the Professional Growth System (an
evaluation system for teachers), and (3) multitiered systems of support. Washoe County began
implementing RTI and PBIS, two major academic and behavioral support initiatives, districtwide
in 2008.
Washoe County’s major accomplishments in the CDI this year include developing SEL standards
using the input of diverse stakeholders; providing many PD sessions related to SEL, particularly
to central office staff and personnel in the 12 CDI schools; integrating SEL and Common Core
State Standards, particularly through the Core Task Project (which was a three-day class over a
six-week period with 30 implementation specialists on implementing SEL strategies in ELA);

American Institutes for Research Collaborating Districts Initiative: 2015 Outcome Evaluation Report — 81
and developing a communications plan. The focus has been on SEL as an integrated strategy
rather than as a stand-alone program.
Washoe County faced a $163 million reduction in its budget over the last six years, with cuts
expected to continue in 2013–14. Washoe County’s prior superintendent was named National
Superintendent of the Year in 2012 and then left the district last summer. A new superintendent
took over in August 2012. Three new members also joined the seven-member school board in
January 2013. District leaders in Washoe County are focused on integrating SEL into other
district initiatives. SEL work in Washoe is led by the multitiered systems of support coordinator
(who devotes 20 percent of her time to SEL) and one full-time SEL specialist. A graduate
student was also hired part time to conduct an SEL needs assessment.
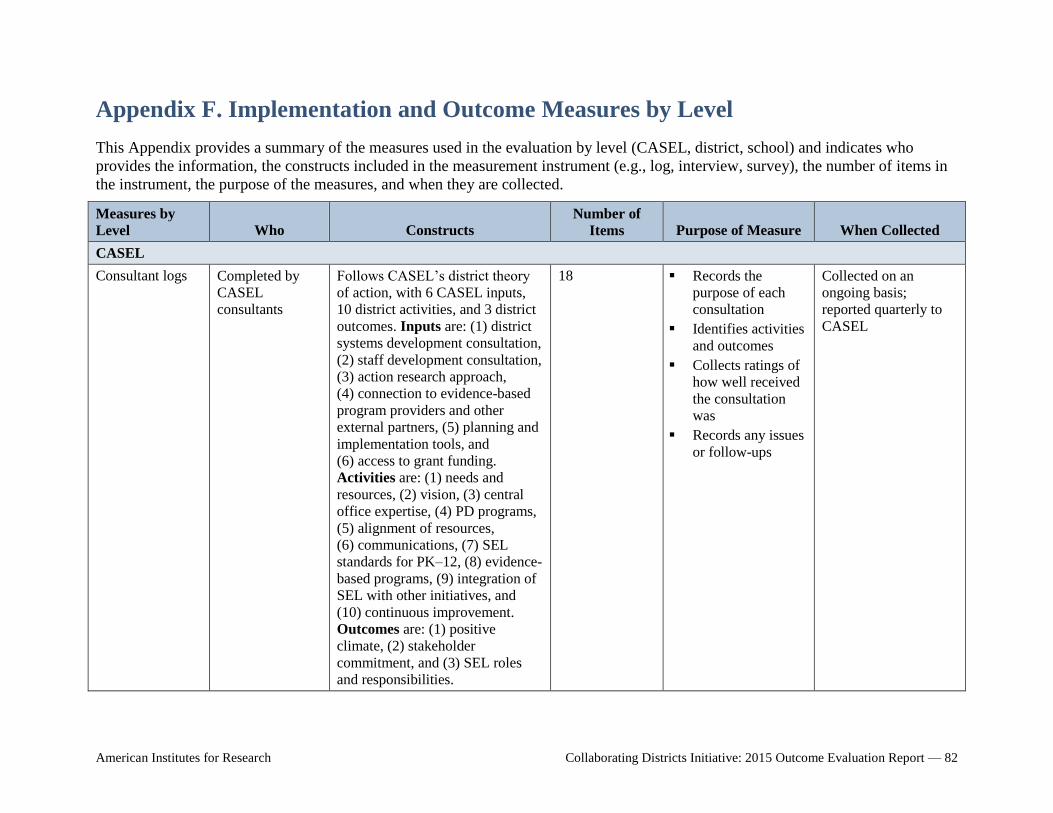
American Institutes for Research Collaborating Districts Initiative: 2015 Outcome Evaluation Report — 82
Appendix F. Implementation and Outcome Measures by Level
This Appendix provides a summary of the measures used in the evaluation by level (CASEL, district, school) and indicates who
provides the information, the constructs included in the measurement instrument (e.g., log, interview, survey), the number of items in
the instrument, the purpose of the measures, and when they are collected.
Measures by
Level Who Constructs
Number of
Items Purpose of Measure When Collected
CASEL
Consultant logs Completed by
CASEL
consultants
Follows CASEL’s district theory
of action, with 6 CASEL inputs,
10 district activities, and 3 district
outcomes. Inputs are: (1) district
systems development consultation,
(2) staff development consultation,
(3) action research approach,
(4) connection to evidence-based
program providers and other
external partners, (5) planning and
implementation tools, and
(6) access to grant funding.
Activities are: (1) needs and
resources, (2) vision, (3) central
office expertise, (4) PD programs,
(5) alignment of resources,
(6) communications, (7) SEL
standards for PK–12, (8) evidence-
based programs, (9) integration of
SEL with other initiatives, and
(10) continuous improvement.
Outcomes are: (1) positive
climate, (2) stakeholder
commitment, and (3) SEL roles
and responsibilities.
18 Records the
purpose of each
consultation
Identifies activities
and outcomes
Collects ratings of
how well received
the consultation
was
Records any issues
or follow-ups
Collected on an
ongoing basis;
reported quarterly to
CASEL
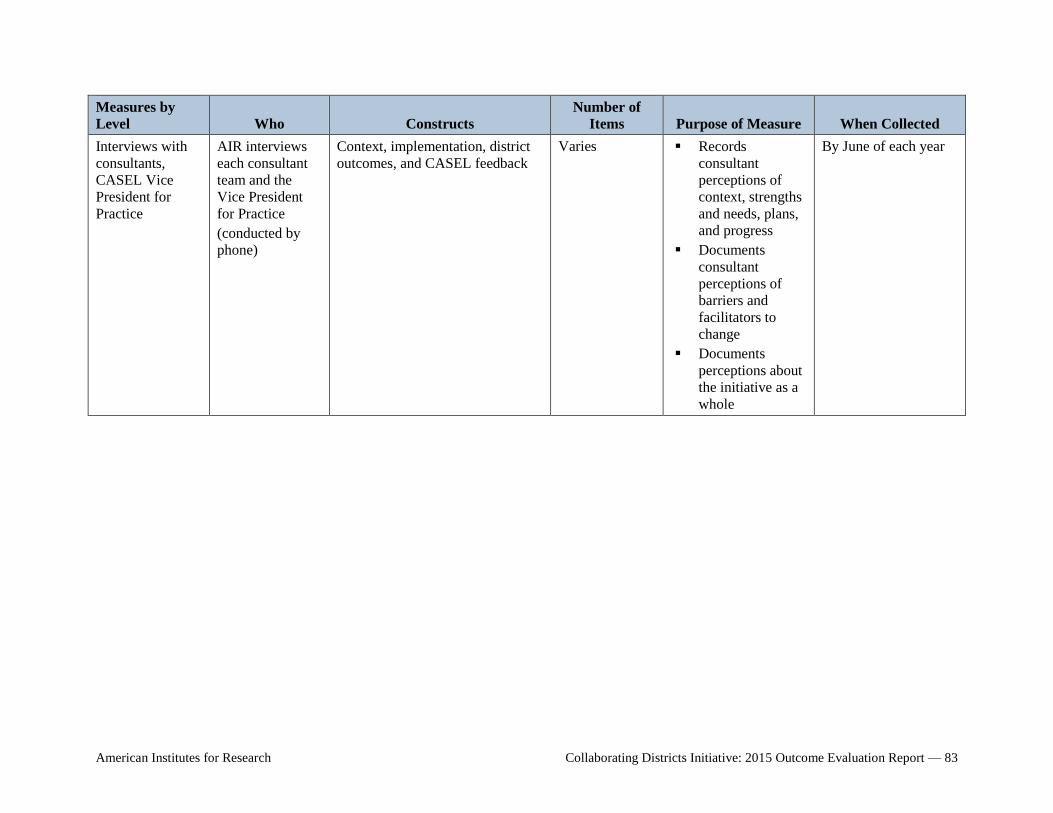
American Institutes for Research Collaborating Districts Initiative: 2015 Outcome Evaluation Report — 83
Measures by
Level Who Constructs
Number of
Items Purpose of Measure When Collected
Interviews with
consultants,
CASEL Vice
President for
Practice
AIR interviews
each consultant
team and the
Vice President
for Practice
(conducted by
phone)
Context, implementation, district
outcomes, and CASEL feedback
Varies Records
consultant
perceptions of
context, strengths
and needs, plans,
and progress
Documents
consultant
perceptions of
barriers and
facilitators to
change
Documents
perceptions about
the initiative as a
whole
By June of each year
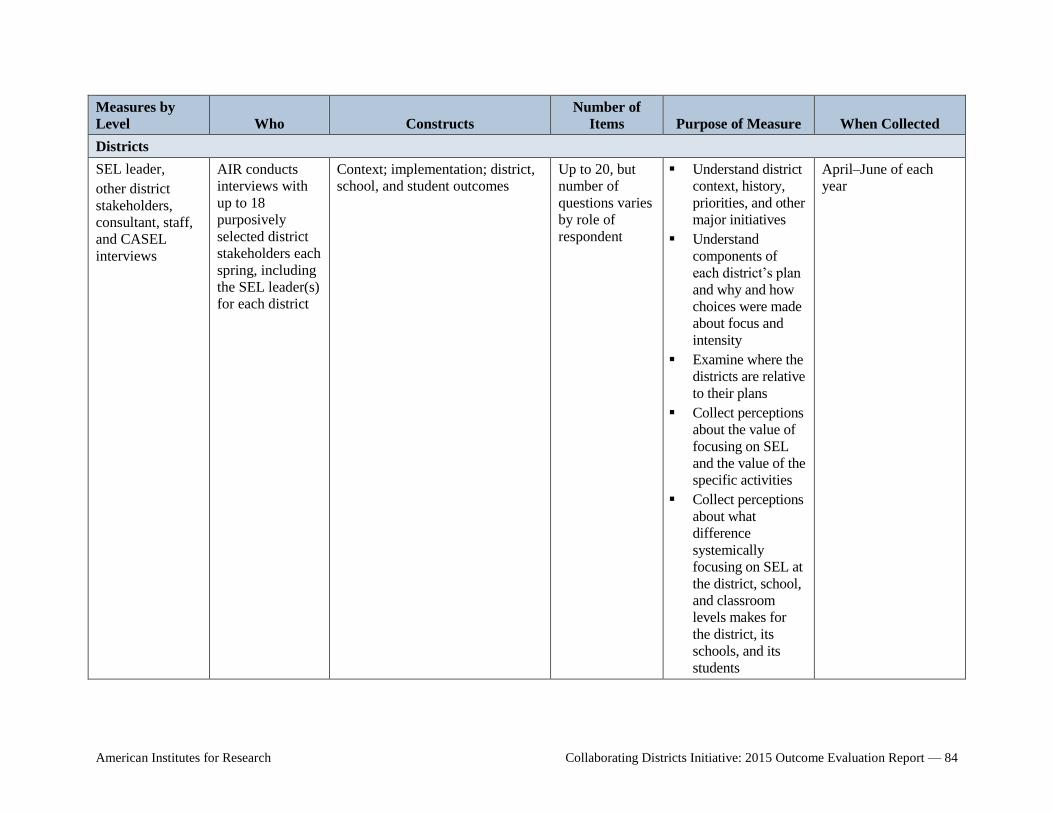
American Institutes for Research Collaborating Districts Initiative: 2015 Outcome Evaluation Report — 84
Measures by
Level Who Constructs
Number of
Items Purpose of Measure When Collected
Districts
SEL leader,
other district
stakeholders,
consultant, staff,
and CASEL
interviews
AIR conducts
interviews with
up to 18
purposively
selected district
stakeholders each
spring, including
the SEL leader(s)
for each district
Context; implementation; district,
school, and student outcomes
Up to 20, but
number of
questions varies
by role of
respondent
Understand district
context, history,
priorities, and other
major initiatives
Understand
components of
each district’s plan
and why and how
choices were made
about focus and
intensity
Examine where the
districts are relative
to their plans
Collect perceptions
about the value of
focusing on SEL
and the value of the
specific activities
Collect perceptions
about what
difference
systemically
focusing on SEL at
the district, school,
and classroom
levels makes for
the district, its
schools, and its
students
April–June of each
year

American Institutes for Research Collaborating Districts Initiative: 2015 Outcome Evaluation Report — 85
Measures by
Level Who Constructs
Number of
Items Purpose of Measure When Collected
Document review AIR collects and
reviews evidence
of CDI activities
Align with CASEL’s district
theory of action explained above
N/A Document vision,
plans, activities,
resource
allocation, etc.
Review NoVo
proposals and
plans each year
AIR’s team updates
documents on an
ongoing basis, with
annual collection
complete by June
Rubric and
benchmarks
AIR completes
rubrics for each
district based on
data collected
Aligned with CASEL’s district
theory of action: activities and
outcomes
13 Monitor levels of
engagement in CDI
activities and progress
toward achieving
desired district and
school outcomes
Each July
Staff SEL survey School-based and
central office
staff with
functions related
to instruction or
student support
1. Teacher attitudes (7 items)—
awareness and commitment in
the theory of action
2. Change management (10
items)—combines vision,
needs, and resources elements
from theory of action
3. PD (6 items)—elements in the
school theory of action
4. Classroom-based practices (5
items)—related to evidence-
based programming element;
only asked of teachers who
report that there is an SEL
program in use at their school
5. Schoolwide integration (5
items)—element in the school
theory of action
6. Continuous improvement (4
Varies by role
and use of SEL
program
Measures
commitment to and
attitudes about
SEL at the district
level
Annually, usually in
the spring, but timing
can be set by districts
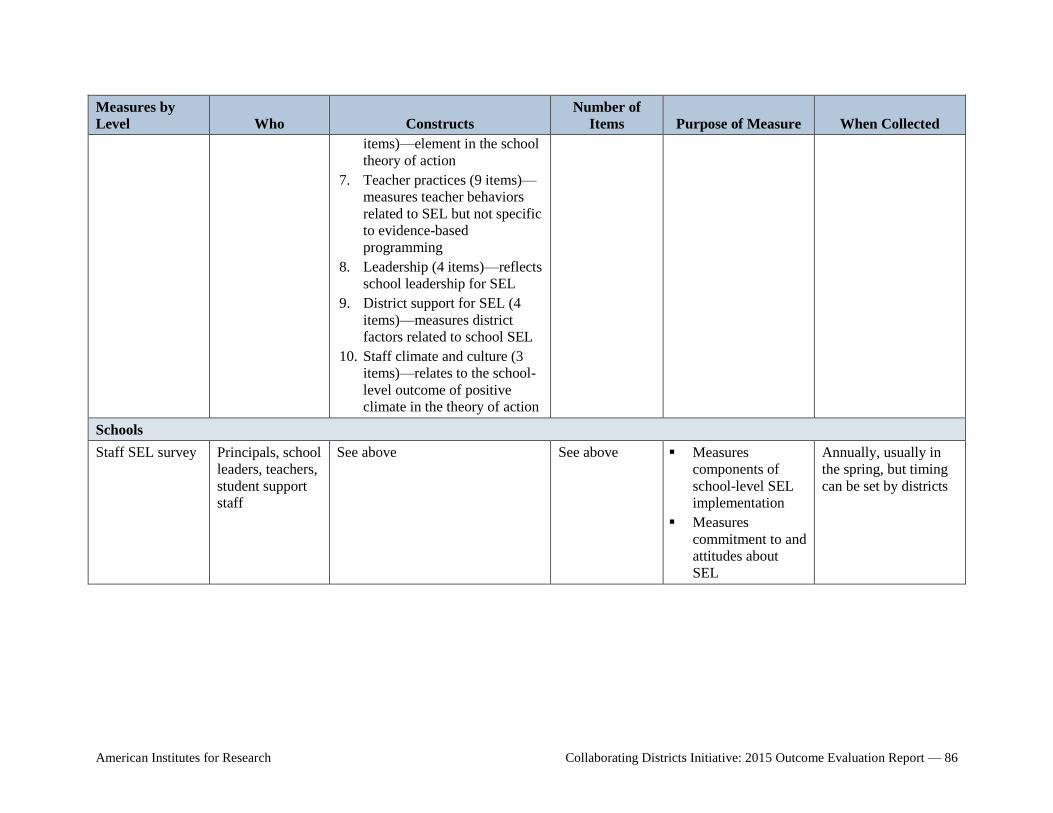
American Institutes for Research Collaborating Districts Initiative: 2015 Outcome Evaluation Report — 86
Measures by
Level Who Constructs
Number of
Items Purpose of Measure When Collected
items)—element in the school
theory of action
7. Teacher practices (9 items)—
measures teacher behaviors
related to SEL but not specific
to evidence-based
programming
8. Leadership (4 items)—reflects
school leadership for SEL
9. District support for SEL (4
items)—measures district
factors related to school SEL
10. Staff climate and culture (3
items)—relates to the school-
level outcome of positive
climate in the theory of action
Schools
Staff SEL survey Principals, school
leaders, teachers,
student support
staff
See above See above Measures
components of
school-level SEL
implementation
Measures
commitment to and
attitudes about
SEL
Annually, usually in
the spring, but timing
can be set by districts
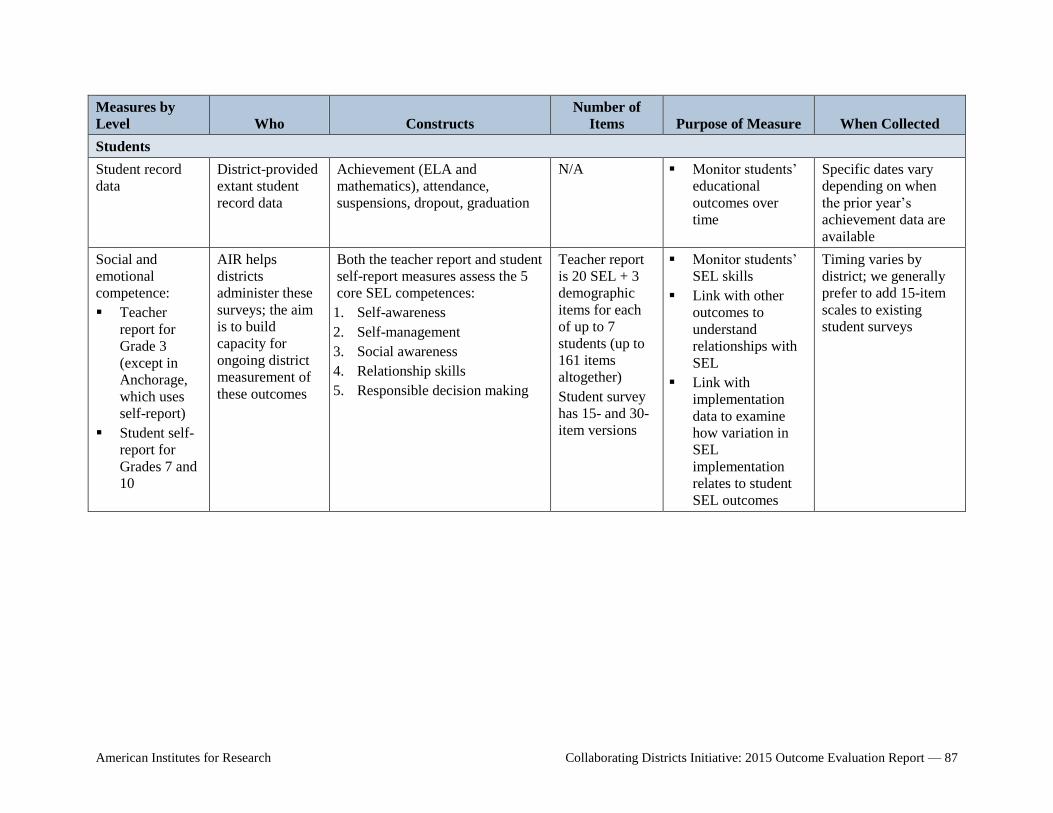
American Institutes for Research Collaborating Districts Initiative: 2015 Outcome Evaluation Report — 87
Measures by
Level Who Constructs
Number of
Items Purpose of Measure When Collected
Students
Student record
data
District-provided
extant student
record data
Achievement (ELA and
mathematics), attendance,
suspensions, dropout, graduation
N/A Monitor students’
educational
outcomes over
time
Specific dates vary
depending on when
the prior year’s
achievement data are
available
Social and
emotional
competence:
Teacher
report for
Grade 3
(except in
Anchorage,
which uses
self-report)
Student self-
report for
Grades 7 and
10
AIR helps
districts
administer these
surveys; the aim
is to build
capacity for
ongoing district
measurement of
these outcomes
Both the teacher report and student
self-report measures assess the 5
core SEL competences:
1. Self-awareness
2. Self-management
3. Social awareness
4. Relationship skills
5. Responsible decision making
Teacher report
is 20 SEL + 3
demographic
items for each
of up to 7
students (up to
161 items
altogether)
Student survey
has 15- and 30-
item versions
Monitor students’
SEL skills
Link with other
outcomes to
understand
relationships with
SEL
Link with
implementation
data to examine
how variation in
SEL
implementation
relates to student
SEL outcomes
Timing varies by
district; we generally
prefer to add 15-item
scales to existing
student surveys

American Institutes for Research Collaborating Districts Initiative: 2013 Cross-District Evaluation Report — 88
Appendix E. Staff SEL Survey Scaling and Standard Setting
The reliabilities of the individual staff scores for each of the constructs are summarized in Table
E1. Sufficient reliability is important for ensuring the validity of comparing the scores of
individuals with one another. They also allow for accurate use in statistical models (as is done in
this report). Constructs with lower reliability reduce statistical power, reducing the likelihood of
finding significant effects in the relationships among these constructs and with other outcomes.
However, these data are used to compare schools rather than individuals, which somewhat
mitigates these concerns.
For one of the constructs, Leadership, the Rasch reliability was calculated as 0.0, which may
occur when variation in the construct scores is low relative to the amount of measurement error.
This is the case for Leadership, which exhibited a ceiling effect (all ratings were very high).
However, despite the Rasch reliability being 0 for this construct, the Cronbach’s alpha was
estimated as 0.91. Therefore, we consider it appropriate to use these scores in our analyses with
the caveats just stated.
Table E1. Individual Staff Score Rasch Reliability and Cronbach’s Alpha by Construct
Construct Rasch Reliability Cronbach’s Alpha
Teacher attitudes 0.60 0.95
Change management 0.84 0.84
PD 0.70 0.93
Classroom-based practices 0.78 0.95
Schoolwide integration 0.74 0.97
Continuous improvement 0.79 0.95
Teacher practices 0.64 0.94
Leadership 0.00 0.91
District support for SEL 0.57 0.99
Staff climate and culture 0.51 0.92
Note. Cronbach’s alpha statistics are based on raw scores rather than the scaled scores used in our analyses.
CDI evaluation team members worked with staff from CASEL and district consultants to
develop a set of standards for the 10 constructs derived from the survey to delineate levels of
implementation: (1) low implementation, (2) medium implementation, or (3) high
implementation. These categories were designed to identify schools that were just starting to
implement SEL initiatives; schools that were partially, but not fully, implementing SEL
initiatives; and schools that were implementing fully. In a process driven by the expertise and
experience of CASEL staff and CASEL consultants, cut scores for each of the performance
levels were established and were applied to the data. The cut scores were then applied to the
school average scores for each construct. The percentage of schools in the low, medium, and
high implementation category for each construct was then calculated.

American Institutes for Research Collaborating Districts Initiative: 2013 Cross-District Evaluation Report — 89
Staff survey scores were available and could be aggregated to the school level for four districts
and one district network (Anchorage, Cleveland, Nashville, Sacramento, and Chicago Public
Schools West Side Network). Although the response rates for Nashville and Sacramento were 27
percent and 28 percent, respectively, we include them here because these did not aim to represent
the district as a whole but rather only the schools that had at least five respondents. In Nashville,
this was 133 out of 156 schools, or 85 percent; in Sacramento, this was 67 out of 81 schools, or
83 percent.

1889_03/15
1000 Thomas Jefferson Street NW
Washington, DC 20007-3835
202.403.5000 | TTY 877.334.3499
www.air.org