Casein fraction of ovine milk from indigenous Greek breeds · Casein fraction of ovine milk from...
13
HAL Id: hal-00895540 https://hal.archives-ouvertes.fr/hal-00895540 Submitted on 1 Jan 2004 HAL is a multi-disciplinary open access archive for the deposit and dissemination of sci- entific research documents, whether they are pub- lished or not. The documents may come from teaching and research institutions in France or abroad, or from public or private research centers. L’archive ouverte pluridisciplinaire HAL, est destinée au dépôt et à la diffusion de documents scientifiques de niveau recherche, publiés ou non, émanant des établissements d’enseignement et de recherche français ou étrangers, des laboratoires publics ou privés. Casein fraction of ovine milk from indigenous Greek breeds Golfo Moatsou, Maria Samolada, Alexandra Katsabeki, Emmanuel Anifantakis To cite this version: Golfo Moatsou, Maria Samolada, Alexandra Katsabeki, Emmanuel Anifantakis. Casein fraction of ovine milk from indigenous Greek breeds. Le Lait, INRA Editions, 2004, 84 (3), pp.285-296. <10.1051/lait:2004006>. <hal-00895540>
Transcript of Casein fraction of ovine milk from indigenous Greek breeds · Casein fraction of ovine milk from...

HAL Id: hal-00895540https://hal.archives-ouvertes.fr/hal-00895540
Submitted on 1 Jan 2004
HAL is a multi-disciplinary open accessarchive for the deposit and dissemination of sci-entific research documents, whether they are pub-lished or not. The documents may come fromteaching and research institutions in France orabroad, or from public or private research centers.
L’archive ouverte pluridisciplinaire HAL, estdestinée au dépôt et à la diffusion de documentsscientifiques de niveau recherche, publiés ou non,émanant des établissements d’enseignement et derecherche français ou étrangers, des laboratoirespublics ou privés.
Casein fraction of ovine milk from indigenous Greekbreeds
Golfo Moatsou, Maria Samolada, Alexandra Katsabeki, EmmanuelAnifantakis
To cite this version:Golfo Moatsou, Maria Samolada, Alexandra Katsabeki, Emmanuel Anifantakis. Casein fractionof ovine milk from indigenous Greek breeds. Le Lait, INRA Editions, 2004, 84 (3), pp.285-296.<10.1051/lait:2004006>. <hal-00895540>
285Lait 84 (2004) 285–296© INRA, EDP Sciences, 2004DOI: 10.1051/lait:2004006
Original article
Casein fraction of ovine milk from indigenous Greek breeds
Golfo MOATSOUa*, Maria SAMOLADAb, Alexandra KATSABEKIa, Emmanuel ANIFANTAKISa
a Laboratory of Dairy Technology, Department of Food Science and Technology, Agricultural University of Athens, Iera Odos 75, 118 55 Athens, Greeceb Laboratory of Dairy Technology, Department of Agricultural Science,
Aristotle University of Thessaloniki, 54006 Thessaloniki, Greece
Received 22 July 2003 – Accepted 21 November 2003
Published online 26 March 2004
Abstract – Whole casein fractions isoelectrically prepared from bulk milks from four different indi-genous Greek ovine breeds were analysed by urea-PAGE and reversed-phase HPLC. Individualcaseins prepared by fractionation on a cation-exchange column were used to locate the peaks on thechromatograms. Apart from heterogeneity that was depicted in the peak shape of caseins, there wasalso quantitative variability regarding the αs- and β-casein contents. According to the RP-HPLCresults, the relative percentages of individual caseins ranged as follows: κ-casein from 9.1% to10.8%, αs2-casein from 12.0% to 16.4%, αs1-casein from 33.9% to 39.9% and β-casein from 37.0%to 42.3%. According to the results obtained by both methods, the composition of the casein fractionfrom the Karagouniko breed was the most different, since it had the greatest β-casein content andthe lowest αs-casein to β-casein ratio. The relative percentages of the individual caseins in two ofthe four breeds (Frisarta and Chios) were similar. The quantification results of urea-PAGE and RP-HPLC analyses were in general similar with respect to the means. However, the relative standarddeviations of the chromatographic method were better and this was also true for the resolution ofthe components of the whole casein fraction.
Ovine casein / indigenous ovine breeds / chromatography / RP-HPLC / electrophoresis
Résumé – Fractions caséiques des laits de mélange provenant de troupeaux de brebis indigè-nes grecques. Les fractions caséiques des laits de mélange de quatre troupeaux de brebis indigènesgrecques ont été analysées par électrophorèse en gel de polyacrylamide à pH alcalin en présenced’urée (urée-PAGE) et par chromatographie liquide haute performance en phase inversée (RP-HPLC). L’identification des caséines a été effectuée par l’analyse des caséines individuelles prépa-rées par chromatographie d’échange de cations. Les résultats des analyses par RP-HPLC ontdémontré que le contenu en caséines principales variait dans les proportions suivantes: caséine κ,de 9,1 à 10,8 %, caséine αs2, de 12,0 à 16,4 %, caséine αs1, de 33,9 à 39,9 % et caséine β, de 37,0 à42,3 %. Les résultats obtenus par les deux méthodes ont démontré que la fraction caséique du trou-peau Karagouniko était la plus différente parmi les laits analysés ; elle a présent la plus haute teneuren caséine β et le plus faible rapport caséine αs1 sur caséine β. Les pourcentages relatifs des caséinesindividuelles de deux des quatre troupeaux étudiés étaient en général similaires. La résolution et lesécarts types relatifs estimés par la chromatographie, étaient meilleurs que ceux estimés par urée-PAGE.
Caséine de brebis / troupeaux de brebis indigènes / chromatographie / électrophorèse
* Corresponding author: [email protected]

286 G. Moatsou et al.
1. INTRODUCTION
The composition of ovine milk, which isrich in proteins and fat, results in excellentcheesemaking properties. A great varietyof ovine cheeses with particular character-istics are produced in the Mediterraneanarea. Caseins are responsible for the enzy-matic coagulation of milk and their hydroly-sis pattern is a very important characteristicof cheese ripening.
Although bovine and more recentlycaprine caseins have been extensivelycharacterised by a variety of analyticalmethods, the publications about ovinecasein are more limited. They are for themost part studies on the characterisationand the polymorphism of individualcaseins [1, 2, 7–11, 15–17, 34, 36, 37].Limited information exists regarding therelative percentages of the individualcaseins in the whole casein fraction ofovine milks [8, 21, 27, 33]. The influenceof the αs1-casein genotype and therefore ofthe composition of the casein fraction onthe micelle structure and the cheesemakingproperties of caprine milk has been studiedquite extensively [28–30, 35, 39]. Theinfluence of genetic polymorphism of theproteins on the technological properties ofovine milk has been reviewed by Amigoet al. [3]. Regarding the influence of thecasein genotype, it has been reported thatthe αs1-casein genotype affects milk pro-duction [12], total protein and casein con-tent, the casein micelle diameter and thecomposition of the whole casein fraction[31–33]. Consequently, it affects thecheesemaking properties of ovine milkwith respect to renneting performance andcheese yield [12, 23, 32, 33].
The purpose of the present work was tostudy the casein fractions of four Greekindigenous ovine herds by estimating therelative amounts of the individual caseinsin the whole casein fraction. For this pur-pose electrophoretic and chromatographicmethods were used.
2. MATERIALS AND METHODS
2.1. Preparation of whole casein
Bulk milks from four flocks that corre-sponded to different Greek indigenousovine breeds named Karagouniko, Bout-siko, Chios and Frisarta were collected.After centrifugation at 2000 × g for 30 minat 4 °C, the skim milks were acidified atpH 4.5 with acetic acid (1 mol·L–1) undercontinuous stirring at 25 °C. After settlingfor 20 min, the mixture was filteredthrough Whatman No. 40 paper. The pre-cipitated casein was washed with distilledwater, dissolved with the addition ofNaOH 10 g·L–1 until it reached pH 7.0 andprecipitated again. Four successive cyclesof precipitation and washing were carriedout. The final precipitate was dissolved in20 mmol·L–1 phosphate buffer, pH 7.0,heated at 80 °C for 30 min to inactivateplasmin, dialysed (MWCO 12 kg·mol–1,Sigma-Aldrich Chemie Gmbh, Steinheim,Germany) against distilled water andlyophilised. The same procedure was fol-lowed for the preparation of whole bovinecasein from a Holstein-Friesian flock.
2.2. Casein hydrolysis by chymosin
Whole casein was treated with fermen-tation-produced chymosin (Maxiren®150,Gist-Brocades, Delft, The Netherlands)according to McSweeney et al. [24]. Solu-tions of ovine whole casein (30 mg·mL–1)in 0.1 mol·L–1 phosphate buffer, pH 6.6,containing sodium azide (5 mg·100 mL–1)were heated to 30 °C. The clotting activityof chymosin solutions in 0.1 mol·L–1 phos-phate buffer, pH 6.6, was determined in10 mL ovine skim milk supplemented with10 mmol·L–1 CaCl2 at 30 °C. One unit ofthe enzyme was determined as the amountof enzyme required to coagulate 10 mL ofmilk in 100 s at 30 °C. The casein solutionswere incubated with chymosin solution ina ratio of 0.5 enzyme units per mL of caseinsolution at 30 °C for 20 and 180 min. At theend of each incubation time, the chymosin
Ovine milk casein 287
was inactivated by heating at 65 °C for30 min. Hydrolysates were dissolved inurea-polyacrylamide gel electrophoresis(urea-PAGE) sample buffer in a ratio 1:4and they were analysed by alkaline urea-PAGE.
2.3. Casein hydrolysis by plasmin
The treatment of whole casein withbovine plasmin (E.C. 3.4.21.7, Boehringer,Mannheim, Germany) was carried outaccording to the Commission Regulation[13]. Ovine casein (10 mg·mL–1) was dis-solved in 0.2 mol·L–1 ammonium hydrogencarbonate buffer, pH 8.0, and 5 µL bovineplasmin were added. After incubation at40 °C for 60 min, aminocaproic acid wasadded to inactivate the enzyme. Hydro-lysates were dissolved in urea-PAGE samplebuffer in a ratio 1:4 and they were analysedby alkaline urea-PAGE.
2.4. Urea-PAGE of casein
Whole caseins and their hydrolysateswere analysed by the urea-PAGE methodof Andrews [4] with direct staining usingCoomassie Brilliant Blue G-250 [6]. Elec-trophoresis was carried out on a verticalslab unit (LKB 2001, Amersham PharmaciaBiotech, Uppsala, Sweden) in slabs 140 ×160 × 1.5 mm. Separation gels of T =12.5% and C = 4% were used. Ten µL ofwhole casein solutions (2 mg·mL–1) wereput in stacking gel buffer containing8 mol·L–1 urea and 0.1 mol·L–1 β-mercap-toethanol. Then after incubation at 40 °Cfor 20 min, they were analysed. The gelswere run under constant current of 60 mAat 10 °C and the duration of the analysiswas about 2.5 h. After destaining withwater, the gel slabs were scanned using ascanner (Hewlett Packard, ScanJet 4c/T,USA) and the protein bands were quanti-fied by an image processing system (Gel-Compar v. 4.0, Applied Maths, Kortrijk,Belgium). Duplicates of each sample wereanalysed in each gel and four independentelectrophoretic runs were carried out foreach sample.
2.5. Cation-exchange (CE) chroma-tography of whole caseins
Lyophilised whole caseins were frac-tionated by cation-exchange chromatogra-phy on a SP-Sepharose Hiload 26/10 col-umn (Amersham Pharmacia Biotech) usinga Waters 650E automated chromatographicsystem with a tunable absorbance detector(Waters Model 486, Waters, Milford, MA,USA). A modification of the method ofHollar et al. [19] was applied. Buffer A was20 mmol·L–1 Na acetate 6 mol·L–1 urea,pH 5.0, and buffer B was similar to A butalso contained 1 mol·L–1 NaCl. Sixty mL oflyophilised casein solution (7 mg·mL–1)prepared according to Hollar et al. [19]were applied onto the column. Firstly thesample was applied onto the column at aflow rate of 2 mL·min–1 and it was washedwith buffer A at a flow rate of 3 mL·min–1
for 15 min. Then a NaCl gradient wasformed by mixing buffer A with buffer B at aflow rate of 3 mL·min–1, as follows: from 0 to0.08 mol·L–1 NaCl within 15 min, from 0.08to 0.10 mol·L–1 within 45 min, from 0.10 to0.12 mol·L–1 within 15 min, from 0.12 to0.14 mol·L–1 within 50 min, from 0.14to 0.20 mol·L–1 within 20 min and from0.20 to 0.30 mol·L–1 within 90 min. Finally,the gradient was followed by an isocraticelution with 0.30 mol·L–1 NaCl for 30 minand the column was washed with 1 mol·L–1
NaCl for 30 min at the same flow rate. Theeluate was monitored at 280 nm and thefraction size was 6 mL. The collected peakswere dialysed (MWCO 12 kg·mol–1, Sigma-Aldrich Chemie) against distilled water andlyophilised. Both buffers and samples werefiltered through 0.45 µm (Millipore Corpo-ration, Bedford, USA). Their identity andpurity were established by the reversed-phase HPLC method of Jaubert and Martin[20] and the urea-PAGE method ofAndrews [4], performed on a HoeferminiVE Vertical Electrophoresis System(Amersham Pharmacia Biotech) in gelslabs 100 × 100 × 1 mm. Proteins werefixed onto the gel by trichloroacetic acid(150 g·L–1) and stained by a Coomassie

288 G. Moatsou et al.
R-250 solution (2.5 g·L–1) in methanol,acetic acid and water (25:5:20). Gels weredestained by a solution of glycerol, aceticacid, methanol and water (3:10:40:47).
2.6. Reversed-phase HPLC(RP-HPLC)
Reversed-phase HPLC analyses wereperformed by the method of Jaubert andMartin [20] on a Vydac C4 214 TP 5415column (Separations Group, Hesperia,USA), at room temperature. The HPLC sys-tem consisted of a pump capable of mixingfour solvents (Waters 600E, Waters), a pho-todiode array detector (Waters 996), ahelium degasser, a Rheodyne 7125 injector(Rheodyne Inc., Cotati, CA, USA) and Mil-lenium software (v.3.05.01, Waters). SolventA was 1 mL·L–1 trifluroacetic acid (TFA,Serva Electrophoresis Gmbh, Heidelberg,Germany) in ultrapure water and solvent Bwas 0.96 mL TFA, 800 mL acetonitrile(Lichrosolv grade, Merck KGaA, Darm-stadt, Germany) and 200 mL ultrapure water.Solvents were filtered through 0.45 µm filters(Millipore Corporation). The flow ratewas 1 mL·min–1. A linear gradient from370 mL·L–1 to 530 mL·L–1 solvent B within30 min was applied. Samples were pre-pared according to Pierre et al. [28] asfollows: 30 mg lyophilised casein were dis-solved in 2 mL buffer, pH 7.0 (0.1 mol·L–1
tris, 8 mol·L–1 urea, 13 g·L–1 trisodium citrateand 10 mmol·L–1 dithiothreitol adjusted topH 7.0 by HCl), at 37 °C for 60 min, then18 mL of solvent A containing 6 mol·L–1
urea were added and pH was adjusted to 2.2by 50% TFA. After filtration through a0.45 µm filter (Millipore Corporation),50 µL were analysed. The protein contentof the samples was adjusted after prelimi-nary analyses. The heights of the majorcasein peaks at 214 nm, were linearly cor-related with the concentration of wholeovine casein in the sample, providing thatthe latter ranged from 20 to 100 µg caseinper injection. Four independent prepara-tions of each sample were analysed.
2.7. Isoelectric focusing (IEF) of caseins
Whole and individual caseins obtainedby CE chromatography were analysed byisoelectric focusing on ultrathin (0.20 mm)polyacrylamide gel (C = 5%, T = 3%,6 mol·L–1 urea) carried out in a LKB 2117Multiphor II Electrophoresis Unit (AmershamPharmacia Biotech). The gel layers wereprepared with a mixture of ampholytes con-sisting of PharmalyteTM pH 2.5–5.0, Phar-malyteTM pH 4.5–5.4 and AmpholineTM
pH 4.0–6.5 (Amersham Pharmacia Bio-tech) in a 1.6:1.4:1 ratio, according toFerranti et al. [17]. Staining with Coomas-sie Brilliant Blue G-250 and destainingwere according to the Commission Regula-tion [13].
3. RESULTS AND DISCUSSION
3.1. Electrophoretic and chromato-graphic profiles of whole caseins
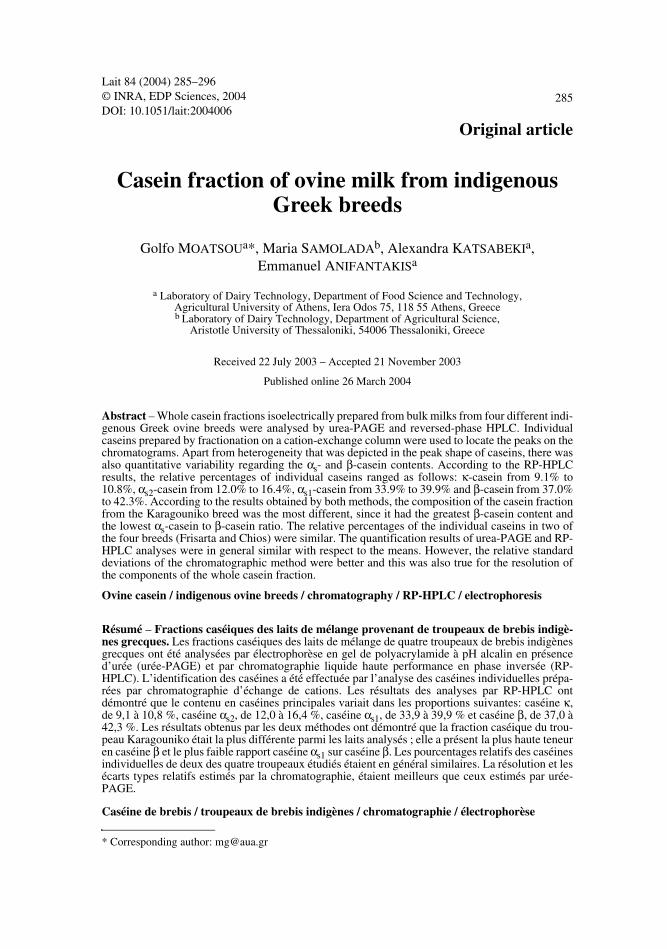
The fractionation of ovine whole casein ofthe Frisarta flock on a SP-Sepharose cation-exchange column is presented in Figure 1.According to urea-PAGE and RP-HPLCanalyses, the first eluted group of sub-stances consisted of β-mercaptoethanoland non-casein components. Peak 1 wasβ-casein. In peak 2, nothing else but differ-ent forms of κ-casein were found and inpeak 3, κ-casein coexisted with bands thatmigrated in the region of γ -caseins. Thecontent of peak × was not visualised byurea-PAGE, but in its RP-HPLC profilethere was a hydrophobic peak with highretention time similar to that of β-casein. Itcan be attributed to γ -caseins that areexpected to be co-eluted with β-caseins[18, 40]. Peaks 4 and 5 consisted mainly ofαs2-casein and also contained traces of αs1-casein. The last peak, 6, was αs1-casein. Ina cation-exchange Mono S column at 5.0,ovine αs1- and αs2-caseins are co-eluted [9,21], but by the present chromatographicanalysis they were separated from eachother.
Ovine milk casein 289
Urea-PAGE profiles of whole caseinsare shown in Figure 2 and those of the chy-mosin and plasmin hydrolysates in Figure 3 aand b. In Figure 4, the reversed-phaseHPLC profiles are presented. The identity
of each peak was established after analysisof the individual caseins obtained by cation-exchange chromatography (Fig. 1).
The elution pattern of αs1-casein wasthe most variable among the RP-HPLC
Figure 1. Cation-exchange chromatography (A280) on a SP-Sepharose Hiload 26/10 column ofwhole ovine casein of the Frisarta breed (conditions and sample preparation are described in detailin Materials and methods).
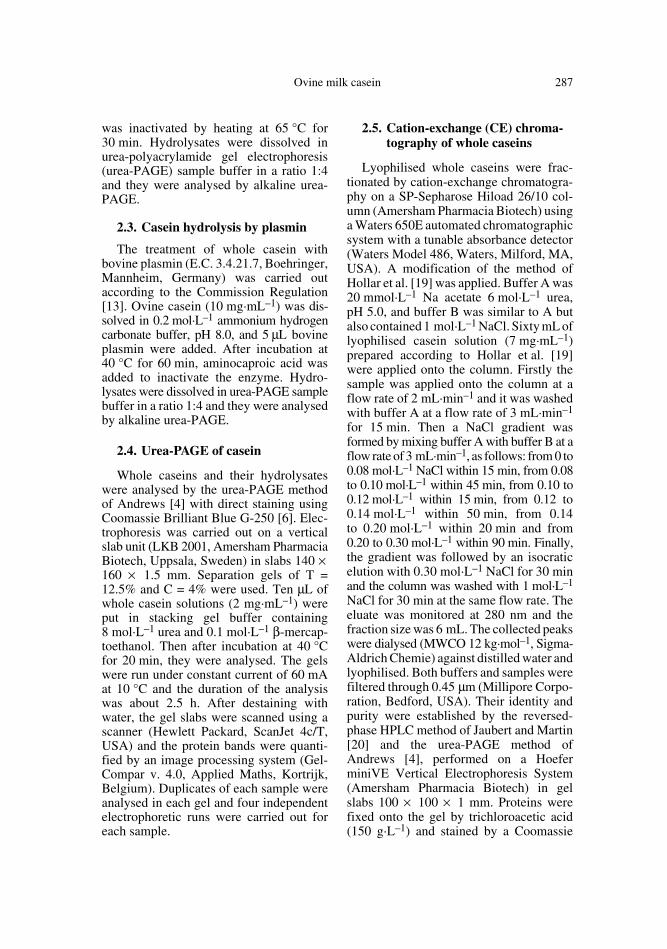
Figure 2. Urea-PAGE profiles of whole casein fractions from indigenous Greek ovine breeds.Lanes from 1 to 4, whole ovine casein fractions of the Frisarta, Chios, Karagouniko and Boutsikobreeds, respectively.
290 G. Moatsou et al.
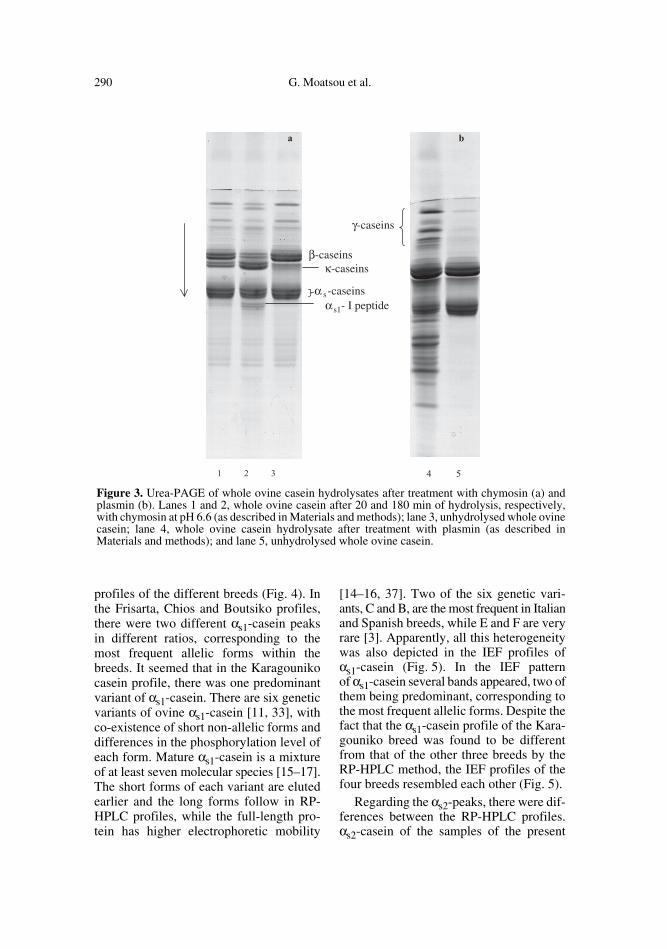
profiles of the different breeds (Fig. 4). Inthe Frisarta, Chios and Boutsiko profiles,there were two different αs1-casein peaksin different ratios, corresponding to themost frequent allelic forms within thebreeds. It seemed that in the Karagounikocasein profile, there was one predominantvariant of αs1-casein. There are six geneticvariants of ovine αs1-casein [11, 33], withco-existence of short non-allelic forms anddifferences in the phosphorylation level ofeach form. Mature αs1-casein is a mixtureof at least seven molecular species [15–17].The short forms of each variant are elutedearlier and the long forms follow in RP-HPLC profiles, while the full-length pro-tein has higher electrophoretic mobility
[14–16, 37]. Two of the six genetic vari-ants, C and B, are the most frequent in Italianand Spanish breeds, while E and F are veryrare [3]. Apparently, all this heterogeneitywas also depicted in the IEF profiles ofαs1-casein (Fig. 5). In the IEF patternof αs1-casein several bands appeared, two ofthem being predominant, corresponding tothe most frequent allelic forms. Despite thefact that the αs1-casein profile of the Kara-gouniko breed was found to be differentfrom that of the other three breeds by theRP-HPLC method, the IEF profiles of thefour breeds resembled each other (Fig. 5).
Regarding the αs2-peaks, there were dif-ferences between the RP-HPLC profiles.αs2-casein of the samples of the present
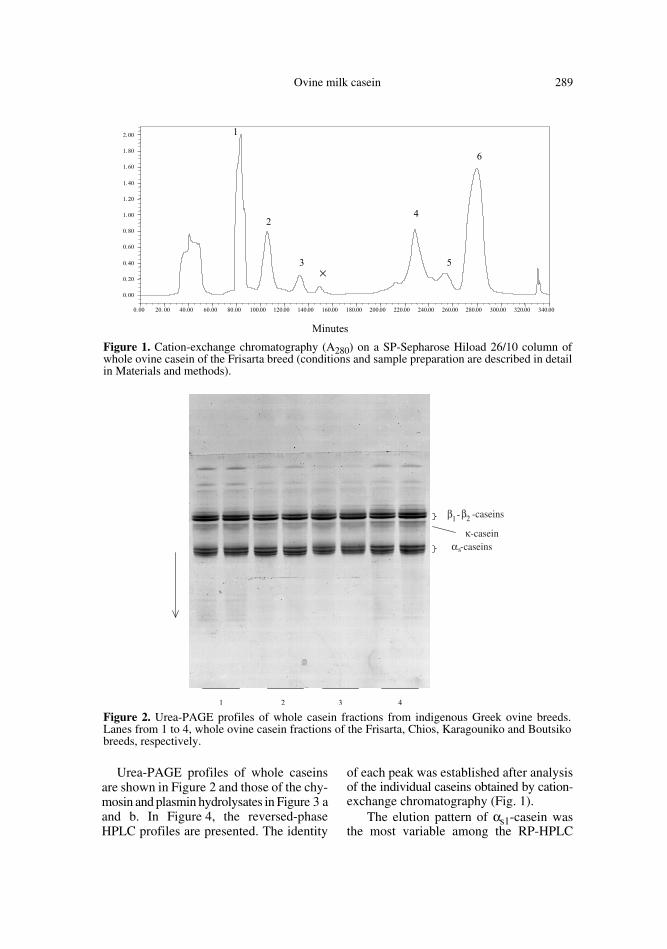
Figure 3. Urea-PAGE of whole ovine casein hydrolysates after treatment with chymosin (a) andplasmin (b). Lanes 1 and 2, whole ovine casein after 20 and 180 min of hydrolysis, respectively,with chymosin at pH 6.6 (as described in Materials and methods); lane 3, unhydrolysed whole ovinecasein; lane 4, whole ovine casein hydrolysate after treatment with plasmin (as described inMaterials and methods); and lane 5, unhydrolysed whole ovine casein.

Ovine milk casein 291
study was resolved as two distinct but notwell-resolved peaks or as a peak with ratherbroad shape on the reversed-phase column,as was the case of the Chios casein (Fig. 4).It is the most multisphorylated casein andsimilarly to its bovine counterpart, it dis-plays genetic polymorphism expressed intotwo genetic variants and a non-allelicdeleted form co-exists with the full-lengthprotein [7, 17]. Eleven components andfour main forms have been identified in theαs2-casein peak [17, 37]. Moreover, IEFanalysis of αs2-casein obtained by cation-exchange chromatography revealed manybands (Fig. 5). Due to their heterogeneity,
ovine αs1- and αs2-caseins partly co-migrated and they appeared as a group ofthree bands in the electrophoretic profiles(Fig. 2), as has also been reported by otherresearchers [11, 14, 38].
Ovine β1- and β2-caseins with 6 and 5phosphates, respectively, migrated as twoseparated bands in the urea-PAGE profiles(Fig. 2) [36]. According to Chianese et al.[10] and Ferranti et al. [17] there are alsomultiphosphorylated forms with differentmobilities containing 1–7 phosphates occur-ring simultaneously in individual ovinemilks. Ovine β-casein was eluted as a singlepeak in all RP-HPLC profiles (Fig. 4).
Figure 4. Reversed-phase HPLC profiles (A214) of whole ovine caseins from indigenous Greekbreeds (1, Frisarta; 2, Chios; 3, Karagouniko; and 4, Boutsiko).

292 G. Moatsou et al.
However, it seemed to be very heterogene-ous in the IEF patterns (Fig. 5), where theβ1- and β2-casein bands were clearly dem-onstrated. The less intense bands could beattributed to the other multiphosphorylatedforms [10, 17].
Ovine κ-caseins appeared as a diffusedband in the electrophoresis profiles (Fig. 2).Apart from Alais and Jollès [2], who havereported A and B κ-caseins in ovine milk,no genetic polymorphism has beenreported for this casein. The high degree ofκ-casein heterogeneity derived from thedifferences in phosphate and carbohydratecontent is responsible for its shape in theRP-HPLC profiles of Figure 4 [17, 37]. Itwas eluted as two rather overlapped peaks.However, its IEF profile was more com-plex, presenting three main bands (Fig. 5).This complexity was in accordance withthe reported IEF patterns of native anddephosphorylated ovine κ-casein [8, 17].
The position of κ-casein on the electro-phoretic profiles migrating just ahead of β-casein (Fig. 2) as a diffused band waslocated after the analysis of the chymosinand plasmin hydrolysates by the same urea-PAGE method (Fig. 3 a, b). The disappear-
ance of bovine κ-casein after hydrolysiswith chymosin was not clearly evident inovine casein hydrolysates because ovineκ-casein had the same mobility as proteol-ysis products of ovine β-casein (Fig. 3a).Hydrolysis of bovine whole casein by chy-mosin is accompanied by the appearance ofthe faster-moving αs1-I peptide derivedfrom bovine αs1-casein (αs1-CN f 24-191)in the urea-PAGE profiles [24]. The respec-tive peptide in ovine casein hydrolysatesbecame clearly evident after 180 min ofhydrolysis as a couple of bands moving justahead of the αs-casein bands. The rate ofhydrolysis of ovine β-casein and theappearance of the couple of β-I peptides(β-CN f1-192) [26] in the area of the κ-casein,seemed faster than that of ovine αs1-casein.The appearance of β-I and αs1-I peptides asa couple of bands has been attributed to thephosphorylation differences in the respec-tive sequences of the parent caseins [15, 36,38]. The presence of two bands of ovineαs1-I peptide could also be attributed to thedifferent mobilities of the full-length andthe deleted forms of ovine αs1-casein and ofthe different αs1-casein genotypes [16, 17,33]. Plasmin treatment of whole caseingave rise to many new bands (Fig. 3b).
Figure 5. Isoelectric focusing (IEF) profiles on ultrathin gel, pH 2.5–6.5, of whole ovine caseinsfrom indigenous Greek breeds. Lane 1, whole Boutsiko casein; lane 2, whole Karagouniko casein;lane 3, whole Chios casein; lane 4, whole Frisarta casein; lane 5, ovine αs1-casein; lane 6, ovine αs2-casein; lane 7, ovine β-casein; and lane 8, ovine κ-casein (conditions are described in detail inMaterials and methods).

Ovine milk casein 293
Apart from γ -caseins [5] many new distinctbands with mobility greater than that of αs-caseins appeared, that could result from thehydrolysis of αs1-casein by plasmin, as isreported for its bovine counterpart [22, 25].The ovine κ-casein band was clearly dem-onstrated in the plasmin hydrolysates, sinceit is quite resistant to plasmin action,according to the data reviewed by Bastianand Brown [5].
3.2. Quantification of casein fractions
The quantification results of the urea-PAGE profiles expressed as relative percen-tages of αs-, β- and κ-caseins are presentedin Table I. Regarding the results of urea-PAGE analyses, αs1- and αs2-caseins wereestimated as the group of αs-caseinsbecause they co-migrated, as explained inthe previous section. A part of the κ-caseincomponents was not expected to be quanti-fied because they are overlapping withβ-casein bands [8, 14]. The overestimationof β-casein bands was negligible, since itscontent was much higher in comparisonwith that of κ-casein. The quantification ofγ -caseins was uncertain and since they aregreatly affected by the treatment of milk
samples, they were excluded from thequantification results of Table I. In Table I,the results from the RP-HPLC analyses arealso presented. The relative quantities ofdifferent caseins were estimated by calcu-lating the individual peak areas as a per-centage of the sum of all peaks.
The relative percentages of the individ-ual ovine caseins estimated by PAGE andRP-HPLC were similar (Tab. I). However,there were differences between the breedsestimated by both methods, especially con-cerning the αs- and β-caseins content. Therelative standard deviations (RSDs) of κ-casein means estimated by urea-PAGEwere very high, because of its appearanceas a diffused band, its partial co-migrationwith β-casein and its low content.
The results of Table I were in somecases different from those reported forovine casein fractions, especially regard-ing, αs- and β-caseins. The percentage ofκ-casein, ranging from 9.1% to 10.8%, wassimilar to that reported for the milk ofSardinian ewes by Law et al. [21] and Papoffet al. [27] who used cation-exchange chro-matography. Similarly, Pirisi et al. [33]have estimated by RP-HPLC the κ-caseinrelative percentage as 9.8% in ovine milks
Table I. Means1 and relative standard deviations (RSDs)2 for the relative percentages3 of αs1-, αs2-,β- and κ-caseins in whole casein from indigenous Greek ovine breeds estimated by urea-PAGE andRP-HPLC.
Breed Method κ-casein αs-casein4 αs2-casein αs1-casein β-casein αs-casein4/ β-casein
Frisarta Urea-PAGE 10.4 (12.6) 51.7 (3.4) 37.9 (3.4) 1.36
RP-HPLC 10.2 (3.3) 14.0 (10.3) 38.8 (1.8) 37.0 (5.3) 1.43
Chios Urea-PAGE 9.8 (21.0) 53.2 (2.4) 37.0 (4.4) 1.44
RP-HPLC 10.2 (5.6) 16.4 (2.9) 36.3 (3.5) 37.1 (4.4) 1.42
KaragounikoUrea-PAGE 10.3 (26.5) 48.3 (4.7) 41.4 (2.5) 1.17
RP-HPLC 10.8 (8.0) 13.0 (3.9) 33.9 (2.2) 42.3 (3.4) 1.11
Boutsiko Urea-PAGE 10.4 (9.9) 50.2 (3.0) 39.4 (4.4) 1.27
RP-HPLC 9.1 (1.5) 12.0 (8.3) 39.9 (5.6) 39.0 (3.6) 1.33
1 Means of quantification of four independent sample preparations (n = 4); 2 standard deviationexpressed as percentage of the mean; 3 expressed as percentage of total αs1, αs2-, β- and κ-caseins; 4 αs1-casein + αs2-casein.
294 G. Moatsou et al.
from Sarda sheep of CC and CD geno-types. However, it was much lower thanthat reported for the casein of Lacha Spanishsheep, by Calavia and Burgos [8]. Theyhave estimated the κ-CN percentage tototal ovine casein to be 17%, by densito-metric analysis of the PAGE electrophore-grams of the SH containing casein.
Both αs1- and αs2-casein percentageswere quite variable among the differentbreeds. The αs2-casein percentage of theovine samples, ranging from 12.0% to16.4%, was higher than that reported byCalavia and Burgos [8]. Pirisi et al. [33]have reported that the relative αs2-caseinpercentage ranges from 11.9% to 13.9%depending on the αs1-casein genotype ofovine milk. The relative quantity of αs1-casein was also variable (from 33.9% to38.8%) among the different breeds and thelowest value was observed in the Kara-gouniko breed (33.9%). Total αs-caseinpercentage ranged from 46.9% to 52.8%according to RP-HPLC and from 48.3% to53.2% according to the PAGE results.These values were in general higher thanthose reported for ovine αs-caseins byother researchers. Addeo et al. [1] andCalavia and Burgos [8] have estimated theovine αs-caseins relative percentage as45% and 43%, respectively. Law et al. [21]and Papoff et al. [27] report very low val-ues of this percentage, 34.2% and 26.8%,respectively. However, Pirisi et al. [33]report relative percentages of αs-caseinsfrom 45.3% to 50.2%, depending on theαs1-casein genotype, which are close to thevalues of the present study.
β-Casein of the studied milks rangedfrom 37.0% to 42.3% of total caseinaccording to RP-HPLC and from 37.0% to41.4% according to the PAGE results. Thehighest value was estimated by both meth-ods in Karagouniko casein. Calavia andBurgos [8] found that the β-casein percent-age in the Spanish Lacha milk is about38% in whole casein. Law et al. [21] andPapoff et al. [27] found that in the wholecasein fraction of Sardinian ewes, β-casein
accounts for about 50%, but Pirisi et al.[33] report percentages of β-casein from40% to 43%.
There is a link between αs1-caseingenetic variants and milk composition,which affects cheese yield [12, 31, 32].According to the conclusions of Amigoet al. [3], the αs1-casein D variant, even inassociation with others, results in lowercasein content and poorer technologicalproperties of ovine milk. From the resultsof Pirisi et al. [33], it is obvious that alower αs-casein/β-casein ratio in ovinemilk, similar to that estimated in Kara-gouniko casein, is related to lower totalprotein and casein content of milk, greatermicellar size, and longer clotting time andcurd firming rate. From the results of thepresent study, Karagouniko milk would beexpected to have inferior technologicalproperties, compared with the milk of theother three breeds, although its IEF profilewas not different regarding the αs1-caseinbands. Therefore, a further study has to beundertaken to relate the casein characteris-tics and technological properties of themilks of the present study.
4. CONCLUSIONS
Regarding the differences between theindigenous Greek ovine breeds, it seemedthat in addition to the heterogeneity that wasdepicted in the peak shape of caseins, therewas also quantitative variability, especiallyconcerning the main casein groups (αs- andβ-caseins). Casein from the Karagounikobreed had the greatest β-casein content andthe lowest αs- to β-casein ratio, while therelative percentages of the individual caseinsin the Frisarta and Chios breeds were verysimilar. The effect of this variability on thetechnological properties and especially onthe cheesemaking properties of ovine milkhas to be studied.
The RP-HPLC method of Jaubert andMartin [20] was appropriate for the analy-ses of ovine casein as it is for caprine

Ovine milk casein 295
caseins. The heterogeneity of the individualcaseins was depicted more clearly than byurea-PAGE. Furthermore, αs-caseins wereresolved in αs1- and αs2-peaks. Althoughthe estimated relative percentages by bothmethods were similar, the RSDs of RP-HPLC means were much better. Fractiona-tion by cation-exchange chromatographyresulted in a very satisfactory separation ofwhole ovine casein components.
REFERENCES
[1] Addeo F., Mauriello R., Moio L., Laezza P.,Chianese L., Di Luccia A., Ovine casein variantidentification using electrophoretic, immu-nochemical and chromatographic techniques,Milchwissenschaft 47 (1992) 283–287.
[2] Alais C., Jollès P., Isolation, purification andanalysis of two κ-casein-like fractions fromsheep casein, J. Dairy Sci. 50 (1967) 1555–1561.
[3] Amigo L., Recio I., Ramos M., Geneticpolymorphism of ovine milk proteins: itsinfluence on technological properties ofmilk – a review, Int. Dairy J. 10 (2000) 135–149.
[4] Andrews A.T., Proteinases in normal bovinemilk and their action on caseins, J. DairyRes. 50 (1983) 45–55.
[5] Bastian E.D., Brown R.J., Plasmin in milkand dairy products: an update, Int. Dairy J. 6(1996) 435–457.
[6] Blakesley R.W., Boezzi J.A., A new stainingtechnique for protein in polyacrylamide gelsusing Coomassie Brilliant Blue G-250,Anal. Biochem. 82 (1977) 580–582.
[7] Boisnard M., Hué D., Bouniol C., MercierJ.-C., Gaye P., Multiple mRNA species codefor two non-allelic forms of ovine αs2-casein, Eur. J. Biochem. 201 (1991) 633–641.
[8] Calavia M.C., Burgos J., Ovine κ-casein inmilk from Lacha Spanish sheep: heteroge-neity and total content, Int. Dairy J. 8 (1998)779–786.
[9] Cattaneo T.M.P., Nigro F., Toppino P.M.,Denti V., Characterization of ewe’s milk bycapillary zone electrophoresis, J. Chroma-togr. 721 (1996) 345–349.
[10] Chianese L., Garro G., Ferranti P., MalorniA., Addeo F., Rabasco A., Molina Pons P.,Discrete phosphorylation generates the elec-trophoretic heterogeneity of ovine β-casein,J. Dairy Res. 62 (1995) 89–100.
[11] Chianese L., Garro G., Mauriello R., LaezzaP., Ferranti P., Addeo F., Occurrence of fiveαs1-casein variants in ovine milk, J. DairyRes. 63 (1996) 49–59.
[12] Chianese L., Mauriello R., Ferranti P., TripaldiC., Taibi L., Dell’Aquilla S., Relationshipbetween αs1-casein variants and clottingcapability of ovine milk, in: “Milk and milkprotein polymorphism”, Special Issue 9702,Int. Dairy Fed., Brussels, Belgium (1997)pp. 316–323.
[13] Commission Regulation, Reference methodfor the detection of cow’s milk and caseinatein cheeses from ewes’ milk, goats’ milk andbuffalos’ milk or mixtures of ewes’, goats’and buffalos’ milk, EEC No 1081/96, 14 June1996, J. Eur. Commun. 142 (1996) 15–25.
[14] Dall’Olio S., Davoli R., Russo V., Affinitychromatography of ovine casein, J. DairySci. 73 (1990) 1707–1711.
[15] Ferranti P., Malorni A., Nitti G., Laezza P.,Pizzano R., Chianese L., Addeo F., Primarystructures of ovine αs1-caseins: localizationof phosphorylation sites and characteriza-tion of genetic variants A, C and D*, J. DairyRes. 62 (1995) 281–296.
[16] Ferranti P., Chianese L., Malorni A.,Migliaccio F., Stingo V., Addeo F., Copre-sence of deleted protein species generatesstructural heterogeneity of ovine αs1-casein,J. Agric. Food Chem. 46 (1998) 411–416.
[17] Ferranti P., Pizzano R., Garro G., Caira S.,Chianese L., Addeo F., Mass spectrometry-based procedure for the identification ofovine casein heterogeneity, J. Dairy Res. 68(2001) 35–51.
[18] Groen A.F., van der Vegt R., van BoeckelM.A.J.S., de Rouw O.L.A.M., Vos H., Casestudy on the individual animal variation inmilk protein composition as estimated byhigh-performance liquid chromatography,Neth. Milk Dairy J. 48 (1994) 201–212.
[19] Hollar C.M., Law A.J.R., Dalgleish D.G.,Brown R.J., Separation of major casein frac-tions using cation exchange fast proteinliquid chromatography, J. Dairy Sci. 74(1991) 2403–2409.
[20] Jaubert A., Martin P., Reverse-phase HPLCanalysis of goat caseins. Identification of αs1and αs2 genetic variants, Lait 72 (1992) 235–247.
[21] Law A.J.R., Papoff C.M., Dalgleish D.G.,Campus R.L., Quantitative fractionation ofovine casein by cation exchange FPLC,Milchwissenschaft 47 (1992) 279–282.
[22] Le Bars D., Gripon J.C., Hydrolysis of αs1-casein by bovine plasmin, Lait 73 (1993)337–344.

296 G. Moatsou et al.
[23] López-Gálvez G., Ramos M., Martín-ÁlvarezP.J., Juárez M., Influence of milk proteinspolymorphism on cheese producing abilityin the milk of Manchega breed cows, in:“Cheese yield and factors affecting its con-trol”, Special Issue 9402, Int. Dairy Fed.,Brussels, Belgium (1994) pp. 167–173.
[24] McSweeney P.L.H., Olson N.F., Fox P.F.,Healy A., Højrup P., Proteolytic specificityof chymosin on bovine αs1-casein, J. DairyRes. 60 (1993) 401–412.
[25] McSweeney P.L.H., Olson N.F., Fox P.F.,Healy A., Højrup P., Proteolytic specificityof plasmin on bovine αs1-casein, Food Bio-technol. 7 (1993) 143–158.
[26] Mulvihill D.M., Fox P.F., Proteolytic speci-ficity of chymosins and pepsin on β-caseins,Milchwissenschaft 34 (1979) 680–683.
[27] Papoff C.M., Law A.J.R., Dalgleish D.G.,Campus R.L., Determination of the compo-sition of ovine casein by anion-exchangeFPLC, Sci. Tec. Latt. Casearia 44 (1993)273–291.
[28] Pierre A., Michel F., Le Graët Y., Variationin size of goat milk casein micelles related tocasein genotype, Lait 75 (1995) 489–502.
[29] Pierre A., Michel F., Le Graët Y., ZahouteL., Casein micelle size in relation withcasein composition and αs1, αs2, β and κ-casein in goat milk, Lait 78 (1998) 591–605.
[30] Pirisi A., Collin O., Laurent F., Scher J.,Parmentier M., Comparison of milk compo-sition, cheesemaking properties and texturalcharacteristics of the cheese from twogroups of goats with a high or low rate ofαs1-casein synthesis, Int. Dairy J. 4 (1994)329–345.
[31] Pirisi A., Piredda G., Di Salvo R., PapoffC.M., Pintus S., Influence of ovine αs1-casein genotype on milk composition andcheese yielding capacity, in: “Productionand utilization of ewe and goat milk”, Spe-cial Issue 9603, Int. Dairy Fed., Brussels,Belgium (1996) pp. 179–183.
[32] Pirisi A., Piredda G., Fraghi A., PapoffC.M., Chianese L., Influence of sheep AA,CC and DD αs1-casein variants on milkcomposition and cheese yield, in: “Milk pro-tein polymorphism”, Special Issue 9702, Int.Dairy Fed., Brussels, Belgium (1997)pp. 254–258.
[33] Pirisi A., Piredda G., Papoff C.M., Di SalvoR., Pintus S., Garro G., Ferranti P., ChianeseL., Effects of sheep αs1-casein CC, CD andDD genotypes on milk composition andcheesemaking properties, J. Dairy Res. 66(1999) 409–419.
[34] Provot C., Persuy M.A., Mercier J.C., Com-plete nucleotide sequence of ovine β-caseincDNA: inter-species comparison, Biochimie71 (1989) 827–832.
[35] Remeuf F., Influence du polymorphismegénétique de la caséine αs1 caprine sur lescaractéristiques physico-chimiques et tech-nologiques du lait, Lait 73 (1993) 549–557.
[36] Richardson B.C., Mercier J.C., The primarystructures of ovine β-casein, Eur. J. Bio-chem. 99 (1979) 285–297.
[37] Trujillo A.-J., Casals I., Guamis B., Analysisof major ovine milk proteins by reversedphase high-performance liquid chromato-graphy and flow injection analysis with elec-trospray ionization mass spectrometry, J.Chromatogr. 870 (2000) 371–380.
[38] Trujillo A.J., Guamis B., Laencina J., LópezM.B., Proteolytic activities of some milkclotting enzymes on ovine casein, FoodChem. 71 (2000) 449–457.
[39] Vassal L., Delacroix-Buchet A., Bouillon J.,Influence des variants AA, EE et FF de lacaséine αs1 caprine sur le rendement froma-ger et les caractéristiques sensorielles de fro-mages traditionnels : premières observa-tions, Lait 74 (1994) 89–103.
[40] Visser S., Slangen K.J., Rollema H.S., Highperformance liquid chromatography of bovinecaseins with the application of various statio-nary phases, Milchwissenschaft 41 (1986)559–562.