CASE STUDY: Plan Sponsor Insights on Custom Target...
14
Tim Dillane Director, Pension Investments Merck & Co., Inc. Dick Davies Senior Managing Director AllianceBernstein, L.P. CASE STUDY: Plan Sponsor Insights on Custom Target-Date and Re-Enrollment
Transcript of CASE STUDY: Plan Sponsor Insights on Custom Target...

Tim Dillane
Director, Pension Investments
Merck & Co., Inc.
Dick Davies
Senior Managing Director
AllianceBernstein, L.P.
CASE STUDY: Plan
Sponsor Insights on
Custom Target-Date
and Re-Enrollment
Today’s Discussion
• Overview of Merck’s 401(k) Plan
• Reasons For Going Custom
• Implementation Process
• Portfolio Design Decisions
• Re-Enrollment Case Study
• Potential Plan and Portfolio Enhancements
2

Merck 401(k) Plan Profile
• Assets of $8.8 billion
• 44,500 participants
• 96% participation rate
• 75% match on first 6% of contributions
• Auto-enrollment at 6% rate
• Auto-escalation up to 10%
• Custom TDF: April 2009
• TDF Assets: $3.7 billion
• Recordkeeper: Fidelity
42%
23%
6%
8%
13%
2%
6%
Merck Plan Assets
Target-Date
Large Cap Equities
Small Cap Equities
Int'l Equities
Company Stock
Fixed Income
Money Market
3

Merck Investment Menu
Tier 1“All-in-One” Approach
Target Date Funds (QDIA)
Merck’s “Retirement Portfolios”
Simple, Yet Sophisticated:A Fully Diversified
Portfolio in a Single Fund
Tier 2“Build Your Own”
Approach
Core Options
Active Options Money Market Fund
US Large Cap Equity
US Small Cap Equity
International Equity (2)
Company Stock
Passive Options S&P 500
Russell 2000
MSCI EAFE
Barclays US Agg
Basic “Food Groups”
42%
58%
4
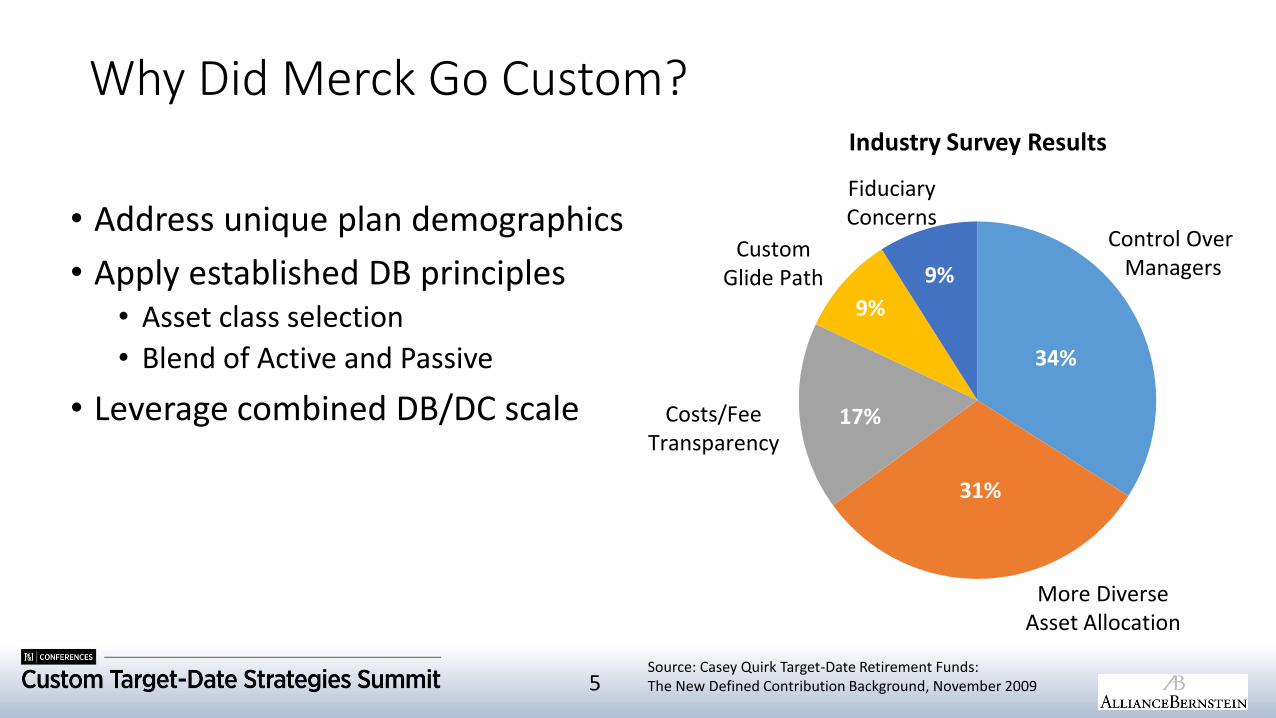
Why Did Merck Go Custom?
• Address unique plan demographics
• Apply established DB principles• Asset class selection
• Blend of Active and Passive
• Leverage combined DB/DC scale
34%
31%
17%
9%
9%
Control Over Managers
CustomGlide Path
More DiverseAsset Allocation
Costs/FeeTransparency
FiduciaryConcerns
Source: Casey Quirk Target-Date Retirement Funds: The New Defined Contribution Background, November 2009
Industry Survey Results
5

Implementation: Three Primary Workstreams
Investments Design Glide Path
Glide path
Asset classes
Components
OperationsDaily Operations/
Develop Asset Transition Strategy
Component transition strategy
Interfaces:
Recordkeeper
Managers
Custodian
CommunicationsAdvise and Consult With Recordkeeper
on Participant Communications Strategy Introduction
Ongoing
6

7
Glide Path Customization Issues
Custom Target-Date Glide Paths Range
AllianceBernstein Clients
Source: AllianceBernstein
0
20
40
60
80
100
20 30 40 50 60 70 80 90 100
% S
tock
Age
Key Customization Considerations
Goals, risk tolerance or other objectives
Typical retirement age and post-retirement behavior
Company stock holdings and defined benefits
Wage level, growth and deferrals
Employment risk or frequency of job changing
Sponsor perspective
7

Asset Class Usage in Custom Portfolios22 Plans – Year-End 2013
Equity Fixed Income Diversifiers
AssetClasses
US
Lar
geC
ap
US
Smal
l/M
id C
ap
US
All
Cap
Int’
l Dev
elo
ped
Int’
l Sm
all C
ap
Emer
gin
g M
arke
ts
Co
reB
on
d
Glo
bal
Bo
nd
Go
v’t
Bo
nd
Hig
h Y
ield
Lon
g D
ura
tio
n
Sho
rt D
ura
tio
n
Emer
gin
g M
arke
ts
TIP
S
Stab
le V
alu
e
Cas
h
REI
TS
Co
mm
od
itie
s
Rea
l Ass
ets
Ris
k Pa
rity
Active 2 5 - 4 - 8 7 2 - 11 1 3 2 6 3 6 7 3 2 1
Blend 5 7 - 8 - - 2 - - - - - - - - - - - - -
Passive 14 9 1 10 1 4 12 - 1 1 - 7 - 15 - 1 7 2 - -
TotalPlans
21 21 1 22 1 12 21 2 1 12 1 10 2 21 3 5 14 5 2 1
Source: AllianceBernsteinActive Bias Passive/Hybrid Bias
8

Stocks
BondsDiversifiers
This chart does not represent any particular target date fund. It is meant to show how the investment mix of any target-date portfolio changes over a lifetime.Numbers may not sum due to rounding.Source: AllianceBernstein
0
25
50
75
100
25 30 35 40 45 50 55 60 65 70 75 80 85+
Exp
osu
re
(%)
AgeYoung Saver Midlife Saver New Retiree Senior Retiree
25 30 35 40 45 50 55 60 65 70 75 80 85+
US Large Cap Stocks 43.5 43.5 43.5 43.5 43.4 41.6 38.0 35.0 32.6 27.7 22.1 16.5 16.5
US Small Cap Stocks 15.0 15.0 15.0 15.0 14.5 13.3 12.5 10.8 8.7 6.4 4.7 3.0 3.0
International Stocks 26.8 26.8 26.8 26.8 26.5 25.1 23.1 21.0 18.9 15.6 12.3 8.9 8.9
Emerging Markets Stocks 4.7 4.7 4.7 4.7 4.7 4.4 4.1 3.7 3.3 2.8 2.2 1.6 1.6
Core Fixed Income 10.0 10.0 10.0 10.0 11.0 15.5 16.1 16.9 21.5 21.8 23.6 25.4 25.4
TIPS 0.0 0.0 0.0 0.0 0.0 0.0 6.4 12.6 15.0 15.0 15.0 15.0 15.0
Cash 0.0 0.0 0.0 0.0 0.0 0.0 0.0 0.0 0.0 10.7 20.1 29.6 29.6
Total Stock Allocation 90.0 90.0 90.0 90.0 89.0 84.5 77.5 70.5 63.5 47.5 41.3 30.0 30.0
Total Diversifier/Bond Allocation 10.0 10.0 10.0 10.0 11.0 15.5 22.5 29.5 36.5 52.5 58.7 70.0 70.0
Stocks
Bonds
Merck Portfolio Construction
9

Re-Enrollment Case Study
Date
November 2009 Merck merged with Schering-Plough (S-P)
November 2010 Merck’s Investment Committee approved a harmonized investment lineup for domestic DC plans
August/September 2011
Legacy S-P plan participants were given a 6-week window to make investment elections from the new lineup
• Participants who did not make an active election are defaulted, per his/her age, into a custom target-date fund
October 2011 Participant balances were re-allocated per election window results
10

33% of Legacy Plan Participants Made Elections
20%
9%
24%
8% 7%
12%
21%
7% 7% 8%6%
4%
6%
61%
0%
10%
20%
30%
40%
50%
60%
70%
Money Market Bonds US Large Cap
Equity
US Small/Mid
Cap Equity
Global/Int'l
Equity
Company Stock Asset Allocation
% o
f Pla
n A
sset
s
Pre Re-Allocation - Sep 2011
Post Re-Allocation - Oct 2011
11

Target-Date Defaults: More Systematic Outcomes
Representative DC data for the example client reflect stock allocations for excluding self-directed brokerage investments as of 1Q:09 for 29,483 participants with over $5,000 in account value.
401(k) plan average stock allocations exclude investments in target-date funds and treat allocations to balanced funds as 50% stock.
Source: AllianceBernstein
Percent of Assets Invested in Equities By Age – Client Example
AllianceBernstein Implemented Target-Date Glide Path Equities by Participant
0
20
40
60
80
100
25 30 35 40 45 50 55 60 65
12

Re-Enrollment Growing, But Still Misconceptions
12.2%
76.8%
8.5%
0 1 2 3 4 5 6 7
Too Costly
Mgmt Objections
Admin Complexities
Communication Difficult
Fiduciary Liabilities
Not Necessary
Participant Objections
10 = Most Important
YesNext Year
No
?
Have You Re-Enrolled? Why Not Re-Enroll?
Source: Callan 2014 Defined Contribution Trends
13

What’s Next For Merck?
• Continue to streamline core investment menu
• Pursue “investment re-allocation” for primary US Savings Plan
• Revisit glide path methodology in response to DB plan design changes
• Evaluate portfolio construction under various AUM scenarios
14


![PROJECT NARRATIVE · Web viewProposal Title Sponsor Name Sponsor Office or Department Proposal Title Page | i Page | 10 [Custom cover page can be created] P roject T itle: Applicant/Institution:](https://static.fdocuments.in/doc/165x107/5d42a02288c993897c8dcf55/project-narrative-web-viewproposal-title-sponsor-name-sponsor-office-or-department.jpg)


![welcome [d3smcx1ckyjfrg.cloudfront.net]d3smcx1ckyjfrg.cloudfront.net/wp_esp/wp-content/...WEF_Sponsorship...We accomplish this by custom tailoring each sponsor activation to ... Many](https://static.fdocuments.in/doc/165x107/5aab81207f8b9a693f8bfe21/welcome-accomplish-this-by-custom-tailoring-each-sponsor-activation-to-many.jpg)