Case study on Serbia · PDF fileRetail roaming outgoing calls –postpaid 10,6 11,5 1,6...
14
Roaming regulation Case study on Serbia Vesna Tintor Economic Regulation Department Budva, 2016
Transcript of Case study on Serbia · PDF fileRetail roaming outgoing calls –postpaid 10,6 11,5 1,6...

Roaming regulation Case study on Serbia
Vesna Tintor
Economic Regulation Department
Budva, 2016

Roaming regulation in Serbia
• Agreement on reducing the prices of roaming services onpublic mobile communications networks among ministriesresponsible for the area of electronic communications fromBosnia and Herzegovina, Republic of Macedonia, Montenegroand Republic of Serbia was signed on 29 September 2014.
• In December 2014 RATEL’s Managing Board brought theDecision which sets out the implementation schedule formaximum prices applied to wholesale and retail charges forcalls, SMS, MMS and data.
2

0,29
0,08 0,09
0,7
0,24
0,07 0,08
0,45
0,19
0,05 0,06
0,2
Outgoing call (per minute) Incoming call (per minute) SMS Data services and MMS (price per MB/message)
from 30.06.2015. until 30.06.2016. from 01.07.2016. until 30.06.2017. from 01.07.2017. on
Maximum retail roaming charges
3
*prices in euros, VAT excluded

0,14
0,03
0,25
0,1
0,02
0,15
0,05
0,02
0,05
Call (per minute) SMS Data (price per MB)
from 30.06.2015. until 30.06.2016. from 01.07.2016. until 30.06.2017. from 01.07.2017. on
Maximum average wholesale roaming charges
*prices in euros, VAT excluded
4

Roaming subscribers
5
1.1811.219
391 400345 358
640 639
802844
688630 598
677 697
791
Q3 2014 Q3 2015 Q4 2014 Q4 2015 Q1 2015 Q1 2016 Q2 2015 Q2 2016
Number of roaming subscribers from Serbia (in thousands)
Number of foreigners – roaming subscribers from Macedonia, Montenegro and Bosnia and Herzegovina (in thousands)

Retail roaming outgoing calls - prepaid
Outgoing calls increased by10,7% in Q3 2015, 31% in Q42015, 46,5% in Q1 2016 and28,6% in Q2 2016 compared tothe same periods previousyear
Outgoing calls incomedecreased by 26,7% in Q32015, 40% in Q4 2015, 37,5%in Q1 2016 and 41,7% in Q22016 compared to the sameperiods previous year
0,30
0,22
0,10 0,06 0,08
0,05
0,12
0,07
Q3 2014 Q3 2015 Q4 2014 Q4 2015 Q1 2015 Q1 2016 Q2 2015 Q2 2016
Outgoing calls income (millions of euros) -prepaid
1415,5
4,55,9
4,36,3 7
9
Q3 2014 Q3 2015 Q4 2014 Q4 2015 Q1 2015 Q1 2016 Q2 2015 Q2 2016
Outgoing calls (millions of minutes) - prepaid
*All presented data on retail level include traffic from tariff add-ons and exclude income from tariff add-ons
6

Retail roaming incoming calls – prepaid
Incoming calls decreasedby 7,6% in Q3 2015, 6,5%in Q4 2015, 11,9% in Q12016 and 22,2% in Q22016 compared to thesame periods previousyear
Incoming calls incomedecreased by 15% in Q32015, 22% in Q4 2015,14,3% in Q1 2016 and30% in Q2 2016compared to the sameperiods previous year
9,28,5
4,6 4,3 4,23,7
5,4
4,2
Q3 2014 Q3 2015 Q4 2014 Q4 2015 Q1 2015 Q1 2016 Q2 2015 Q2 2016
Incoming calls (millions of minutes) - prepaid
0,20
0,17
0,09 0,07 0,07
0,06
0,10 0,07
Q3 2014 Q3 2015 Q4 2014 Q4 2015 Q1 2015 Q1 2016 Q2 2015 Q2 2016
Incoming calls income (millions of euros) -prepaid
7

Retail roaming outgoing calls – postpaid
10,611,5
1,6 1,7 1,5 1,6
3,2 3,5
Q3 2014 Q3 2015 Q4 2014 Q4 2015 Q1 2015 Q1 2016 Q2 2015 Q2 2016
Outgoing calls (millions of minutes) - postpaid
1,47 1,43
0,46 0,29
0,41
0,23
0,49
0,27
Q3 2014 Q3 2015 Q4 2014 Q4 2015 Q1 2015 Q1 2016 Q2 2015 Q2 2016
Outgoing calls income (millions of euros) - postpaid
8
Outgoing calls increased by8,5% in Q3 2015, 6,3% in Q42015, 6,7% in Q1 2016 and9,4% in Q2 2016 compared tothe same periods previousyear
Outgoing calls incomedecreased by 2,7% in Q32015, 37% in Q4 2015, 43,9%in Q1 2016 and 44,9% in Q22016 compared to the sameperiods previous year
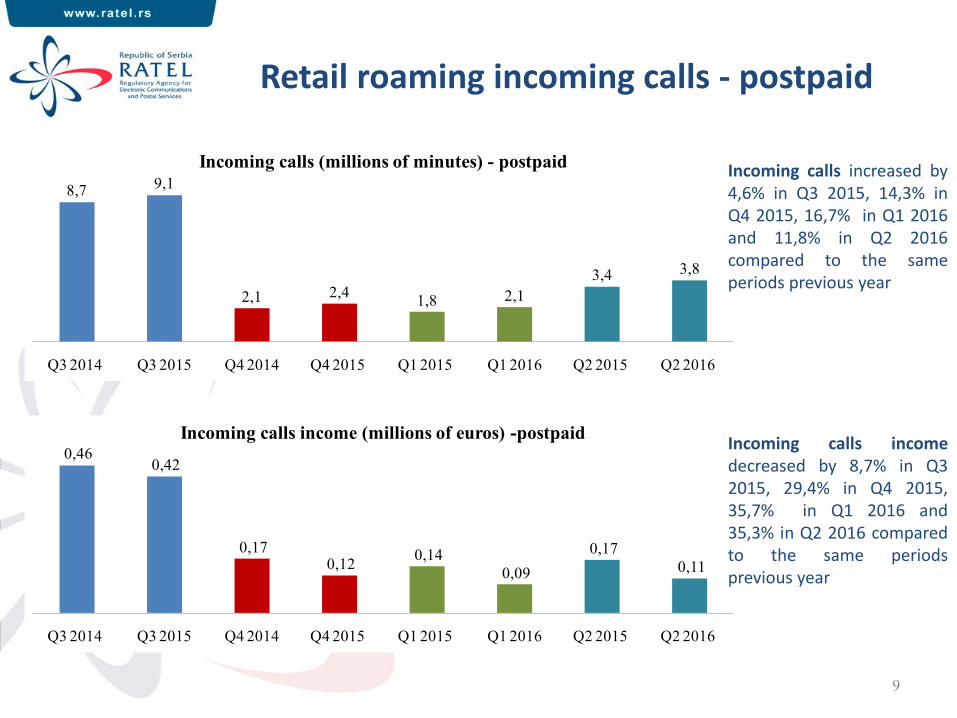
Retail roaming incoming calls - postpaid
8,7 9,1
2,1 2,41,8 2,1
3,4 3,8
Q3 2014 Q3 2015 Q4 2014 Q4 2015 Q1 2015 Q1 2016 Q2 2015 Q2 2016
Incoming calls (millions of minutes) - postpaid
0,46 0,42
0,17 0,12
0,14
0,09
0,17
0,11
Q3 2014 Q3 2015 Q4 2014 Q4 2015 Q1 2015 Q1 2016 Q2 2015 Q2 2016
Incoming calls income (millions of euros) -postpaid
9
Incoming calls increased by4,6% in Q3 2015, 14,3% inQ4 2015, 16,7% in Q1 2016and 11,8% in Q2 2016compared to the sameperiods previous year
Incoming calls incomedecreased by 8,7% in Q32015, 29,4% in Q4 2015,35,7% in Q1 2016 and35,3% in Q2 2016 comparedto the same periodsprevious year

Retail roaming SMS
Number of SMSdecreased by 13,4% in Q32015, 5,9% in Q4 2015,8,8% in Q1 2016 and5,8% in Q2 2016compared to the sameperiods previous year
SMS income decreasedby 11,8% in Q3 2015,28% in Q4 2015, 32% inQ1 2016 and 33,3% in Q22016 compared to thesame periods previousyear
18,6
16,1
3,4 3,2 3,4 3,15,2 4,9
Q3 2014 Q3 2015 Q4 2014 Q4 2015 Q1 2015 Q1 2016 Q2 2015 Q2 2016
Number of SMS (millions)
1,10 0,97
0,25 0,18
0,25 0,17
0,30 0,20
Q3 2014 Q3 2015 Q4 2014 Q4 2015 Q1 2015 Q1 2016 Q2 2015 Q2 2016
SMS income (millions of euros)
10

Retail roaming Data
Data traffic increased by282% in Q3 2015, 307,4%in Q4 2015, 235,1% in Q12016 and 145,8% in Q22016 compared to thesame periods previousyear
Data income increasedby 25,6% in Q3 2015 anddecreased by 21,1% in Q42015, 30% in Q1 2016and 2,8% in Q2 2016compared to the sameperiods previous year
33,09
126,40
9,15
37,28
14,99
50,23
29,50
72,50
Q3 2014 Q3 2015 Q4 2014 Q4 2015 Q1 2015 Q1 2016 Q2 2015 Q2 2016
Data (TB) - prepaid + postpaid
0,78
0,98
0,19 0,15 0,20 0,14
0,36 0,35
Q3 2014 Q3 2015 Q4 2014 Q4 2015 Q1 2015 Q1 2016 Q2 2015 Q2 2016
Data income (millions of euros)
11

Wholesale - Roaming traffic (calls, SMS and data) and income generated by roamers from
Bosnia and Herzegovina, Macedonia and Montenegro
• On annual level, Calls traffic increased more compared toincrease in income which leads to conclusion that averagewholesale price for calls decreased.
• Number of SMS decreased less compared to income decreasewhich leads to conclusion that average wholesale SMS pricedecreased.
• Increase in Data traffic followed by income decrease showsthat average price for this service decreased.
12

Wholesale - Roaming traffic (calls, SMS and data) and costs generated from Serbian subscribers
visiting Bosnia and Herzegovina, Macedonia, and Montenegro
• Increase in minutes of Calls followed by slower increase incosts leads to conclusion that average wholesale price for callsdecreased.
• Costs for SMS services decreased more compared to decreasein number of SMS and shows decrease in average price forthis service.
• Data traffic increased more compared to costs which leads toconclusion that there was decrease in average price for thisservice.
13

Thank you for your attention!
Regulatory Agency for Electronic Communications and Postal Services - RATEL
Palmotićeva 2, Belgrade
www.ratel.rs