Case Study on Sea-Level Rise Impacts - OECD.org - … Case Study on Sea-Level Rise Impacts Robert...
14
1 Case Study on Sea-Level Rise Impacts Robert Nicholls Flood Hazard Research Centre Middlesex University, London, UK [email protected] OECD Workshop on the Benefits of Climate Policy Improving Information for Policy Makers 12-13 December 2002 PLAN • Sea-Level Rise Scenarios • Why care? • Impacts • Concluding Remarks
Transcript of Case Study on Sea-Level Rise Impacts - OECD.org - … Case Study on Sea-Level Rise Impacts Robert...

1
Case Study on Sea-LevelRise Impacts
Robert NichollsFlood Hazard Research Centre
Middlesex University, London, [email protected]
OECD Workshop on the Benefits of Climate PolicyImproving Information for Policy Makers
12-13 December 2002
PLAN
• Sea-Level Rise Scenarios
• Why care?
• Impacts
• Concluding Remarks

2
Processescontrolling
sea-levelchange
Relative sea-level changes
Global Component ofSea-Level Rise
Ocean Volume controlled by:• Ocean temperature -- thermal expansion;
• Melting/collapse of land-based ice:– small glaciers;
– Greenland;
– Antarctica (West Antarctic Ice Shelf collapse);
• The hydrological cycle.

3
Regional/Local Components ofSea-Level Change
• Regional meteo-oceanographic factors– pattern of thermal expansion
– wind and pressure effects
• Vertical land movement– glacial-isostatic adjustment (GIA)
– tectonics
– neotectonics
– human-induced subsidence
Sea-Level Rise at New York City1850 to 2100
6
8
Sea
Lev
el (
m)
1850 1900 1950 2000 2050 2100 Time (yrs)
Observations Scenarios

4
SRES: Sea-Level Rise ScenariosHadCM3 Model -- Climate Sensitivity Constant
0.0
0.1
0.2
0.3
0.4
1990 2010 2030 2050 2070 2090
Time (yrs.)
Glo
bal
-Mea
n R
ise
(m)
A1FIB1A2B2
Sea-Level Rise ScenariosStabilisation with HadCM2 Model
0
0.5
1
1950 2000 2050 2100 2150 2200 2250 2300
Time (years)
Hei
gh
t (m
)
GGa1S750S550

5
Population (bars) andPopulation Density(lines) vs. Distance
and Elevationin 1990
Coastal Megacities (>8 million people)
Forecast for 2010
Is tanbul
LagosLima
Buenos Aires R io de JaneiroMadras
KarachiJakarta
Calcutta
Bombay
Bangkok
Manila
S hanghai
Osaka
T okyo
S eoul
T ianjin
Dhaka
New York
Los Angeles

6
Coastal Ecosystems
KEY:• mangroves, o saltmarsh, x coral reefs
National Vulnerability Profiles
ANTIGUA
WITH MEASURES
WITH MEASURES
NO MEASURES
NO MEASURES
peopleaffected
peoplea ffected
protectioncosts
protectioncosts
peoplea t risk
peopleat risk
wetlandat loss
wetlandat loss
landat loss
landa t losscapital
valueat loss
capita lva lueat loss
peopleat risk
peoplea t risk
ARGENTINA
NIGERIA
VENEZUELA
based on expert judgement
based on analyses
LOW
Vulnerability profile classes
MEDIUMHIGHCRITICAL
URUGUAY
TONGA
SEYCHELLES
SENEGAL
POLAND
NEVIS
NETHERLANDS
MAURITIUS
MARSHALLS
KIRIBATI
JAPAN
GUYANA
EGYPT
BENIN
BANGLADESH

7
SENSITIVE SYSTEMS
• Populated deltas;
• Small islands, especially atolls;
• Coastal ecosystems.
Definition of Impacts
POTENTIAL IMPACTS
SEA-LEVEL RISE
INITIAL IMPACTS
RESIDUAL IMPACTS
REACTIVE ADAPTATION
ANTICIPATORY ADAPTATION

8
The Co-Evolving Coastal System
OTHER STRESSES
CLIMATE CHANGE/
SEA-LEVELRISE
NATURAL SYSTEM
SENSITIVITY ADAPTIVE CAPACITY
SOCIO-ECONOMIC SYSTEM
SENSITIVITY ADAPTIVE CAPACITY
Coastal Flood Methodology
Relative Sea-LevelRise Scenarios
Raised Flood Levels
Global Sea-levelRise Scenarios
Size of FloodHazard Zones
People in theHazard Zone
Subsidence
Storm SurgeFlood Curves
Coastal Topography
PopulationDensity
Protection Status(1in 10, 1 in 100, etc.) (“EXPOSURE”)
(“RISK”)Average AnnualPeople Flooded, etc.
9
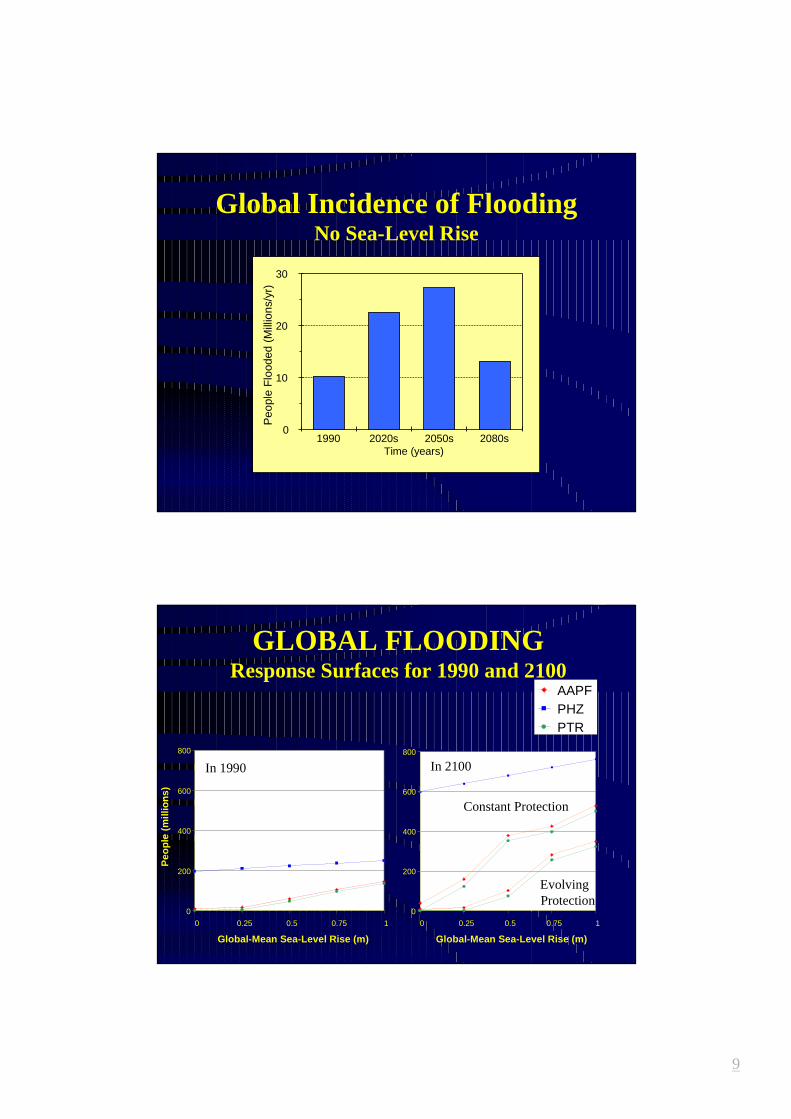
Global Incidence of FloodingNo Sea-Level Rise
0
10
20
30 P
eopl
e F
lood
ed (
Mill
ions
/yr)
1990 2020s 2050s 2080sTime (years)
GLOBAL FLOODINGResponse Surfaces for 1990 and 2100
0
200
400
600
800
0 0.25 0.5 0.75 1
Global-Mean Sea-Level Rise (m)
Peo
ple
(m
illio
ns)
AAPFPHZPTR
0
200
400
600
800
0 0.25 0.5 0.75 1
Global-Mean Sea-Level Rise (m)
In 1990 In 2100
Constant Protection
Evolving Protection

10
People Flooded Under Evolving Protection -- relative to an evolving non-climate baseline
0
1000
2000
3000
2020s 2050s 2080s
% In
crea
se
Low Scenario Mid Scenario High Scenario
Vulnerable RegionsMid estimate in the 2080s
C
A
C
B
PEOPLE AT RISK(millions per region)
> 50 million
10 - 50 million
< 10 million
region boundary
vulnerable island region
Pa c ificOcea nSMALLISLANDS
Ca ribbea n
India nOcea nSMALL ISLANDS
C
B
A

11
Additional People FloodedUnmitigated (IS92a) vs. Mitigated Emissions
0
25
50
75
100
2020s 2050s 2080s
Peo
ple
Flo
od
ed (m
illio
ns/
year
)UnmitigatedS750S550
Sea-Level Rise ScenariosStabilisation with HadCM2 Model
0
0.5
1
1950 2000 2050 2100 2150 2200 2250 2300
Time (years)
Hei
gh
t (m
)
GGa1S750S550

12
Coastal Wetland LossesOnly considers sea-level rise
0
10
20
2020s 2050s 2080s 2110s 2140s 2170s 2200s 2230s
Net
Lo
sses
(%
)
Unmitigated S750 S550
SRES: Sea-Level Rise ScenariosHadCM3 Model -- Climate Sensitivity Constant
0.0
0.1
0.2
0.3
0.4
1990 2010 2030 2050 2070 2090
Time (yrs.)
Glo
bal
-Mea
n R
ise
(m)
A1FIB1A2B2

13
Concluding Remarks 1• Sea-level rise could be a serious problem in
coastal zones, but the uncertainties are large;
• Impacts are strongly influenced by humanactivities and choices;
• Reducing greenhouse gas emissions could avoidsome sea-level rise impacts, but only delay others;
• An unquantified benefit of mitigation is to reducethe risk of large/abrupt sea-level rises;
• Much of the benefits of mitigation for coastalzones lie in the 22nd Century and beyond -- buthow to evaluate and communicate?
Concluding Remarks 2• Coastal zones need adaptation, within the context
of wider coastal management;
• Small islands have special adaptation needs;
• Some useful further research:– Full assessment of the range of possible impacts, including low
probability/high impact events;
– Improved top-down tools to quantify and explore and mapvulnerable ‘hotspots’;
– The adaptation process in coastal zones as this remains a majorgap in our understanding;
– other climate change, particularly changing storm conditions.

14
Case Study on Sea-LevelRise Impacts
Robert NichollsFlood Hazard Research Centre
Middlesex University, London, [email protected]
OECD Workshop on the Benefits of Climate PolicyImproving Information for Policy Makers
12-13 December 2002