Case study of Lidar in cold climate and complex terrain in ... · Case study of Lidar in cold...
27
Case study of Lidar in cold climate and complex terrain in Canada Results of the 2012-2013 measurement campaign in Rivière-au-Renard (Québec) Canada Presented by: Matthew Wadham-Gagnon At Winterwind 2014 Cédric Arbez, TechnoCentre éolien Mathieu Boquet, Léosphère Raghu Krishnamurthy, Léosphère
Transcript of Case study of Lidar in cold climate and complex terrain in ... · Case study of Lidar in cold...
Case study of Lidar in cold climate and
complex terrain in Canada
Results of the 2012-2013 measurement campaign in
Rivière-au-Renard (Québec) Canada
Presented by: Matthew Wadham-Gagnon
At Winterwind 2014
Cédric Arbez, TechnoCentre éolien
Mathieu Boquet, Léosphère
Raghu Krishnamurthy, Léosphère

Topics
• Objectives of the measurement campaign
• Infrastructure used for the study
– Met mast MMV2 – 126 m height & Lidar Léosphère Wincube v2
• Measurement campaign
– Site description, acquisition period, QC , Communications features
• Performance of the Lidar in CC & complex terrain
• Data availability of the Lidar in Cold Climate &
complex terrain
– Recovery rate of the Lidar & Long term analysis
• Recommendations
• Future projects

3
Objectives of the measurement campaign
• Verify the long term data availability of the Lidar in complex terrain and cold climate;
• Gain insight into LiDAR bias in complex terrain;
• Continue the previous measurement campaign done in 2011-2012 at Anse-a-Valleau presented at CanWEA

TechnoCentre éolien (TCE)
SNEEC
4
Office
Over 1500MW in operation (Dec 2013)
Murdochville’s met masts

5
SNEEC
www.eolien.qc.ca
• Two 2.05 MW Repower MM92 CCV
• Commissioned March 2010
• Icing & complex terrain
• R&D, technological transfer, technological validation, performance assessment.
6
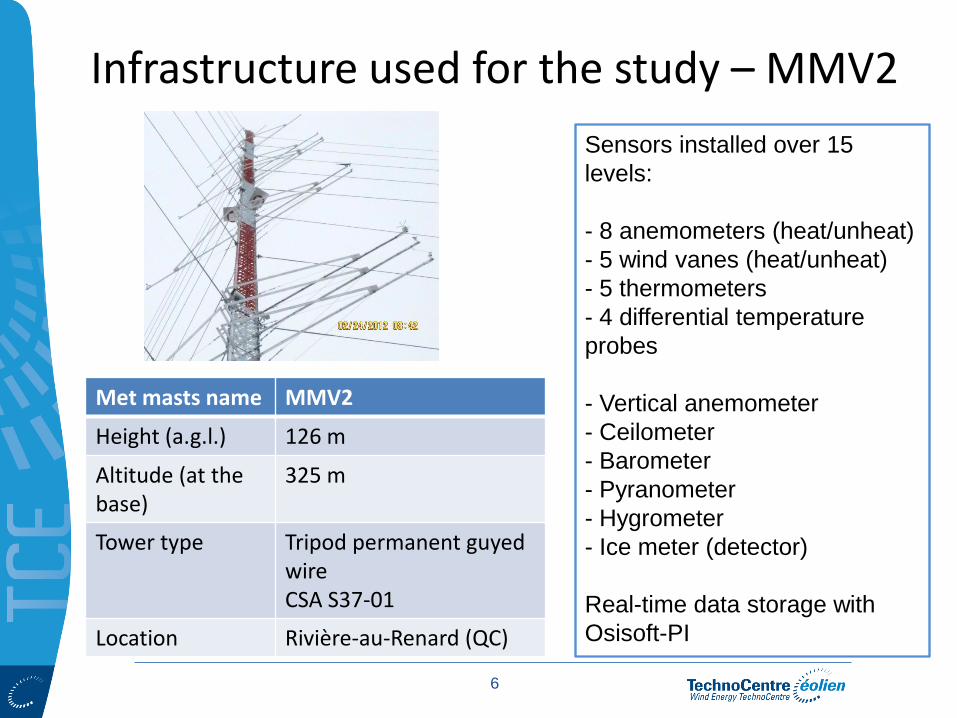
Infrastructure used for the study – MMV2
Met masts name MMV2
Height (a.g.l.) 126 m
Altitude (at the base)
325 m
Tower type Tripod permanent guyed wire CSA S37-01
Location Rivière-au-Renard (QC)
Sensors installed over 15
levels:
- 8 anemometers (heat/unheat)
- 5 wind vanes (heat/unheat)
- 5 thermometers
- 4 differential temperature
probes
- Vertical anemometer
- Ceilometer
- Barometer
- Pyranometer
- Hygrometer
- Ice meter (detector)
Real-time data storage with
Osisoft-PI

7
Introduction- Topographical layout SNEEC
projected
projected

8
Infrastructure used for the study –
WindCube Lidar v2 & acquisition period
32 m from met mast
3 m from met mast
Season From To
Summer 01-08-2012 12-10-2012
Winter 01-02-2013 14-03-2013
More than 4 months

9
Infrastructure used for the study
11 levels of measured provided from LIDAR: -40 m -55 m -76 m -80 m -100 m -103 m -126 m -140 m -160 m -180 m -200 m

10
Measurement campaign – data acquisition
CAN-BUS communication linked with Osisoft-PI
archived system

11
Measurement campaign –QC
Quality control with more than 32 tests covering:
1- Functionnal check
2- Area check
3- Trend check
4- Cross comparison check
5- Status notification including special meteorologic detection (ex: icing, low temperature, no
cloud)

12
Measurement campaign – site description
Characteristics Units Comments
Lowest temperature
-26,15 C Site conform to GL Technical note 069
Highest wind speed 31,5 m/s During the measurement campaign
Snow accumulation 1 meter height
Remote area At 7 km from the nearest village
Low CNR measured during the winter

13
Performance of the Lidar in CC & complex terrain

14
Performance of the Lidar in CC & complex terrain
R2 table
All seasons
Summer
Winter
34 m 0,9848 0,9843 0,9836
80 m 0,9869 0,9883 0,9842
126 m 0,9848 0,9951 0,9932
All correlation overestimated lightly the wind compare to the met mast (slope of relation around 1,003 to 1,04)
15
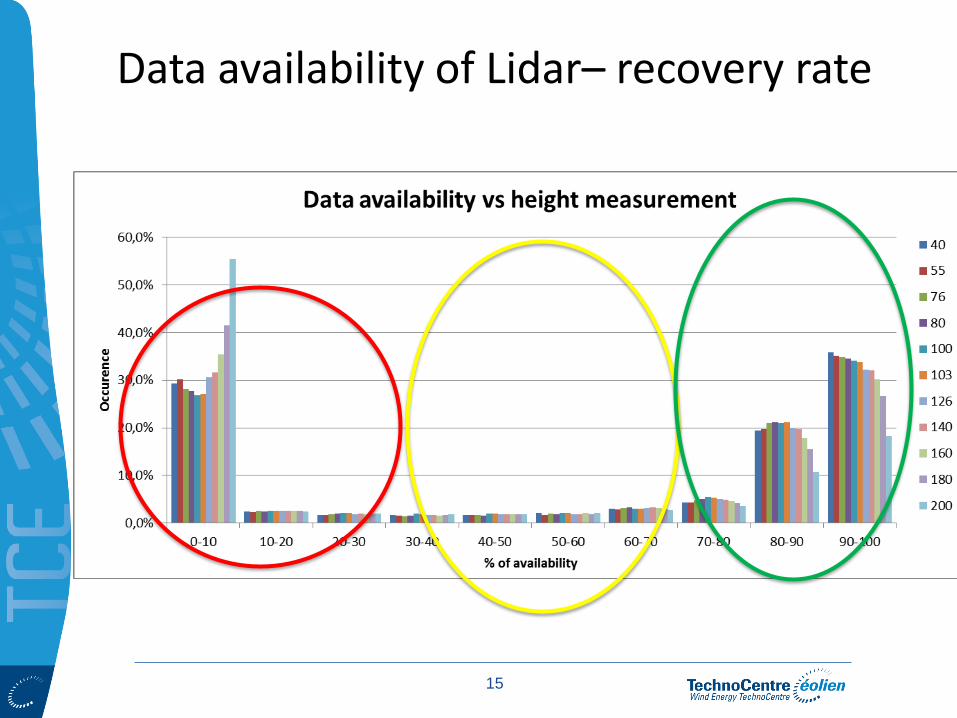
Data availability of Lidar– recovery rate

16
Data availability of Lidar– recovery rate Height (m) < 30% 30 to 70 % > 70%
40 33,0% 7,9% 59,1%
55 33,9% 7,3% 58,8%
76 32,2% 7,7% 60,1%
80 31,7% 7,9% 60,5%
100 31,2% 8,6% 60,2%
103 31,5% 8,6% 59,9%
126 34,7% 8,3% 57,0%
140 35,7% 8,1% 56,2%
160 39,5% 8,3% 52,3%
180 45,8% 8,1% 46,1%
200 59,6% 8,2% 32,2%

17
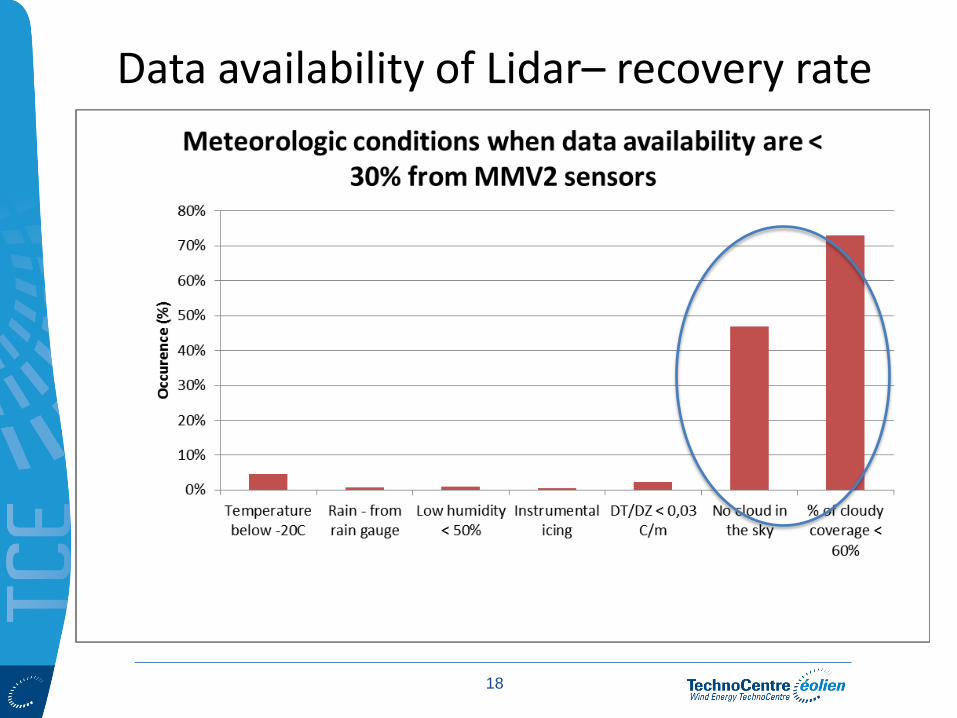
Data availability of Lidar– recovery rate
When did the Lidar lose data?
18
Data availability of Lidar– recovery rate

19
Data availability of Lidar– recovery rate
On both case, cleared sky seems the problem
with the data availability from the
Lidar
20
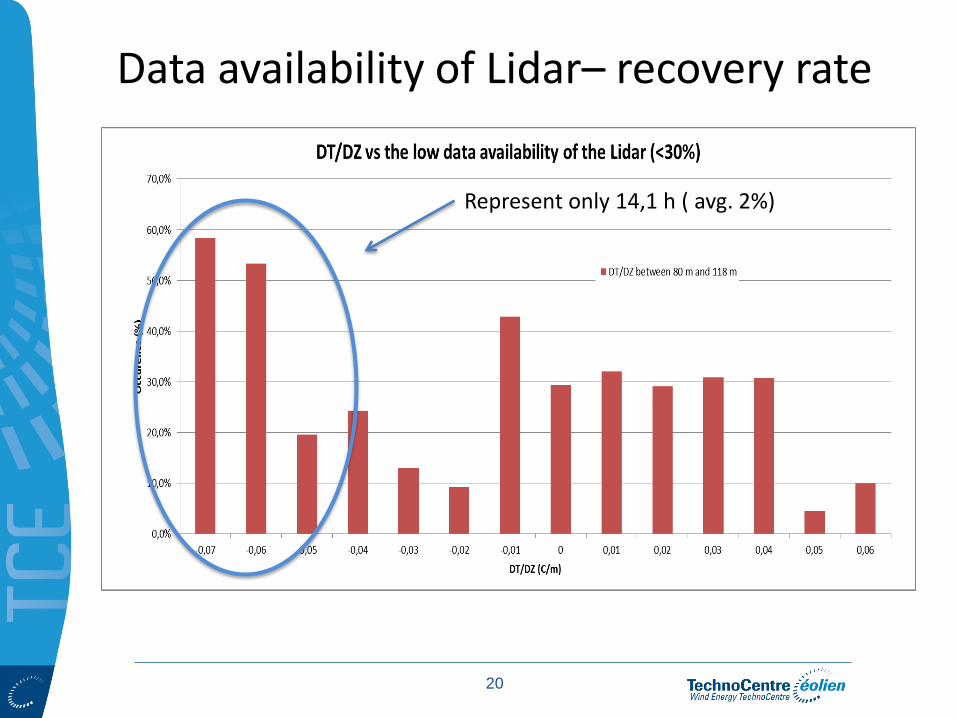
Data availability of Lidar– recovery rate
Represent only 14,1 h ( avg. 2%)

21
Data availability of Lidar– recovery rate But, what represents the low availability due to clear sky compared to all the
clear sky occurences?
From met mast
From EC station
The lidar lost data during approx. 1/3 of clear sky occurrences (or > 24 km)

22
Data availability of Lidar– long term analysis
Did this lost of availability affect the long term wind speed bias?

23
Data availability of Lidar– long term analysis
- Turbulence intensity bins

Recommandations
• Using the Lidar following the IEC61400-12-2 (in completion of met mast) is good practice
• The Lidar has a very good correlation with met mast in complex terrain and cold climate
• In remote areas (when aerosols are less present), check the general visibilty or status from the nearest long term met station. (~1/3 rule)

Future work
• Public report with all the results of the current campaign
• Improve the data availabilty of the Lidar during clear sky occurrences (or high visilibility) for remote areas
• Measure the wake effect of wind turbine in complex terrain with the Lidar (see zone lidar)

Cédric Arbez, Eng.
Project lead
70, rue Bolduc, Gaspé (Québec) G4X 1G2
Canada
Tél. : +1 418 368-6162 x237
References [1] M. Pelletier, D. Faghani, M. Boquet, R. Dexter, B. Boucher, E. Osler, C. Masson and L. Landberg ,”Lidar Validation in Complex Terrain,. presented at EWEC, Brussels, March 2011 [2] Integrated Environmental Data LCC (2011, July), “Recommended Practices for the Use of Sodar in Wind Energy Resource Assessment”, [Online] 1-20, Available: http://www.iedat.com/documents/SODARRecommendedPractices_IEARevised13Jul2011.pdf [3] C.Arbez, H.Ibrahim, “Highest meteorological station in Canada designed for cold climate and complex terrain recognition”, presented at Winterwind, Skefelltea (Sweden), February 2012. [4] GL Wind-Technical Note 067 Certification of Wind Turbines for Extreme Temperatures (here: Cold Climate), GL Standard, Revision 2, 2005 [5] PI product [Online] Available on www.osisoft.com [6] Ian Baring-Gould, et al., Expert Group Study on Recommended Practices for Wind Energy Projects in Cold Climates. IEA Wind Recommended practices no. 13. 2012. [Online] Available at: http://arcticwind.vtt.fi/ [7] IEC 61400-12-1- Wind turbines – Part 12-1: Power performance measurement of electricity producing wind turbines, 1st edition, 2005-12. [8] Wind energy handbook [9] QC procedure from TCE, PRO-REC-003 [10] Users guide Léosphère