Case Study - Korea
31
Ki-young, Ko| 2013. 9. 24 Opportunities for BB Connectivity in APAC Case Study - Korea
Transcript of Case Study - Korea
Ki-young, Ko| 2013. 9. 24
Opportunities for BB Connectivity in APAC
Case Study - Korea
0 Introduction
1 International Internet Traffic Trend
2 KT Plan to Cope with the Traffic
3 Highway Construction & Telecom Infrastructure
4 Considerations
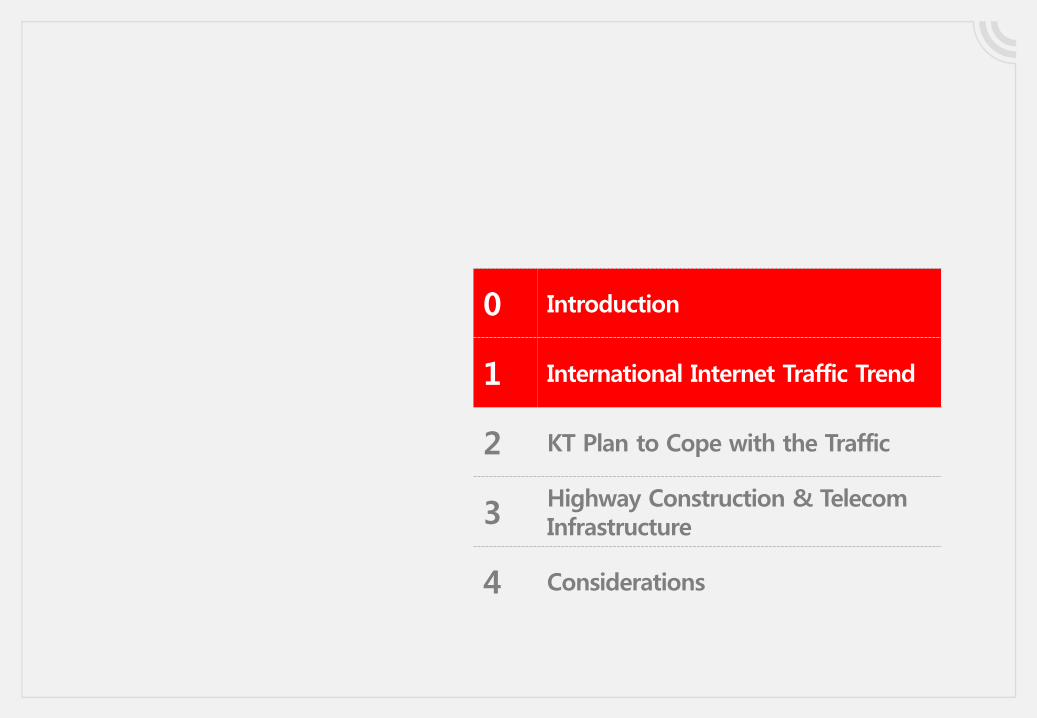
01 International Traffic Trend
Regional Traffic Growth Rate
2006 2007 2008 2009 2010 2011 2012 2013
Africa
Europe
US&Canada
Latin America
Asia100%
80%
60%
40%
20%
120%
140%
Telegeography
2009 2010 2011 2012 2013
Global Traffic
120
100
80
60
40
20
0
Int’l Internet Bandwidth(Tbps)
Traffic is growing but growth rate is slowing down, so is the Asian Region
60% 33%
28% 19%
6%
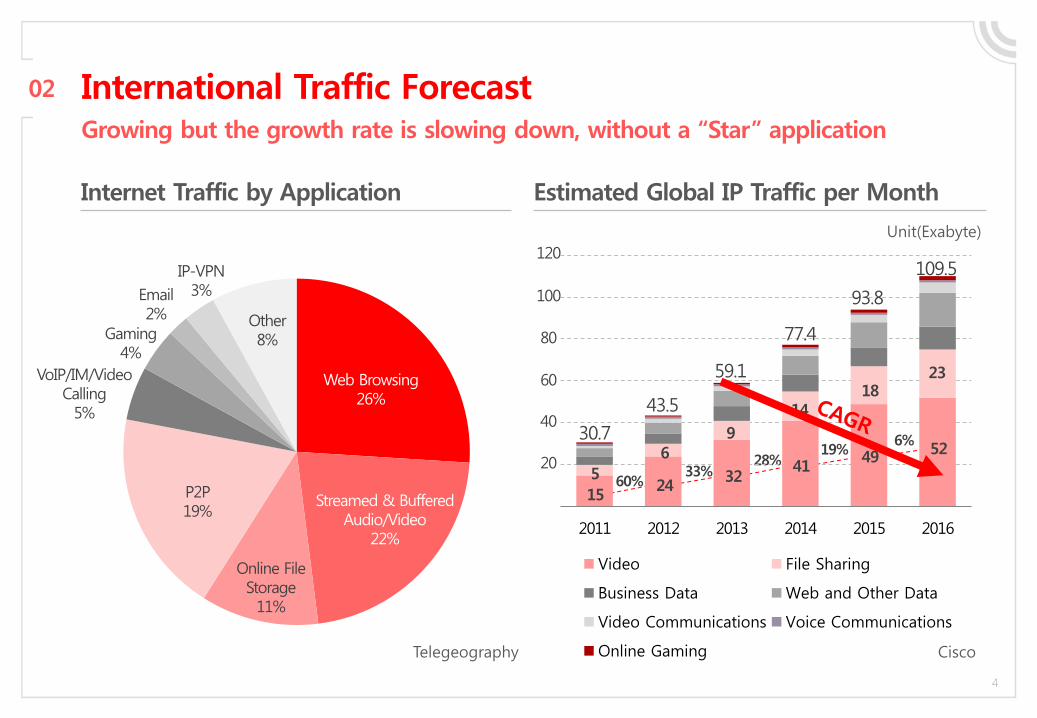
02 International Traffic Forecast Growing but the growth rate is slowing down, without a “Star” application
Web Browsing 26%
Streamed & Buffered Audio/Video
22%
Online File Storage 11%
P2P 19%
VoIP/IM/Video Calling
5%
Gaming 4%
Email 2%
IP-VPN 3%
Other 8%
Internet Traffic by Application
Telegeography
2011 2012 2013 2014 2015 2016
Video File Sharing
Business Data Web and Other Data
Video Communications Voice Communications
Online Gaming
109.5
93.8
77.4
59.1
43.5
30.7
Estimated Global IP Traffic per Month
Cisco
Unit(Exabyte)
20
40
60
80
100
120
15
5 24
32 41
49 52 6
9
14 18
23
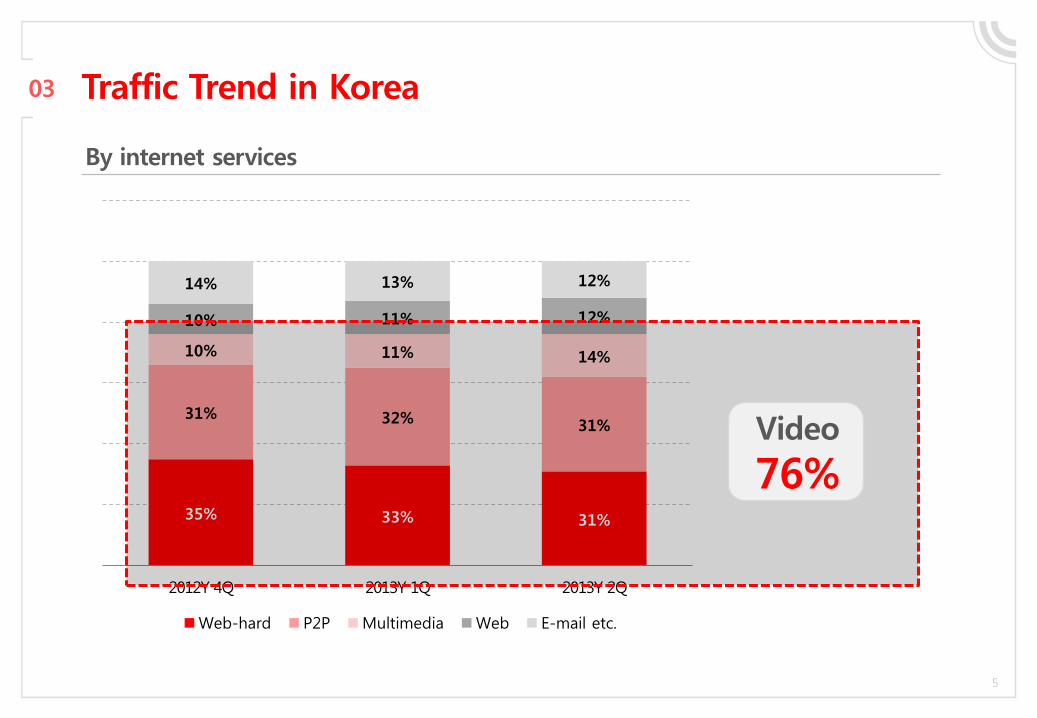
Traffic Trend in Korea 03
By internet services
35% 33% 31%
31% 32% 31%
10% 11% 14%
10% 11% 12%
14% 13% 12%
2012Y 4Q 2013Y 1Q 2013Y 2Q
Web-hard P2P Multimedia Web E-mail etc.
Video
76%
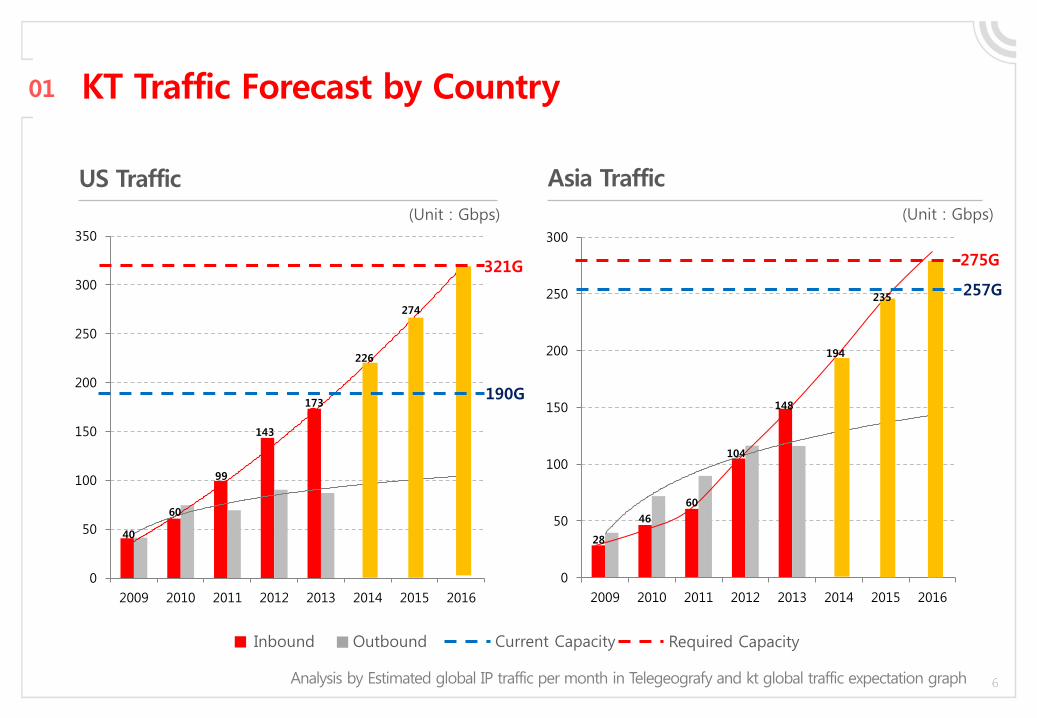
US Traffic
(Unit : Gbps)
0
50
100
150
200
250
300
350
2009 2010 2011 2012 2013 2014 2015 2016
40
60
99
143
173
226
274
0
50
100
150
200
250
300
2009 2010 2011 2012 2013 2014 2015 2016
Asia Traffic
(Unit : Gbps)
28
46
60
104
148
194
235
01 KT Traffic Forecast by Country
Inbound Outbound Current Capacity Required Capacity
190G
321G
257G
275G
Analysis by Estimated global IP traffic per month in Telegeografy and kt global traffic expectation graph
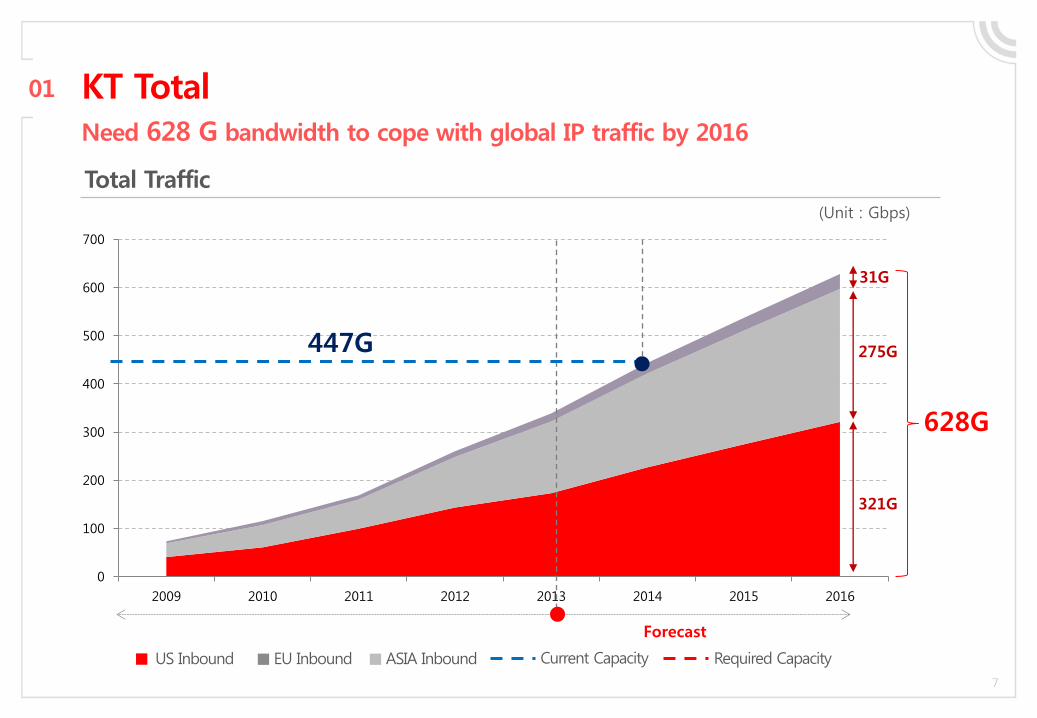
Total Traffic
US Inbound EU Inbound ASIA Inbound Current Capacity Required Capacity
0
100
200
300
400
500
600
700
2009 2010 2011 2012 2013 2014 2015 2016
(Unit : Gbps)
01 KT Total Need 628 G bandwidth to cope with global IP traffic by 2016
275G
321G
31G
628G
Forecast
447G
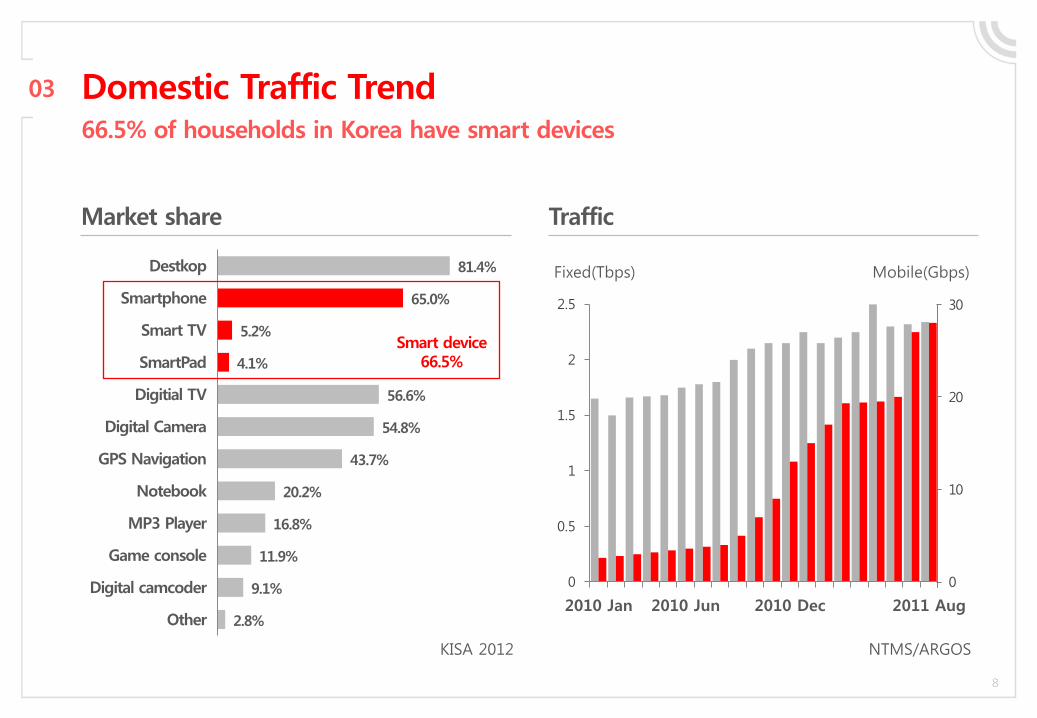
Domestic Traffic Trend 03
KISA 2012
2.8%
9.1%
11.9%
16.8%
20.2%
43.7%
54.8%
56.6%
4.1%
5.2%
65.0%
81.4%
Other
Digital camcoder
Game console
MP3 Player
Notebook
GPS Navigation
Digital Camera
Digitial TV
SmartPad
Smart TV
Smartphone
Destkop
Market share
Smart device 66.5%
Traffic
Fixed(Tbps)
0
0.5
1
1.5
2
2.5
2010 Jan 2010 Jun 2010 Dec 2011 Aug
30
0
20
10
Mobile(Gbps)
NTMS/ARGOS
66.5% of households in Korea have smart devices
1 International internet traffic trend
2 KT Plan to Cope with the Traffic
3 Integrated construct highway and network infrastructure
4 Consideration
01
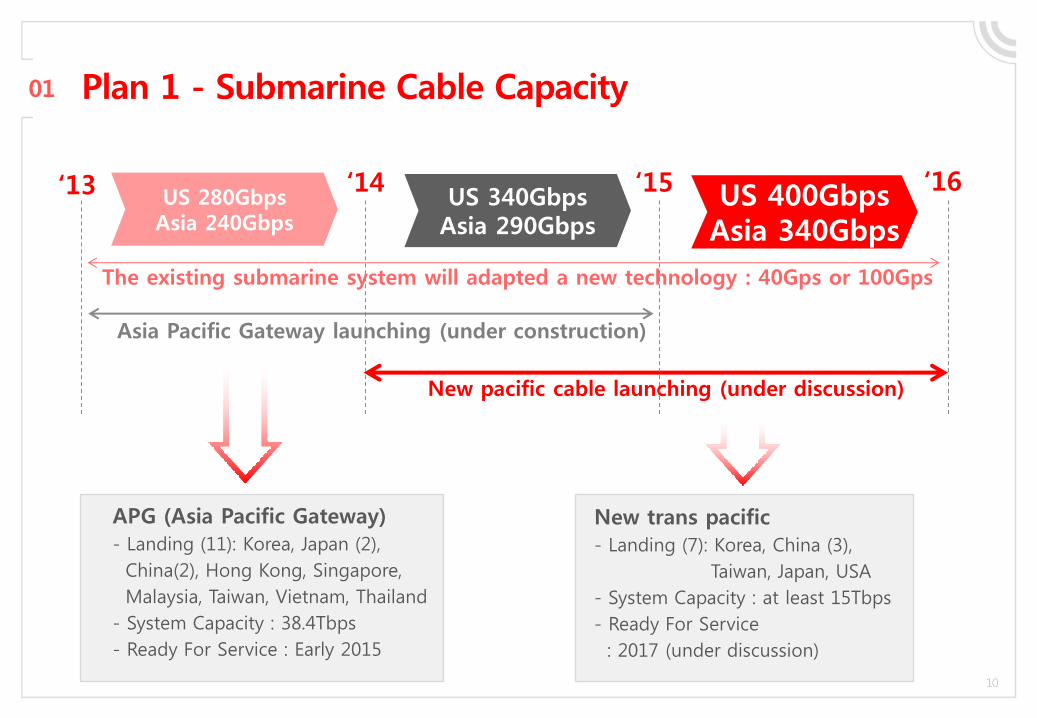
APG (Asia Pacific Gateway)
- Landing (11): Korea, Japan (2),
China(2), Hong Kong, Singapore,
Malaysia, Taiwan, Vietnam, Thailand
- System Capacity : 38.4Tbps
- Ready For Service : Early 2015
New trans pacific
- Landing (7): Korea, China (3),
Taiwan, Japan, USA
- System Capacity : at least 15Tbps
- Ready For Service
: 2017 (under discussion)
Plan 1 - Submarine Cable Capacity
The existing submarine system will adapted a new technology : 40Gps or 100Gps
Asia Pacific Gateway launching (under construction)
New pacific cable launching (under discussion)
US 340Gbps Asia 290Gbps
‘14 US 400Gbps Asia 340Gbps
‘15 ‘16 US 280Gbps Asia 240Gbps
‘13
02
JAPAN
SINGAPORE
TORONTO
NY
London
HongKong
PHILIPPINE
VIETNAM INDIA
PALO
SEATTLE
LA (1Wilshire / Equinix)
Amsterdam
THAI
KOREA
INDONESIA
FrankFurt
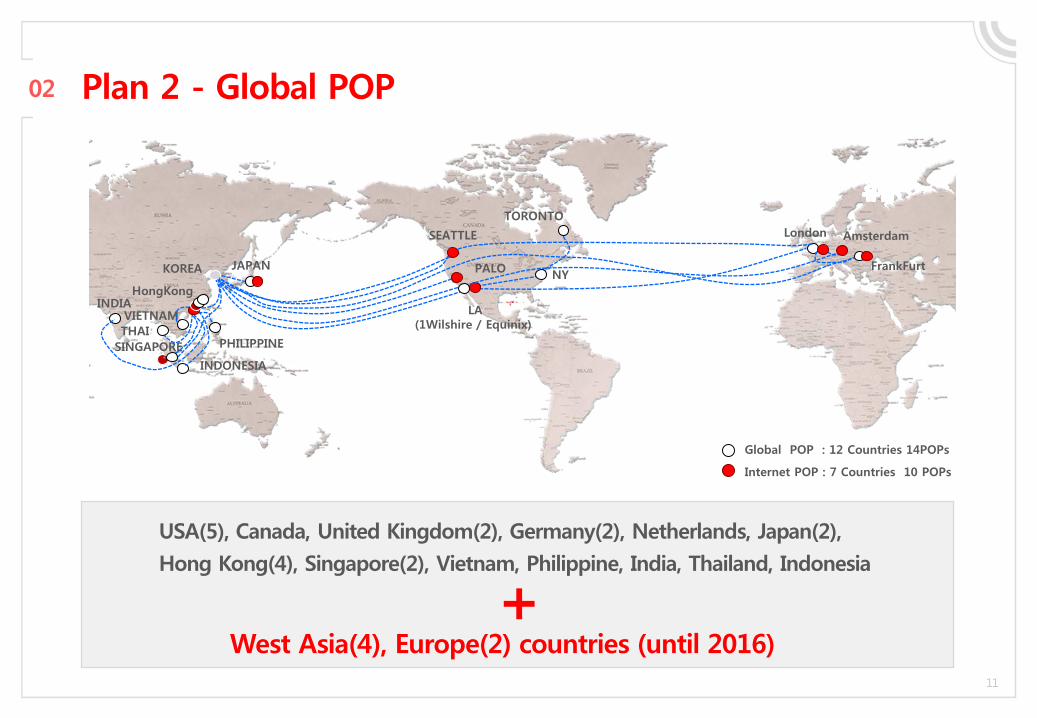
Global POP : 12 Countries 14POPs
Internet POP : 7 Countries 10 POPs
USA(5), Canada, United Kingdom(2), Germany(2), Netherlands, Japan(2),
Hong Kong(4), Singapore(2), Vietnam, Philippine, India, Thailand, Indonesia
Plan 2 - Global POP
West Asia(4), Europe(2) countries (until 2016) +
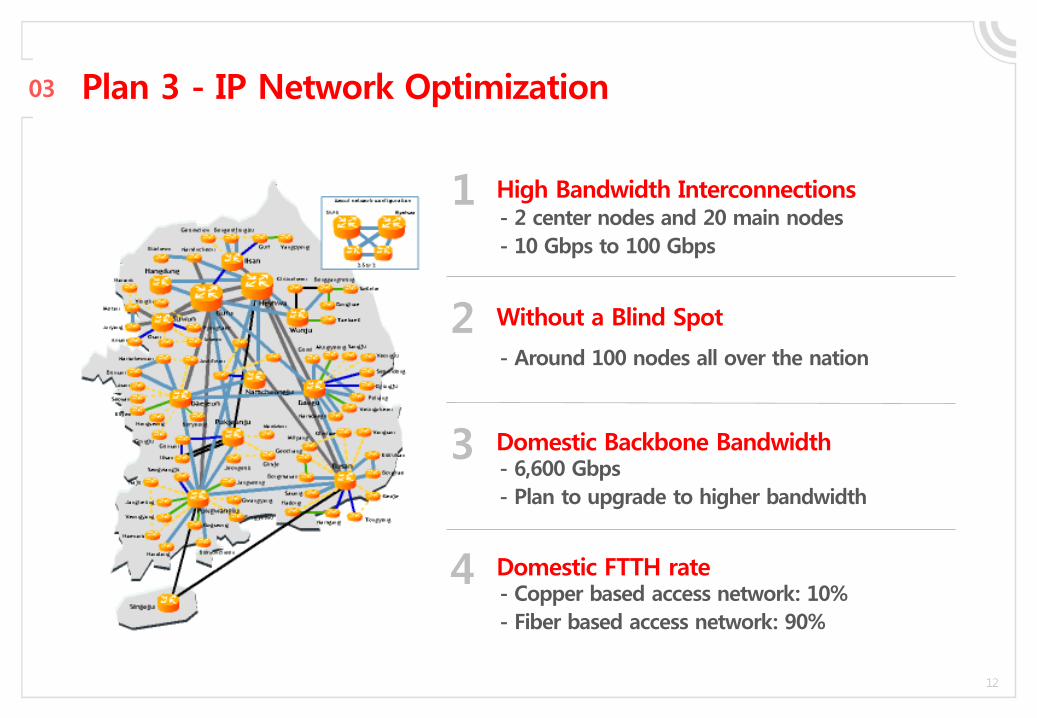
Plan 3 - IP Network Optimization 03
Without a Blind Spot
- Around 100 nodes all over the nation
- 2 center nodes and 20 main nodes
- 10 Gbps to 100 Gbps
High Bandwidth Interconnections
- Copper based access network: 10%
- Fiber based access network: 90%
Domestic FTTH rate
1
2
4
- 6,600 Gbps
- Plan to upgrade to higher bandwidth
Domestic Backbone Bandwidth 3
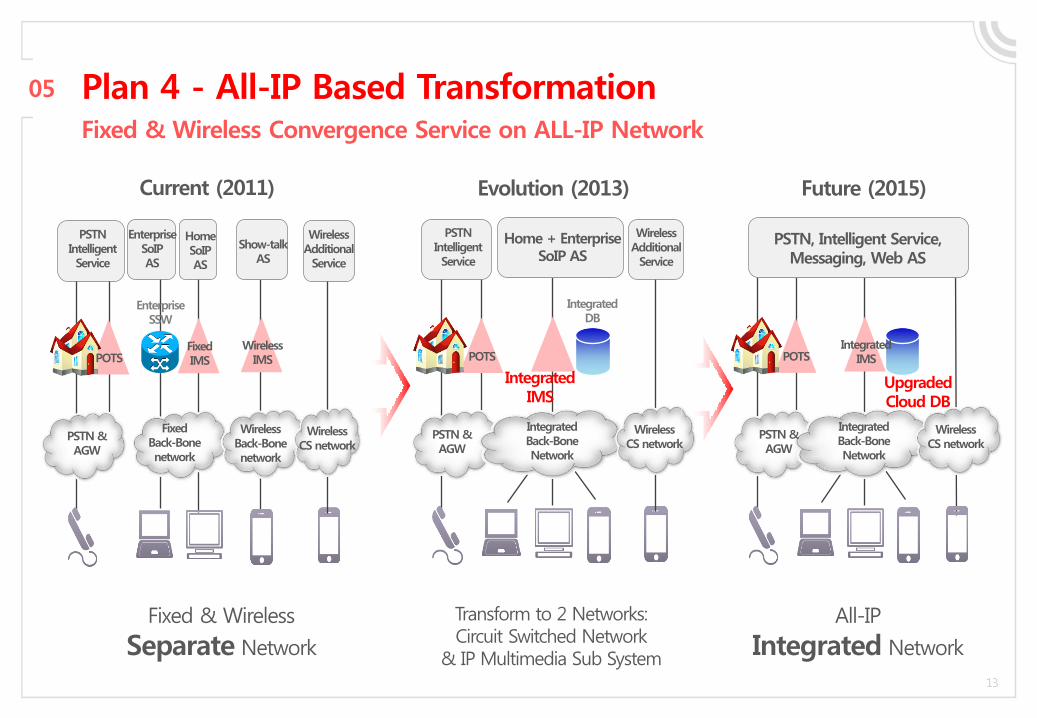
Plan 4 - All-IP Based Transformation Fixed & Wireless Convergence Service on ALL-IP Network
05
Fixed & Wireless
Separate Network
Wireless CS network
Wireless Back-Bone network
Fixed Back-Bone network
PSTN & AGW
Wireless IMS
Fixed IMS
Enterprise SSW
POTS
Wireless Additional Service
Show-talk AS
Home SoIP AS
Enterprise SoIP AS
PSTN Intelligent Service
Current (2011)
Transform to 2 Networks: Circuit Switched Network
& IP Multimedia Sub System
Wireless CS network
Integrated Back-Bone Network
PSTN & AGW
Integrated IMS
Integrated DB
POTS
Wireless Additional Service
Home + Enterprise SoIP AS
PSTN Intelligent Service
Evolution (2013)
All-IP
Integrated Network
Wireless CS network
Integrated Back-Bone Network
PSTN & AGW
Integrated IMS
Upgraded Cloud DB
POTS
PSTN, Intelligent Service, Messaging, Web AS
Future (2015)
1 International internet traffic trend
2 kt’s plan for traffic increasing
3 Highway Construction & Telecom Infrastructure
4 Consideration
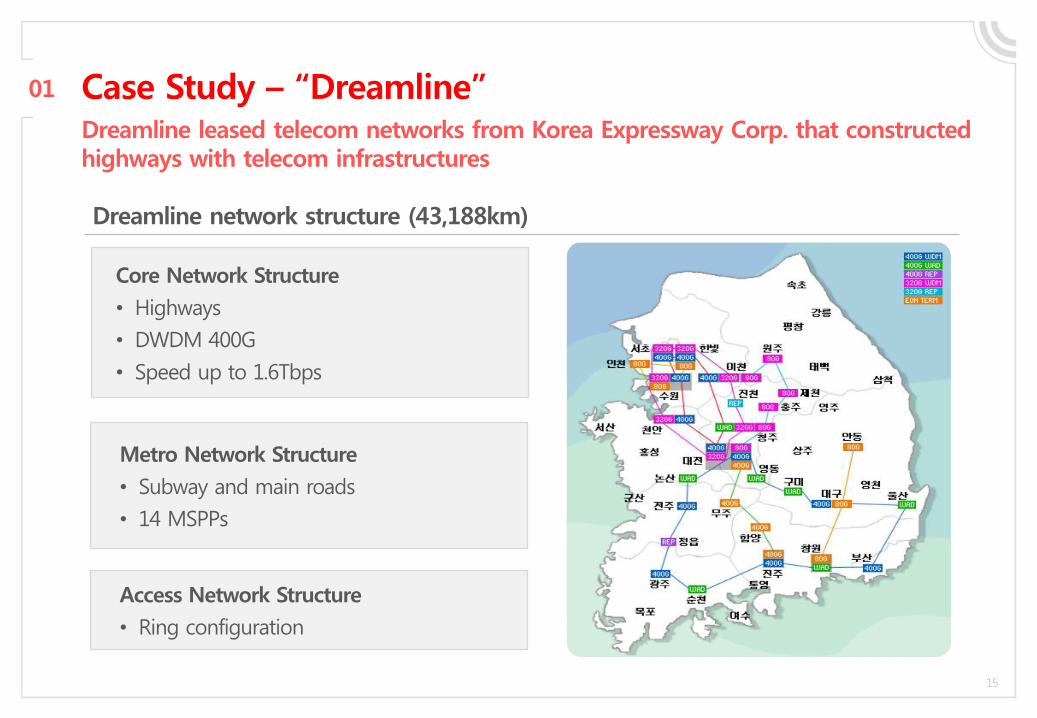
Case Study – “Dreamline” 01
Dreamline network structure (43,188km)
Metro Network Structure
• Subway and main roads
• 14 MSPPs
Core Network Structure
• Highways
• DWDM 400G
• Speed up to 1.6Tbps
Access Network Structure
• Ring configuration
Dreamline leased telecom networks from Korea Expressway Corp. that constructed highways with telecom infrastructures
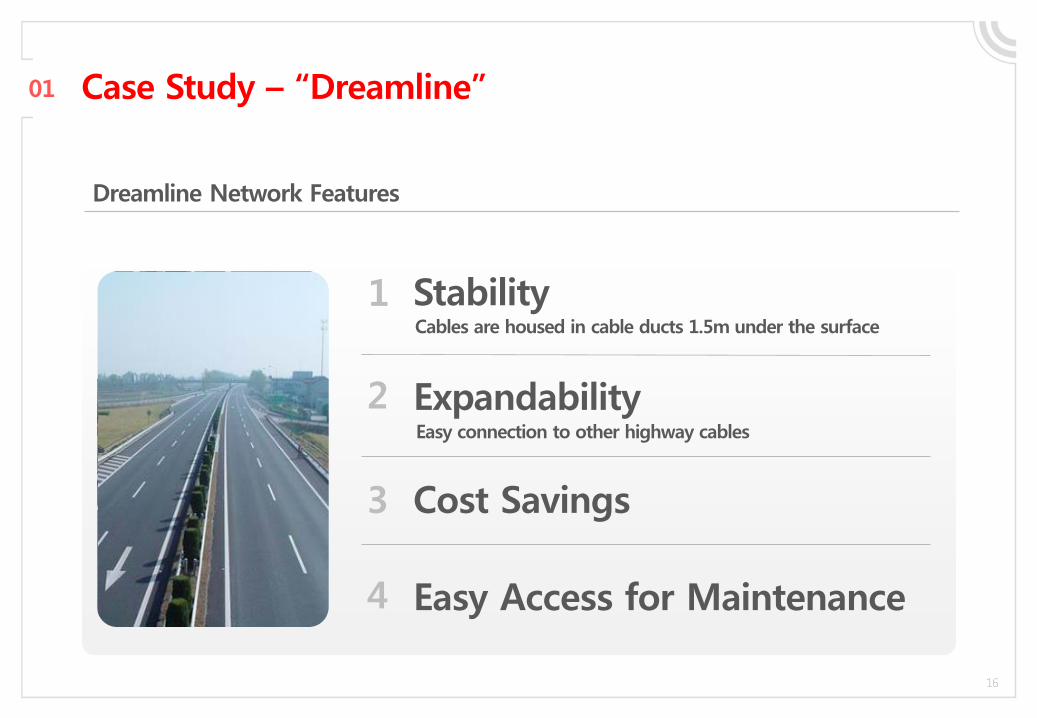
01 Case Study – “Dreamline”
Cables are housed in cable ducts 1.5m under the surface
Stability 1
Easy connection to other highway cables
Expandability 2
Cost Savings 3
Easy Access for Maintenance 4
Dreamline Network Features
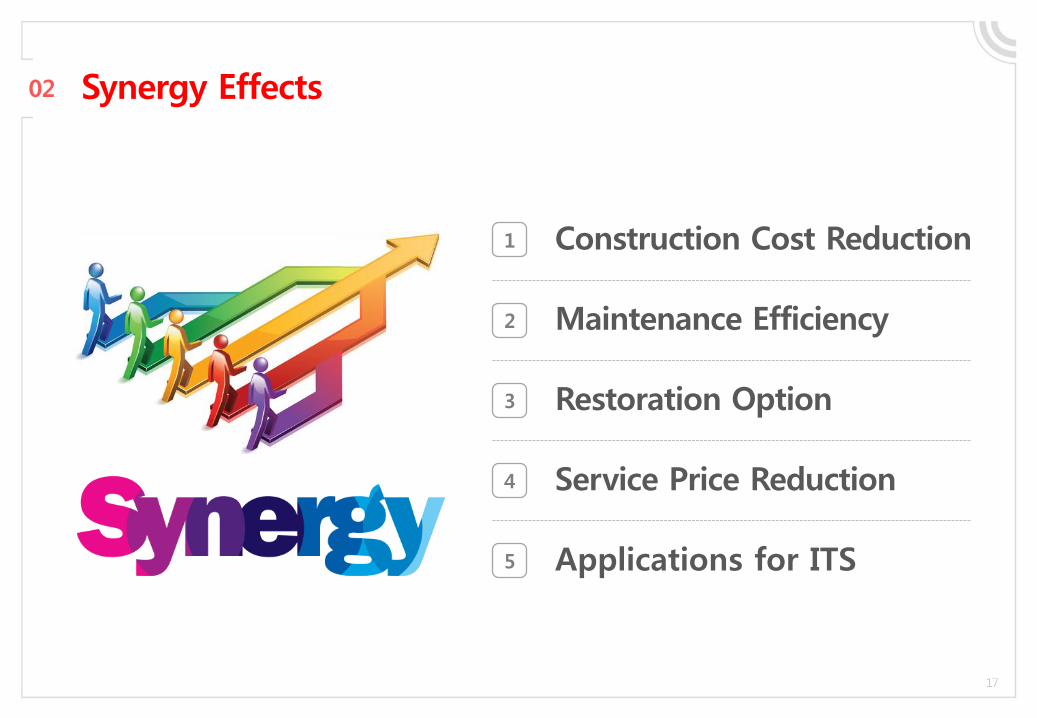
02 Synergy Effects
Construction Cost Reduction 1
Applications for ITS 5
Maintenance Efficiency 2
Restoration Option 3
Service Price Reduction 4
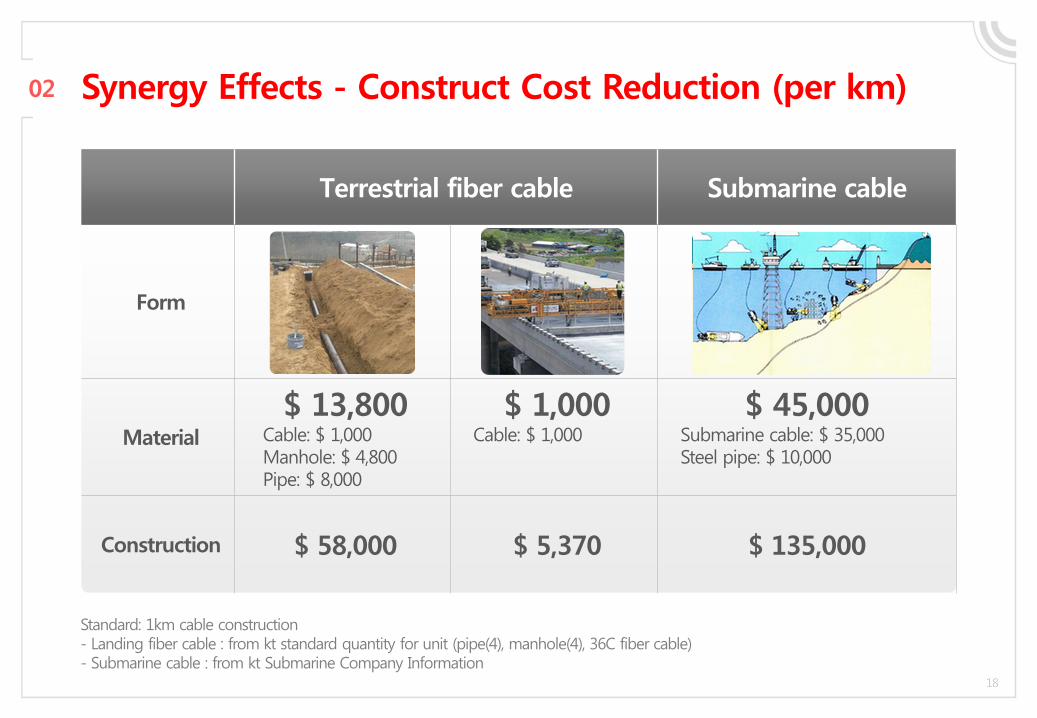
Synergy Effects - Construct Cost Reduction (per km) 02
Terrestrial fiber cable Submarine cable
Form
Material
$ 13,800 Cable: $ 1,000 Manhole: $ 4,800 Pipe: $ 8,000
$ 1,000 Cable: $ 1,000
$ 45,000 Submarine cable: $ 35,000 Steel pipe: $ 10,000
Construction $ 58,000 $ 5,370 $ 135,000
Standard: 1km cable construction - Landing fiber cable : from kt standard quantity for unit (pipe(4), manhole(4), 36C fiber cable) - Submarine cable : from kt Submarine Company Information
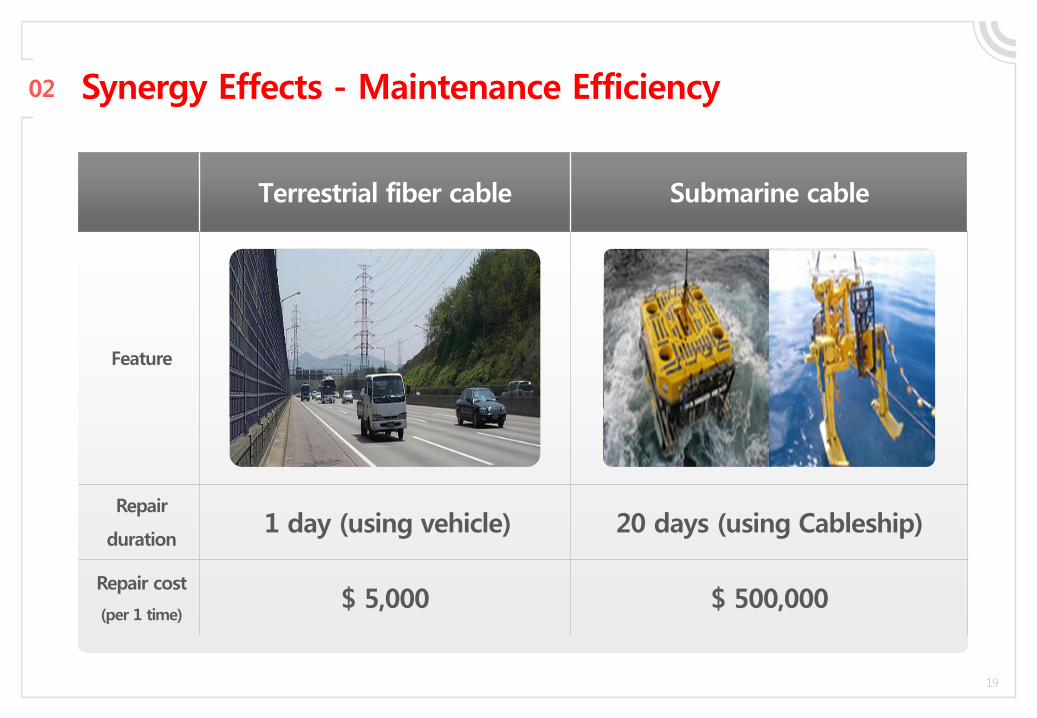
02
Terrestrial fiber cable Submarine cable
Feature
Repair
duration 1 day (using vehicle) 20 days (using Cableship)
Repair cost
(per 1 time) $ 5,000 $ 500,000
Synergy Effects - Maintenance Efficiency
02
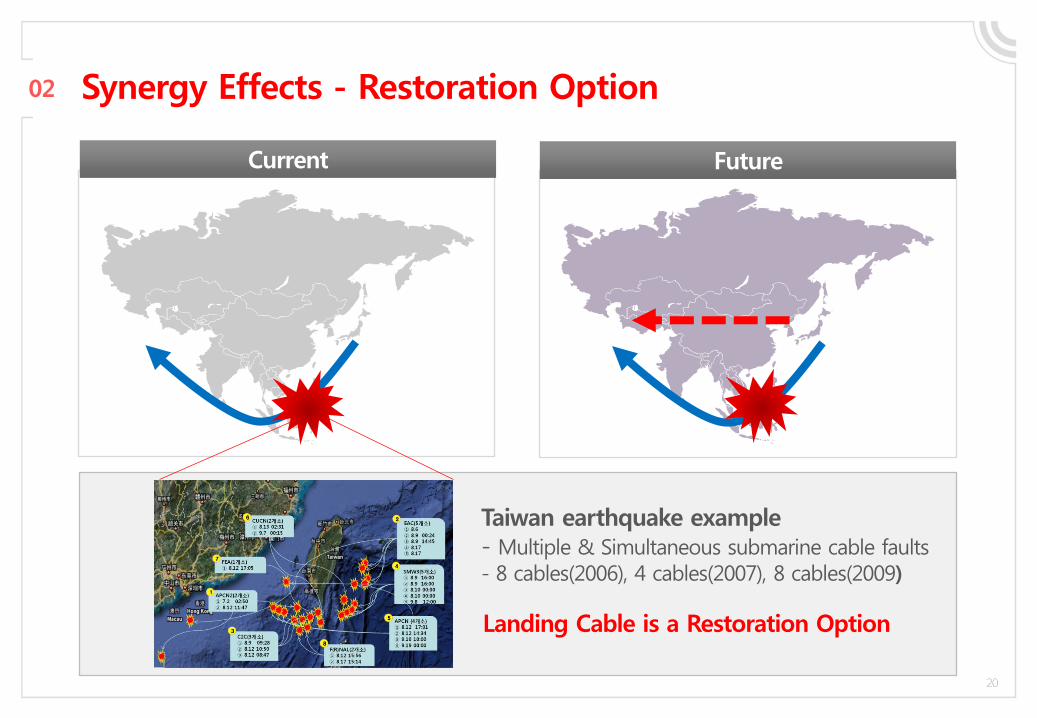
Future Current
Synergy Effects - Restoration Option
Taiwan earthquake example - Multiple & Simultaneous submarine cable faults - 8 cables(2006), 4 cables(2007), 8 cables(2009)
Landing Cable is a Restoration Option
02
• Only 8 submarine cables in Asia • Asian population is 60% of the world
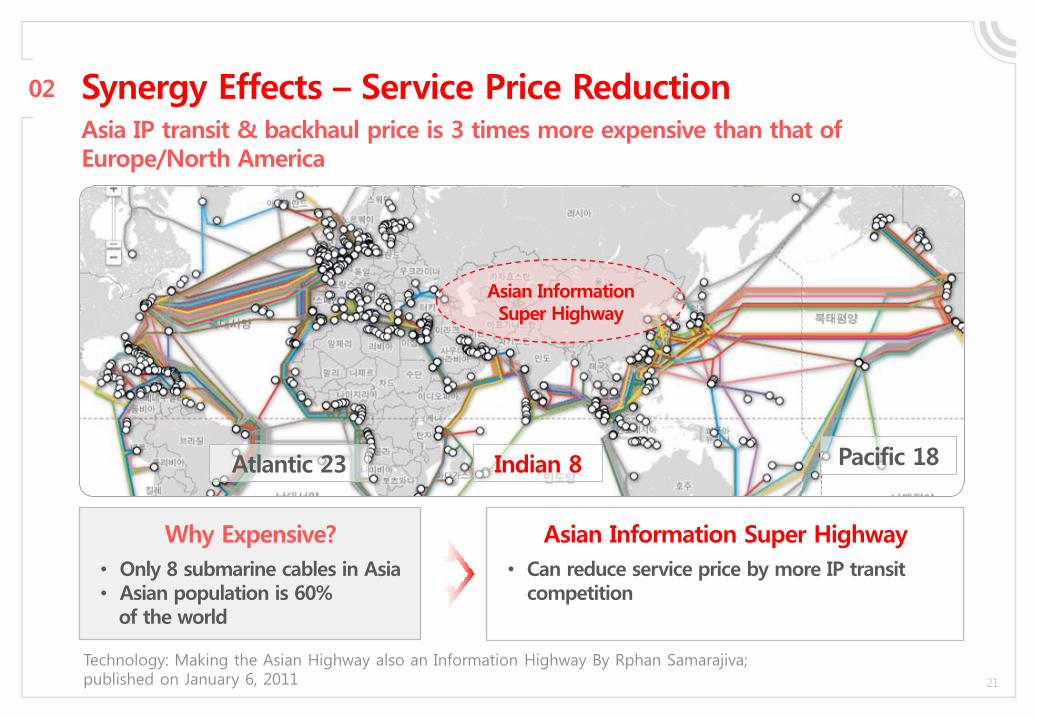
Synergy Effects – Service Price Reduction
Why Expensive?
• Can reduce service price by more IP transit competition
Asian Information Super Highway
Atlantic 23 Indian 8 Pacific 18
Asian Information Super Highway
Asia IP transit & backhaul price is 3 times more expensive than that of Europe/North America
Technology: Making the Asian Highway also an Information Highway By Rphan Samarajiva; published on January 6, 2011
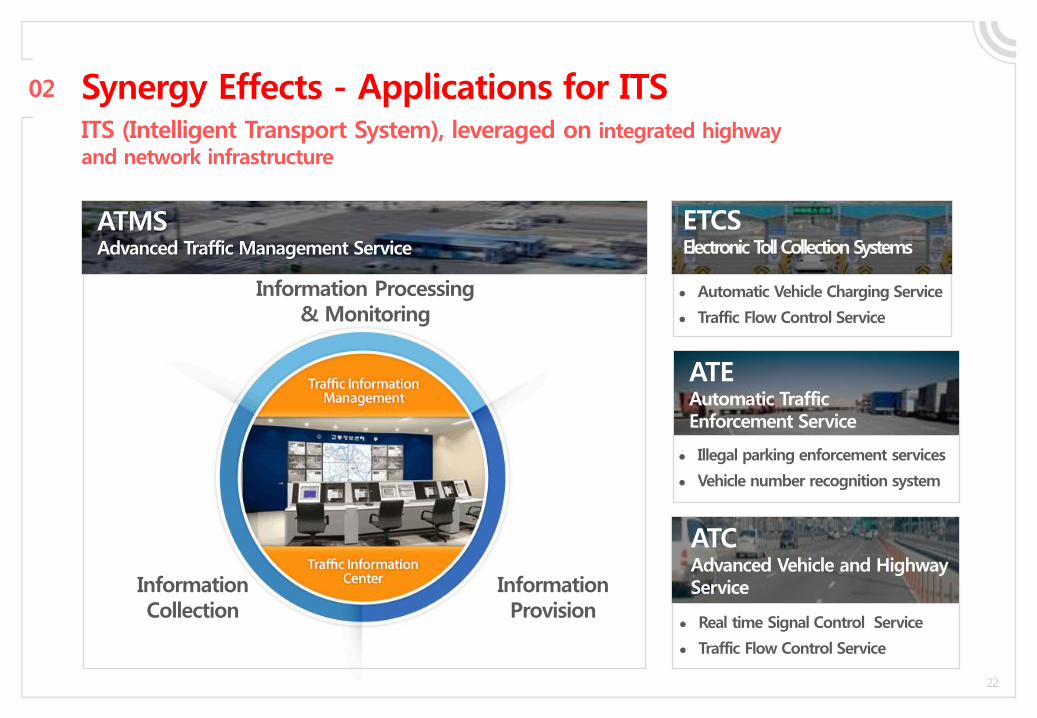
02
Automatic Vehicle Charging Service
Traffic Flow Control Service
ETCS Electronic Toll Collection Systems
Illegal parking enforcement services
Vehicle number recognition system
ATE Automatic Traffic Enforcement Service
Real time Signal Control Service
Traffic Flow Control Service
ATC Advanced Vehicle and Highway Service
ITS (Intelligent Transport System), leveraged on integrated highway and network infrastructure
Synergy Effects - Applications for ITS
Information Processing & Monitoring
Information Provision
Information Collection
ATMS Advanced Traffic Management Service
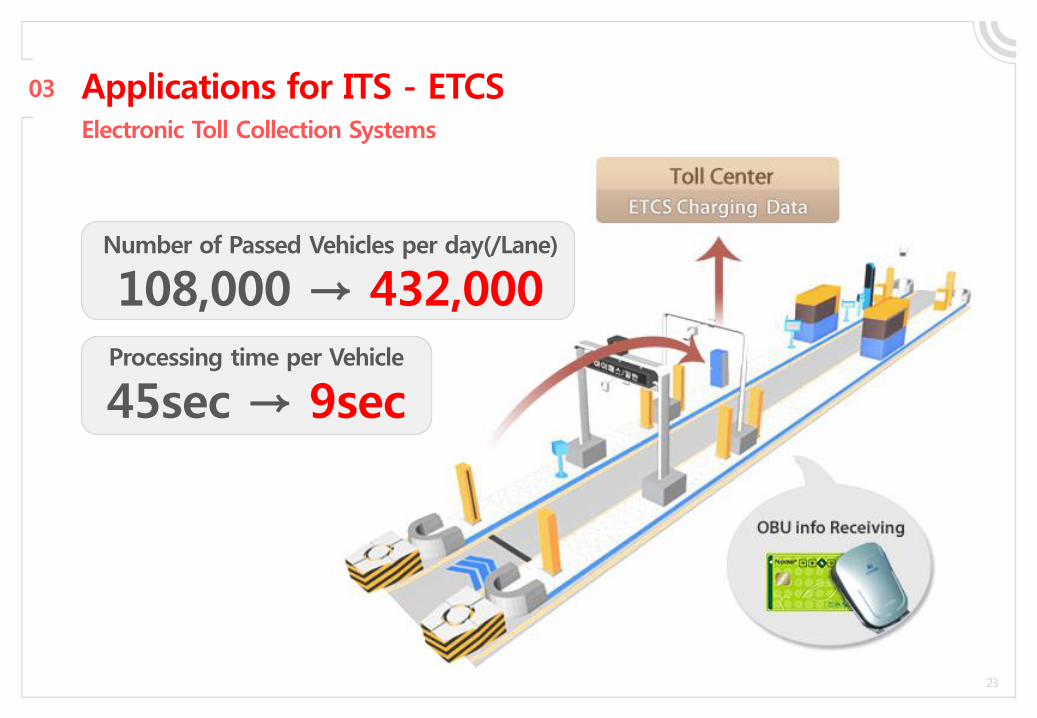
03 Applications for ITS - ETCS Electronic Toll Collection Systems
Number of Passed Vehicles per day(/Lane)
108,000 → 432,000
Processing time per Vehicle
45sec → 9sec
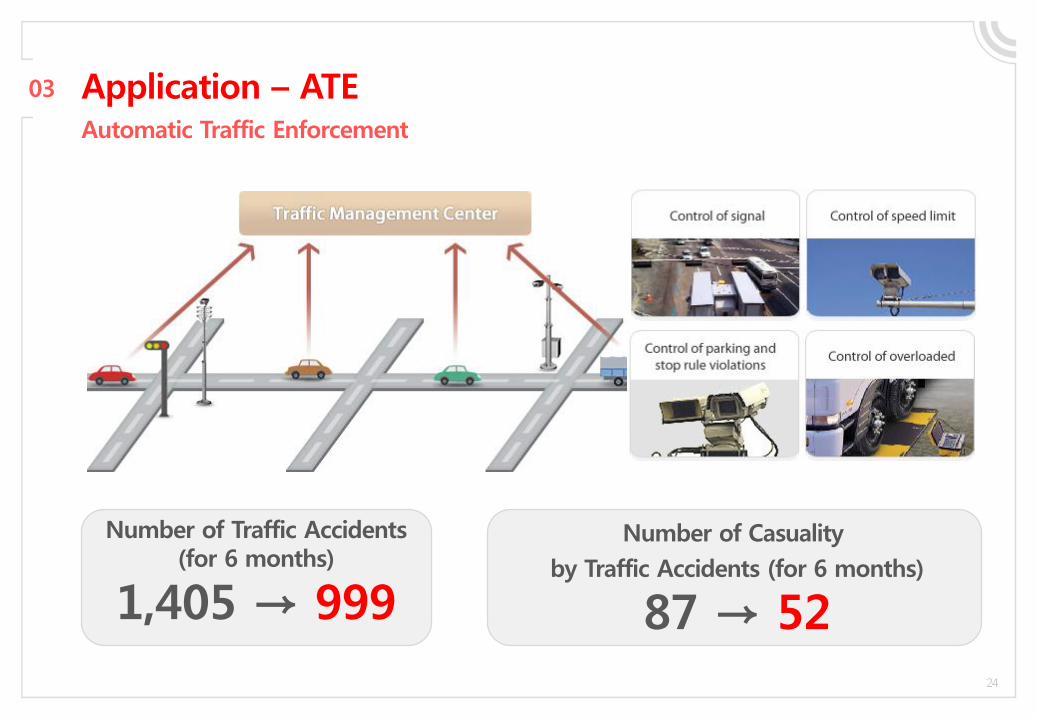
03 Application – ATE Automatic Traffic Enforcement
Number of Casuality
by Traffic Accidents (for 6 months)
87 → 52
Number of Traffic Accidents (for 6 months)
1,405 → 999
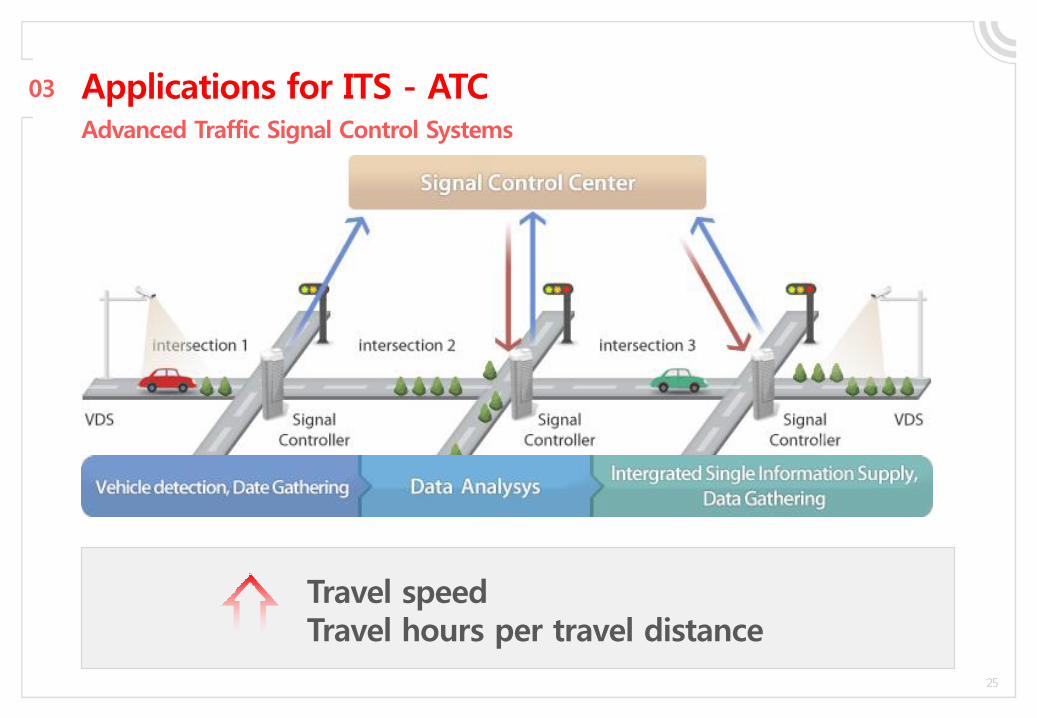
Applications for ITS - ATC 03
Advanced Traffic Signal Control Systems
Travel speed Travel hours per travel distance
1 International internet traffic trend
2 kt’s plan for traffic increasing
3 Integrated construct highway and network infrastructure
4 Considerations
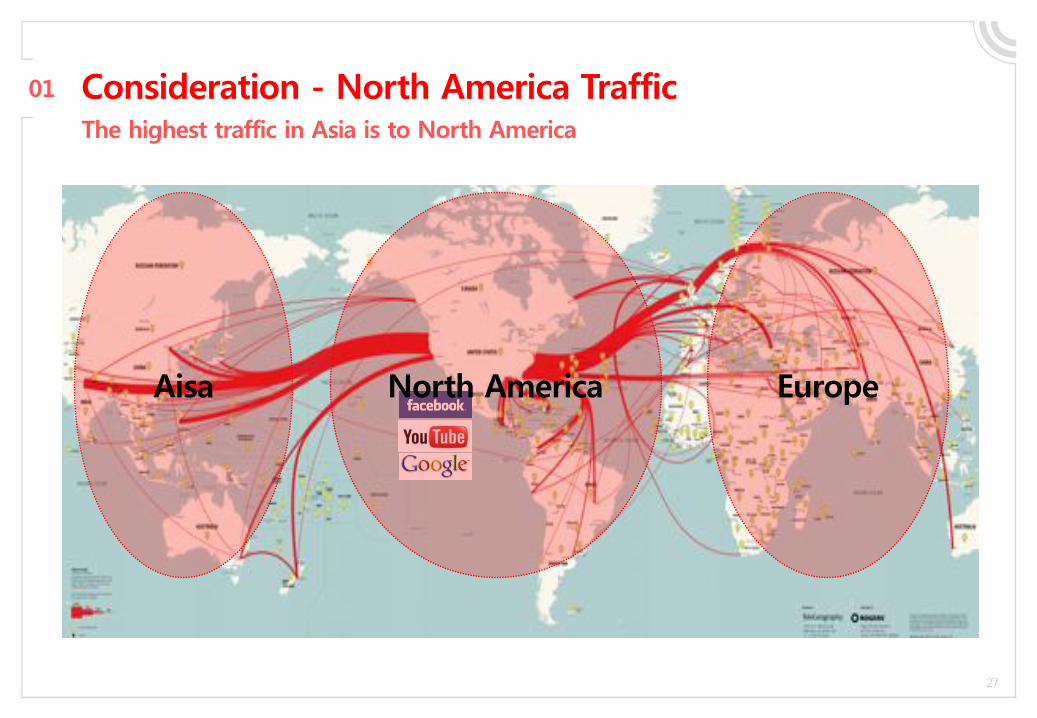
01 Consideration - North America Traffic The highest traffic in Asia is to North America
North America Aisa Europe
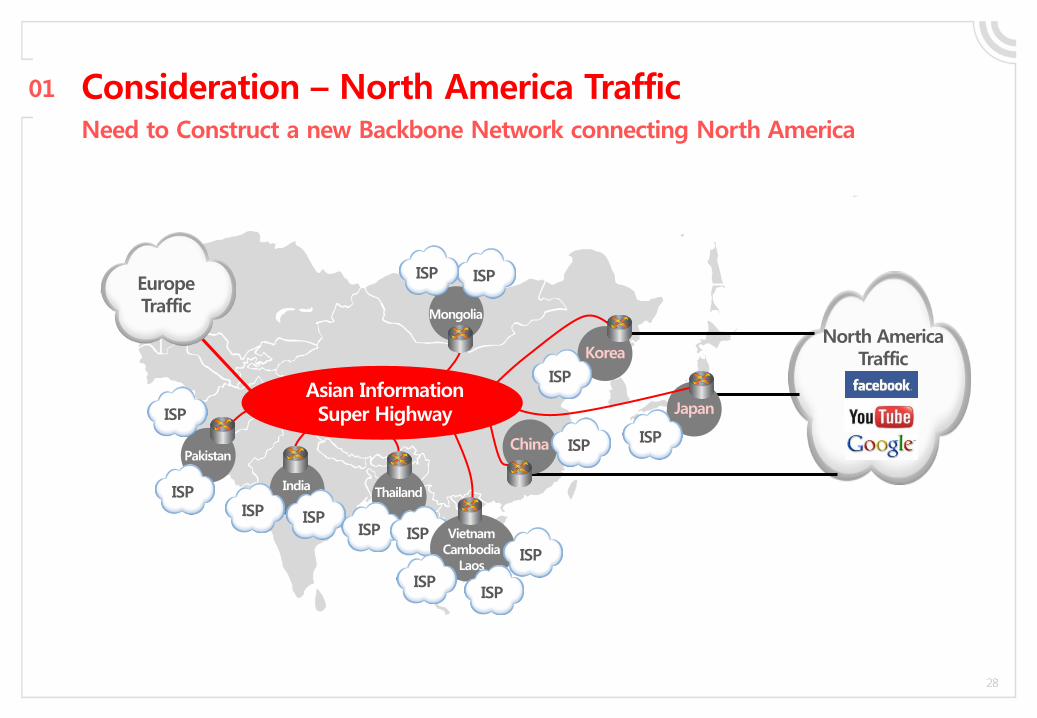
Consideration – North America Traffic 01
North America Traffic
China
Japan
Korea
ISP
ISP ISP
Mongolia
Europe Traffic
ISP ISP
Pakistan
ISP
ISP India
ISP ISP
Thailand
ISP ISP Vietnam Cambodia
Laos ISP
ISP ISP
Asian Information Super Highway
Need to Construct a new Backbone Network connecting North America
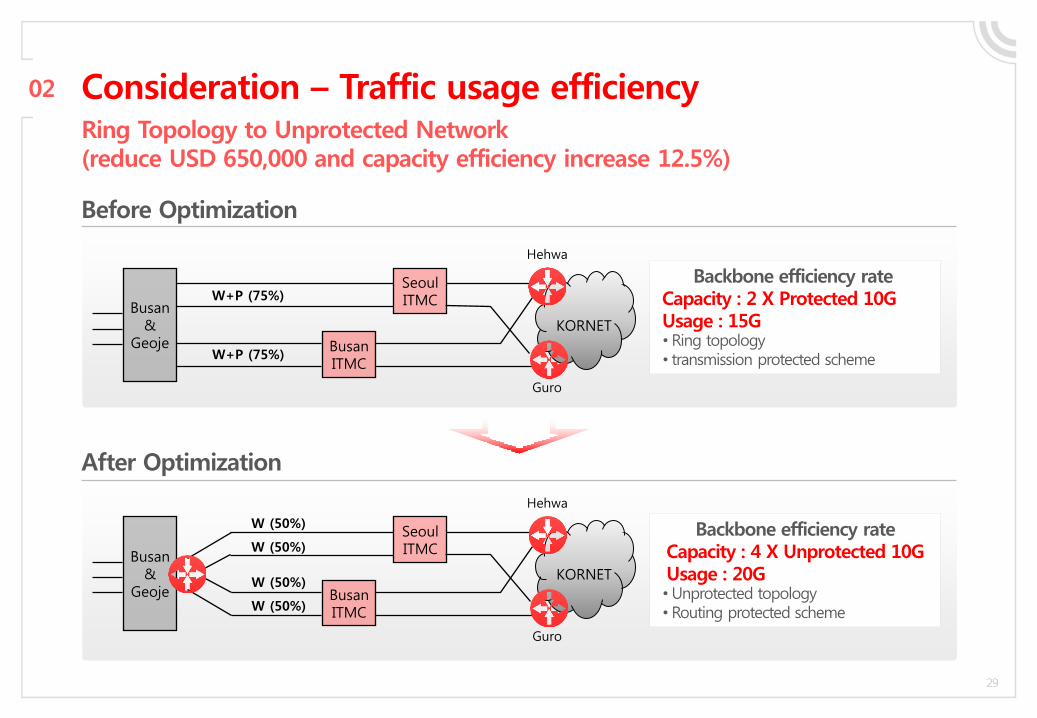
Consideration – Traffic usage efficiency 02
`
After Optimization
Backbone efficiency rate Capacity : 4 X Unprotected 10G Usage : 20G •Unprotected topology • Routing protected scheme
Busan &
Geoje
Seoul ITMC
W (50%)
Guro
Hehwa
Busan ITMC
W (50%)
W (50%)
W (50%)
KORNET
Before Optimization
Backbone efficiency rate Capacity : 2 X Protected 10G Usage : 15G • Ring topology • transmission protected scheme W+P (75%)
Busan &
Geoje
Seoul ITMC
Guro
Hehwa
Busan ITMC
W+P (75%)
KORNET
Ring Topology to Unprotected Network (reduce USD 650,000 and capacity efficiency increase 12.5%)
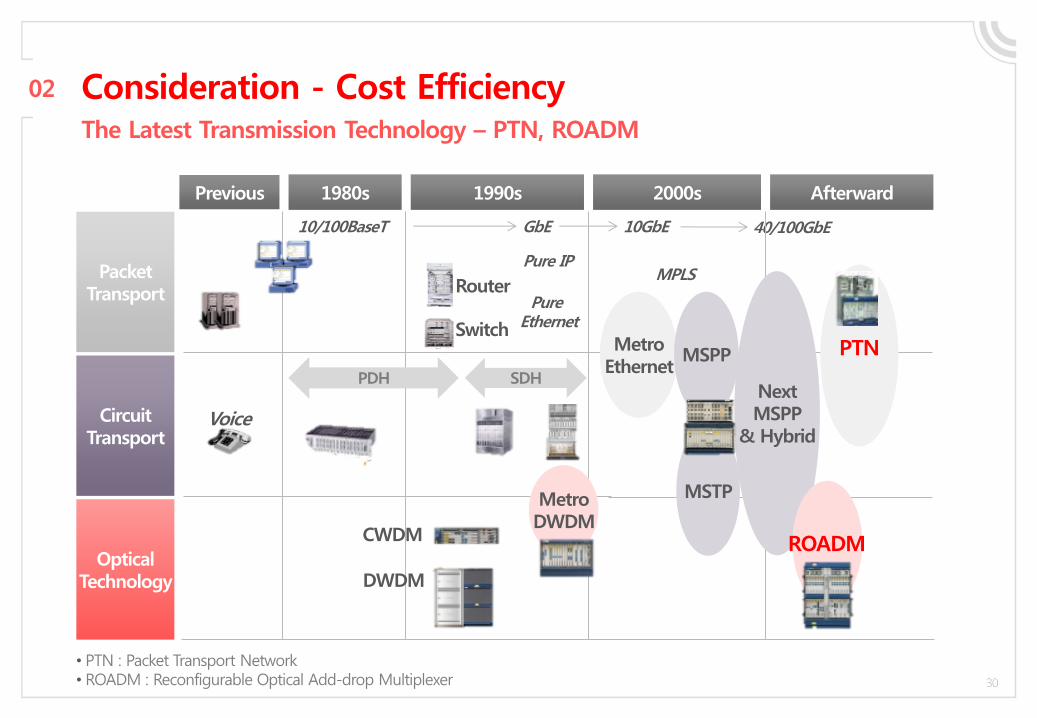
Packet Transport
Circuit Transport
Optical Technology
Previous 1980s 1990s
Voice
PDH SDH
10/100BaseT GbE
Pure IP
Pure Ethernet
10GbE 40/100GbE
MPLS
2000s Afterward
Metro Ethernet
MSPP
MSTP
Next MSPP
& Hybrid
Router
Switch
Metro DWDM
DWDM
CWDM
• PTN : Packet Transport Network • ROADM : Reconfigurable Optical Add-drop Multiplexer
Consideration - Cost Efficiency 02
ROADM
PTN
The Latest Transmission Technology – PTN, ROADM