CASE STUDY FOR PERFORMANCE ANALYSIS OF VOIP …aircconline.com/ijcsity/V5N1/5117ijcsity01.pdf ·...
17
International Journal of Computational Science and Information Technology (IJCSITY) Vol.5, No.1, February 2017 DOI :10.5121/ijcsity.2017.5101 1 CASE STUDY FOR PERFORMANCE ANALYSIS OF VOIP CODECS IN NON-MOBILITY SCENARIOS Shreekant Gurrapu, Saurabh Mehta & Shraddha panbude Department of Electronics and Telecommunication, Vidyalankar Institute of Technology, Mumbai India ABSTRACT IEEE 802.11 is the most popular standard for WLAN networks. It offers different physical transmission rates. This paper focuses on this multi transmission rate of 802.11 WLANs and its effect on speech quality. In non-adaptive systems, when the physical layer switches from a higher transmission rate to a lower one, different than the one that the VoIP flow needs, the switching may result in congestion, high delay and packet loss, and consequently speech quality degradation. However, there are some algorithms that adapt the transmission parameters according to the channel conditions. In this study we demonstrate how choosing parameter (different codec and packet size) can affect the voice quality, network delay and packet loss. Further, this study presents a comparison between adaptive and non-adaptive methods. The adaptive method has also been evaluated for different congestion level from perceived speech quality point of view. KEYWORDS Adaptive rate control algorithm, Codec, IEEE 802.11, Multi-Rate WLAN, packetization interval, QoS, VoIP. INTRODUCTION There are a number of different techniques to handle the problem of multi-rate mechanism of 802.11 for speech traffic. On one hand, at the receiver side, playout buffer length (jitter buffer size) can be adaptive. This can be implemented to relieve delay and packet loss [1], [2], [3], [4] and [5]. On the other hand, rate adaptation mechanism can adjustthe input rate based on the link condition. One of the most famous rate adaptation techniques for speech transmission is codec switching or coding rate adjustment which can adjust different coding bit-rate (compression rate). Another one is by adjusting packetization interval. These techniques can be implemented in the sender side. In the transmission of VoIP (Voice over IP) traffic, rate adaptation mechanisms can be divided into two main categories; codec rate adaptation and adaptive packetization. 1.1 V O IP Voice over IP (VoIP) is the real-time application that is probably the most widely-spread on today's networks. I'll provide here some basic facts related to VoIP. Figure below shows the end- to-end path as needed for VoIP communication (a similar path exists in the opposite sense for a bi-directional connection). An audio input device, such as a microphone, is required at the sending end. The audio signal is transformed into digital form by an analog-to-digital converter. Due to the packet-switched nature of computer networks, voice data has to be packetized and encoded prior to being transmitted. Encoding (as well as decoding) is done by codecs that transform sampled voice data into a specific network-level representation and back. Most of the codecs are defined by standards of the International Telecommunication Union, the Telecommunication division (ITU-T). Each of them has different properties regarding the amount of bandwidth it requires but also the perceived quality of the encoded speech signal. After binary information is encoded and packetized at the sender end, packets encapsulating voice data can be transmitted on the network. Voice packets interact in the network with other application packets and are routed through shared connections to their destination. At the receiver end they
Transcript of CASE STUDY FOR PERFORMANCE ANALYSIS OF VOIP …aircconline.com/ijcsity/V5N1/5117ijcsity01.pdf ·...

International Journal of Computational Science and Information Technology (IJCSITY) Vol.5, No.1, February 2017
DOI :10.5121/ijcsity.2017.5101 1
CASE STUDY FOR PERFORMANCE ANALYSIS OF
VOIP CODECS IN NON-MOBILITY SCENARIOS
Shreekant Gurrapu, Saurabh Mehta & Shraddha panbude
Department of Electronics and Telecommunication, Vidyalankar Institute of Technology,
Mumbai India
ABSTRACT
IEEE 802.11 is the most popular standard for WLAN networks. It offers different physical transmission
rates. This paper focuses on this multi transmission rate of 802.11 WLANs and its effect on speech quality.
In non-adaptive systems, when the physical layer switches from a higher transmission rate to a lower one,
different than the one that the VoIP flow needs, the switching may result in congestion, high delay and
packet loss, and consequently speech quality degradation. However, there are some algorithms that adapt
the transmission parameters according to the channel conditions. In this study we demonstrate how
choosing parameter (different codec and packet size) can affect the voice quality, network delay and packet
loss. Further, this study presents a comparison between adaptive and non-adaptive methods. The adaptive
method has also been evaluated for different congestion level from perceived speech quality point of view.
KEYWORDS
Adaptive rate control algorithm, Codec, IEEE 802.11, Multi-Rate WLAN, packetization interval, QoS,
VoIP.
INTRODUCTION
There are a number of different techniques to handle the problem of multi-rate mechanism of
802.11 for speech traffic. On one hand, at the receiver side, playout buffer length (jitter buffer
size) can be adaptive. This can be implemented to relieve delay and packet loss [1], [2], [3], [4]
and [5]. On the other hand, rate adaptation mechanism can adjustthe input rate based on the link
condition. One of the most famous rate adaptation techniques for speech transmission is codec
switching or coding rate adjustment which can adjust different coding bit-rate (compression rate).
Another one is by adjusting packetization interval. These techniques can be implemented in the
sender side. In the transmission of VoIP (Voice over IP) traffic, rate adaptation mechanisms can
be divided into two main categories; codec rate adaptation and adaptive packetization.
1.1 VOIP
Voice over IP (VoIP) is the real-time application that is probably the most widely-spread on
today's networks. I'll provide here some basic facts related to VoIP. Figure below shows the end-
to-end path as needed for VoIP communication (a similar path exists in the opposite sense for a
bi-directional connection). An audio input device, such as a microphone, is required at the
sending end. The audio signal is transformed into digital form by an analog-to-digital converter.
Due to the packet-switched nature of computer networks, voice data has to be packetized and
encoded prior to being transmitted. Encoding (as well as decoding) is done by codecs that
transform sampled voice data into a specific network-level representation and back. Most of the
codecs are defined by standards of the International Telecommunication Union, the
Telecommunication division (ITU-T). Each of them has different properties regarding the amount
of bandwidth it requires but also the perceived quality of the encoded speech signal. After binary
information is encoded and packetized at the sender end, packets encapsulating voice data can be transmitted on the network. Voice packets interact in the network with other application
packets and are routed through shared connections to their destination. At the receiver end they
International Journal of Computational Science and Information Technology (IJCSITY) Vol.5, No.1, February 2017
2
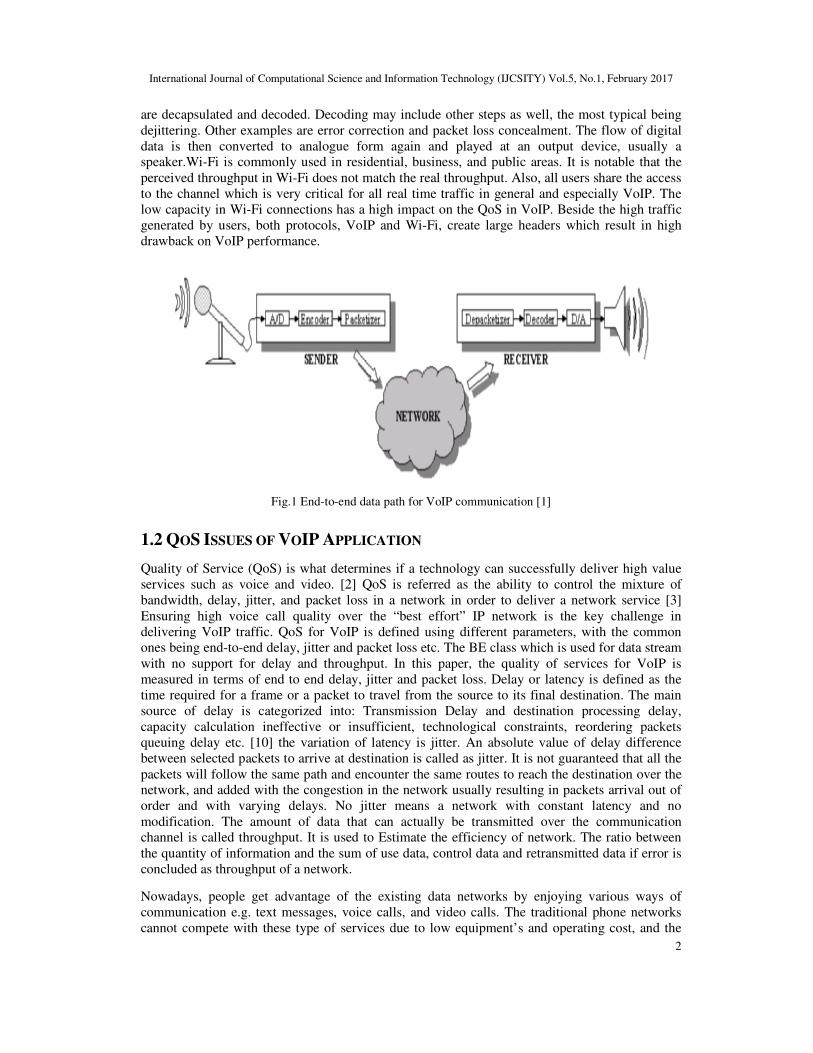
are decapsulated and decoded. Decoding may include other steps as well, the most typical being
dejittering. Other examples are error correction and packet loss concealment. The flow of digital
data is then converted to analogue form again and played at an output device, usually a
speaker.Wi-Fi is commonly used in residential, business, and public areas. It is notable that the
perceived throughput in Wi-Fi does not match the real throughput. Also, all users share the access
to the channel which is very critical for all real time traffic in general and especially VoIP. The
low capacity in Wi-Fi connections has a high impact on the QoS in VoIP. Beside the high traffic
generated by users, both protocols, VoIP and Wi-Fi, create large headers which result in high
drawback on VoIP performance.
Fig.1 End-to-end data path for VoIP communication [1]
1.2 QOS ISSUES OF VOIP APPLICATION
Quality of Service (QoS) is what determines if a technology can successfully deliver high value
services such as voice and video. [2] QoS is referred as the ability to control the mixture of
bandwidth, delay, jitter, and packet loss in a network in order to deliver a network service [3]
Ensuring high voice call quality over the “best effort” IP network is the key challenge in
delivering VoIP traffic. QoS for VoIP is defined using different parameters, with the common
ones being end-to-end delay, jitter and packet loss etc. The BE class which is used for data stream
with no support for delay and throughput. In this paper, the quality of services for VoIP is
measured in terms of end to end delay, jitter and packet loss. Delay or latency is defined as the
time required for a frame or a packet to travel from the source to its final destination. The main
source of delay is categorized into: Transmission Delay and destination processing delay,
capacity calculation ineffective or insufficient, technological constraints, reordering packets
queuing delay etc. [10] the variation of latency is jitter. An absolute value of delay difference
between selected packets to arrive at destination is called as jitter. It is not guaranteed that all the
packets will follow the same path and encounter the same routes to reach the destination over the
network, and added with the congestion in the network usually resulting in packets arrival out of
order and with varying delays. No jitter means a network with constant latency and no
modification. The amount of data that can actually be transmitted over the communication
channel is called throughput. It is used to Estimate the efficiency of network. The ratio between
the quantity of information and the sum of use data, control data and retransmitted data if error is
concluded as throughput of a network.
Nowadays, people get advantage of the existing data networks by enjoying various ways of
communication e.g. text messages, voice calls, and video calls. The traditional phone networks
cannot compete with these type of services due to low equipment’s and operating cost, and the

International Journal of Computational Science and Information Technology (IJCSITY) Vol.5, No.1, February 2017
3
ability of integrating voice and data in applications. The QoS for VoIP can be measured by
evaluating three performance metrics: Mean Opinion Score (MOS), Jitter, and end-to-end delay.
Mean Opinion Score (MOS): MOS is a scale from 1 to 5 which measures the quality of the
voice. The value of worst quality is 1 and the best quality is 5.
Quality Scale Score Listening effort Scale
Excellent 5 No effort required
Good 4 No appreciable effort required
Fair 3 Moderate effort required
Poor 2 Considerable effort required
Bad 1 No meaning understood with reasonable effort
Table 1. Mean Opinion Score (MOS) [1]
Jitter: The variation in arrival time of consecutive packets is called jitter. Beforedecoding,
packets arrive to limited size buffer however some packets may lost orarrive out of order. Jitter
can be calculated by computing the difference delayofpackets over a period of time.
Packet end-to-end delay: The end-to-end delay can be measured by calculating the delay from
the speaker to the receiver. This includes network delay, encoding and decoding delay, and
compression and decompression delay.
Table 1.2 shows the guidelines for voice quality measurement for both jitter and end-to- end delay
as it is provided by ITU Telecommunication Standardization Sector (ITU-T).
Network Parameter Good Acceptable Poor
Delay(ms) 0-150 150-300 >300
Jitter(ms) 0-20 20-50 >50
Table 2. Guideline for the Voice Quality Measurement[1]
1.3 CODEC ADAPTATION
Some codecs provide higher compression and as a result, lower utilization of bandwidth, so they
support more calls. In the opposite side, some others provide lower compression resulting in
higher bandwidth consumption and less number of calls. From another point of view, higher
compression codecs has lower bit rate which means lower perceived quality. Two main speech
codecs namely G.711 with 64 kbps and G.729 with 8 kbps bit rate widely used. G.729 utilizes one
eight of the bandwidth compared to G.711. This means G.729 supports more calls but they are of
lower quality. TheVoIP call that uses constant bit-rate codec has a fixed output rate, independent
of network condition. Since a codec generates a constant output of bit rate, independent of
network condition, lack of available bandwidth causes congestions and result in the packets being
delayed or dropped.
Therefore, when the transmission rate is reduced, high bit rate codec can cause congestions while
in same situation low bit rate codec can act normally.

International Journal of Computational Science and Information Technology (IJCSITY) Vol.5, No.1, February 2017
4
Fig.2. Codec adaptation [9]
1.4 RATE ADAPTATION
Rate adaptation is a link layer mechanism critical to the system performance by exploiting the
multiple transmission rates provided by current IEEE 802.11 WLANs. The key challenge for
designing such an algorithm is how to select the most appropriate transmission rate under
different environments.
Rate adaptation is the determination of the optimal data transmission rate most appropriate for
current wireless channel conditions. It consists of assessing channel conditions and accordingly
adjusting the rate. Rate adaptation is fairly challenging due to wild channel conditions
fluctuations. In the last decade, rate adaptation for IEEE 802.11 networks has been extensively
investigated.
1.5 NETWORK SIMULATOR 2
Network Simulator NS-2 (Network Simulator) [8] is a discrete event driven simulator used for
implementation and simulations of various network protocols.NS-2 was developed in the year
1989NS-2 is used for modelling network component like • Traffic models and applications: Web,
FTP, telnet, audio, sensor nets • Transport protocols: TCP and UDP • Routing and Queuing,
Local Area Networks, wireless links, and satellite links. NS-2 also provides infrastructure for
tracing, visualization, error models and to modify or create our own modules. Using components
in ns, different traffic and topologies can be generated and NAM (Network Animator) can be used
for providing visual outputs. Advantages of NS-2 as a Simulation Tool NS-2 was chosen as the
simulation tool for implementation of this paper because of its modular and open architecture.
Fig 3. Basic Architecture of NS-2 Simulator [13]

International Journal of Computational Science and Information Technology (IJCSITY) Vol.5, No.1, February 2017
5
NS-2 supports dual output which can be either text-based or graphical based. For graphical based
simulation NS-2 has inbuilt tool i.e. NAM (Network Animator). We have used the NS2 in our
project due to easy to learning, user friendly, GUI as well as command line, open source, Linux
based also real time and large number source capability.NS-2 is totally based on Object Oriented
(OO)the simulator framework uses a two-language programming approach, OTcl and C++. OTcl
(object oriented version of Tcl) is fast to run, whereas C++ is fast to write and change. The
framework allows a very detailed modeling of wireless communication using radio prorogation
models, Antennas, link layer, ARP, MAC layer protocols (e.g. IEEE 802.11), as well as ad-hoc
routing protocols like AODV, DSR, DSDV etc. Simulation Topology and Environment
Following simulation parameters were adopted to test the validity of the modified approach [8,10]
1.6 SIMULATION SET UP
Exponential traffic voice (created packet while talk period for 1.00ms and no packet is created
during 1.3ms of silent period) is a scenario in the implementation using SIP to fulfill sending
voice packet from end to end nodes.
1.7 RESULT AND DISCUSSION
In this Section, we compare the capabilities of the three VOIP codec’s studied in this paper. To
evaluate more reliable performance of G.711, G.723 and G.729 VoIP codec’s in same simulation
environment (50 to 300 mobile nodes). Performance metrics are calculated from trace file, with
the help of AWK program. The simulation results shown in the following section in the form of
line graph with description. The result shows the comparison between the three codecs on
different QoS parameters in a VoIP network with Non-mobility scenarios.
GRAPHS OF CODEC’S IN NON-MOBILITY SCENARIO - WI-FI:
1.8 CODEC ADAPTATION
1.8.1 Delay
Fig.4. Delay vs Number of nodes
Table 3. Readings of Delay vs Number of nodes
0
20
40
0 100 200 300 400De
lay
(ms)
No Of Nodes
Delay
G.711
G.723
G.729
Delay
No of Nodes G.711 G.723 G.729
50 10.006 27.1402 27.0985
100 12.9204 21.8371 21.9207
150 12.9789 19.7138 19.6157
200 11.5245 18.402 18.0957
250 11.7394 19.312 19.1733
300 11.4341 18.1266 18.0227

International Journal of Computational Science and Information Technology (IJCSITY) Vol.5, No.1, February 2017
6
From the above figure and table Delay was gained at destination node against various dimension
of networks and varied the simulation time uniformly for each codec. This data may be delivered
over a physical or logical link, or pass through a certain network node. it is clear that G.729 gives
more delay when the nodes are more. G.711 and G.723 codecs gives less delay. G.729 had a high
delay. From these graphs it is clear that delay decrease with increase in non-mobility nodes.
1.8.2 MOS
Fig.5. MOS vs Number of nodes
MOS
No of Nodes G.711 G.723 G.729
50 14.4266 16.8844 16.7141
100 14.8738 18.1194 18.0848
150 13.8938 18.5201 18.5863
200 14.0479 19.086 19.1325
250 15.7118 18.8408 18.8946
300 16.6547 19.3664 19.3738
Table 4. Readings of MOS vs Number of nodes
The most widely used QoS metric in VOIP applications is MOS. The MOS value describes the
voice perception quality. The average MOS value for the three codecs is represented in figure
above. From the graph it is observed that MOS value increases as the nodes increases. Codecs
G.711 and G.723 have acceptable MOS value G.723 and G.729, respectively. On the other hand,
the MOS value for G.729 is 19.3738 which indicate that the quality of service is good if this
codec is used.
1.8.3 PDR
Figure below figure and table describes the average voice PDR comparison using different
codecs. From the figure, the variation of the codec is minimum after 100 nodes and
approximately varying throughout the simulation. The average voice throughput variation in case
of codec G.723 is lower than the other two codecs at the earlier time of simulation. The PDR
variation in case of G.729 lies between two other audio codecs. So audio codec G.723 gives better
results than audio codecs G.711 and G.729 respectively.
0
5
10
15
20
25
0 100 200 300 400
MO
S
No of nodes
MOS
G.711
G.723
G.729

International Journal of Computational Science and Information Technology (IJCSITY) Vol.5, No.1, February 2017
7
Fig.6. PDR vs Number of nodes
Packet Delivery
ratio
No of Nodes G.711 G.723 G.729
50 14.7053 4.2897 14.4356
100 7.04911 6.16613 5.97557
150 3.96553 3.79713 4.18666
200 2.05143 2.14277 2.0679
250 1.50003 1.5714 1.53505
300 0.885652 1.14652 1.17401
Table 5 Readings of PDR vs Number of nodes
1.8.4 Throughput
Fig.7. Throughput vs Number of nodes
Throughput
No of Nodes G.711 G.723 G.729
50 146976 118617 121296
100 101554 73229.2 73132.1
150 80945.3 62387.5 67257.9
200 59712.1 51735.5 48410.9
250 46505.4 39101.3 38431.8
300 28917.1 30617.7 30371.3
Table 6. Readings of Throughput vs Number of nodes
0
10
20
0 100 200 300 400P
ack
et
de
liv
ery
rati
o(p
ack
ets
/by
tes)
No. of nodes
Packet Delivery ratio
G.711
G.723
G.729
0
50000
100000
150000
200000
0 100 200 300 400
TH
rou
gh
pu
t(b
ps)
No of nodes
Throughput
G.711
G.723
G.729

International Journal of Computational Science and Information Technology (IJCSITY) Vol.5, No.1, February 2017
8
Figure above figure and table describes the average voice throughput comparison using different
codecs. From the figure, the variation of the codec is minimum and approximately varying
throughout the simulation. The average voice throughput variation in case of codec G.711 is
higher than the other two codecs at the earlier time of simulation. But after some time it falls
down. The throughput variation in case of G.723 lies between two other audio codecs. So audio
codec G.729 gives better results than audio codecs G.711 and G.723 respectively.
1.8.5 Jitter
Wi-Fi is commonly used in residential, business, and public areas. It is notable that the perceived
throughput in Wi-Fi does not match the real throughput. Also, all users share the access to the
channel which is very critical for all real time traffic in general and especially VoIP. The low
capacity in Wi-Fi connections has a high impact on the QoS in VoIP. Beside the high traffic
generated by users, both protocols, VoIP and Wi-Fi, create large headers which result in high
drawback on VoIP performance.
Fig.8. Jitter vs Number of nodes
Jitter
No of Nodes G.711 G.723 G.729
50 0.00833 0.008498 0.008088
100 0.007473 0.008641 0.008145
150 0.008015 0.008401 0.00785
200 0.009502 0.009492 0.009489
250 0.012755 0.012794 0.012794
300 0.019217 0.014816 0.014902
Table 7. Readings of Jitter vs Number of nodes
1.9 RATE ADAPTATIAON
1.9.1 Delay
Fig. 9. Delay vs Number of nodes
0
0.02
0.04
0 100 200 300 400Jitt
er(
ms)
No. of nodes
Jitter
G.711
G.723
G.729
0
50
0 100 200 300 400
De
lay
(ms)
No Of Nodes
Delay
G.711
G.723
G.729

International Journal of Computational Science and Information Technology (IJCSITY) Vol.5, No.1, February 2017
9
Delay
No of Nodes G.711 G.723 G.729
50 10.006 27.1402 27.0985
100 12.9204 21.8371 21.9207
150 12.9789 19.7138 19.6157
200 11.5245 18.402 18.0957
250 11.7394 19.312 19.1733
300 11.4341 18.1266 18.0227
Table 8. Readings of Delay vs Number of nodes
From the above figure and table Delay was gained at destination node against various dimension
of networks and varied the simulation time uniformly for each codec. This data may be delivered
over a physical or logical link, or pass through a certain network node. It is clear that G.729 gives
more delay when the nodes are more. G.711 and G.723 codecs gives less delay. G.729 had a high
delay. From these graphs it is clear that delay decrease with increase in non-mobility nodes.
1.9.2 MOS
Fig.10. MOS vs Number of nodes
MOS
No of Nodes G.711 G.723 G.729
50 14.4266 16.8844 16.7141
100 14.8738 18.1194 18.0848
150 13.8938 18.5201 18.5863
200 14.0479 19.086 19.1325
250 15.7118 18.8408 18.8946
300 16.6547 19.3664 19.3738
Table 9 Readings of MOS vs Number of nodes
The most widely used QoS metric in VOIP applications is MOS. The MOS value describes the
voice perception quality. The average MOS value for the three codecs is represented in figure
above. From the graph it is observed that MOS value increases as the nodes increases. Codecs
G.711 and G.723 have acceptable MOS value G.723 and G.729, respectively. On the other hand,
the MOS value for G.729 is 19.3738 which indicate that the quality of service is good if this
codec is used.
0
5
10
15
20
25
0 100 200 300 400
MO
S
No of nodes
MOS
G.711
G.723
G.729

International Journal of Computational Science and Information Technology (IJCSITY) Vol.5, No.1, February 2017
10
1.9.3 PDR
Figure below figure and table describes the average voice PDR comparison using different
codecs. From the figure, the variation of the codec is minimum after 100 nodes and
approximately varying throughout the simulation.The average voice throughput variation in case
of codec G.723 is lower than the other two codecs at the earlier time of simulation.
Fig.11 PDR vs Number of nodes
Packet Delivery ratio
No of Nodes G.711 G.723 G.729
50 1.92308 13.7232 14.5958
100 26.178 7.33656 7.51509
150 23.8849 5.25982 4.91923
200 28.8939 2.3436 2.10193
250 28.1065 3.61075 3.33329
300 19.5699 0.902837 0.86395
Table 10. Readings of PDR vs Number of nodes
The PDR variation in case of G.729 lies between two other audio codecs. So audio codec G.723
gives better results than audio codecs G.711 and G.729 respectively.
1.9.4 Throughput
Fig. 12 Throughput vs Number of nodes
0
10
20
30
40
0 100 200 300 400Pa
cke
t d
eli
ve
ry
rati
o(p
ack
ets
/by
tes)
No. of nodes
Packet Delivery ratio
G.711
G.723
G.729
0
50000
100000
150000
200000
250000
0 100 200 300 400
TH
rou
gh
pu
t(b
ps)
No of nodes
Throughput
G.711
G.723
G.729
International Journal of Computational Science and Information Technology (IJCSITY) Vol.5, No.1, February 2017
11
Throughput
No of Nodes G.711 G.723 G.729
50 738.091 115027 118334
100 115282 86149.5 86526.2
150 182626 88846.7 81689.5
200 192470 55001 48734.8
250 208345 91383.2 83598.3
300 198229 23599.7 22636.6
Table 11Readings of Throughput vs Number of nodes
Figure above figure and table describes the average voice throughput comparison using different
codecs. From the figure, the variation of the codec is minimum and approximately varying
throughout the simulation. The average voice throughput variation in case of codec G.711 is
higher than the other two codecs at the earlier time of simulation. But after some time it falls
down. The throughput variation in case of G.723 lies between two other audio codecs. So audio
codec G.729 gives better results than audio codecs G.711 and G.723 respectively.
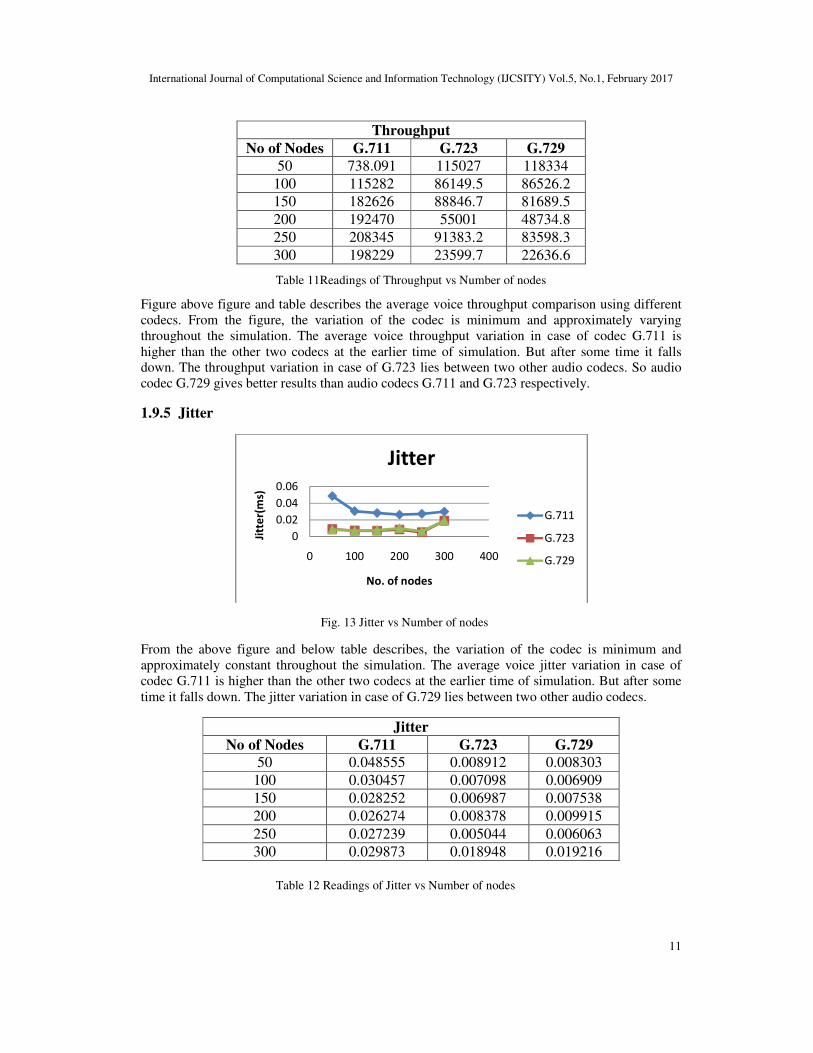
1.9.5 Jitter
Fig. 13 Jitter vs Number of nodes
From the above figure and below table describes, the variation of the codec is minimum and
approximately constant throughout the simulation. The average voice jitter variation in case of
codec G.711 is higher than the other two codecs at the earlier time of simulation. But after some
time it falls down. The jitter variation in case of G.729 lies between two other audio codecs.
Jitter
No of Nodes G.711 G.723 G.729
50 0.048555 0.008912 0.008303
100 0.030457 0.007098 0.006909
150 0.028252 0.006987 0.007538
200 0.026274 0.008378 0.009915
250 0.027239 0.005044 0.006063
300 0.029873 0.018948 0.019216
Table 12 Readings of Jitter vs Number of nodes
0
0.02
0.04
0.06
0 100 200 300 400
Jitt
er(
ms)
No. of nodes
Jitter
G.711
G.723
G.729

International Journal of Computational Science and Information Technology (IJCSITY) Vol.5, No.1, February 2017
12
The voice jitter threshold for smooth communication in VOIP network is about 1ms so audio
codec G.729 gives better results than audio codecs G.711 and G.723 respectively.
1.10 CODEC-RATE ADAPTATION
1.10.1 Delay
Fig.14 Delay vs Number of nodes
Delay
No of Nodes G.711 G.723 G.729
50 13.8342 26.8252 26.988
100 11.8812 21.933 21.451
150 12.3554 18.3049 18.6247
200 11.7479 18.219 17.8569
250 11.6647 18.5019 18.5019
300 11.449 18.3837 18.3136
Table 13 Readings of Delay vs Number of nodes
From the above figure and table describes Delay was gained at destination node against various
dimension of networks and varied the simulation time uniformly for each codec. This data may be
delivered over a physical or logical link, or pass through a certain network node. it is clear that
G.729 gives more delay when the nodes are more. G.711 and G.723 codecs gives less delay.
G.729 had a high delay. From these graphs it is clear that delay decrease with increase in non-
mobility nodes.
1.10.2 MOS
Fig.15. MOS vs Number of nodes
0
10
20
30
0 100 200 300 400
De
lay
(ms)
No Of Nodes
Delay
G.711
G.723
G.729
0
20
40
0 100 200 300 400
MO
S
No of nodes
MOS
G.711
G.723
G.729

International Journal of Computational Science and Information Technology (IJCSITY) Vol.5, No.1, February 2017
13
MOS
No of Nodes G.711 G.723 G.729
50 3.67614 16.7733 16.7452
100 17.2539 18.3478 18.384
150 11.8256 18.8024 18.7271
200 12.5001 19.1248 19.1387
250 13.6271 19.2368 19.2439
300 14.012 19.3194 19.3139
Table 14 Readings of MOS vs Number of nodes
The most widely used QoS metric in VOIP applications is MOS. The MOS value describes the
voice perception quality. The average MOS value for the three codecs is represented in figure
above. From the graph it is observed that MOS value increases as the nodes increases. Codecs
G.711 and G.723 have acceptable MOS value G.723 and G.729, respectively. On the other hand,
the MOS value for G.729 is 19.3738 which indicate that the quality of service is good if this
codec is used.
1.10.3 PDR
Fig.16 PDR vs Number of nodes
Packet Delivery ratio
No of Nodes G.711 G.723 G.729
50 81.3187 13.2897 14.4356
100 11.6667 9.26613 5.97557
150 39.5095 4.89773 4.18666
200 36.044 3.15673 2.0679
250 30.2632 1.65714 1.53505
300 28.2869 1.54652 1.17401
Table 15 Readings of PDR vs Number of nodes
From the above figure and table describes the average voice PDR comparison using different
codecs. From the figure, the variation of the codec is minimum after 100 nodes and
approximately varying throughout the simulation. The average voice throughput variation in case
of codec G.723 is lower than the other two codecs at the earlier time of simulation. The PDR
variation in case of G.729 lies between two other audio codecs. So audio codec G.723 gives better
results than audio codecs G.711 and G.729 respectively.
0
50
100
0 100 200 300 400
Pa
cke
t d
eli
ve
ry
rati
o(p
ack
ets
/by
tes)
No. of nodes
Packet Delivery ratio
G.711
G.723
G.729

International Journal of Computational Science and Information Technology (IJCSITY) Vol.5, No.1, February 2017
14
1.10.4 Throughput
Fig.17. Throughput vs Number of nodes
Throughput
No of Nodes G.711 G.723 G.729
50 83981.4 118617 121296
100 50447.9 73229.2 73132.1
150 206104 62387.5 67257.9
200 254762 51735.5 48410.9
250 203085 39101.3 38431.8
300 167279 30617.7 30371.3
Table 16. Readings of Throughput vs Number of nodes
From the above figure and table describes the average voice throughput comparison using
different codecs. From the figure, the variation of the codec is minimum and approximately
varying throughout the simulation. The average voice throughput variation in case of codec G.711
is higher than the other two codecs at the earlier time of simulation. But after some time it falls
down. The throughput variation in case of G.723 lies between two other audio codecs. So audio
codec G.729 gives better results than audio codecs G.711 and G.723 respectively.
1.10.5 Jitter
Fig.18 Jitter vs Number of nodes
0
100000
200000
300000
0 100 200 300 400
TH
rou
gh
pu
t(b
ps)
No of nodes
Throughput
G.711
G.723
G.729
0
0.05
0.1
0.15
0 100 200 300 400
Jitt
er(
ms)
No. of nodes
Jitter
G.711
G.723
G.729
International Journal of Computational Science and Information Technology (IJCSITY) Vol.5, No.1, February 2017
15
Jitter
No of Nodes G.711 G.723 G.729
50 0.068239 0.008498 0.008088
100 0.106221 0.008641 0.008145
150 0.027136 0.008401 0.00785
200 0.021992 0.009492 0.009489
250 0.0271 0.012794 0.012794
300 0.032781 0.014816 0.014902
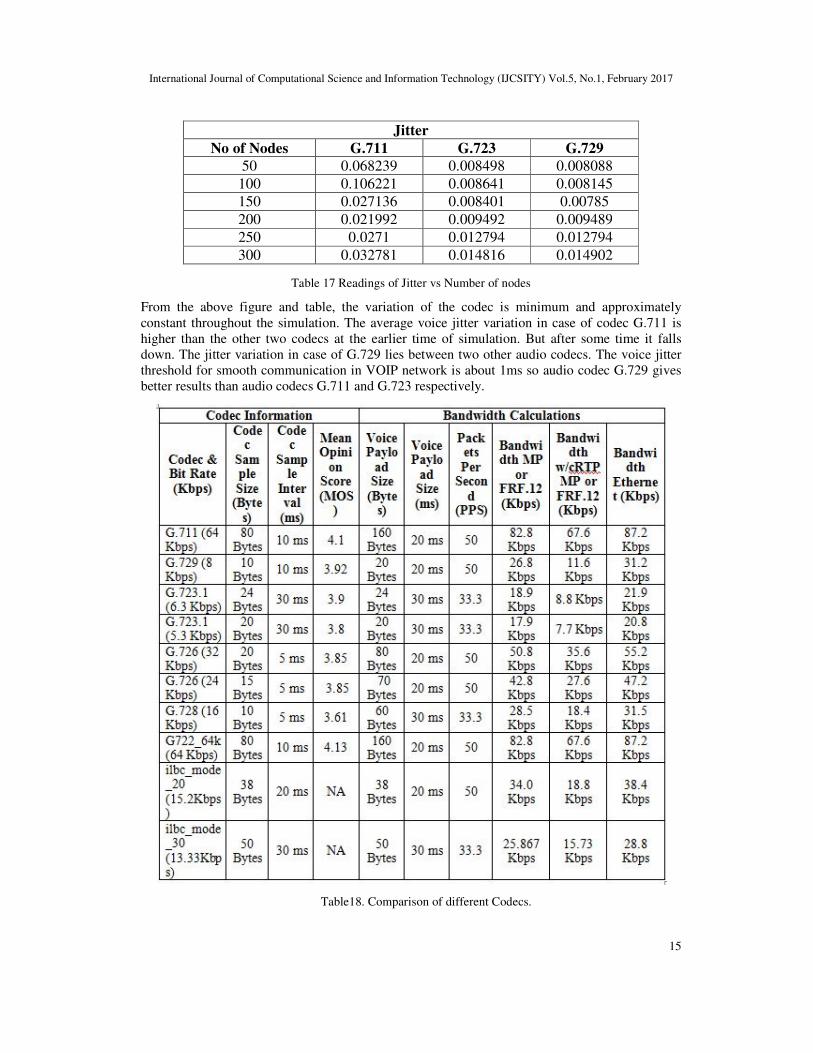
Table 17 Readings of Jitter vs Number of nodes
From the above figure and table, the variation of the codec is minimum and approximately
constant throughout the simulation. The average voice jitter variation in case of codec G.711 is
higher than the other two codecs at the earlier time of simulation. But after some time it falls
down. The jitter variation in case of G.729 lies between two other audio codecs. The voice jitter
threshold for smooth communication in VOIP network is about 1ms so audio codec G.729 gives
better results than audio codecs G.711 and G.723 respectively.
Table18. Comparison of different Codecs.

International Journal of Computational Science and Information Technology (IJCSITY) Vol.5, No.1, February 2017
16
CONCLUSION
In this project, So far the comparison between codec adaptive, rate adaptive, codec and rate
adaptive and non-adaptive methods have been done and results show that in most of the cases
when the congestion is low or moderate, rate adaptation improves the perceived quality and
results in lower load and lower end-to end delay and lower packet loss compared to non-adaptive
methods. However, in terms of severe congestion, codec adaptation act better than rate adaptation
since it has a big effect on the speech output rate. Accordingly, since rate adaptation has less
impact on the system in terms of more simplicity and lower coding cost, the algorithm will be
started by rate adaptation in the case of low congestion. If the system becomes highly congested
where rate adaptation is not enough, the algorithm will commence codec adaptation. Furthermore,
in the critical situation where even codec adaptation could not rectify the congestion, both
approaches can work together.
REFERENCES:
[1] Performance Analysis of VoIP Codecs over WiMAX, Khaled Alutaibi
[2] H. Kazemitabar, A. Md. Said UniversitiyTechnology PETRONAS [email protected]
Adaptive QoS Control Approaches for VoIP Over Multi-Rate WLAN’s.
[3] A survey of quality of service in IEEE802.11 Networks,HUA ZHU, MING LI, IMRICH
CHLAMTAC, AND B. PRABHAKARANTHE UNIVERSITY OF TEXAS AT DALLAS.
[4] Priority Based Dynamic Rate Control for VoIP Traffic, Fariza Sabrina CSIRO ICT Centre,
Sydney, Australia.
[5] VoIP codec adaptation algorithm in multirate 802.11 WLANs, Anna Sfairopoulou, Carlos
Macilan, Boris Bellalta.
[6] A new method for VoIP Quality of Service control using combined adaptive sender rate and
priority marking, Zizhi Qiao, Lingfen Sun, Nicolai Heilemann and Emmanuel Ifeachor.
[7] VoIP over Wireless LAN Survey, Răzvan Beuran,Internet Research Center Japan Advanced
Institute of Science and Technology (JAIST).
[8] ITU-T
[9] Adaptive QoS Control Approaches for VoIP Over Multi-Rate WLANs, H. Kazemitabar, A. Md.
Said Universiti Teknologi PETRONAS Bandar Seri Iskandar, 31750 Tronoh, Perak, Malaysia.
[10] Performance Analysis Of VOIP Codec’s With QoS, Parameters, Priyanka Grover1, Meenakshi
Chawla2 Dept. of Computer Engineering, TIT&S, Bhiwani.
[11] PERFORMANCE ANALYSIS OF VOIP TRAFFIC OVER INTEGRATING WIRELESS LAN
AND WAN USING DIFFERENT CODECS, Ali M. Alsahlany, Department of Communication
Engineering, Al-Najaf Technical College, Foundation of Technical Education, Iraq.
[12] Performance Analysis of various Codecs Schemes of VOIP over WiMAX, M-Tech Student#1
,Assit. Prof. *2 & Dept. of CSE., Manav Rachna International University, Faridabad, Haryana,
India.
[13] Performance Analysis of VOIP Codes under Different Mobility Pattern,Manpreet Kaur.
[14] Performance Evaluation of The Quality of VoIP Over WLAN Codecs, H.A. Ifijeh, F.E. Idachaba,
and I.B. Oluwafemi
[15] R. M. Hirannaiah, et al., "Influence of Codecs on Adaptive Jitter Buffer Algorithm," in Vehicular
Technology Conference, 2007.VTC-2007 Fall. 2007 IEEE 66th, 2007, pp. 2015-2019.

International Journal of Computational Science and Information Technology (IJCSITY) Vol.5, No.1, February 2017
17
[16] M. Narbutt and L. Murphy. (2003, VoIP Playout Buffer Adjustment using Adaptive Estimation
of Network Delays. Research Publications.
[17] S. Madhani, et al., "Optimized Adaptive Jitter Buffer Design for Wireless Internet Telephony," in
Global TelecommunicationsConference, 2007. GLOBECOM '07. IEEE, 2007, pp. 52485253.
[18] L. Jing and N. Zhisheng, "An adaptive receiver buffer adjust algorithm for VoIP applications
considering voice characters," in Communications, 2004 and the 5th International Symposiumon
Multi-Dimensional Mobile Communications Proceedings. The 2004 Joint Conference of the 10th
Asia-Pacific Conference on, 2004, pp. 597-601 vol.2.
[19] M. Baratvand, et al., "Jitter-Buffer Management for VoIP over Wireless LAN in a Limited
Resource Device," in Networkingand Services, 2008. ICNS 2008. Fourth
InternationalConference on, 2008, pp. 90-95.
[20] J. Light and A. Bhuvaneshwari, "Performance analysis of audio codecs over real-time
transmission protocol (RTP) for voice services over Internet protocol," in Communication
Networksand Services Research, 2004. Proceedings. Second AnnualConference on, 2004, pp.
351-356.
[21] O. Hersent, et al., Beyond VoIP Protocols: Understanding Voice Technology and Networking
Techniques for IP Telephony:Wiley, 2005.
[22] B. Ngamwongwattana, "Sync & Sense Enabled Adaptive Packetization VoIP," Phd Pittsburgh,
USA, 2007.
[23] S. Garg and M. Kappes, "Can I add a VoIP call?," in Communications, 2003. ICC '03. IEEE
InternationalConference on, 2003, pp. 779-783 vol.2.