Case Study Enhancements Tracking - pengtools.com
40
Achieving potential All your need to maximize your oil & gas production, quick Case Study Enhancements Tracking Mikhail Tuzovskiy, 31.07.2018 [email protected]
Transcript of Case Study Enhancements Tracking - pengtools.com

Achieving potential
All your need to maximize your oil & gas production, quick
Case Study Enhancements Tracking Mikhail Tuzovskiy, 31.07.2018 [email protected]

E&P Portal. Case Study Enhancements Tracking
Copyright © Akadem Petroleum Technology Inc. Exploration and Production Portal, 2018 1
Summary This Case Study demonstrates the application of the Enhancement Tracking workflow to
track and evaluate the benefits of executed enhancements using the E&P Portal.
The Study is based on the enhancement campaign implemented in an oil field located in Siberia, Russia. The campaign included such enhancements as fracturing, installing and upgrading the ESPs, choke opens and resulted in 4 mln bbl of incremental oil recovery (IOR).
It is shown how to:
• Input the required data to the E&P Portal; • Apply the Enhancement Tracking workflow to track and benchmark enhancements; • Save and export the analysis results.
All the input data is attached to the Case Study for the reference.

E&P Portal. Case Study Enhancements Tracking
Copyright © Akadem Petroleum Technology Inc. Exploration and Production Portal, 2018 2
Table of Contents Summary .................................................................................................................................... 1
Introduction ............................................................................................................................... 3
Enhancement IOR and Scorpion Plot ......................................................................................... 4
Field and Reservoir Data ............................................................................................................ 5
Enhancement Campaign Data ................................................................................................... 7
Well 9 Enhancements ................................................................................................................ 8
Enhancement 1. Converting the flowing well to the ESP .................................................. 9
Enhancement 2. Fracing the damaged well..................................................................... 10
Enhancement 3. ESP upgrade .......................................................................................... 11
Data Input to the E&P Portal ................................................................................................... 12
Signing up ............................................................................................................................. 12
Adding the “Huron” field ..................................................................................................... 14
Adding the Huron pad “1” ................................................................................................... 15
Uploading Huron wells ......................................................................................................... 16
Upload the Huron wells daily production data .................................................................... 18
Upload the Huron wells enhancement production forecast data ....................................... 20
Upload the Huron wells enhancement campaign data ....................................................... 22
Applying the Enhancement Tracking ....................................................................................... 24
Well 9 Enhancement ............................................................................................................ 25
Enhancement 1. Converting the flowing well to the ESP ................................................ 25
Enhancement 2. Fracing the damaged well..................................................................... 27
Enhancement 3. ESP upgrade .......................................................................................... 29
Well 9 enhancement summary ........................................................................................ 31
Enhancement campaign analysis ......................................................................................... 33
What is the campaign total IOR vs total cost?................................................................. 34
Which enhancement campaign has better $/bbl performance? .................................... 35
Which well has better $/bbl performance? .................................................................... 36
Saving and exporting the analysis results ................................................................................ 37
Conclusions .............................................................................................................................. 38
References ............................................................................................................................... 39
Attachments ............................................................................................................................. 39

E&P Portal. Case Study Enhancements Tracking
Copyright © Akadem Petroleum Technology Inc. Exploration and Production Portal, 2018 3
Introduction E&P Portal is a service to identify production enhancement opportunities and maximize
production and recovery. The average production increase for the last 3 E&P companies applied the E&P Portal was 38%.
Enhancement Tracking is a workflow to assess the benefits achieved by executed Enhancements (Martins, MacDonald, Stewart, & Phillips, 1995). The workflow answers those questions:
• What is the campaign total incremental oil recovery (IOR) vs total cost? • Which enhancement campaign has better $/bbl performance? • Which well has better $/bbl performance? • What is the IOR for each enhancement?
Enhancement is a well intervention to close the performance gap of the well. The typical enhancements are (From most $/bbl effective to least):
• Choke open • Pump Optimization • ESP (converting the flowing well to ESP; upgrading the ESP etc) • Acid Job • Reperforation • Frac • Multistage Frac • Sidetrack • Drilling New Well
Figure 1 . Enhancement example: Converting the Flowing well to the ESP
Each Enhancement is tracked by calculating it’s enhancement IOR.
Scorpion Plot is used for graphical representation of the Enhancements performance.
Enhancement Tracking is available at the E&P Portal as one of its engineering workflows. To get the access to the Enhancement Tracking tool please sign up at ep.pengtools.com. The accesses is free for the personal use.

E&P Portal. Case Study Enhancements Tracking
Copyright © Akadem Petroleum Technology Inc. Exploration and Production Portal, 2018 4
Enhancement IOR and Scorpion Plot Enhancement IOR is calculated as follows (Figure 2):
Figure 2 . Calculating enhancement IOR
Decline Curves are used to model base (pre job) and enhanced (post job) well rates. The Scorpion plot (Figure 3) graphically illustrates total program split by individual
events and ranked by success. The curve initiates from the origin at a low scope (low $/bbl) and increasing until running to a vertical asymptote (money spent with no gain in production) and possibly even a negative portion (money spent and production lost as a result of the intervention). This effectively displays program performance ($/bbl), total volume, total cost, and success rate (Nguyen, 2006).
Figure 3 . Scorpion Plot
More details on math and physics of the Enhancement Tracking are published on wiki at
https://wiki.pengtools.com/index.php?title=Enhancement_Tracking

E&P Portal. Case Study Enhancements Tracking
Copyright © Akadem Petroleum Technology Inc. Exploration and Production Portal, 2018 5
Field and Reservoir Data The “Huron” 1 field has 14 wells drilled from pad “1”, completed and producing form the
reservoir “1” (Figure 1).
Figure 4 . Huron field production history in the E&P Portal
Well locations are shown on the bubble map showing cumulative production and injection:
Figure 5 . Huron field bubble map in the E&P Portal
1 Note that the well, reservoir, field names as well as well production data, dates, costs were changed for the purpose of this study

E&P Portal. Case Study Enhancements Tracking
Copyright © Akadem Petroleum Technology Inc. Exploration and Production Portal, 2018 6
The reservoir “1” data is given below:
STOIIP 63 MMstb Connate water saturation Sw 13 % Rock compressibility cr 4.08E-6 psia-1 Initial reservoir pressure Pi 3700 psia Initial reservoir temperature Ti 100 F Oil density 40 API Bubble point pressure Pb 3700 psia Solution gas ratio Rs 2007 scf/bbl Gas specific gravity SGgas 0.8 Water specific gravity SGwater 1.1
Table 1 . Reservoir “1” data.

E&P Portal. Case Study Enhancements Tracking
Copyright © Akadem Petroleum Technology Inc. Exploration and Production Portal, 2018 7
Enhancement Campaign Data 24 well enhancements were executed in the “Huron” field in 3 campaigns:
1. Choke Open campaign (4); 2. ESP campaign (13); 3. Frac campaign2 (7).
Each well enhancement has the following data filed (Figure 6):
• Date • Type of enhancement (campaign) • Cost in USD • Well Stop Date (actual and planned) • Well Start Date (actual and planned) • Enhancement design report • Well Production Forecast
Figure 6. Wells Enhancement data in the E&P Portal
In the next section as an example well “9” enhancements are reviewed in detail.
2 The ESP is installed after the frac job by default. The frac cost includes the cost of the frac itself and the cost of installed ESP.

E&P Portal. Case Study Enhancements Tracking
Copyright © Akadem Petroleum Technology Inc. Exploration and Production Portal, 2018 8
Well 9 Enhancements There are 3 enhancements done in Well “9”:
1. Flowing well was converted to the ESP (before / after points 1 and 2); 2. Damaged well was fractured (before / after points 3 and 4); 3. Limited capacity ESP was upgraded (before / after points 4 and 5).
The enhancements are shown on the plot below:
Figure 7 . Well “9” history plot with enhancements in the E&P Portal
The well “9” performance is shown on the PQplot below:
Figure 8 . Well “9” PQplot with before and after enhancement performance points
Below are details on each enhancement done.
Converting the flowing well to ESP
Fracturing the damaged well
ESP upgrade
12
3
4
5
Flowing well IPR
Fractured well IPR
Damaged well IPR
3
1
2
4
5

E&P Portal. Case Study Enhancements Tracking
Copyright © Akadem Petroleum Technology Inc. Exploration and Production Portal, 2018 9
Enhancement 1. Converting the flowing well to the ESP
Soon after well startup the well’s flowing data was gathered and well performance was analyzed with PQplot (Figure 8 point 1). It was quickly realized that well is not working at potential (Q~2400 bbl/d) and where potential is (unstimulated well AOF~3800 bbl/d).
To close the performance gap ESP enhancement was designed. The maximum capacity ESP available at that moment was targeting ql=3000 bbl/d at Pwf ~ 1300 psi (Figure 9).
Figure 9 . Well “9” ESP design with the PumpDesign tool
The pump design report is attached as:
Attachment 1“Huron 9 Pump Design Report.pdf”.
The well was converted to a 5000 bbl/d ESP and started with enhanced performance shown as “point 2” on Figure 8.
The incremental oil recovery reached by this enhancement is 192,623 bbl at cost of $45,000 which is 0.23 USD/bbl (Figure 40).

E&P Portal. Case Study Enhancements Tracking
Copyright © Akadem Petroleum Technology Inc. Exploration and Production Portal, 2018 10
Enhancement 2. Fracing the damaged well
After about 2 years of production well “9” was damaged during the workover and left behind for about 2 more years (Figure 8 point 3).
As soon as frac campaign was started the 290000 lbm (130 ton) frac enhancement was designed. Given the maximum permeability proppant 16/20 available at the moment the design target was JD=0.32 which is about 100 folds of productivity increase (Figure 10).
Figure 10 . Well “9” frac design with the optiFrac tool
The frac design report is attached as:
Attachment 2“Huron 9 Frac Design Report.pdf”.
The well “9” was fraced and started with new performance (Figure 8 point 4).
About 20 folds of productivity increase was achieved in this high permeability (~200md) sand (purple point on the frac design Figure 10 shows the achieved vs planned JD).
The incremental oil recovery reached by this enhancement is 399,903 bbl at cost of $550,000 which is 1.38 USD/bbl (Figure 46).

E&P Portal. Case Study Enhancements Tracking
Copyright © Akadem Petroleum Technology Inc. Exploration and Production Portal, 2018 11
Enhancement 3. ESP upgrade
Soon after the fraced well flowing data was gathered well performance was reevaluated. It was realized that current ESP capacity is not enough to reach the well potential and ESP needs to be upgraded to the bigger one.
To close the performance gap ESP upgrade enhancement was designed The maximum capacity ESP available at that moment was targeting ql=5300 bbl/d at Pwf ~ 1450 psi (Figure 11).
Figure 11 . Well “9” ESP upgrade design with the PumpDesign tool
The pump design report is attached as:
Attachment 3“Huron 9 ESP upgrade Report.pdf”.
The well was converted to a 10000 bbl/d ESP and started with new performance (Figure 8 point 5).
The incremental oil recovery reached by this enhancement is 87,814 bbl at cost of $75,000 which is 0.85 USD/bbl (Figure 52).

E&P Portal. Case Study Enhancements Tracking
Copyright © Akadem Petroleum Technology Inc. Exploration and Production Portal, 2018 12
Data Input to the E&P Portal Signing up
First open ep.pengtools.com in your browser and signup or login to the E&P Portal.
Figure 12 . E&P Portal landing page
After signing up /logging in you’ll see the main E&P Portal page:
Figure 13 . Main page of the E&P Portal

E&P Portal. Case Study Enhancements Tracking
Copyright © Akadem Petroleum Technology Inc. Exploration and Production Portal, 2018 13
Check the units in the page footer to be “Field”.
Figure 14. Field units in the main page footer
Check the current database in the page footer to be “EP Demo”.
Figure 15. Current database in the main page footer
Now you are ready to start entering the data into the E&P Portal

E&P Portal. Case Study Enhancements Tracking
Copyright © Akadem Petroleum Technology Inc. Exploration and Production Portal, 2018 14
Adding the “Huron” field
In the left menu open the “Fields” page of the “Subsurface” module:
Figure 16. Fields page of subsurface module of the E&P Portal
Click “Create Field”, fill the form as follows and click “Create”:
Figure 17. Creating the “Huron” field in the E&P Portal
Now you have successfully added the “Huron” field to the E&P Portal:

E&P Portal. Case Study Enhancements Tracking
Copyright © Akadem Petroleum Technology Inc. Exploration and Production Portal, 2018 15
Adding the Huron pad “1”
In the left menu open the “Fields” page of the “Subsurface” module and click “Pad”:
Figure 18.Pad page of subsurface module of the E&P Portal
Click “Create Pad”, fill the form as follows and click “Create”:
Figure 19. Creating the pad “1” in the E&P Portal
Now you have successfully added the pad “1” field to the E&P Portal:
E&P Portal. Case Study Enhancements Tracking
Copyright © Akadem Petroleum Technology Inc. Exploration and Production Portal, 2018 16
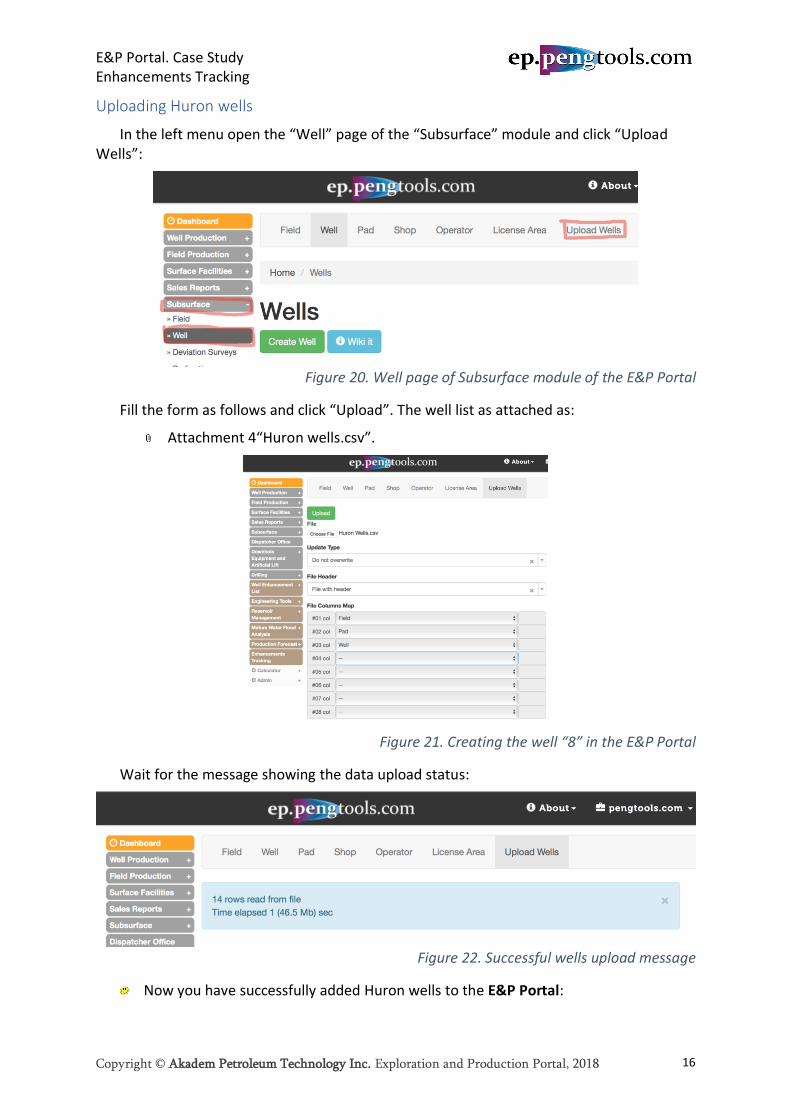
Uploading Huron wells
In the left menu open the “Well” page of the “Subsurface” module and click “Upload Wells”:
Figure 20. Well page of Subsurface module of the E&P Portal
Fill the form as follows and click “Upload”. The well list as attached as:
Attachment 4“Huron wells.csv”.
Figure 21. Creating the well “8” in the E&P Portal
Wait for the message showing the data upload status:
Figure 22. Successful wells upload message
Now you have successfully added Huron wells to the E&P Portal:

E&P Portal. Case Study Enhancements Tracking
Copyright © Akadem Petroleum Technology Inc. Exploration and Production Portal, 2018 17
Figure 23. Huron wells in the E&P Portal

E&P Portal. Case Study Enhancements Tracking
Copyright © Akadem Petroleum Technology Inc. Exploration and Production Portal, 2018 18
Upload the Huron wells daily production data
In the left menu open the “Daily Data” page of the “Well Production” module and click “Upload”:
Figure 24. Wells daily data upload page of the E&P Portal
Fill the form as follows and click “Upload”. ells daily production data is attached as:
Attachment 5“Huron wells daily measures.csv”.
Figure 25. Huron wells daily data upload to the E&P Portal
Wait for the message showing the data upload status:
Figure 26. Huron wells daily data upload status message

E&P Portal. Case Study Enhancements Tracking
Copyright © Akadem Petroleum Technology Inc. Exploration and Production Portal, 2018 19
Now you have successfully uploaded Huron wells daily data to the E&P Portal.
Let’s visually inspect the data uploaded for one of the wells. In the top menu click the “Plot”. Fill the filter as follows and click “Search”:
Figure 27. Huron well “9” daily data visualization in the E&P Portal

E&P Portal. Case Study Enhancements Tracking
Copyright © Akadem Petroleum Technology Inc. Exploration and Production Portal, 2018 20
Upload the Huron wells enhancement production forecast data
In the left menu open the “Well” page of the “Production Forecast” module and click “Well Upload”:
Figure 28. Production Forecast upload page of the E&P portal
Fill the form as follows and click “Upload”. The wells production forecast data is attached as:
Attachment 6 “Huron wells production forecast data.csv”.
Figure 29. Huron wells enhancement campaign production forecast upload to the E&P Portal
Wait for the message showing the data upload status:

E&P Portal. Case Study Enhancements Tracking
Copyright © Akadem Petroleum Technology Inc. Exploration and Production Portal, 2018 21
Figure 30. Huron wells enhancement campaign production forecast upload status message
Now you have successfully uploaded Huron wells enhancement production forecast data to the E&P Portal
Figure 31. Huron wells enhancement campaign production forecast in the E&P Portal

E&P Portal. Case Study Enhancements Tracking
Copyright © Akadem Petroleum Technology Inc. Exploration and Production Portal, 2018 22
Upload the Huron wells enhancement campaign data
In the left menu open the “Upload” page of the “Enhancement Tracking” module and click “Upload”:
Figure 32. Enhancement Tracking upload page of the E&P portal
Fill the form as follows and click “Upload”. The wells enhancement data is attached as:
Attachment 7 “Huron wells enhancement data.csv”:
Figure 33. Huron wells enhancement campaign data upload to the E&P Portal
Wait for the message showing the data upload status:

E&P Portal. Case Study Enhancements Tracking
Copyright © Akadem Petroleum Technology Inc. Exploration and Production Portal, 2018 23
Figure 34. Huron wells enhancement campaign data upload status message
Now you have successfully uploaded Huron wells enhancement campaign data to
the E&P Portal
Figure 35. Huron wells enhancement campaign data in the E&P Portal

E&P Portal. Case Study Enhancements Tracking
Copyright © Akadem Petroleum Technology Inc. Exploration and Production Portal, 2018 24
Applying the Enhancement Tracking The well enhancement tracking workflow is:
1. Open the well enhancement page 2. Create the decline model before the enhancement – Base Type Curve 3. Create the decline model after the enhancement – Enhanced Type Curve 4. Inspect the actual IOR vs plan 5. Save the model data 6. Move to the next well enhancement
First well “9” enhancements will be processed as an example.
Then the total enhancement campaign will be analyzed.

E&P Portal. Case Study Enhancements Tracking
Copyright © Akadem Petroleum Technology Inc. Exploration and Production Portal, 2018 25
Well 9 Enhancement Enhancement 1. Converting the flowing well to the ESP
STEP 1: In the left menu open the “Enhancement Tracking” page, scroll down to the table and click “Show Plot” to open the ESP enhancement:
Figure 36. Opening the well “9” ESP enhancement in the E&P Portal
Figure 37 Well “9” ESP enhancement page in the E&P Portal

E&P Portal. Case Study Enhancements Tracking
Copyright © Akadem Petroleum Technology Inc. Exploration and Production Portal, 2018 26
STEP 2&3: Fill the decline model parameters for Base and Enhanced type curves as follows and click Enter.
Figure 38 Well “9” ESP enhancement Base and Enhanced type curves parameters
Figure 39 Well “9” ESP enhancement page with Base and Enhanced decline models
STEP 4: Inspect the IOR results. The incremental oil recovery reached by this enhancement is 192,623 bbl at cost of $45,000 which is 0.23 USD/bbl. The achieved IOR is about 30% less than planned.
Figure 40 Well “9” ESP enhancement IOR results in the E&P Portal
STEP 5: Click “Save Changes” to save the model:
Figure 41 Well “9” Saving the ESP enhancement model in the E&P Portal
Now well “9” ESP Enhancement analysis is complete.

E&P Portal. Case Study Enhancements Tracking
Copyright © Akadem Petroleum Technology Inc. Exploration and Production Portal, 2018 27
Enhancement 2. Fracing the damaged well
STEP 1: In the left menu open the “Enhancement Tracking” page, scroll down to the table and click “Show Plot” to open the Frac enhancement:
Figure 42. Opening the well “9” Frac enhancement in the E&P Portal
Figure 43 Well “9” Frac enhancement page in the E&P Portal

E&P Portal. Case Study Enhancements Tracking
Copyright © Akadem Petroleum Technology Inc. Exploration and Production Portal, 2018 28
STEP 2&3: Fill the decline model parameters for Base and Enhanced type curves as follows and click Enter.
Figure 44 Well “9” Frac enhancement Base and Enhanced type curves parameters
Figure 45 Well “9” Frac enhancement page with Base and Enhanced decline models
STEP 4: Inspect the IOR results. The incremental oil recovery reached by this enhancement is 399,903 bbl at cost of $550,000 which is 1.38 USD/bbl. The achieved IOR is about 50% less than planned.
Figure 46 Well “9” Frac enhancement IOR results in the E&P Portal
STEP 5: Click “Save Changes” to save the model:
Figure 47 Well “9” Saving the Frac enhancement model in the E&P Portal
Now well “9” Frac Enhancement analysis is complete.

E&P Portal. Case Study Enhancements Tracking
Copyright © Akadem Petroleum Technology Inc. Exploration and Production Portal, 2018 29
Enhancement 3. ESP upgrade
STEP 1: In the left menu open the “Enhancement Tracking” page, scroll down to the table and click “Show Plot” to open the ESP upgrade enhancement:
Figure 48. Opening the well “9” ESP upgrade enhancement in the E&P Portal
Figure 49 Well “9” ESP upgrade enhancement page in the E&P Portal

E&P Portal. Case Study Enhancements Tracking
Copyright © Akadem Petroleum Technology Inc. Exploration and Production Portal, 2018 30
STEP 2&3: Fill the decline model parameters for Base and Enhanced type curves as follows and click Enter.
Figure 50 Well “9” ESP upgrade enhancement Base and Enhanced type curves parameters
Figure 51 Well “9” ESP upgrade enhancement page with Base and Enhanced decline models
STEP 4: Inspect the IOR results. The incremental oil recovery reached by this enhancement is 87,814 bbl at cost of $75,000 which is 0.85 USD/bbl. The achieved IOR is about 80% less than planned.
Figure 52 Well “9” ESP upgrade enhancement IOR results in the E&P Portal
STEP 5: Click “Save Changes” to save the model:
Figure 53 Well “9” Saving the ESP upgrade enhancement model in the E&P Portal
Now well “9” ESP Upgrade Enhancement analysis is complete.

E&P Portal. Case Study Enhancements Tracking
Copyright © Akadem Petroleum Technology Inc. Exploration and Production Portal, 2018 31
Well 9 enhancement summary Displaying all well enhancements on one plot
In the left menu open the “Enhancement Tracking” page, scroll down to the table and click “Show Plot” to open the ESP upgrade enhancement:
Figure 54. Opening the well “9” ESP upgrade enhancement in the E&P Portal
In the filter check “Select all” box and click “Submit”
Figure 55. Selecting all well “9” enhancements in the filter in the E&P Portal
Inspect all the well enhancements:
Figure 56. All well “9” enhancements on a single plot in the E&P Portal

E&P Portal. Case Study Enhancements Tracking
Copyright © Akadem Petroleum Technology Inc. Exploration and Production Portal, 2018 32
Displaying all well enhancements results
In the left menu open the “Enhancement Tracking” page, scroll down to the table and select “Huron” filed in the field column filter and well “9” in the well column filter:
Figure 57. Selecting well “9” enhancements in the filter
The enhancement analysis results are displayed in the left part of the table:
Figure 58. Well “9” enhancement analysis results in the E&P Portal
The total well incremental oil recovery reached by all well enhancements is 680,340 bbl at total cost of $670,000 which is 0.98 USD/bbl. The achieved IOR is about 60% less than planned.
Scroll up to inspect the well “9” Scorpion Plot:
Figure 59. Well “9” Scorpion Plot in the E&P Portal

E&P Portal. Case Study Enhancements Tracking
Copyright © Akadem Petroleum Technology Inc. Exploration and Production Portal, 2018 33
Enhancement campaign analysis
Scorpion Plot (Figure 60) and Enhancements table (Figure 61) are used to analyze the enhancement campaign after all wells enhancements are processed through the Enhancement Tracking workflow.
Below the following questions are answered:
• What is the campaign total incremental oil recovery (IOR) vs total cost? • Which enhancement campaign has better $/bbl performance? • Which well has better $/bbl performance?
Figure 60. Enhancement Tracking page. Scorpion Plot in the E&P Portal
Figure 61. Enhancement Tracking page. Enhancements table in the E&P Portal

E&P Portal. Case Study Enhancements Tracking
Copyright © Akadem Petroleum Technology Inc. Exploration and Production Portal, 2018 34
What is the campaign total IOR vs total cost?
In the left menu open the “Enhancements” page of the “Enhancement Tracking” module. Scorpion Plot and enhancement table will be displayed on the page.
Set the “Group By” setting to “Field” at the bottom of the plot.
Figure 62. Huron field Scorpion Plot in the E&P Portal
The total campaign IOR is 4,022,246 bbl at total cost of $ 3,141,101 which is 0.78 USD/bbl. The achieved IOR is about 45% less than planned.

E&P Portal. Case Study Enhancements Tracking
Copyright © Akadem Petroleum Technology Inc. Exploration and Production Portal, 2018 35
Which enhancement campaign has better $/bbl performance?
In the left menu open the “Enhancements” page of the “Enhancement Tracking” module. Scorpion Plot and enhancement table will be displayed on the page.
Set the “Group By” setting to “Enhancement Type” at the bottom of the plot.
Figure 63. Huron field Scorpion Plot grouped by Enhancement Type in the E&P Portal
The enhancement campaign performance is:
Campaign IOR, bbl Cost, USD Performance USD/bbl
Choke Open 232,985 6,101 0.03
ESP 2,322,443 655,000 0.28
Frac 1,466,819 2,480,000 1.69
Total 4,022,247 3,141,101 0.78 Table 2 . Enhancement campaign performance
The Choke Open campaign has the lowest cost per added bbl, however it produced only 5% of the total IOR.
The ESP campaign produced about 60% of the total IOR.

E&P Portal. Case Study Enhancements Tracking
Copyright © Akadem Petroleum Technology Inc. Exploration and Production Portal, 2018 36
Which well has better $/bbl performance?
In the left menu open the “Enhancements” page of the “Enhancement Tracking” module. Scorpion Plot and enhancement table will be displayed on the page.
Set the “Group By” setting to “Well” at the bottom of the plot.
Figure 64. Huron field Scorpion Plot grouped by well in the E&P Portal
The wells performance is:
Well IOR, bbl Cost, USD Performance USD/bbl
5 1,149,671 145,001 0.13 6 634,870 116,000 0.18 3 704,618 350,000 0.50 4 566,912 340,100 0.60 9 680,340 670,000 0.98 8 21,328 25,000 1.17 14 342,615 510,000 1.49 11 8,474 600,000 70.80 13 (5,232) 35,000 -6.69 10 (81,349) 350,000 -4.30 Total 4,022,247 3,141,101 0.78
Table 3 . Wells enhancement performance

E&P Portal. Case Study Enhancements Tracking
Copyright © Akadem Petroleum Technology Inc. Exploration and Production Portal, 2018 37
Saving and exporting the analysis results In the left menu open the “Enhancements” page of the “Enhancement Tracking”
module. Scroll down to the enhancement table.
Click to the export button on the top right corner of the table and select the output format you want the data in:
Figure 65. Exporting the enhancements table from the E&P Portal
Open the downloaded file “epDataExport.xlsx”:
Figure 66. Exported enhancements table in Excel spreadsheet
The exported file is attached as:
Attachment 8 “epDataExport.xlsx”.
Now enhancement data is successfully exported.

E&P Portal. Case Study Enhancements Tracking
Copyright © Akadem Petroleum Technology Inc. Exploration and Production Portal, 2018 38
Conclusions This Case Study demonstrated application of the Enhancement Tracking workflow to
track and evaluate the benefits of executed enhancements using the E&P Portal.
A step by step guide was presented to assist users along the way of using the E&P Portal and Enhancement Tracking workflow.
The following steps were covered:
• Input the required data to the E&P Portal; • Apply the Enhancement Tracking workflow to track and benchmark enhancements; • Save and export the analysis results.
As usual, data preparation and upload step took the most time an effort, while the analysis part once data is processed was relatively easy and quick.
Imagine the power of the E&P Portal then data continually flows to the system for the hundreds and thousands of wells and ready for the analysis like the Enhancement Tracking in the live mode!
With the help of the E&P Portal you can quickly analyze the big number of wells saving the engineering time while increasing the well’s and field’s production and company’s revenues.

E&P Portal. Case Study Enhancements Tracking
Copyright © Akadem Petroleum Technology Inc. Exploration and Production Portal, 2018 39
References Martins, J. P., MacDonald, J. M., Stewart, C. G., & Phillips, C. J. (1995). The Management and
Optimization of a Major Wellwork Program at Prudhoe Bay. Society of Petroleum Engineers, SPE-30649-MS.
Nguyen, D. (2006). Improving Performance Management in TNK-BP. Innovator, TNK-BP Technology Magazine(12), 22-24.
Attachments • Attachment 1“Huron 9 Pump Design Report.pdf”. ........................................................... 9 • Attachment 2“Huron 9 Frac Design Report.pdf”. ............................................................ 10 • Attachment 3“Huron 9 ESP upgrade Report.pdf”. .......................................................... 11 • Attachment 4“Huron wells.csv”. ..................................................................................... 16 • Attachment 5“Huron wells daily measures.csv”. ............................................................ 18 • Attachment 6 “Huron wells production forecast data.csv”. ........................................... 20 • Attachment 7 “Huron wells enhancement data.csv”: ..................................................... 22 • Attachment 8 “epDataExport.xlsx”. ................................................................................. 37


