Wastewater Stabilization Ponds (WSP) for Wastewater Treatment

Case study: Design of VEAS Wastewater Treatment Works
at Oslo of Norway and other Norwegian plants built underground
Prof. em. Hallvard Ø degaard
NTNU/SET [email protected]

Where is Norway, Oslo and VEAS WWTP

VEAS - the history
• 1970'ies - Discussions on location and process for VEAS WWTP for prevention of eutrophication of the Oslo fjord
• 1982 – 1995 Direct precipitation plant (CEPT) built inside rock caverns• 1989 – Nitrification required and retrofit with new compact CEPT settling
tanks • 1990 – New standard : N-removal required• 1991 – 1995 Retrofitting planned and executed, targeting N- removal, without
footprint expansion. • 1993 - Digestors in operation • 1996 – N-removal in operation
– Wastewater process:• CEPT• Nitrification/post-denitrification in biofilters
– New sludge treatment facilities:• Mechanical thickeners installed• Ammonium stripping on sludge water (1997)
• 2003 Filterpress retrofitted for thermal vacuum drying• 2008 – New stormwater-plant based on Actiflo in operation


The rock cavern system
• Plant designed for 4.8 m3/sec
• 8 parallel lines
• 6 lines of N-removal in BAF's• 2.6 – 2.8 m3/sec
• 2 lines of CEPT (stormwater)Deep sludge blanket lamellasettling tanks
• New stormwater plant (RVR)based on Actiflo
• The tunnel represents a reservoir of 150-200.000 m3

Flow sheet of existing plant
Coagulant
Inlet
Screens
Washwater
Polymer
Gritremoval
SettlingTank
SieveNitrification
filterDenitrification
filterOutlet
Washwater tankTrash picker
Internal recycles
Polymer
Sludgethickener
Sludgeholding
tank
Lime
Vacuumfilterpress/dryer
Ammonium stripperMethanol
HNO3
NH4NO3
Air
SludgeWater
Constructed soil
Trashpicker
Air
SludgeWater

07.05.2004
K
u
n
kj
e
m
i
K
u
n
kj
e
m
i
Prøvetaking
innløp 2 st
Prøvetaking utløp, 8 st
Prøvetaking
RVR, 3 st
Overview of basin halls and flow path

Overview – Flows at VEAS, 2008-2012
2012:• Treated water : 105.106 m3
(99,2 %)
• In main plant : 99.106 m3
(94,0 %)o Biol/chem : 90,3 .106 m3
(86,0 %)o Chem (CEPT): 8,7.106 m3
(8,2 %)
• In RVR : 5,6 .106 m3
(86,0 %)o Chemical : 4,2.106 m3
(4,0 %)o Mechanical : 1,4.106 m3
(rist) (1,3 %)
• Untreated overfl. 0,93 .106 m3
(in tunnel system) (0,9 %)
Main plant
RW plant Overflow

Supplied and treated wastewater flows
Q50% = 2,8 m3/sec , Q90% = 5,9 m3/sec, Q95% = 7,3 m3/sec, Q99% = 9,0 m3/sec
l/sec
50 % 90 % 99 %
Max. cap.bio- step
Max. cap.main plant
Max. cap.incl. RVR
Absolute max. cap. at rainstorm
Supplied 2011 Sum treated 2011

Overall treatment results 2011
SS mg/l
BOD mg/l
TOCmg/l
Tot Pmg/l
Tot Nmg/l
NH4-Nmg/l
TOFdypv
mg O2/l
VEAS, 2011 10,5 8,4 15 0,26 7,7 4,4 39,5
VEAS, 2030 5 4 8 0,10 3,0 1,0 15,3
% reduksjon 2011-2030 52 52 40 61 61 75 58
Planning for 2030

Screening

Coagulant addition

A = 278 m2
D = 10,5 mA = 4 x 87 = 348 m2
D = 5 m (til filterbunn)
6,0 m
15,7 m
Sed
N1
N4N2
N3
14,7 m17,7 m 4,4 m 14,7 m 12,7 m
Maskin rom
3,7 m
DN1
DN2
DN3
DN3
10,75 m
Rentvannsbass.
10,75 m
A = 4 x 65 = 260 m2
D = 4,4 m til filterbunn)A = 200 m2
D = 6 m

The deep CEPT settling tank
Number of tanks: 6 Brutto area: • Per tank: 278 m2 (15,7 m x 17,7 m) • Total: 1668 m2
Depth: 10,5 m (12 m fra center bottom to surface)
Lamellas:• Length: 71,5 cm• Distance between: 12,5 cm• Angle: 60°Surface overflow rate• Daily operation : 4.5 – 7 m/h• Peak flow: max 12 m/hSludge conc. Out : 3.5 % DS

Similar tank at Høvringen WWTP, Trondheim
Number of tanks: 4
Size: • Area : 225 m2
• Volume: 2025 m3• B/W: 15 x 15 m • Depth: 9 m
Overflow rate, • 5,0 m/h at Qdim
• 7,8 m/h at Qmaksdim
Overflow rate on projectd area • 0,6 m/h at Qdim• 0,9 m/h at Qmaksdim
• Submerged overflow pipes
• Bottom scraper

SS versus turbidity – VEAS Sed8To
tal s
usp
eb
de
dso
lids
(TSS
), m
g/l
Turbidity, FTU

Separation performance
Surface overflow rate, m/h
Turb
idit
y, F
TU
Sludge surface rate, kg TSS/m2d
TSS
in e
fflu
en
t, m
g/l
NH4-N in effluent, mg N/l
Turb
idit
y, F
TU
TSS in inlet water, mg/l
TSS
in e
fflu
en
t, m
g/l

• Upflow BAF
• Co-current, intermittent backwash
• Expanded clay or expanded shale media– 3.5 or 4.5 mm round– 2.7 mm angular
• Even water and air distribution
• High velocities
• Need good screening upstream
The nitrification filters - BIOFOR

The nitrification filters
Number of filter cells: 24 (4 x 6)Each filter• Area : 87 m2 (14,7m x 6 m)• Filter volume: 330 m3
Water depth: 6,6 m• Depth above filter bottom: 5,2 m• Gravel depth: 0,3 m• Filter depth: 3,8 m• Depth above filter: 1,1 m

Biofilter loading rate vs temperatureLo
adin
gra
te g
NH
4-N
/m3d
Temperature, oC

Nitrification removal vs loading rateN
itri
fica
tio
nra
te,
g N
H4-N
/m3d
Ammonium load , g NH4-N/m3d

Nitrification rate vs temperature
Ѳ = 1.035
Nit
rifi
cati
on
rate
, g
NH
4-N
/m3d
Temperature, oC

Influence of particle loading
Nit
rifi
cati
on
rate
, g
NH
4-N
/m3d
Particle loading, gTSS/m3d N
itri
fica
tio
nra
te,
g N
H4-N
/m3d
Particle loading, g TSS/g NH4-N
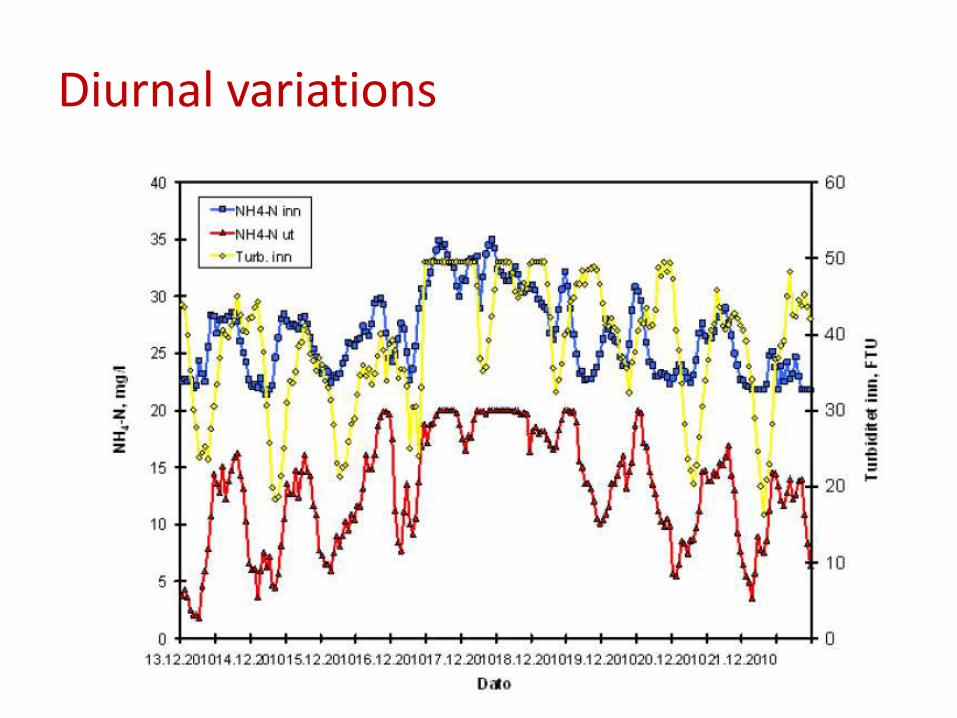
Diurnal variations

DO out of filters vs temperatureD
O o
ut
of
filt
er,
g O
2/m
3
Temperature, oC

The denitrification filters
Number of filter cells: 24 (4 x 6)Each filter• Area : 65 m2 (10,8m x 6 m)• Filtervolume: 195 m3
Water depth: 5,5 m• Depth above filter bottom: 4,4 m• Gravel depth: 0,3 m• Filter depth: 3,0 m• Depth above filter: 1,1 m
Methanol addition:
Phosphorous addition when: PO4-P < 0,2 mg/l
3,0
1,1
0,3
1,4

Denitrification rate vs temperature - all filtersD
en
itri
fica
tio
nra
te,
g N
Ox
-N/m
3d
Temperature, oC

Denitrification rate vs temperature
Ѳ = 1.01 based onNOx- Nequiv.
Ѳ = 1.01 based onNOxN
Temperature, oC
De
nit
rifi
cati
on
rate
, g
NO
x –N
equ
iv./
m3d
o
r g
NO
x -N
/m3d

DN-rate versus NOx-N loading rate
Average denitrification rate (1.3.2010 – 1.7. 2011): 715 g NOx-N/m3filter
. d
De
nit
rifi
cati
on
rate
, g
NO
x -N
/m3d
Loading rate, g NOx -N/m3d

Methanol dosage – as C/N values

How it looks inside the rock cavern

Using lining fabrics to make work-placepleasant – from RVR

The plant positioning inside caverns

Future expansions


Høvringen WWTP, Trondheim
- Qave = 96. 000 m3/d
- Qdim = 4 500 m3/h
- Qmaksdim= 7 000 m3/h
- Qmaks = 15 000 m3/h
- Max observed = 17 000 m3/h


Number of tanks: 4
Size: • Area : 225 m2
• Volume: 2025 m3• B/W: 15 x 15 m • Depth: 9 m
Overflow rate, • 5,0 m/h at Qdim
• 7,8 m/h at Qmaksdim
Overflow rate on projected area • 0,6 m/h at Qdim• 0,9 m/h at Qmaksdim
• Submerged overflow pipes
• Bottom scraper
Deep CEPT settling tank at Høvringen WWTP, Trondheim

NRA WWTP (outside Oslo, Norway)
Inlet
Screens
Sand and fat removal
Pre-settling
Post-settling
Biological treatment
Sludge treatment
Sludge storage

The Moving Bed Biofilm Reactor (MBBR) in practice

MBBR in glasfiber re-inforced plastic
Bucher filter press

NRA WWTP
- Qave = 45. 000 m3/d
- Qdim = 2.000 m3/h
- Qmaksdim= 5. 000 m3/h
- Max observed = 8.000 m3/h

• 35-40% of all wastewater from Oslo, treated at Bekkelaget WWTP
• Plant put in operation in 2000
• Owned by the City of Oslo, operated by the private company Bekkelaget Water inc. (BEVAS)
• Approximate 280.000 pe
• Average daily flow ~100.000 m3/d
• Average design flow: 125.000 m3/d
• Outlet requirements:P-removal > 90%N-removal > 70%(including overflow)
• Sludge production ~5.800 tons DS/year
BEVAS WWTP, Oslo, Norway
VEAS
BEVAS

Rock caverns
Admin. building

Water and sludge treatment process
Buffertank
BufferSilo
Silo
Dewatering
Thickener
DigesterDigester
OverflowMagasin~35.000m3
4000 l/s < Q < 6000 l/s
Sand, grit and screenings FeSO4
PAX-18
Activated sludgeClarifierPrimary Filter
Primary sludge
Bio sludge
PrecipitationPrimary
1900 l/s<Q< 4000 l/s
Q=1900 l/s
PAX-18
Q<1900 l/s

Overview of underground plantWater treatment
1. Inlet tunnel
2. Screens, sand and grit removal
3. Primary settling/ direct precipitation
4. Bio step, activated sludge
5. Clarifiers
6. deAmmon®
7. Sand filters
Sludge treatment
8. Digesters
9. Sludge treatment
10. Sludge treatment
11. Ventilated air treatment – odor control
212 m

Bakgrunn og rammer
Overview of plantExpansion in yellow
Underground area: 40.000 m2 todayLength of rock cavern: 212 mWidth of rock cavern: 22 m