
CASE STUDY – ANALYSIS OF AQUIFER … STUDY – ANALYSIS OF AQUIFER EFFECTS DURING LARGE SCALE...
19
CASE STUDY – ANALYSIS OF AQUIFER EFFECTS DURING LARGE SCALE AGRICULTURAL PUMPING Joseph B. Turner 1 , Chief Hydrogeologist Timothy Godwin 2 , Senior Hydrogeologist Paul Gosselin 3 , Director Dr. Andrew Kopania 4 , President and Principal Hydrogeologist ABSTRACT The Lower Tuscan Aquifer (LTA) Monitoring, Recharge, and Data Management Project is funded by a Proposition 50 Grant awarded by the California Department of Water Resources (DWR) and managed by Butte County Department of Water and Resource Conservation (BCDWRC). The primary objective of the project is to collect and analyze technical data through development of innovative analytical investigative tools to further the scientific understanding of the LTA system. A key component of the overall project was the development of cost effective methods to assess effects and interactions of the groundwater aquifer during the agricultural pumping season. Aquifer tests were conducted during various agricultural pumping schemes. Through innovative instrumentation of pumping wells and groundwater monitoring wells, we were able to collect operational, flow, and drawdown data from more than 20 wells during individual tests that could be used for both qualitative and quantitative analysis of the aquifer systems. Qualitative analysis of drawdown curves provided significant insights into the interactions between stratigraphically adjacent aquifer systems as well as aquifer stresses resulting from various agricultural pumping schemes. Selected drawdown curves were sufficient for quantitative curve matching analysis for estimating aquifer properties. The results of these tests provided valuable insights for additional data needs and design of future tests to provide a comprehensive, defendable characterization of the LTA to assist BCDWRC’s management and protection of this important regional asset. The methodology that provides interpretations from routine irrigation practices can also be useful for the agricultural industry and irrigation districts concerned with reliable water supply and quality control and resource management. INTRODUCTION The Sacramento Valley groundwater basin lies between the Coast Ranges to the west, the Cascade and Sierra Nevada Ranges to the east and extends from the City of Red Bluff in the north to the Delta in the south, covering 4,900 square miles. Among the principal water bearing units in the Sacramento Valley portion of Butte County is the Tuscan Formation that has been divided into four units, from deepest to shallowest, designated Units A through D (Helley and Harwood, 1985). Units A and B are reported to contain 1 Brown and Caldwell, 10540 White Rock Road, Rancho Cordova, CA 95670, [email protected] 2 Brown and Caldwell, 10540 White Rock Road, Rancho Cordova, CA 95670, [email protected] 3 BCDWRC, 308 Nelson Avenue, Oroville, CA 95965, [email protected] 4 EMKO Environmental, 551 Lakecrest Drive, El Dorado Hills, CA 95762-3772, [email protected]
Transcript of CASE STUDY – ANALYSIS OF AQUIFER … STUDY – ANALYSIS OF AQUIFER EFFECTS DURING LARGE SCALE...

CASE STUDY – ANALYSIS OF AQUIFER EFFECTS DURING LARGE SCALE AGRICULTURAL PUMPING
Joseph B. Turner1, Chief Hydrogeologist Timothy Godwin2, Senior Hydrogeologist
Paul Gosselin3, Director Dr. Andrew Kopania4, President and Principal Hydrogeologist
ABSTRACT
The Lower Tuscan Aquifer (LTA) Monitoring, Recharge, and Data Management Project is funded by a Proposition 50 Grant awarded by the California Department of Water Resources (DWR) and managed by Butte County Department of Water and Resource Conservation (BCDWRC). The primary objective of the project is to collect and analyze technical data through development of innovative analytical investigative tools to further the scientific understanding of the LTA system. A key component of the overall project was the development of cost effective methods to assess effects and interactions of the groundwater aquifer during the agricultural pumping season. Aquifer tests were conducted during various agricultural pumping schemes. Through innovative instrumentation of pumping wells and groundwater monitoring wells, we were able to collect operational, flow, and drawdown data from more than 20 wells during individual tests that could be used for both qualitative and quantitative analysis of the aquifer systems. Qualitative analysis of drawdown curves provided significant insights into the interactions between stratigraphically adjacent aquifer systems as well as aquifer stresses resulting from various agricultural pumping schemes. Selected drawdown curves were sufficient for quantitative curve matching analysis for estimating aquifer properties. The results of these tests provided valuable insights for additional data needs and design of future tests to provide a comprehensive, defendable characterization of the LTA to assist BCDWRC’s management and protection of this important regional asset. The methodology that provides interpretations from routine irrigation practices can also be useful for the agricultural industry and irrigation districts concerned with reliable water supply and quality control and resource management.
INTRODUCTION The Sacramento Valley groundwater basin lies between the Coast Ranges to the west, the Cascade and Sierra Nevada Ranges to the east and extends from the City of Red Bluff in the north to the Delta in the south, covering 4,900 square miles. Among the principal water bearing units in the Sacramento Valley portion of Butte County is the Tuscan Formation that has been divided into four units, from deepest to shallowest, designated Units A through D (Helley and Harwood, 1985). Units A and B are reported to contain
1 Brown and Caldwell, 10540 White Rock Road, Rancho Cordova, CA 95670, [email protected] 2 Brown and Caldwell, 10540 White Rock Road, Rancho Cordova, CA 95670, [email protected] 3 BCDWRC, 308 Nelson Avenue, Oroville, CA 95965, [email protected] 4 EMKO Environmental, 551 Lakecrest Drive, El Dorado Hills, CA 95762-3772, [email protected]

the majority of the groundwater in the Tuscan Formation and are referred to as the Lower Tuscan Aquifer (LTA). Due to limited regional utilization of this resource in the past, information available to assess how the aquifer system might respond to increased utilization, and what impacts increased utilization may have on other water users, recharge sources, recharge areas, and the environment was scarce. County of Butte, in cooperation with a Four County Group (Butte, Glenn, Colusa, and Tehama) applied for and was awarded grant funds from the California Department of Water Resources through Proposition 50 to conduct the LTA Monitoring, Recharge and Data Management Project. The three year project is being managed by the Butte County Department of Water and Resource Conservation (BCDWRC). The primary objective of the LTA project is to collect and analyze technical data through development of innovative analytical investigative tools to further the scientific understanding of the LTA system. A key component of the overall project was the development of cost effective methods to assess effects and interactions of the groundwater aquifer during the agricultural pumping season. This paper presents the results of aquifer tests conducted for the LTA project during various agricultural pumping schemes under routine irrigation practices (flood irrigation, intermittent pumping used for drip and spray irrigation of orchards). Through innovative, cost effective instrumentation of production wells and groundwater monitoring wells, we were able to effectively monitor aquifer effects and interactions. Using appropriately placed monitoring wells with accurate geologic information, drawdown curves produced for the project were also sufficient for quantitative curve matching analysis for estimating aquifer properties of the LTA. Aquifer tests were successfully conducted in areas where more than twenty irrigations wells were operating periodically throughout tests. The results of this project demonstrated the valuable insights that can be obtained for aquifer systems during normal operations of agricultural pumping providing agencies, such as the BCDWRC, comprehensive, defendable characterizations to assist management and protection of an important regional asset. Interpretations provided by this type of study can also be useful for the agricultural industry and irrigation districts concerned with reliable water supply, quality control, and resource management.
HYDROSTRATIGRAPHY The Tuscan Formation includes a sequence of variably cemented, interbedded clay, sand, and gravel. This formation consists predominantly of purple volcanic debris flow deposits and interbedded waterlain fluvial deposits rich in volcanic detritus, but in many areas containing crystalline basement-derived clasts and rare tuff beds. The reported occurrence of both channel-lain, clast supported, pebble- and cobble-gravel facies and interbedded volcanic-rich debris-flow facies in this formation suggests that debris flows related to volcanic events episodically choked the ancestral stream/river systems of the area (Blair and others, 1991)

Helley and Hardwood (1985) divided the Tuscan Formation into four hydrostratigraphic units, labeled from deepest to shallowest, A through D. Units A and B define the LTA, the subject of this study, and units C and D define the Upper Tuscan Aquifer. The approximate extent of the LTA within the project boundaries is shown on Figure 1. Helley and Hardwood (1985) also identified several tuffaceous units that were used to separate the hydrostratigraphic units that included the Tuff of Hogback Road (separates Unit D from Unit C), Ishi Tuff Member (separates Unit C from Unit B), and the Nomlaki Tuff Member (base of Unit A).
Figure 1 – Location map of aquifer testing program of the LTA Recharge Project.
Within the northern portion of the project area, outcrops of the LTA consist of classic lahar deposits interbedded with tuff units and fluvial sand and gravels. A lahar is a type of mudflow or debris flow composed of a slurry of pyroclastic material, rocky debris, and water that flows down from a volcano, typically along a river valley. The consistency, viscosity, approximate density and hardness of a lahar are that of concrete. In the southern portion of the project area, outcrops of the LTA consist of distal portions of the Tuscan Formation consisting of reworked materials of the lahar units forming fluvial interbedded clay, sand, and gravel units.

Overlying the Tuscan Formation are numerous Quaternary deposits (Qd). For the LTA project this unit was designated as Qd. This broader definition is employed because the numerous Quaternary formations others have proposed are based on geomorphic or buried-soil information rather than on criteria by which formal formations are distinguished. More importantly, the criteria used by others can not be accurately distinguished in drill cuttings for classification of stratigraphic samples collected during the drilling of monitoring wells for the project. Geologic units underlying the Tuscan Formation within the project area are the Miocene Lovejoy Basalt and Eocene Ione Formation. Some recent investigations have interpreted the presence of a unit referred to as the Upper Princeton Valley Formation. As defined by Redwine (1972), the Princeton Submarine Valley System is a morphological feature of the ancestral Sacramento River Basin and contains the geologic formations described above. For example, the Ione Formation is used by Redwine to separate the lower and upper Princeton Valley fills and the Lovejoy Basalt is interpreted to represent the rim rock of the upper Princeton Valley Fill.
AQUIFER TEST METHODS AND PROCEDURES Three separate aquifer performance tests were conducted for the project using existing production wells connected to irrigation distribution systems (Figure 1). The water extracted was used as part of existing irrigation practices and distributed according to normal operating conditions at each location. Prior to use, each location was reviewed and cleared as part of the Initial Study for the project (Butte County, 2010). The purpose of the aquifer tests is to monitor the LTA’s response to pumping, assess interaction with other aquifers, and to use the data to estimate aquifer parameters. Figures 2, 3, and 4 show close-ups of each of the aquifer test areas including the location of the pumping well(s), primary observation wells, and other known irrigation supply wells. The locations of the aquifer tests were selected to represent areas with distinct lithologic facies differences of the LTA. In the north, the aquifer test was conducted within aquifers formed within the hard cemented lahar units of the Tuscan Formation. In the central portion of the LTA project area, the pump test was conducted within aquifers formed by sand and gravel deposits of the distal portions of the Tuscan Formation overlain by a significant thickness of the Quaternary Deposits. In the south, the pump test was conducted within aquifers formed by sand and gravel deposits of the distal portions of the Tuscan Formation with only a thin layer of Quaternary Deposits but with wells that were screened within the underlying Ione Formation. For the pumping tests conducted in the north (Figure 2) and central portions (Figure 3) of the project, the primary observation wells were installed as part of the LTA project and are designated MW-HP-1 and MW-MT-1, respectively. For the pumping test conducted in the south (Figure 4), the primary observation wells are two existing California Department of Water Resources (DWR) wells, designated as MW-ESQ-1 and MW-ESQ-2.

Figure 2 – Northern LTA Aquifer Test location illustrating monitoring
well and pumping well locations.

Figure 3 – Central LTA Aquifer Test location illustrating monitoring
well and pumping well locations.

Figure 4 – Southern LTA Aquifer Test location illustrating monitoring
well and pumping well locations. Prior to startup of the aquifer tests, the primary pumping wells and observation wells for each test were outfitted with pressure transducers to record water level changes. Pressure transducers used for the aquifer tests were the In Situ Level Troll 500 vented transducers. The vented transducers self correct for barometric changes eliminating the need for a barometer during the tests. Other irrigation wells identified in the vicinity of the tests were outfitted with Ibuttons. These instruments are small (less than 1-inch diameter) and are placed on the discharge pipe of the irrigation well to record temperature changes that can be used to tell when the wells are turned on and off. These data were critical to the overall assessment of each test so that effects of other pumping occurring during the time period of the aquifer tests could be accounted for during analysis of the drawdown curves. Immediately before pumping began, static water levels were recorded for the pumping wells and the primary observation wells using a hand held electric well sounder. Since the pumping wells used for the test are active irrigation wells and were operating under

normal irrigation practices, the pumping rate was already established for the wells. The length of each test ranged from four days to eight days. During the tests, flow rates were measured periodically from each pumping well using a Flexim Fluxus ADM 6725 ultrasonic flow meter. This instrument provides a non-invasive method (no contact with water) to record stable and reliable flow measurements. Flow measurements were also recorded for irrigation wells that operated during the aquifer test period. After the end of each test, recovery was monitored until the residual drawdown was less than 10 percent of the total drawdown or for an equal period as the pumping test, or until an irrigation well was started that affected the recovery data.
DISCUSSION
Most aquifer tests performed for basin studies in groundwater dependent agricultural areas are conducted during the off season because of the belief that the analysis of tests conducted during active irrigation from multiple wells cannot provide data suitable for analysis. Furthermore, the primary objective of these tests is only to provide aquifer parameters, such as transmissivity and storage coefficients, for use in development of groundwater models. The primary objective of this paper is to demonstrate that aquifer tests in groundwater dependent agricultural areas: 1) should be conducted during the pumping season that reflects real time effects on the aquifer; and, 2) include detailed analysis of the shape of the drawdown curves where observed variations from the type curves can provide valuable insights into aquifer characteristics such as barriers (e.g. constant head), leakage through aquitards, and interactions between aquifers. Results of the LTA aquifer tests showed that with minimal costs for instrumentation, accurate data can be obtained to assess the aquifer properties during the agricultural season when numerous pumps are operating at different periods throughout the test. The success of this methodology is dependent upon having production wells that are screened appropriately. In most instances, production wells are screened through multiple aquifers in order to maximize water supply that limits the ability to accurately quantify aquifer properties of an individual aquifer. Another important consideration is having an adequate number and appropriately situated monitoring wells. Finally, the cooperation of landowners is critical to the execution of the study. Analysis of the aquifer tests followed a stepwise process focused on assessing both the characteristics and interactions of the aquifers and calculation of aquifer properties. The first step involved developing a conceptual hydrogeologic model using the lithologic data obtained during the drilling of monitoring wells for the project. A clear understanding of the hydrogeology including identification of geologic formation boundaries is critical to an accurate interpretation of aquifer test data. For the LTA project, the selected drilling method was based on the ability to provide depth discrete lithologic samples and strict protocols were developed to identify geologic units from drill cuttings based on the methods of Blair and others (1991). This detailed geologic information also allowed the placement of screen intervals within specific hydrogeologic zones that provided detailed data on individual hydrogeologic zones and interactions between aquifers during the aquifer tests. Having accurate lithologic data from known well completions also assists

in the interpretation of driller’s logs produced during the installation of pumping wells used for the aquifer tests. After development of the conceptual hydrogeologic model, drawdown curves from the observation and pumping wells were visually assessed prior to calculating aquifer parameters. To calculate aquifer parameters, drawdown curves developed from the aquifer test from pumping wells and observation wells are compared to type curves developed from mathematical solutions of the flow equation. Type curves developed from these methods are based on specific assumptions about the characteristics of the aquifer. For example, the classic Theis solution assumes that the aquifer has infinite areal extent and is homogeneous, isotropic, and of uniform thickness. If the actual aquifer characteristics are distinctly different from these assumptions, then the drawdown curves observed for wells during the test will not match the type curves and aquifer parameters cannot be calculated. However, departures from the type curves can provide important qualitative interpretations of the aquifer characteristics that are essential for construction of future groundwater models developed for the basin as a management tool, design of subsequent aquifer tests, and design and construction of future irrigation and groundwater supply wells. After determining drawdown curves that adequately addressed the assumptions for type curve analysis, aquifer parameters were calculated using the software package AQTESOLV™. This software package also includes several diagnostic tools to assess flow regimes to select the appropriate type curve solution for the data including derivative analyses that are useful for detecting deviations in the rate of displacement change. As discussed in the AQTESOLV™ Version 4.5 User Guide (Duffield, 2007), this technique was introduced by Bourdet and others (1983, 1989) to the petroleum industry as a valuable diagnostic tool that can help identify aquifer responses such as aquifer boundaries, leakage, and delayed gravity response. Spane and Wurster (1993) furthered the use of these analyses for the groundwater industry. A summary of the development of the site conceptual hydrogeologic model and visual assessment of drawdown curves conducted for the LTA project at the three sites listed above is provided below. Based on these analyses, quantitative curve matching was performed to assess aquifer parameters for the zones with drawdown curves that adequately addressed the assumptions for type curve analysis using appropriate common published solutions available in AQTESOLV™. As stated above, a primary objective of this paper is to demonstrate the importance of visually assessing the drawdown curves prior to quantitative analysis and discussions of the quantitative analyses performed for the aquifer are not presented in this paper. Northern LTA Aquifer Test As discussed previously, the aquifer test completed in the northern area of the LTA was conducted in aquifers formed within the hard cemented lahar units of the Tuscan Formation. A generalized geologic cross section developed using the lithologic logs produced from the observation (MW-HP-1) and pumping well (PW-HP-1, Figure 2) for

this test is presented on Figure 6. As seen on this figure, three separate well screens were constructed within the observation well to monitor zones within both the Upper and Lower Tuscan Aquifers. The pumping well is reported to be screened within the same sand zone of the intermediate screen for the observation well between 320 and 340 feet below ground surface (bgs). Based on field observations, the lahar units were expected to have low permeabilities and the three screen intervals were placed within sand and gravel zones separated by significant thicknesses of these units. This design allowed assessment of the interaction between the aquifers and leakage responses through the low permeability lahar units.
Figure 6 – Generalized geologic cross section, Northern Area LTA Aquifer Test. The aquifer test was conducted for approximately 104 hours from June 20, 2011 to June 24, 2011. As indicated above, the pumping well used for the test was connected to an irrigation distribution system and the water extracted was used for normal irrigation (spray irrigation) practices of a walnut orchard. As part of this operation, during the test, several line changes were made to irrigate different portions of the orchard that resulted in changes in the pumping rate. The flow rates for the aquifer test ranged between 800 gallons per minute (gpm) to 1,200 gpm. No other wells operated within the orchard during the test. Figure 7 shows the drawdown curves developed for the three screen intervals within the observation well during the aquifer test. These drawdown curves demonstrate that the intermediate and shallow zones follow common radial flow drawdown patterns while the deep zone does not. The deep zone drawdown curve indicates that this aquifer is not in hydraulic connection with the upper two zones. The drawdown observed from the deep zone well reflects pumping from another well in the area believed to be used for a nearby gravel mine operation (PW-HP-5). Both the intermediate and shallow drawdown curves show a delayed response to the onset of pumping and to changes in the pumping rate during modifications to irrigation of the orchard. However, the shallow zone response
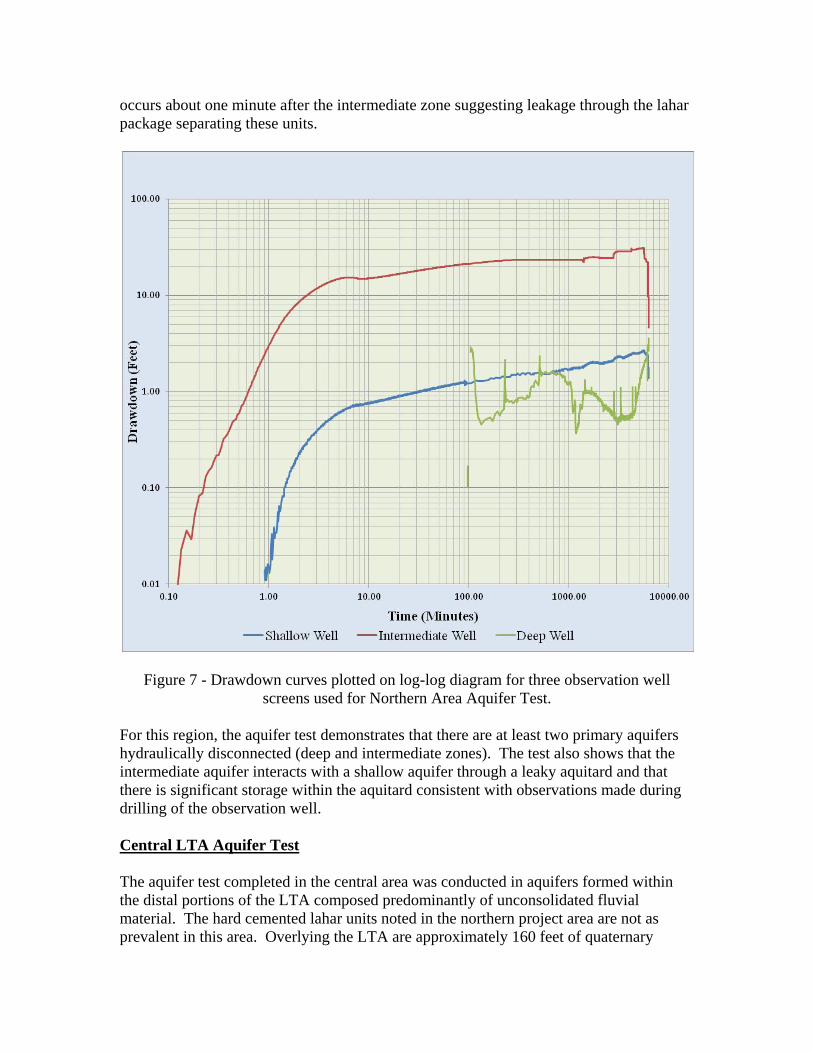
occurs about one minute after the intermediate zone suggesting leakage through the lahar package separating these units.
Figure 7 - Drawdown curves plotted on log-log diagram for three observation well screens used for Northern Area Aquifer Test.
For this region, the aquifer test demonstrates that there are at least two primary aquifers hydraulically disconnected (deep and intermediate zones). The test also shows that the intermediate aquifer interacts with a shallow aquifer through a leaky aquitard and that there is significant storage within the aquitard consistent with observations made during drilling of the observation well. Central LTA Aquifer Test The aquifer test completed in the central area was conducted in aquifers formed within the distal portions of the LTA composed predominantly of unconsolidated fluvial material. The hard cemented lahar units noted in the northern project area are not as prevalent in this area. Overlying the LTA are approximately 160 feet of quaternary

deposits formed by the ancestral movement of the Sacramento River system. A generalized geologic cross section developed using the lithologic logs produced from the observation (MW-MT-1) and pumping well (PW-MT-1) for this test is presented on Figure 8. Three separate well screens were constructed within the observation well to monitored zones within both the Upper and Lower Tuscan Aquifers. The pumping well, PW-MT-1 (Figure 3), is reported to be screened within the same sand zone of the shallow screen for the observation well between 280 and 400 feet bgs. The intermediate well screen was placed within the lower permeable fine grain units between the aquifers screened by the shallow and deep well screens. This design allowed assessment of the interaction between the aquifers and a more detailed assessment of leakage responses through the low permeability units.
Figure 8 – Generalized geologic cross section, Central Area LTA Aquifer Test.

The aquifer test was conducted for approximately 105 hours from July 11, 2012 to July 15, 2012. The pumping well used for the test was connected to an irrigation distribution system and the water extracted was used for normal irrigation (drip irrigation) practices of an almond orchard. As with the northern area aquifer test, several line changes were made to irrigate different portions of the orchard that resulted in changes in the pumping rate during the test. The flow rates for the aquifer test ranged between 1,615 gpm to 1,850 gpm. Two other wells operated during the test, PW-MT-3 located approximately 0.4 miles west of the pumping well and PW-MT-2 located approximately 1 mile north-northeast of the pumping well (Figure 3). PW-MT-3 operated for approximately 43 hours from June 12, 2012 to June 14, 2012 at rates ranging from 1,602 gpm to 1,690 gpm. PW-MT-2 operated for approximately 27 hours from July 11, 2012 to July 12, 2012 and 28 hours from July 14, 2012 to the end of the test on July 15, 2012. The pumping rate for PW-MT-2 averaged about 1,590 gpm. The two other wells monitored during the test, PW-MT-4 and PW-MT-5 (Figure 3) did not operate during the test. Figure 9 shows the drawdown curves developed for the three screen intervals within the observation well during the aquifer test. These drawdown curves demonstrate that all three zones follow common radial flow drawdown patterns. The shallow well drawdown curve shows a slight delayed response (within 10 seconds) to the onset of pumping, changes in the pumping rate during modifications to irrigation of the orchard, and the turning on and off of PW-MT-3. Both the intermediate and deep well drawdown curves also show a delayed response but the first response is a rise in water level at approximately 2 minutes after the onset of pumping. This response cannot be seen on Figure 9 that plots drawdown on a logarithmic scale (negative numbers do not plot on logarithmic scales). To illustrate the rise in water levels, Figure 10 presents the drawdown curves for the intermediate and deep wells plotted on a semi-log plot with drawdown on a linear scale. The effect of rising water levels in response to pumping was first recognized by Verruijt (1969) who concluded that the reverse well fluctuations occurred because pumping instantly compressed the aquifer to force water up the well. Verruijt (1969) referred to this response as the Noordbergum effect. Kim and Parizek (1997) showed that for a three-layer aquifer system composed of two permeable aquifers separated by a semi-impermeable aquitard such as observed at the site, the Noordbergum effect is caused by two mechanisms: a faster mechanical propagation (deformation) of the pumping stress than its hydraulic propagation (drawdown) from the pumped aquifer into the adjacent aquitard and unpumped aquifer due to relatively lower hydraulic conductivity of the aquitard, and a mechanical amplification (excessive compression) in the lower part of the relatively soft aquitard. For this region, the aquifer test demonstrates that there are at least two primary aquifers hydraulically connected (shallow and deep zones) and that there is significant storage within the aquitard separating these zones.

Figure 9 - Drawdown curves plotted on log-log diagram for three
observation well screens used for Central Area Aquifer Test.
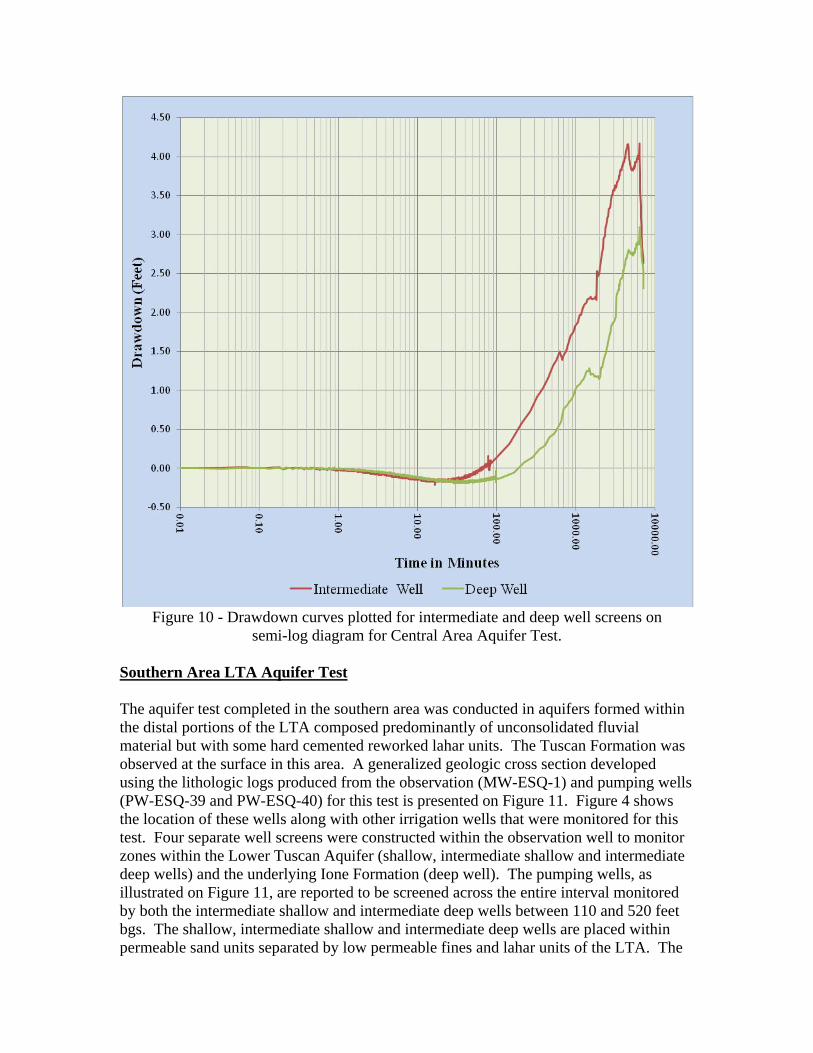
Figure 10 - Drawdown curves plotted for intermediate and deep well screens on
semi-log diagram for Central Area Aquifer Test. Southern Area LTA Aquifer Test The aquifer test completed in the southern area was conducted in aquifers formed within the distal portions of the LTA composed predominantly of unconsolidated fluvial material but with some hard cemented reworked lahar units. The Tuscan Formation was observed at the surface in this area. A generalized geologic cross section developed using the lithologic logs produced from the observation (MW-ESQ-1) and pumping wells (PW-ESQ-39 and PW-ESQ-40) for this test is presented on Figure 11. Figure 4 shows the location of these wells along with other irrigation wells that were monitored for this test. Four separate well screens were constructed within the observation well to monitor zones within the Lower Tuscan Aquifer (shallow, intermediate shallow and intermediate deep wells) and the underlying Ione Formation (deep well). The pumping wells, as illustrated on Figure 11, are reported to be screened across the entire interval monitored by both the intermediate shallow and intermediate deep wells between 110 and 520 feet bgs. The shallow, intermediate shallow and intermediate deep wells are placed within permeable sand units separated by low permeable fines and lahar units of the LTA. The
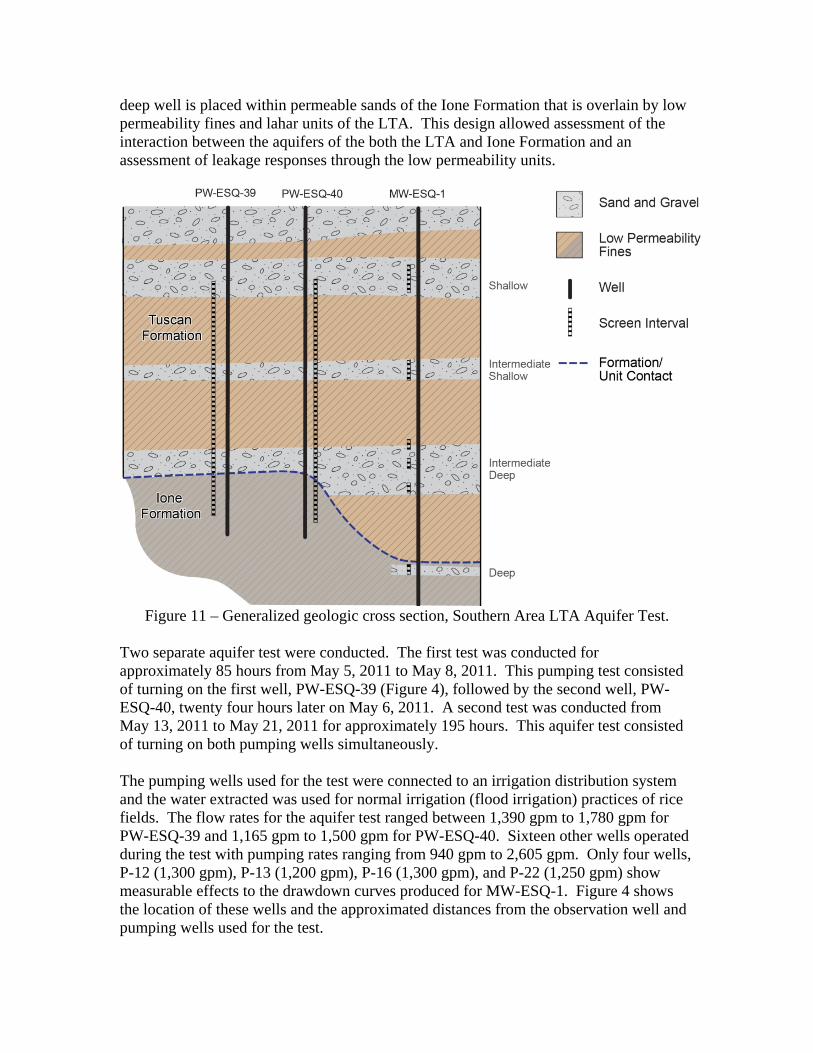
deep well is placed within permeable sands of the Ione Formation that is overlain by low permeability fines and lahar units of the LTA. This design allowed assessment of the interaction between the aquifers of the both the LTA and Ione Formation and an assessment of leakage responses through the low permeability units.
Figure 11 – Generalized geologic cross section, Southern Area LTA Aquifer Test.
Two separate aquifer test were conducted. The first test was conducted for approximately 85 hours from May 5, 2011 to May 8, 2011. This pumping test consisted of turning on the first well, PW-ESQ-39 (Figure 4), followed by the second well, PW-ESQ-40, twenty four hours later on May 6, 2011. A second test was conducted from May 13, 2011 to May 21, 2011 for approximately 195 hours. This aquifer test consisted of turning on both pumping wells simultaneously. The pumping wells used for the test were connected to an irrigation distribution system and the water extracted was used for normal irrigation (flood irrigation) practices of rice fields. The flow rates for the aquifer test ranged between 1,390 gpm to 1,780 gpm for PW-ESQ-39 and 1,165 gpm to 1,500 gpm for PW-ESQ-40. Sixteen other wells operated during the test with pumping rates ranging from 940 gpm to 2,605 gpm. Only four wells, P-12 (1,300 gpm), P-13 (1,200 gpm), P-16 (1,300 gpm), and P-22 (1,250 gpm) show measurable effects to the drawdown curves produced for MW-ESQ-1. Figure 4 shows the location of these wells and the approximated distances from the observation well and pumping wells used for the test.

Figure 12 shows the drawdown curves developed for the four screen intervals within the observation well during the aquifer tests. Unlike the other drawdown curves presented above, this plot is presented on a linear scale to highlight the differences in response between wells. The drawdown curves demonstrate that the two intermediate zones follow common radial flow drawdown patterns. Both of these well drawdown curves show delayed responses to the onset of pumping between 40 minutes (intermediate shallow) and 90 minutes (intermediate deep). Both wells also show responses to the other four pumping wells discussed above. The drawdown curve for the deep well showed a delayed response of approximately 1,000 minutes (16.5 hours) and the shape of the curve suggests that although hydraulically connected, water from this zone has to follow an indirect path to the zone of pumping used for the test. This observation is consistent with the geologic cross section illustrated on Figure 11 that shows this well completed within the Ione Formation beneath fine grained units of the Tuscan Formation and suggests that the sands of the Ione Formation in this area connect with the sands of the Tuscan Formation at a different location. The shallow zone drawdown curve indicates that this aquifer is not hydraulically connected with the lower zones. The shallow well did respond to pumping from P-22 (Figure 4).
Figure 12 - Drawdown curves plotted on linear scale for three observation well screens
used for South Area Aquifer Test.

For this region, the aquifer test demonstrates that the primary LTA aquifer is hydraulically connected to the aquifer within the upper Ione Formation but water from these two zones follow indirect pathways. The shallow aquifer zone of the LTA in this area is not hydraulically connected with the lower zone of the LTA.
CONCLUSIONS The results of the study demonstrate that aquifer performance tests can be conducted using data collected during routine irrigation events and that the methodology developed for the LTA project provided a cost-effective way to assess aquifer conditions and interactions. Analyses of the three aquifer tests presented in this paper illustrate three distinctly different responses for the LTA consistent with observed differences in the depositional environment of the Tuscan Formation. These types of observed differences are critical to an overall understanding of an identified groundwater aquifer system such as the LTA and demonstrate that management of these resources should not be conducted under broad assumed aquifer characteristics. Essential data needed to assess these systems include accurate geologic information to develop sound conceptual hydrogeologic models, aquifer tests conducted during normal operation of groundwater irrigation or supply systems that reflects real time stresses on the aquifer, and visual assessment of drawdown curves where observed variations from the type curves can provide valuable insights into specific qualitative as well as quantitative aquifer characteristics. Management of these resources should also take into consideration the distinct zones and connectivity identified from these tests to evaluate overdraft, recharge conditions, and appropriate design of groundwater supply wells. Appropriate design of supply wells based on this understanding can be utilize to increase the energy efficiencies, optimize specific capacities for groundwater supply systems, and limit impacts from known water quality degradation within the area.
REFERENCES Blair, T.C., Baker, F.G., and Turner, J.B., 1991, Cenozoic Fluvial-Facies Architecture and Aquifer Heterogeneity, Oroville, California, Superfund Site and Vicinity, in A.D. Miall and N. Tyler, eds., The Three-Dimensional Facies Architecture of Terrigenous Clastic Sediments and Its Implications for Hydrocarbon Discovery and Recovery, SEPM, Concepts in Sedimentology and Paleontology, Volume 3, 1991. Bourdet, D., Whittle, T.M., Douglas, A.A. and Y.M. Pirard, 1983. A new set of type curves simplifies well test analysis, World Oil, May 1983, pp. 95-106. Bourdet, D., Ayoub, J.A. and Y.M. Pirard, 1989. Use of pressure derivative in well-test interpretation, SPE Formation Evaluation, June 1989, pp. 293-302.

Butte County, 2010, Initial Study/Proposed Mitigation Negative Declaration, Lower Tuscan Aquifer Monitoring, Recharge and Data Management Project, 79 p. Duffield, G. M., 2007, AQTESOLV™ Version 4.5 User’s Guide, 528 p. Helley, E.J., and Harwood, D.S. 1985. Geologic map of the late Cenozoic deposits of the Sacramento Valley and northern Sierran foothills, California. Department of the Interior - U.S. Geological Survey. Miscellaneous Field Studies Map MF-1790: 1-24 p., 5 sheets, Scale 1:62,500. Kim, J., and Parizek, R. R., 1997, Numerical Simulation of the Noordbergum effect resulting from groundwater pumping in layered aquifer system, Journal of Hydrology Volume 202, Issue 1-4, pp. 231-243. Redwine, L.E. 1972. The Tertiary Princeton submarine valley system beneath the Sacramento Valley, California: Univ. of California, Los Angeles, unpubl. Thesis (PhD): 480 p. Spane, F.A., Jr., and S.K. Wurstner, 1993. DERIV: A computer program for calculating pressure derivatives for use in hydraulic test analysis, Ground Water, vol. 31, no. 5, pp. 814-822. Verruijt, A., 1969, Elastic storage of aquifers. In: Flow Through Porous Media, edited by R.J.M. De Wiest, Academic Press, New York. pp. 331-376.


