Case Study # 3 - Janthord Study 3... · Case Study # 3 Management of Quality Chick-n-Gravy Dinner...
10
Case Study # 3 Management of Quality Chick-n-Gravy Dinner Line & Tip Top Markets Submitted by: Jan Anthony Ordoña Kenneth Guelas Kenneth Gomez Dara Fucoy Francine Yu PRODUMA – A0A Submitted to: Prof. Engr. Glenn Guevarra
Transcript of Case Study # 3 - Janthord Study 3... · Case Study # 3 Management of Quality Chick-n-Gravy Dinner...

Case Study # 3
Management of Quality
Chick-n-Gravy Dinner Line &
Tip Top Markets
Submitted by: Jan Anthony Ordoña
Kenneth Guelas
Kenneth Gomez
Dara Fucoy
Francine Yu
PRODUMA – A0A
Submitted to:
Prof. Engr. Glenn Guevarra

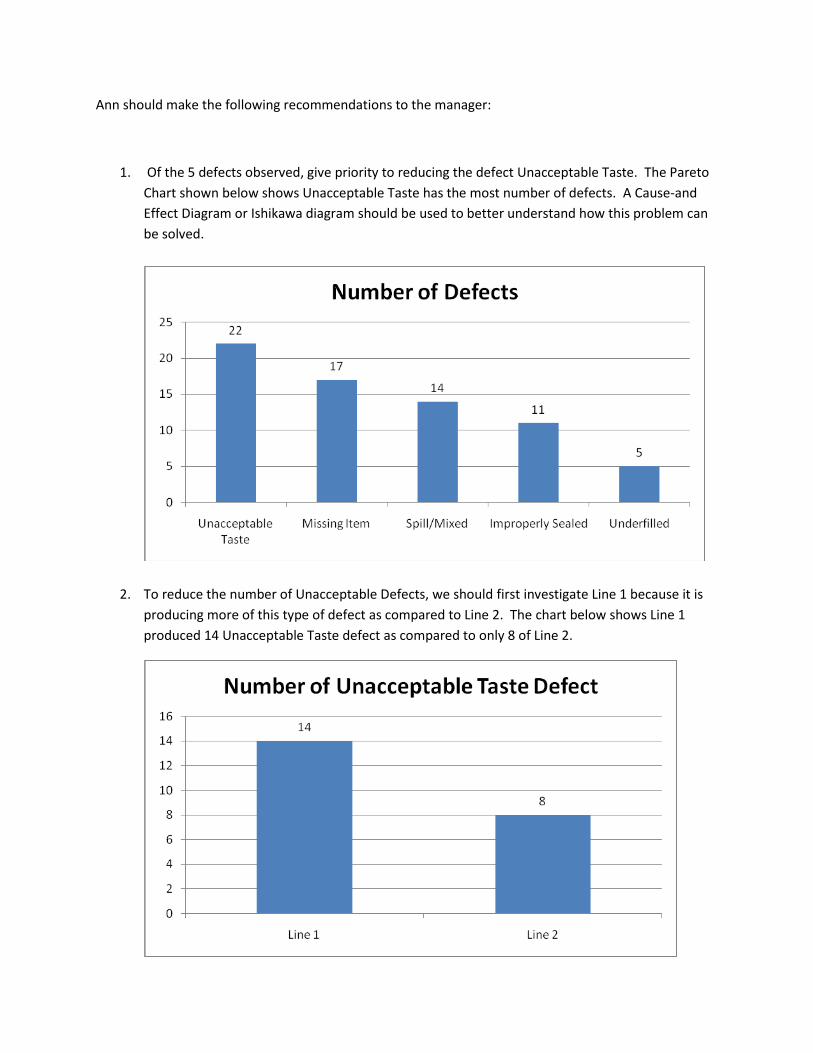
Ann should make the following recommendations to the manager:
1. Of the 5 defects observed, give priority to reducing the defect Unacceptable Taste. The Pareto
Chart shown below shows Unacceptable Taste has the most number of defects. A Cause-and
Effect Diagram or Ishikawa diagram should be used to better understand how this problem can
be solved.
2. To reduce the number of Unacceptable Defects, we should first investigate Line 1 because it is
producing more of this type of defect as compared to Line 2. The chart below shows Line 1
produced 14 Unacceptable Taste defect as compared to only 8 of Line 2.

3. After successfully reducing the Unacceptable Taste defect, the Missing Item defect can be
investigated. After the Missing Item defect is reduced, the Spill/Mixed defect can be
investigated. And so on until all the 5 defects are reduced or completely removed.
4. The Scatter Diagram below shows there is no relationship between the time the defects were
observed and the number of defects found. Hence, any effort to reduce the number of defects
may not be based on any time of the day. Test runs on production lines 1 and 2 may be
conducted irrespective of time of the day.
17
16
15
14
13
Number 12
of 11
Defects 10
Observed 9
.
8
.
7
6
. . .
.
5
4
.
. .
..
3
.
2
. .
1
1 2 3 4 5 6 7 8 9 10 11 12 13 14 15 16
TIME


I. Data Analysis Check Sheet – The check sheet shows there are 184 customer complaints received during the past 8 Tuesdays. There are complaints that are similar and could be categorized for easier analysis. I came out with 12 categories, namely:
Out-of-stock - 61
Overcharged - 18
Poor store maintenance - 16
Long check-out waiting time - 14
Defective products - 12
Uncomfortable store temperature - 10
Meat not fresh - 9
Wrong price/under charge - 8
Could not find items - 8
Employees not courteous/helpful - 6
Fish not fresh - 5
Others – 17
The category Out-of Stock has the most number of complaints at 61 while Fish Not Fresh has the least number of complaints at 5. The category Others includes all other complaints that minor complaints like ATM ate card, lost wallet, dislike store decoration, etc. Pareto Chart – This chart shows that the out-of-stock category has the most number of complaints at 61. Based on the Pareto Principle or the 20-80 Rule which states that 80% of the effects come from 20% of the causes, the task of reducing the number of complaints can best be accomplished by focusing on the “significant few” versus the “trivial many”.

Run Chart – This chart shows the number of complaints received every Tuesday are moving horizontally with no indication of either going up or down in the coming Tuesdays. They just fluctuate about the average which is 20. There is no indication that the changes implemented on July 15 reflected improvement. As it is, the same level of complaints will continue in the future until more focused and effective strategies are implemented.

Cause-and-Effect Diagram – This shows that there are three main causes of the out-of-stock problem. They are:
1. The suppliers are refusing to deliver products until Tip Top Markets pay them for past deliveries;
2. The recent typhoons caused heavy damage to the crops of Tip Top Markets’ main suppliers of produce, hence, their inability to supply ordered produce. Other suppliers who are willing to make deliveries cannot do so because of the heavy damage to the roads leading to Tip Top Markets as a result of the heavy floods during the past months.
3. Some suppliers are unable to make deliveries because of production problems.
They are not able to produce enough products because they don’t have enough raw materials. The high cost of importing raw materials from abroad and their limited financial capability prevent them from acquiring the required raw materials.

RECOMMENDATIONS:
1. To be able to significantly reduce the number of complaints fast, I recommend that Tip Top Markets start addressing the out-of-stock problem ahead of other categories of complaints. After addressing this problem, they should focus on the next category with the highest number of complaints which is Overcharged. The process should continue until the other major or significant categories are addressed.
2. Tip Top Markets should immediately find the financial resource to settle all its financial obligations to its major suppliers so that deliveries can be resumed.
3. The Purchasing Department should start scouting for other suppliers from
other parts of the country not affected by the flooding of recent months. They should also look for other suppliers with sound financial backing and proven track record of honoring delivery commitments.
4. A Quality Team that will be in charge of ensuring quality service is
provided to customers of Tip Top Market’s at all times should be created. It will be responsible for monitoring customer complaints and addressing them in the fastest and most efficient way. It should coordinate with the HR department to ensure that proper training on courtesy are provided to all employees. It will also be responsible for leading the company in creating an organizational culture that puts value to the twin concept of excellence and accountability. The Quality Team should be in charge of installing a Total Quality Management (TQM) program in the company.