CASE STUDIES Utilizing the Produced Water...
33
CASE STUDIES Utilizing the Produced Water Treatment and Beneficial Use Screening Tool 14 June 2011 Prepared for Research Partnership to Secure Energy for America RPSEA
Transcript of CASE STUDIES Utilizing the Produced Water...
CASE STUDIES Utilizing the Produced Water Treatment and
Beneficial Use Screening Tool
14 June 2011
Prepared for
Research Partnership to Secure Energy for America
RPSEA
Case Studies – Utilizing the Produced Water Treatment and Beneficial Use Screening Tool i
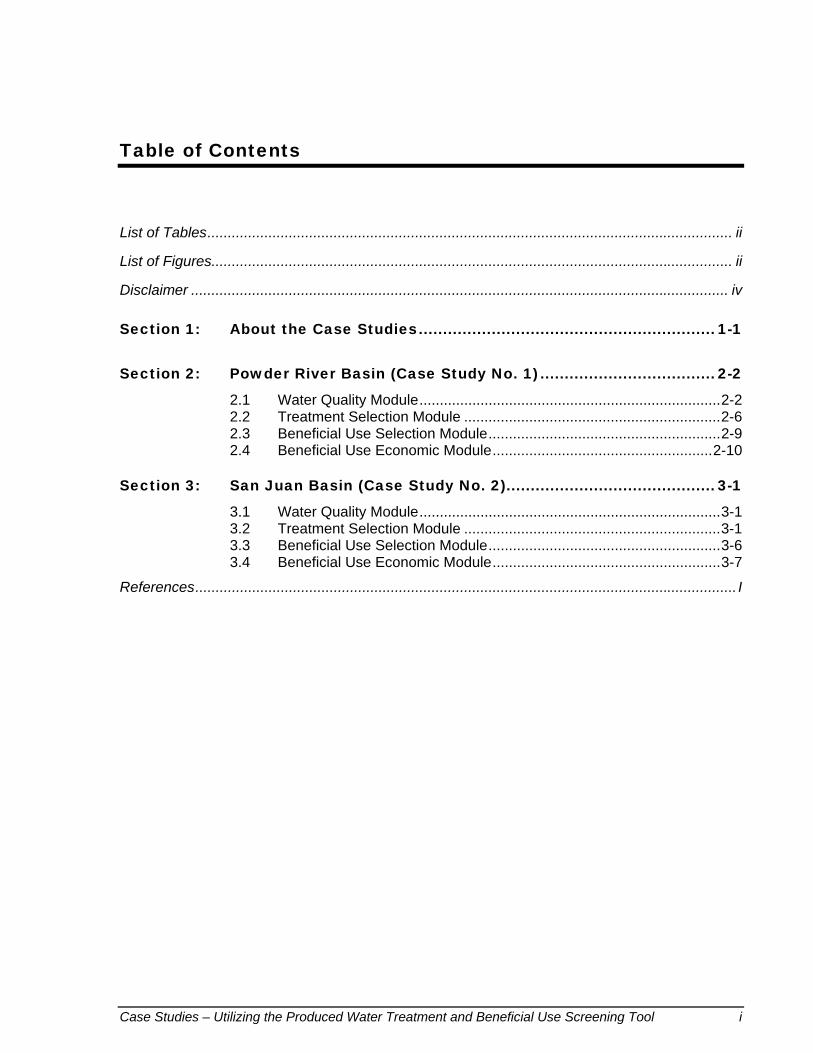
Table of Contents
List of Tables ................................................................................................................................. ii
List of Figures................................................................................................................................ ii
Disclaimer .................................................................................................................................... iv
Section 1: About the Case Studies ............................................................. 1-1
Section 2: Powder River Basin (Case Study No. 1) .................................... 2-2
2.1 Water Quality Module .......................................................................... 2-2 2.2 Treatment Selection Module ............................................................... 2-6 2.3 Beneficial Use Selection Module ......................................................... 2-9 2.4 Beneficial Use Economic Module ...................................................... 2-10
Section 3: San Juan Basin (Case Study No. 2)........................................... 3-1
3.1 Water Quality Module .......................................................................... 3-1 3.2 Treatment Selection Module ............................................................... 3-1 3.3 Beneficial Use Selection Module ......................................................... 3-6 3.4 Beneficial Use Economic Module ........................................................ 3-7
References ..................................................................................................................................... I
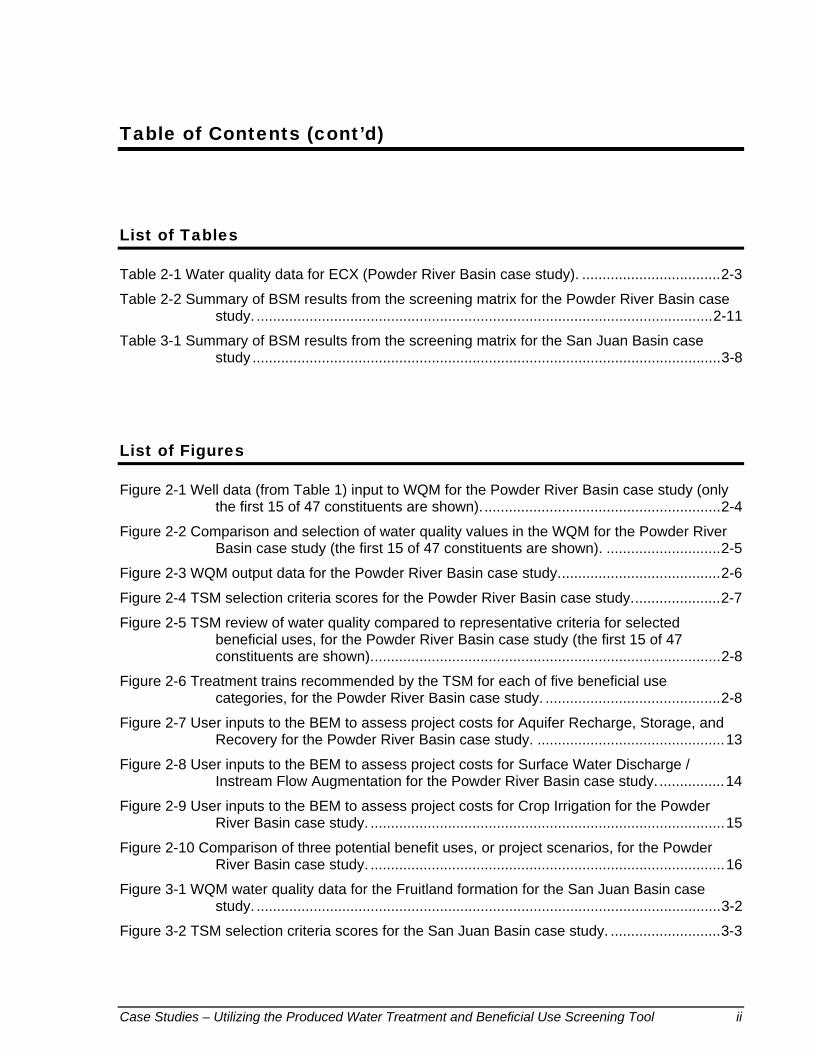
Table of Contents (cont’d)
Case Studies – Utilizing the Produced Water Treatment and Beneficial Use Screening Tool ii
List of Tables
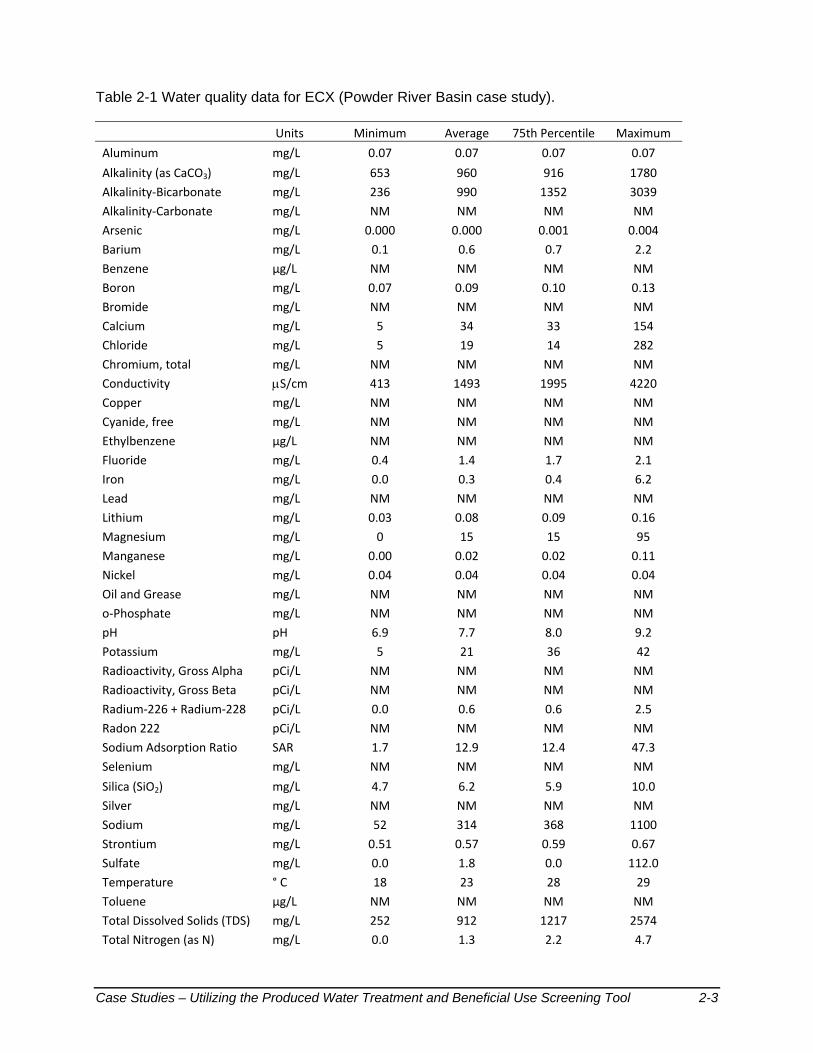
Table 2-1 Water quality data for ECX (Powder River Basin case study). .................................. 2-3
Table 2-2 Summary of BSM results from the screening matrix for the Powder River Basin case study. ................................................................................................................ 2-11
Table 3-1 Summary of BSM results from the screening matrix for the San Juan Basin case study ................................................................................................................... 3-8
List of Figures
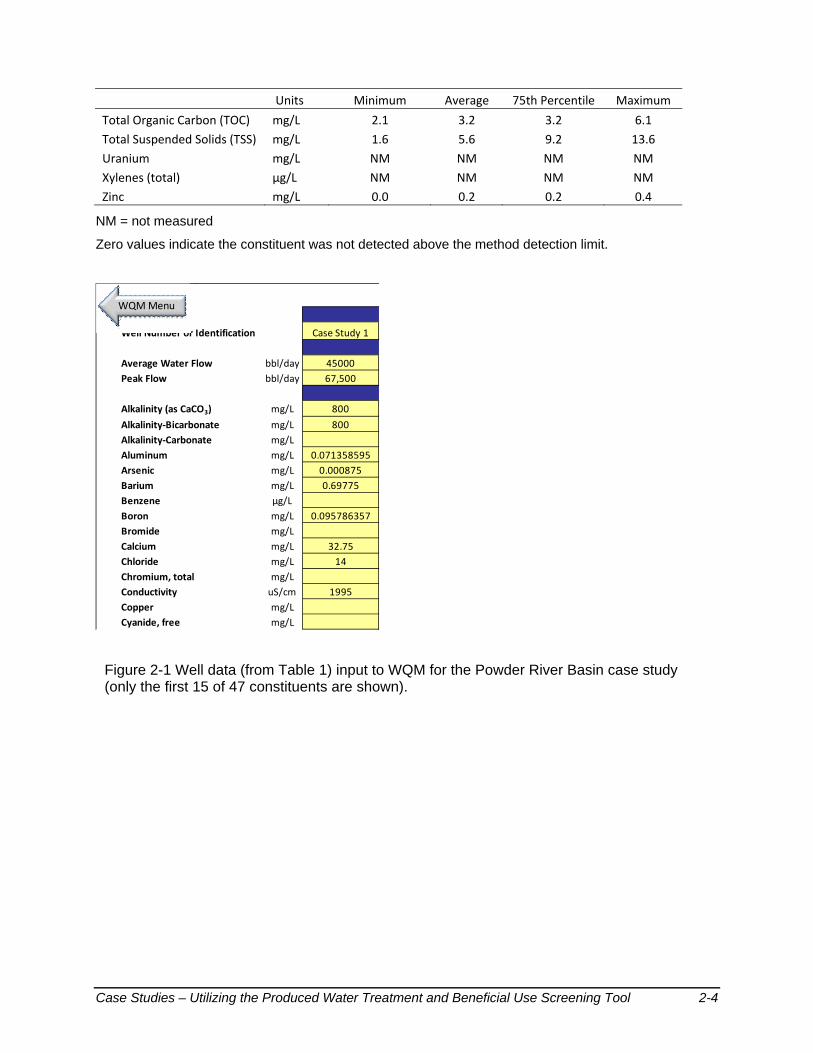
Figure 2-1 Well data (from Table 1) input to WQM for the Powder River Basin case study (only the first 15 of 47 constituents are shown). .......................................................... 2-4
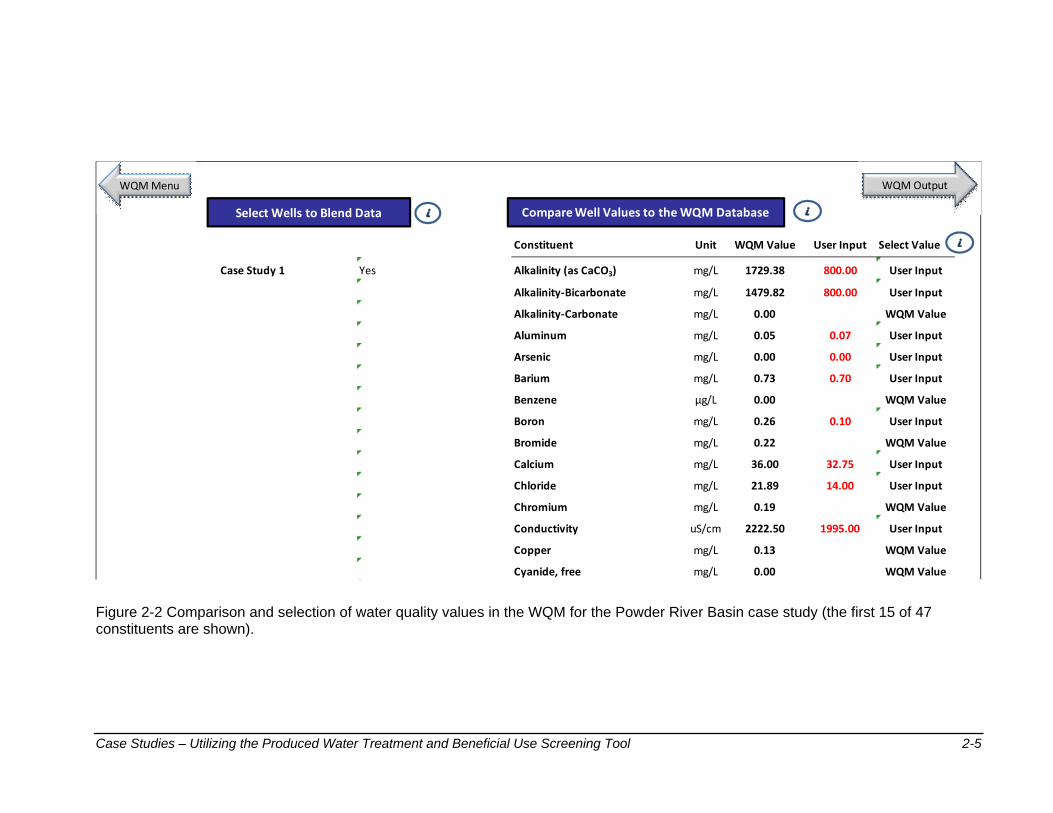
Figure 2-2 Comparison and selection of water quality values in the WQM for the Powder River Basin case study (the first 15 of 47 constituents are shown). ............................ 2-5
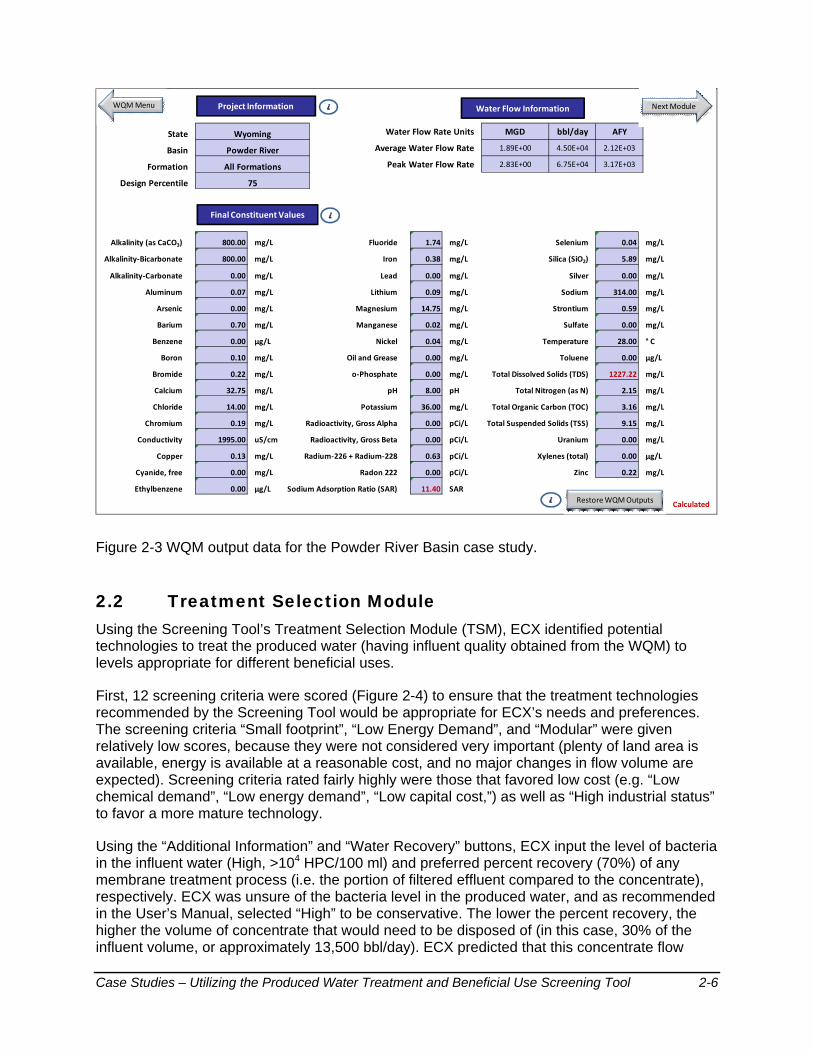
Figure 2-3 WQM output data for the Powder River Basin case study. ....................................... 2-6
Figure 2-4 TSM selection criteria scores for the Powder River Basin case study. ..................... 2-7
Figure 2-5 TSM review of water quality compared to representative criteria for selected beneficial uses, for the Powder River Basin case study (the first 15 of 47 constituents are shown). ..................................................................................... 2-8
Figure 2-6 Treatment trains recommended by the TSM for each of five beneficial use categories, for the Powder River Basin case study. ........................................... 2-8
Figure 2-7 User inputs to the BEM to assess project costs for Aquifer Recharge, Storage, and Recovery for the Powder River Basin case study. .............................................. 13
Figure 2-8 User inputs to the BEM to assess project costs for Surface Water Discharge / Instream Flow Augmentation for the Powder River Basin case study. ................ 14
Figure 2-9 User inputs to the BEM to assess project costs for Crop Irrigation for the Powder River Basin case study. ....................................................................................... 15
Figure 2-10 Comparison of three potential benefit uses, or project scenarios, for the Powder River Basin case study. ....................................................................................... 16
Figure 3-1 WQM water quality data for the Fruitland formation for the San Juan Basin case study. .................................................................................................................. 3-2
Figure 3-2 TSM selection criteria scores for the San Juan Basin case study. ........................... 3-3
Table of Contents (cont’d)
Case Studies – Utilizing the Produced Water Treatment and Beneficial Use Screening Tool iii
Figure 3-3 TSM review of water quality compared to representative criteria for selected beneficial uses, for the San Juan Basin case study. .......................................... 3-4
Figure 3-4 Treatment trains recommended by the TSM for each of five beneficial use categories for the San Juan Basin case study. .................................................................... 3-5
Figure 3-5 Feed, product, and brine water qualities for the “Crop irrigation, non-potable use” beneficial use category (San Juan Basin case study). ....................................... 3-6
Figure 3-6 User inputs to the BEM to assess the project costs for beneficial use of produced water via Surface Water Discharge for the San Juan Basin case study. ......... 3-10
Figure 3-7 Summary of project cost estimate for Surface Water Discharge/Marketing (San Juan Basin case study). ............................................................................................ 3-11
Case Studies – Utilizing the Produced Water Treatment and Beneficial Use Screening Tool iv
Disclaimer
The outputs and results obtained from the Produced Water Treatment and Beneficial Use Screening Tool are meant for project screening purposes only as relevant information gathered for the modules are based on limited projects and best engineering judgment. Actual projects will contain details not captured by the Tool or these case studies that may affect the treatment of produced water, regulatory compliance, project feasibility, and overall cost of the project.
Case Studies – Utilizing the Produced Water Treatment and Beneficial Use Screening Tool 1-1
Section 1: About the Case Studies
Two hypothetical case studies were evaluated using the Produced Water Treatment and Beneficial Use Screening Tool (Screening Tool). The Screening Tool was developed by the Colorado School of Mines, Kennedy/Jenks Consultants, Stratus Consulting, and Argonne National Laboratory to demonstrate how a Screening Tool may be used to evaluate potential beneficial uses of produced water given particular site conditions and user preferences. The case studies take place in the Powder River Basin in Wyoming and the San Juan Basin in New Mexico.
Beginning with research team discussions that yielded candidate projects, the case studies were developed using phone interviews with representatives of selected energy companies and data gathering and analysis to describe two hypothetical beneficial reuse scenarios. In addition to evaluating the site background, produced water quantity and quality, as well as any existing beneficial use and treatment technologies, sufficient data were collected or assumed to utilize all aspects of the Screening Tool. The Tool was used to evaluate treatment technology options, costs, potential beneficial uses, and potential environmental and societal benefits associated with the case study projects.
This document presents the inputs and results for each of the Screening Tool modules and is intended as a companion to the Screening Tool User’s Manual to provide realistic examples for additional guidance. Further evaluation of the case studies will also be available in a forthcoming publication.
Case Studies – Utilizing the Produced Water Treatment and Beneficial Use Screening Tool 2-2
Section 2: Powder River Basin (Case Study No. 1)
Energy Company X (ECX) is a hypothetical energy company that operates multiple well fields for coalbed methane (CBM) extraction in the Powder River Basin in Wyoming. Relying on estimates of the produced water total volume and average quality for a 400-well field under consideration for beneficial use of produced water, ECX used the Screening Tool to evaluate potential beneficial uses, treatment technologies, and project costs.
2.1 Water Quality Module Based on the location of the well field, ECX input the state (Wyoming), basin (Powder River Basin), and target formation (All formations) for the required Project Information in the Water Quality Module (WQM). “All formations” was selected instead of a particular formation in the drop-down menu (Anderson, Big George, Canyon, Wall, Wyodak, or other) because many of these coal groups are found within the project area and the wells may be screened in more than one of them. A design percentile of 75% was selected in order to be fairly conservative with respect to the anticipated water quality of the produced water, to account for the fact that the water quality may change over time or be more variable than anticipated. Also input were the average and peak daily water flow rates estimated for the well field (45,000 and 67,500 bbl/day, respectively). ECX estimated the peak daily water flow rate as a 50% increase of the average daily flow rate, to account for the fact that additional wells may be operated at certain times (the peak flow rate estimate will determine the required size of the influent storage facility for the treatment plant in the Beneficial Use Economic Module).
Instead of using the WQM database to estimate the produced water quality, ECX continued to the optional step “Enter Well Data” to input known 75th percentile data for the well field (Table 2-1). Because the data represented an average of the entire project rather than being in the form of individual wells, only a single well entry was made and the total project flows (45,000 bbl/day average and 67,500 bbl/day peak) were input as the average and peak flows, as shown in Figure 2-1. Water quality information was not available for every constituent.
In the next step, “Compare Well Data” was selected from the WQM Main Menu. For those constituents for which no user-input data was available, the WQM values were selected (i.e. from the WQM database), as shown in Figure 2-2, using the drop-down menus in the final column. The combined output data was produced by selecting “WQM Output” (or “Generate Output” from the WQM Main Menu), shown in Figure 2-3.
As noted in the User’s Manual, the SAR value in the output data is calculated using the sodium, calcium, and magnesium values. TDS is also calculated by the module using data for other constituents. Because the resulting TDS based on 75th percentile values overestimated the measured TDS (Table 2-1), ECX lowered the alkalinity values (in the Well Data tab) to produce a calculated TDS value similar to the measured (75th percentile) value.
Case Studies – Utilizing the Produced Water Treatment and Beneficial Use Screening Tool 2-3
Table 2-1 Water quality data for ECX (Powder River Basin case study).
Units Minimum Average 75th Percentile Maximum
Aluminum mg/L 0.07 0.07 0.07 0.07
Alkalinity (as CaCO3) mg/L 653 960 916 1780
Alkalinity‐Bicarbonate mg/L 236 990 1352 3039
Alkalinity‐Carbonate mg/L NM NM NM NM
Arsenic mg/L 0.000 0.000 0.001 0.004
Barium mg/L 0.1 0.6 0.7 2.2
Benzene µg/L NM NM NM NM
Boron mg/L 0.07 0.09 0.10 0.13
Bromide mg/L NM NM NM NM
Calcium mg/L 5 34 33 154
Chloride mg/L 5 19 14 282
Chromium, total mg/L NM NM NM NM
Conductivity S/cm 413 1493 1995 4220
Copper mg/L NM NM NM NM
Cyanide, free mg/L NM NM NM NM
Ethylbenzene µg/L NM NM NM NM
Fluoride mg/L 0.4 1.4 1.7 2.1
Iron mg/L 0.0 0.3 0.4 6.2
Lead mg/L NM NM NM NM
Lithium mg/L 0.03 0.08 0.09 0.16
Magnesium mg/L 0 15 15 95
Manganese mg/L 0.00 0.02 0.02 0.11
Nickel mg/L 0.04 0.04 0.04 0.04
Oil and Grease mg/L NM NM NM NM
o‐Phosphate mg/L NM NM NM NM
pH pH 6.9 7.7 8.0 9.2
Potassium mg/L 5 21 36 42
Radioactivity, Gross Alpha pCi/L NM NM NM NM
Radioactivity, Gross Beta pCi/L NM NM NM NM
Radium‐226 + Radium‐228 pCi/L 0.0 0.6 0.6 2.5
Radon 222 pCi/L NM NM NM NM
Sodium Adsorption Ratio SAR 1.7 12.9 12.4 47.3
Selenium mg/L NM NM NM NM
Silica (SiO2) mg/L 4.7 6.2 5.9 10.0
Silver mg/L NM NM NM NM
Sodium mg/L 52 314 368 1100
Strontium mg/L 0.51 0.57 0.59 0.67
Sulfate mg/L 0.0 1.8 0.0 112.0
Temperature ° C 18 23 28 29
Toluene µg/L NM NM NM NM
Total Dissolved Solids (TDS) mg/L 252 912 1217 2574
Total Nitrogen (as N) mg/L 0.0 1.3 2.2 4.7
Case Studies – Utilizing the Produced Water Treatment and Beneficial Use Screening Tool 2-4
Units Minimum Average 75th Percentile Maximum
Total Organic Carbon (TOC) mg/L 2.1 3.2 3.2 6.1
Total Suspended Solids (TSS) mg/L 1.6 5.6 9.2 13.6
Uranium mg/L NM NM NM NM
Xylenes (total) µg/L NM NM NM NM
Zinc mg/L 0.0 0.2 0.2 0.4
NM = not measured
Zero values indicate the constituent was not detected above the method detection limit.
Well Number or Identification Case Study 1
bbl/day 45000
bbl/day 67,500
mg/L 800
mg/L 800
mg/L
mg/L 0.071358595
mg/L 0.000875
mg/L 0.69775
µg/L
mg/L 0.095786357
mg/L
mg/L 32.75
mg/L 14
mg/L
uS/cm 1995
mg/L
mg/L
Average Water Flow
Peak Flow
Alkalinity (as CaCO3)
Alkalinity‐Bicarbonate
Alkalinity‐Carbonate
Aluminum
Arsenic
Barium
Benzene
Boron
Bromide
Calcium
Chloride
Chromium, total
Conductivity
Copper
Cyanide, free
WQM Menu
Figure 2-1 Well data (from Table 1) input to WQM for the Powder River Basin case study (only the first 15 of 47 constituents are shown).
Case Studies – Utilizing the Produced Water Treatment and Beneficial Use Screening Tool 2-5
Constituent Unit WQM Value User Input Select Value
Yes Alkalinity (as CaCO3) mg/L 1729.38 800.00 User Input
Alkalinity‐Bicarbonate mg/L 1479.82 800.00 User Input
Alkalinity‐Carbonate mg/L 0.00 WQM Value
Aluminum mg/L 0.05 0.07 User Input
Arsenic mg/L 0.00 0.00 User Input
Barium mg/L 0.73 0.70 User Input
Benzene µg/L 0.00 WQM Value
Boron mg/L 0.26 0.10 User Input
Bromide mg/L 0.22 WQM Value
Calcium mg/L 36.00 32.75 User Input
Chloride mg/L 21.89 14.00 User Input
Chromium mg/L 0.19 WQM Value
Conductivity uS/cm 2222.50 1995.00 User Input
Copper mg/L 0.13 WQM Value
Cyanide, free mg/L 0.00 WQM Value
Case Study 1
Select Wells to Blend Data CompareWell Values to the WQM Database
i
WQM Menu
ii
WQM Output
Figure 2-2 Comparison and selection of water quality values in the WQM for the Powder River Basin case study (the first 15 of 47 constituents are shown).
Case Studies – Utilizing the Produced Water Treatment and Beneficial Use Screening Tool 2-6
Water Flow Rate Units MGD bbl/day
Average Water Flow Rate 1.89E+00 4.50E+04
Peak Water Flow Rate 2.83E+00 6.75E+04
800.00 mg/L 1.74 mg/L 0.04 mg/L
800.00 mg/L 0.38 mg/L 5.89 mg/L
0.00 mg/L 0.00 mg/L 0.00 mg/L
0.07 mg/L 0.09 mg/L 314.00 mg/L
0.00 mg/L 14.75 mg/L 0.59 mg/L
0.70 mg/L 0.02 mg/L 0.00 mg/L
0.00 µg/L 0.04 mg/L 28.00 ° C
0.10 mg/L 0.00 mg/L 0.00 µg/L
0.22 mg/L 0.00 mg/L 1227.22 mg/L
32.75 mg/L 8.00 pH 2.15 mg/L
14.00 mg/L 36.00 mg/L 3.16 mg/L
0.19 mg/L 0.00 pCi/L 9.15 mg/L
1995.00 uS/cm 0.00 pCi/L 0.00 mg/L
0.13 mg/L 0.63 pCi/L 0.00 µg/L
0.00 mg/L 0.00 pCi/L 0.22 mg/L
0.00 µg/L 11.40 SAR
Calculated
Zinc
Sulfate
Temperature
Toluene
Total Dissolved Solids (TDS)
Xylenes (total)
Uranium
Potassium
Radioactivity, Gross Alpha
Radioactivity, Gross Beta
Total Organic Carbon (TOC)
Total Suspended Solids (TSS)
AFY
2.12E+03
3.17E+03
Lead
Iron
Silver
Sodium
Strontium
pH Total Nitrogen (as N)
Magnesium
Manganese
Basin
State Wyoming
Powder River
All Formations
Design Percentile 75
Alkalinity (as CaCO3)
Alkalinity‐Bicarbonate
Alkalinity‐Carbonate
Radium‐226 + Radium‐228
Radon 222
Fluoride
Lithium
Conductivity
Nickel
Oil and Grease
o‐Phosphate
Copper
Boron
Sodium Adsorption Ratio (SAR)
Selenium
Silica (SiO2)
Arsenic
Barium
Ethylbenzene
Formation
Bromide
Calcium
Chloride
Chromium
Cyanide, free
Benzene
Aluminum
Project Information
Final Constituent Values
NextModuleWater Flow Information
i
iWQM Menu
Restore WQM Outputsi
Figure 2-3 WQM output data for the Powder River Basin case study.
2.2 Treatment Selection Module Using the Screening Tool’s Treatment Selection Module (TSM), ECX identified potential technologies to treat the produced water (having influent quality obtained from the WQM) to levels appropriate for different beneficial uses.
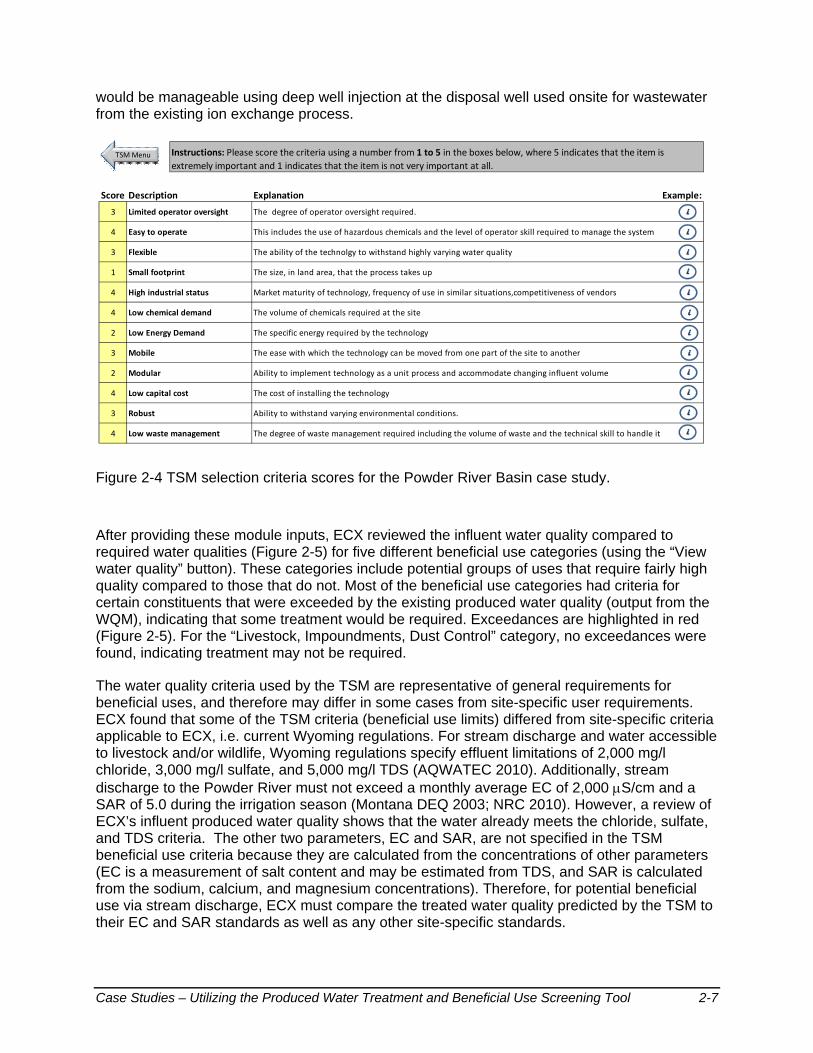
First, 12 screening criteria were scored (Figure 2-4) to ensure that the treatment technologies recommended by the Screening Tool would be appropriate for ECX’s needs and preferences. The screening criteria “Small footprint”, “Low Energy Demand”, and “Modular” were given relatively low scores, because they were not considered very important (plenty of land area is available, energy is available at a reasonable cost, and no major changes in flow volume are expected). Screening criteria rated fairly highly were those that favored low cost (e.g. “Low chemical demand”, “Low energy demand”, “Low capital cost,”) as well as “High industrial status” to favor a more mature technology.
Using the “Additional Information” and “Water Recovery” buttons, ECX input the level of bacteria in the influent water (High, >104 HPC/100 ml) and preferred percent recovery (70%) of any membrane treatment process (i.e. the portion of filtered effluent compared to the concentrate), respectively. ECX was unsure of the bacteria level in the produced water, and as recommended in the User’s Manual, selected “High” to be conservative. The lower the percent recovery, the higher the volume of concentrate that would need to be disposed of (in this case, 30% of the influent volume, or approximately 13,500 bbl/day). ECX predicted that this concentrate flow
Case Studies – Utilizing the Produced Water Treatment and Beneficial Use Screening Tool 2-7
would be manageable using deep well injection at the disposal well used onsite for wastewater from the existing ion exchange process.
Score Description Explanation Example:
3
4 Easy to operate
3 Flexible
1 Small footprint
4 High industrial status
4 The volume of chemicals required at the site
2
3 Mobile
2 Modular
4 Low capital cost
3 Robust
4 Low waste management
Instructions: Please score the criteria using a number from 1 to 5 in the boxes below, where 5 indicates that the item is
extremely important and 1 indicates that the item is not very important at all.
Low Energy Demand
Limited operator oversight
Low chemical demand
Ability to withstand varying environmental conditions.
The degree of operator oversight required.
This includes the use of hazardous chemicals and the level of operator skill required to manage the system
The ability of the technolgy to withstand highly varying water quality
The size, in land area, that the process takes up
The degree of waste management required including the volume of waste and the technical skill to handle it
Market maturity of technology, frequency of use in similar situations,competitiveness of vendors
The specific energy required by the technology
The ease with which the technology can be moved from one part of the site to another
Ability to implement technology as a unit process and accommodate changing influent volume
The cost of installing the technology
TSM Menu
i
i
i
i
i
i
i
i
i
i
i
i
Figure 2-4 TSM selection criteria scores for the Powder River Basin case study.
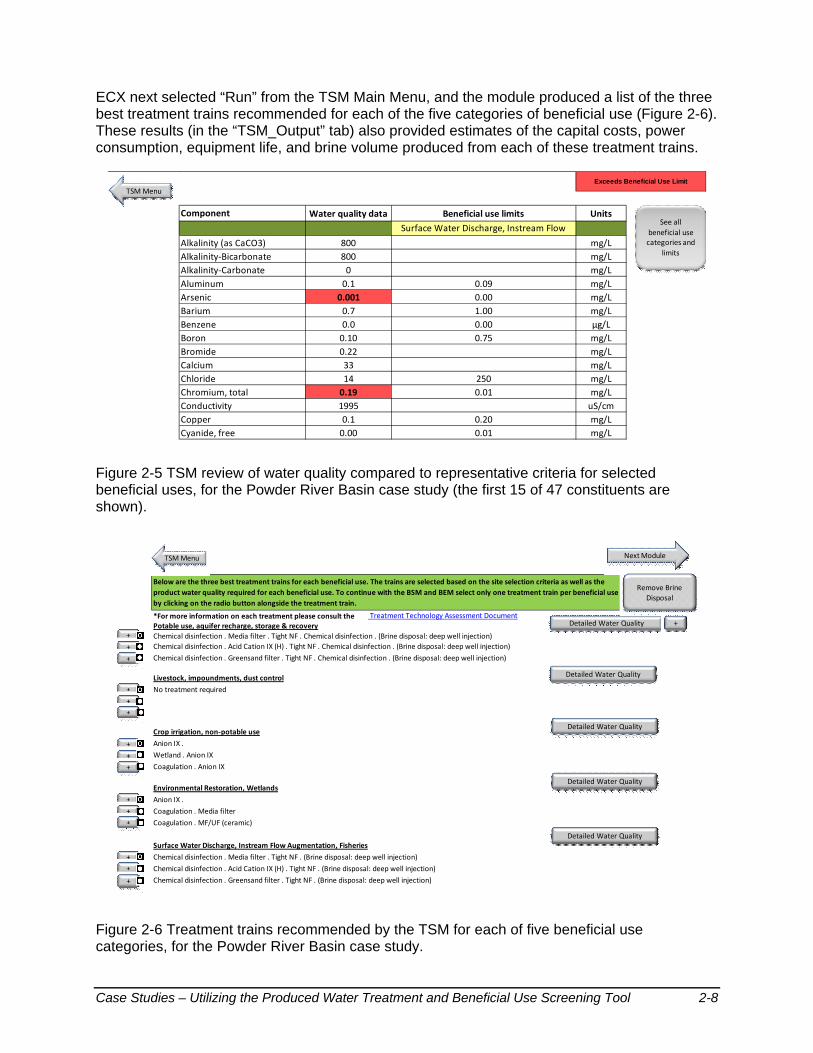
After providing these module inputs, ECX reviewed the influent water quality compared to required water qualities (Figure 2-5) for five different beneficial use categories (using the “View water quality” button). These categories include potential groups of uses that require fairly high quality compared to those that do not. Most of the beneficial use categories had criteria for certain constituents that were exceeded by the existing produced water quality (output from the WQM), indicating that some treatment would be required. Exceedances are highlighted in red (Figure 2-5). For the “Livestock, Impoundments, Dust Control” category, no exceedances were found, indicating treatment may not be required.
The water quality criteria used by the TSM are representative of general requirements for beneficial uses, and therefore may differ in some cases from site-specific user requirements. ECX found that some of the TSM criteria (beneficial use limits) differed from site-specific criteria applicable to ECX, i.e. current Wyoming regulations. For stream discharge and water accessible to livestock and/or wildlife, Wyoming regulations specify effluent limitations of 2,000 mg/l chloride, 3,000 mg/l sulfate, and 5,000 mg/l TDS (AQWATEC 2010). Additionally, stream discharge to the Powder River must not exceed a monthly average EC of 2,000 S/cm and a SAR of 5.0 during the irrigation season (Montana DEQ 2003; NRC 2010). However, a review of ECX’s influent produced water quality shows that the water already meets the chloride, sulfate, and TDS criteria. The other two parameters, EC and SAR, are not specified in the TSM beneficial use criteria because they are calculated from the concentrations of other parameters (EC is a measurement of salt content and may be estimated from TDS, and SAR is calculated from the sodium, calcium, and magnesium concentrations). Therefore, for potential beneficial use via stream discharge, ECX must compare the treated water quality predicted by the TSM to their EC and SAR standards as well as any other site-specific standards.
Case Studies – Utilizing the Produced Water Treatment and Beneficial Use Screening Tool 2-8
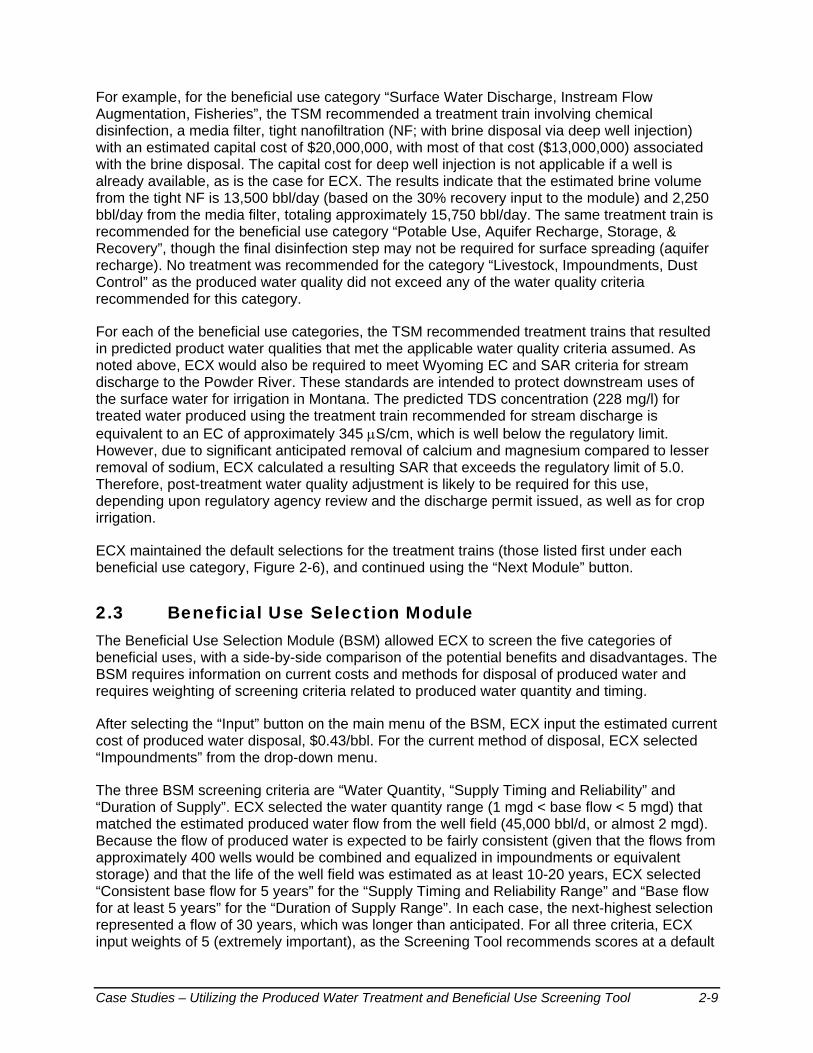
ECX next selected “Run” from the TSM Main Menu, and the module produced a list of the three best treatment trains recommended for each of the five categories of beneficial use (Figure 2-6). These results (in the “TSM_Output” tab) also provided estimates of the capital costs, power consumption, equipment life, and brine volume produced from each of these treatment trains.
Water quality data Beneficial use limits Units
Surface Water Discharge, Instream Flow W
QAlkalinity (as CaCO3) 800 mg/L
Alkalinity‐Bicarbonate 800 mg/L
Alkalinity‐Carbonate 0 mg/L
Aluminum 0.1 0.09 mg/L
Arsenic 0.001 0.00 mg/L
Barium 0.7 1.00 mg/L
Benzene 0.0 0.00 µg/L
Boron 0.10 0.75 mg/L
Bromide 0.22 mg/L
Calcium 33 mg/L
Chloride 14 250 mg/L
Chromium, total 0.19 0.01 mg/L
Conductivity 1995 uS/cm
Copper 0.1 0.20 mg/L
Cyanide, free 0.00 0.01 mg/L
Component
Exceeds Beneficial Use Limit
TSM Menu
See all
beneficial use categories and
limits
Figure 2-5 TSM review of water quality compared to representative criteria for selected beneficial uses, for the Powder River Basin case study (the first 15 of 47 constituents are shown).
Treatment Technology Assessment Document
Potable use, aquifer recharge, storage & recovery
Chemical disinfection . Media filter . Tight NF . Chemical disinfection . (Brine disposal: deep well injection)
Chemical disinfection . Acid Cation IX (H) . Tight NF . Chemical disinfection . (Brine disposal: deep well injection)
Chemical disinfection . Greensand filter . Tight NF . Chemical disinfection . (Brine disposal: deep well injection)
Livestock, impoundments, dust control
No treatment required
Crop irrigation, non‐potable use
Anion IX .
Wetland . Anion IX
Coagulation . Anion IX
Environmental Restoration, Wetlands
Anion IX .
Coagulation . Media filter
Coagulation . MF/UF (ceramic)
Surface Water Discharge, Instream Flow Augmentation, Fisheries
Chemical disinfection . Media filter . Tight NF . (Brine disposal: deep well injection)
Chemical disinfection . Acid Cation IX (H) . Tight NF . (Brine disposal: deep well injection)
Chemical disinfection . Greensand filter . Tight NF . (Brine disposal: deep well injection)
*For more information on each treatment please consult the
Below are the three best treatment trains for each beneficial use. The trains are selected based on the site selection criteria as well as the
product water quality required for each beneficial use. To continue with the BSM and BEM select only one treatment train per beneficial use
by clicking on the radio button alongside the treatment train.
Detailed Water Quality
Detailed Water Quality
Detailed Water Quality
Detailed Water Quality
Detailed Water Quality
TSM Menu Next Module
Remove Brine
Disposal
+
+
+
+
+
+
+
+
+
+
+
+
+
+
+
+
Figure 2-6 Treatment trains recommended by the TSM for each of five beneficial use categories, for the Powder River Basin case study.
Case Studies – Utilizing the Produced Water Treatment and Beneficial Use Screening Tool 2-9
For example, for the beneficial use category “Surface Water Discharge, Instream Flow Augmentation, Fisheries”, the TSM recommended a treatment train involving chemical disinfection, a media filter, tight nanofiltration (NF; with brine disposal via deep well injection) with an estimated capital cost of $20,000,000, with most of that cost ($13,000,000) associated with the brine disposal. The capital cost for deep well injection is not applicable if a well is already available, as is the case for ECX. The results indicate that the estimated brine volume from the tight NF is 13,500 bbl/day (based on the 30% recovery input to the module) and 2,250 bbl/day from the media filter, totaling approximately 15,750 bbl/day. The same treatment train is recommended for the beneficial use category “Potable Use, Aquifer Recharge, Storage, & Recovery”, though the final disinfection step may not be required for surface spreading (aquifer recharge). No treatment was recommended for the category “Livestock, Impoundments, Dust Control” as the produced water quality did not exceed any of the water quality criteria recommended for this category.
For each of the beneficial use categories, the TSM recommended treatment trains that resulted in predicted product water qualities that met the applicable water quality criteria assumed. As noted above, ECX would also be required to meet Wyoming EC and SAR criteria for stream discharge to the Powder River. These standards are intended to protect downstream uses of the surface water for irrigation in Montana. The predicted TDS concentration (228 mg/l) for treated water produced using the treatment train recommended for stream discharge is equivalent to an EC of approximately 345 S/cm, which is well below the regulatory limit. However, due to significant anticipated removal of calcium and magnesium compared to lesser removal of sodium, ECX calculated a resulting SAR that exceeds the regulatory limit of 5.0. Therefore, post-treatment water quality adjustment is likely to be required for this use, depending upon regulatory agency review and the discharge permit issued, as well as for crop irrigation.
ECX maintained the default selections for the treatment trains (those listed first under each beneficial use category, Figure 2-6), and continued using the “Next Module” button.
2.3 Beneficial Use Selection Module The Beneficial Use Selection Module (BSM) allowed ECX to screen the five categories of beneficial uses, with a side-by-side comparison of the potential benefits and disadvantages. The BSM requires information on current costs and methods for disposal of produced water and requires weighting of screening criteria related to produced water quantity and timing.
After selecting the “Input” button on the main menu of the BSM, ECX input the estimated current cost of produced water disposal, $0.43/bbl. For the current method of disposal, ECX selected “Impoundments” from the drop-down menu.
The three BSM screening criteria are “Water Quantity, “Supply Timing and Reliability” and “Duration of Supply”. ECX selected the water quantity range (1 mgd < base flow < 5 mgd) that matched the estimated produced water flow from the well field (45,000 bbl/d, or almost 2 mgd). Because the flow of produced water is expected to be fairly consistent (given that the flows from approximately 400 wells would be combined and equalized in impoundments or equivalent storage) and that the life of the well field was estimated as at least 10-20 years, ECX selected “Consistent base flow for 5 years” for the “Supply Timing and Reliability Range” and “Base flow for at least 5 years” for the “Duration of Supply Range”. In each case, the next-highest selection represented a flow of 30 years, which was longer than anticipated. For all three criteria, ECX input weights of 5 (extremely important), as the Screening Tool recommends scores at a default
Case Studies – Utilizing the Produced Water Treatment and Beneficial Use Screening Tool 2-10
of 5 if the user is uncertain as to their importance. Therefore, the default setting is that all criteria are important, equally, for deriving the most suitable type of beneficial use.
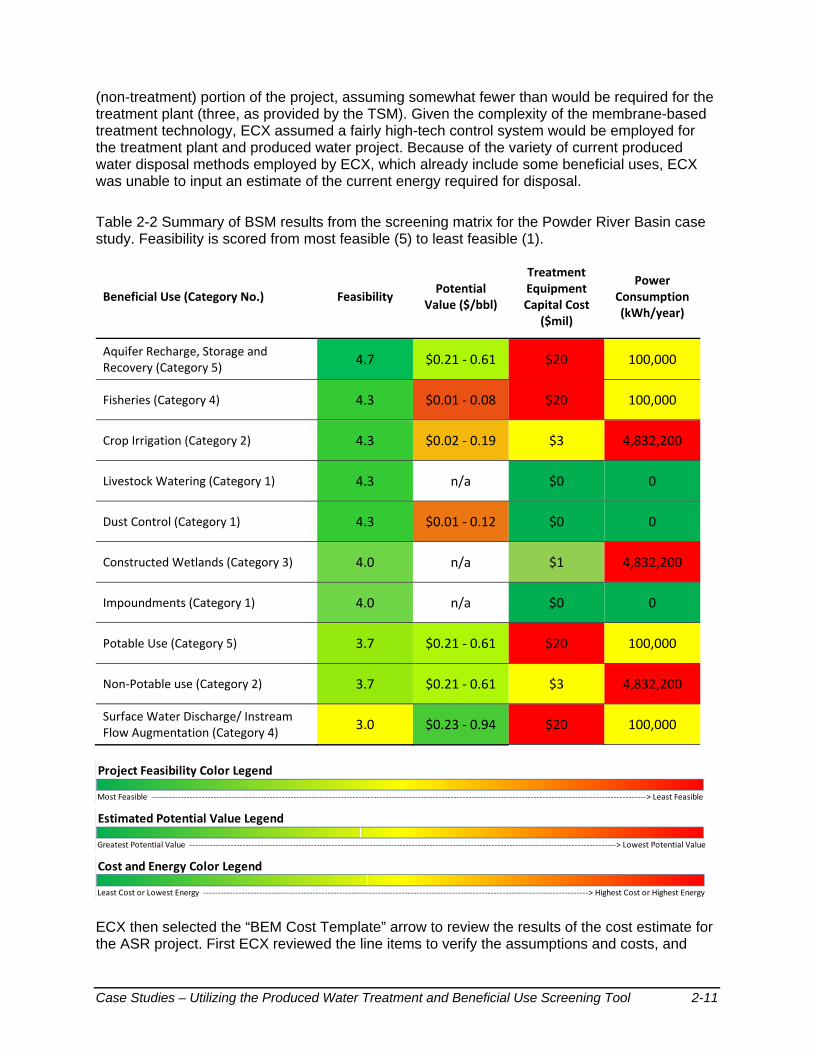
The BSM output (screening matrix) provides information on the project feasibility, potential economic value, capital cost for treatment equipment, and power consumption for each of the five beneficial use categories. The feasibility assessment takes into account the three screening criteria weighted by ECX. A summary of the BSM output for ECX produced water is compiled in Table 2-2 in order of decreasing feasibility, using the same color-coding scheme. All projects were characterized as at least moderately feasible. Based on a review of this information, ECX was most interested in three potential beneficial use projects – Aquifer Recharge, Storage, and Recovery (ASR), Surface Water Discharge/Instream Flow Augmentation, and Crop Irrigation – for the following reasons.
Though ASR has a relatively high treatment capital cost (Table 2-2), it ranked the highest in terms of project feasibility and highly for potential value, with moderate power consumption. Potable Use and Non-Potable Use screening results were similar to ASR except for lower project feasibility. Surface Water Discharge/Instream Flow Augmentation ranked highest in potential economic value (i.e. to potential downstream users) with moderate feasibility and power consumption, though at a high treatment capital cost. Crop irrigation had a fairly high feasibility with some potential value at a low treatment capital cost, though at a relatively high power consumption. As reported in the TSM Output, the relatively high power consumption (also for constructed wetland and non-potable use) is due to the anion exchange unit process in the recommended treatment train for these beneficial uses.
ECX may also consider some of the uses already practiced (livestock water, dust control, and impoundments), though this would depend on the extent to which they competed for produced water volume. The BSM output also provided a summary of various environmental and social benefits (non-economic benefits) for each of the beneficial uses, such as habitat enhancement and water recreation (Surface Water Discharge/Instream Flow Augmentation), plant benefits from raising the groundwater level and new potential potable or irrigation water source (ASR), and offset of potable water use and cost (Crop Irrigation).
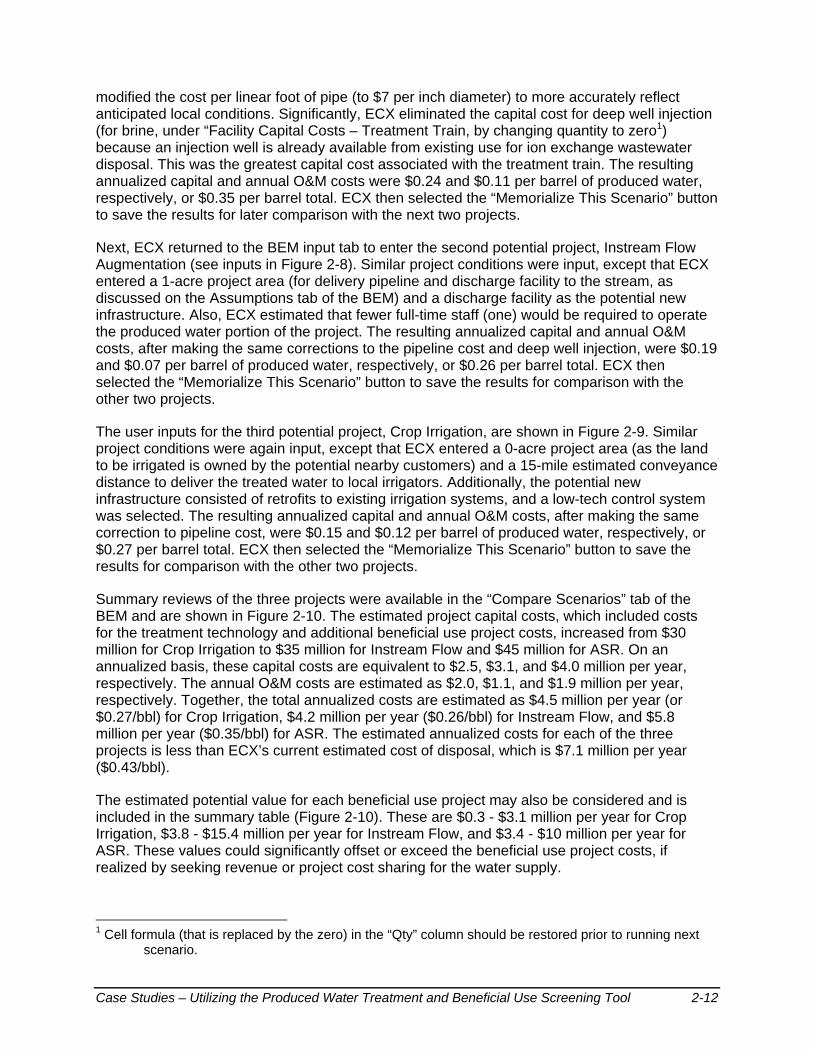
2.4 Beneficial Use Economic Module ECX further evaluated the selected beneficial use projects using the Beneficial Use Economic Module (BEM) to compare estimated, planning level capital and O&M costs. User inputs were required for each project and are shown in Figure 2-7 to 2-10. For all three projects, the input project life was estimated as 15 years, with hilly project land area leased from the BLM, a 5% interest rate for project costs, using $0.08/kWh natural gas (remote) energy, and requiring year-round operation of the treatment plant. Additionally, ECX assumed that storage of approximately 60 days of peak flow above treatment plant design capacity may be required to equalize and store produced water prior to treatment, and selected storage pond for the type of storage.
For the assessment of ASR (Figure 2-7), ECX estimated the conveyance distance to be approximately 5 miles from the location of the new treatment plant (located within the well field area) to the project site (percolation ponds outside of the nearest major city and near the well field). Potential new infrastructure related to aquifer recharge includes injection wells or percolation ponds. Given the availability of land compared to the anticipated expense for constructing injection wells, ECX selected percolation ponds from the drop-down menu. ECX estimated the project area to be 71 acres (for percolation ponds, based on area provided in the Cost Template tab). Two full-time staff were estimated to be required for the produced water
Case Studies – Utilizing the Produced Water Treatment and Beneficial Use Screening Tool 2-11
(non-treatment) portion of the project, assuming somewhat fewer than would be required for the treatment plant (three, as provided by the TSM). Given the complexity of the membrane-based treatment technology, ECX assumed a fairly high-tech control system would be employed for the treatment plant and produced water project. Because of the variety of current produced water disposal methods employed by ECX, which already include some beneficial uses, ECX was unable to input an estimate of the current energy required for disposal.
Table 2-2 Summary of BSM results from the screening matrix for the Powder River Basin case study. Feasibility is scored from most feasible (5) to least feasible (1).
Beneficial Use (Category No.) Feasibility Potential
Value ($/bbl)
Treatment Equipment Capital Cost
($mil)
Power Consumption (kWh/year)
Aquifer Recharge, Storage and Recovery (Category 5)
4.7 $0.21 ‐ 0.61 $20 100,000
Fisheries (Category 4) 4.3 $0.01 ‐ 0.08 $20 100,000
Crop Irrigation (Category 2) 4.3 $0.02 ‐ 0.19 $3 4,832,200
Livestock Watering (Category 1) 4.3 n/a $0 0
Dust Control (Category 1) 4.3 $0.01 ‐ 0.12 $0 0
Constructed Wetlands (Category 3) 4.0 n/a $1 4,832,200
Impoundments (Category 1) 4.0 n/a $0 0
Potable Use (Category 5) 3.7 $0.21 ‐ 0.61 $20 100,000
Non‐Potable use (Category 2) 3.7 $0.21 ‐ 0.61 $3 4,832,200
Surface Water Discharge/ Instream Flow Augmentation (Category 4)
3.0 $0.23 ‐ 0.94 $20 100,000
Project Feasibility Color Legend
Most Feasible ‐‐‐‐‐‐‐‐‐‐‐‐‐‐‐‐‐‐‐‐‐‐‐‐‐‐‐‐‐‐‐‐‐‐‐‐‐‐‐‐‐‐‐‐‐‐‐‐‐‐‐‐‐‐‐‐‐‐‐‐‐‐‐‐‐‐‐‐‐‐‐‐‐‐‐‐‐‐‐‐‐‐‐‐‐‐‐‐‐‐‐‐‐‐‐‐‐‐‐‐‐‐‐‐‐‐‐‐‐‐‐‐‐‐‐‐‐‐‐‐‐‐‐‐‐‐‐‐‐‐‐‐‐‐‐‐‐‐‐‐‐‐‐‐‐‐‐‐‐‐‐‐‐‐‐‐‐‐‐‐‐‐‐‐‐‐‐> Least Feasible
Estimated Potential Value Legend
Greatest Potential Value ‐‐‐‐‐‐‐‐‐‐‐‐‐‐‐‐‐‐‐‐‐‐‐‐‐‐‐‐‐‐‐‐‐‐‐‐‐‐‐‐‐‐‐‐‐‐‐‐‐‐‐‐‐‐‐‐‐‐‐‐‐‐‐‐‐‐‐‐‐‐‐‐‐‐‐‐‐‐‐‐‐‐‐‐‐‐‐‐‐‐‐‐‐‐‐‐‐‐‐‐‐‐‐‐‐‐‐‐‐‐‐‐‐‐‐‐‐‐‐‐‐‐‐‐‐‐‐‐‐‐‐‐‐‐‐‐‐‐‐‐‐‐‐‐> Lowest Potential Value
Cost and Energy Color Legend
Least Cost or Lowest Energy ‐‐‐‐‐‐‐‐‐‐‐‐‐‐‐‐‐‐‐‐‐‐‐‐‐‐‐‐‐‐‐‐‐‐‐‐‐‐‐‐‐‐‐‐‐‐‐‐‐‐‐‐‐‐‐‐‐‐‐‐‐‐‐‐‐‐‐‐‐‐‐‐‐‐‐‐‐‐‐‐‐‐‐‐‐‐‐‐‐‐‐‐‐‐‐‐‐‐‐‐‐‐‐‐‐‐‐‐‐‐‐‐‐‐‐‐‐‐‐‐‐‐‐‐‐‐‐‐‐‐> Highest Cost or Highest Energy
ECX then selected the “BEM Cost Template” arrow to review the results of the cost estimate for the ASR project. First ECX reviewed the line items to verify the assumptions and costs, and
Case Studies – Utilizing the Produced Water Treatment and Beneficial Use Screening Tool 2-12
modified the cost per linear foot of pipe (to $7 per inch diameter) to more accurately reflect anticipated local conditions. Significantly, ECX eliminated the capital cost for deep well injection (for brine, under “Facility Capital Costs – Treatment Train, by changing quantity to zero1) because an injection well is already available from existing use for ion exchange wastewater disposal. This was the greatest capital cost associated with the treatment train. The resulting annualized capital and annual O&M costs were $0.24 and $0.11 per barrel of produced water, respectively, or $0.35 per barrel total. ECX then selected the “Memorialize This Scenario” button to save the results for later comparison with the next two projects.
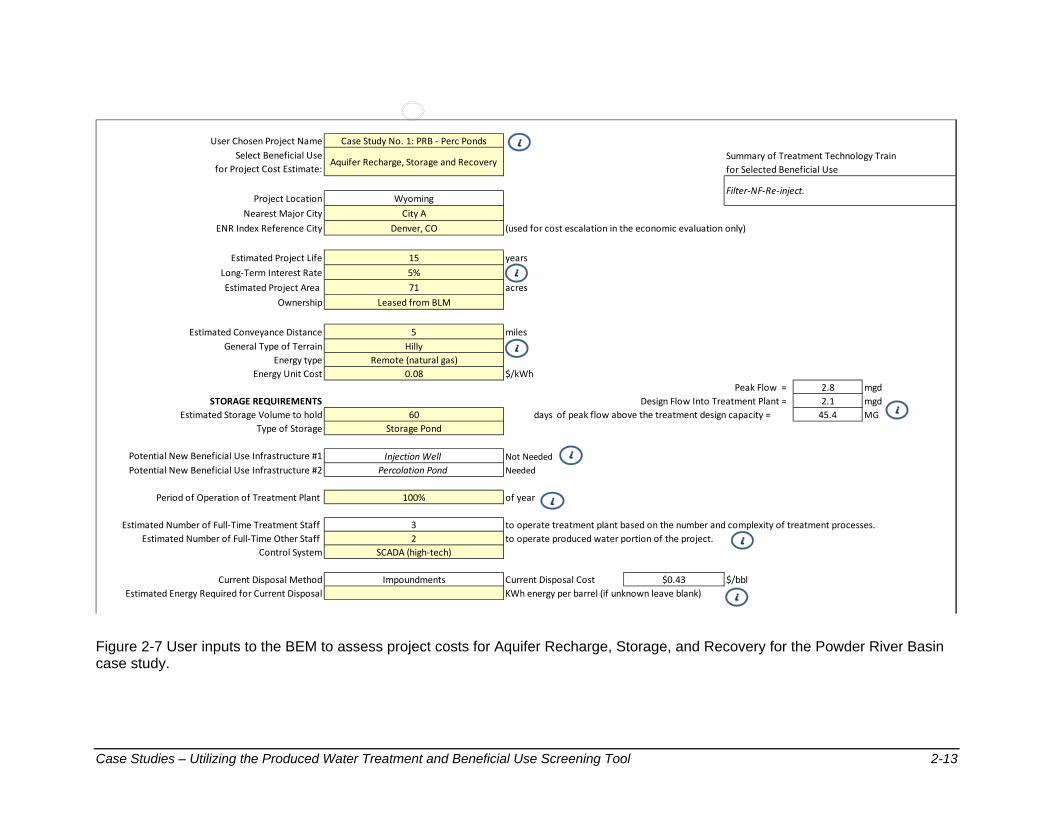
Next, ECX returned to the BEM input tab to enter the second potential project, Instream Flow Augmentation (see inputs in Figure 2-8). Similar project conditions were input, except that ECX entered a 1-acre project area (for delivery pipeline and discharge facility to the stream, as discussed on the Assumptions tab of the BEM) and a discharge facility as the potential new infrastructure. Also, ECX estimated that fewer full-time staff (one) would be required to operate the produced water portion of the project. The resulting annualized capital and annual O&M costs, after making the same corrections to the pipeline cost and deep well injection, were $0.19 and $0.07 per barrel of produced water, respectively, or $0.26 per barrel total. ECX then selected the “Memorialize This Scenario” button to save the results for comparison with the other two projects.
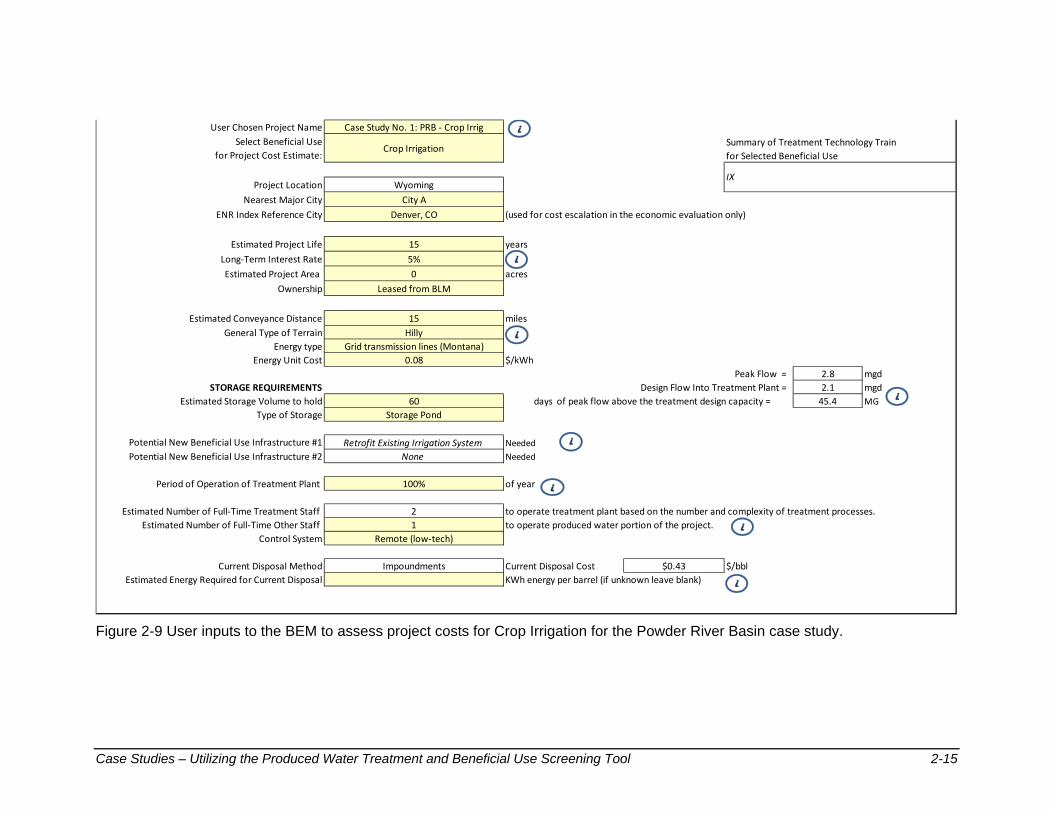
The user inputs for the third potential project, Crop Irrigation, are shown in Figure 2-9. Similar project conditions were again input, except that ECX entered a 0-acre project area (as the land to be irrigated is owned by the potential nearby customers) and a 15-mile estimated conveyance distance to deliver the treated water to local irrigators. Additionally, the potential new infrastructure consisted of retrofits to existing irrigation systems, and a low-tech control system was selected. The resulting annualized capital and annual O&M costs, after making the same correction to pipeline cost, were $0.15 and $0.12 per barrel of produced water, respectively, or $0.27 per barrel total. ECX then selected the “Memorialize This Scenario” button to save the results for comparison with the other two projects.
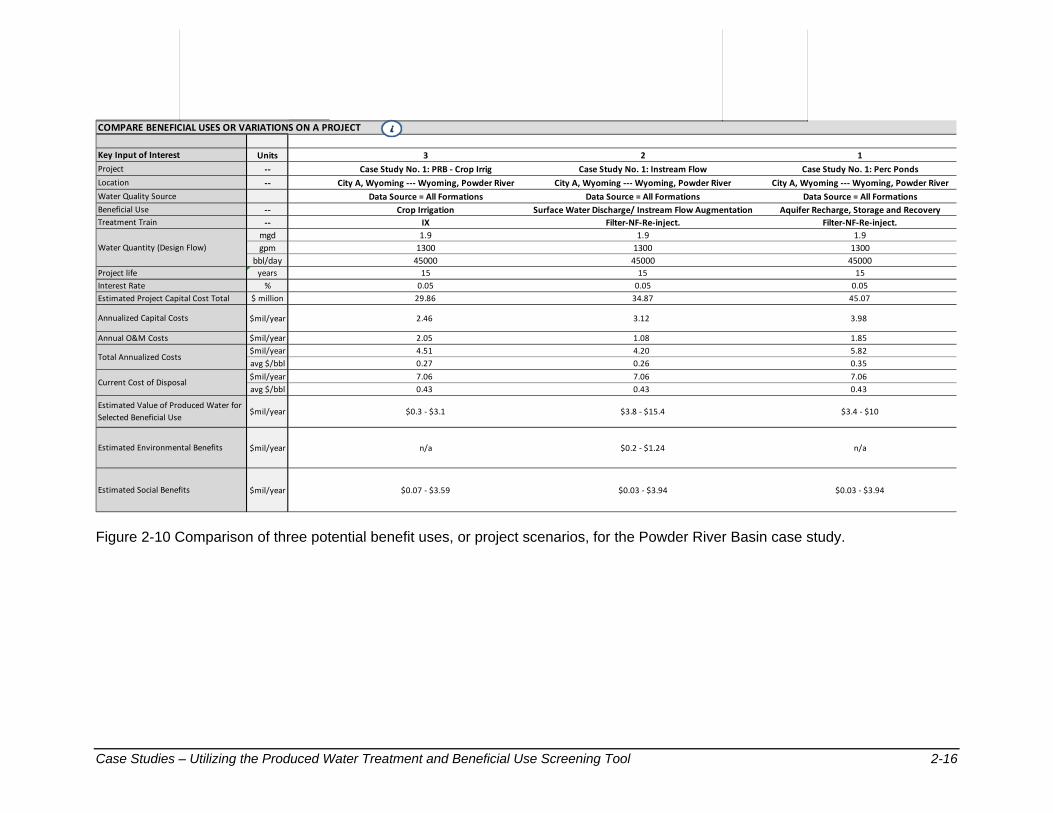
Summary reviews of the three projects were available in the “Compare Scenarios” tab of the BEM and are shown in Figure 2-10. The estimated project capital costs, which included costs for the treatment technology and additional beneficial use project costs, increased from $30 million for Crop Irrigation to $35 million for Instream Flow and $45 million for ASR. On an annualized basis, these capital costs are equivalent to $2.5, $3.1, and $4.0 million per year, respectively. The annual O&M costs are estimated as $2.0, $1.1, and $1.9 million per year, respectively. Together, the total annualized costs are estimated as $4.5 million per year (or $0.27/bbl) for Crop Irrigation, $4.2 million per year ($0.26/bbl) for Instream Flow, and $5.8 million per year ($0.35/bbl) for ASR. The estimated annualized costs for each of the three projects is less than ECX’s current estimated cost of disposal, which is $7.1 million per year ($0.43/bbl).
The estimated potential value for each beneficial use project may also be considered and is included in the summary table (Figure 2-10). These are $0.3 - $3.1 million per year for Crop Irrigation, $3.8 - $15.4 million per year for Instream Flow, and $3.4 - $10 million per year for ASR. These values could significantly offset or exceed the beneficial use project costs, if realized by seeking revenue or project cost sharing for the water supply.
1 Cell formula (that is replaced by the zero) in the “Qty” column should be restored prior to running next
scenario.
Case Studies – Utilizing the Produced Water Treatment and Beneficial Use Screening Tool 2-13
User Chosen Project Name Case Study No. 1: PRB ‐ Perc Ponds
Select Beneficial Use
for Project Cost Estimate:Aquifer Recharge, Storage and Recovery
Project Location Wyoming
Nearest Major City City A
ENR Index Reference City Denver, CO (used for cost escalation in the economic evaluation only)
Estimated Project Life 15 years
Long‐Term Interest Rate 5%
Estimated Project Area 71 acres
Ownership Leased from BLM
Estimated Conveyance Distance 5 miles
General Type of Terrain Hilly
Energy type Remote (natural gas)
Energy Unit Cost 0.08 $/kWh
Peak Flow = 2.8 mgd
STORAGE REQUIREMENTS Design Flow Into Treatment Plant = 2.1 mgd
Estimated Storage Volume to hold 60 days of peak flow above the treatment design capacity = 45.4 MG
Type of Storage Storage Pond
Potential New Beneficial Use Infrastructure #1 Injection WellPotential New Beneficial Use Infrastructure #2 Percolation Pond
Period of Operation of Treatment Plant 100% of year
Estimated Number of Full‐Time Treatment Staff 3 to operate treatment plant based on the number and complexity of treatment processes.
Estimated Number of Full‐Time Other Staff 2 to operate produced water portion of the project.
Control System SCADA (high‐tech)
Current Disposal Method Impoundments Current Disposal Cost $0.43 $/bbl
Estimated Energy Required for Current Disposal KWh energy per barrel (if unknown leave blank)
Not Needed
Needed
Filter‐NF‐Re‐inject.
Summary of Treatment Technology Train
for Selected Beneficial Use
i
i
i
i
i
i
i
i
Figure 2-7 User inputs to the BEM to assess project costs for Aquifer Recharge, Storage, and Recovery for the Powder River Basin case study.
Case Studies – Utilizing the Produced Water Treatment and Beneficial Use Screening Tool 2-14
User Chosen Project Name Case Study No. 1: PRB ‐ Instream Flow
Select Beneficial Use
for Project Cost Estimate:
Surface Water Discharge/ Instream Flow
Augmentation
Project Location Wyoming
Nearest Major City City A
ENR Index Reference City Denver, CO (used for cost escalation in the economic evaluation only)
Estimated Project Life 15 years
Long‐Term Interest Rate 5%
Estimated Project Area 1 acres
Ownership Leased from BLM
Estimated Conveyance Distance 5 miles
General Type of Terrain Hilly
Energy type Remote (natural gas)
Energy Unit Cost 0.08 $/kWh
Peak Flow = 2.8 mgd
STORAGE REQUIREMENTS Design Flow Into Treatment Plant = 2.1 mgd
Estimated Storage Volume to hold 60 days of peak flow above the treatment design capacity = 45.4 MG
Type of Storage Storage Pond
Potential New Beneficial Use Infrastructure #1 Discharge Facility to StreamPotential New Beneficial Use Infrastructure #2 None
Period of Operation of Treatment Plant 100% of year
Estimated Number of Full‐Time Treatment Staff 3 to operate treatment plant based on the number and complexity of treatment processes.
Estimated Number of Full‐Time Other Staff 1 to operate produced water portion of the project.
Control System SCADA (high‐tech)
Current Disposal Method Impoundments Current Disposal Cost $0.43 $/bbl
Estimated Energy Required for Current Disposal KWh energy per barrel (if unknown leave blank)
Needed
Needed
Filter‐NF‐Re‐inject.
Summary of Treatment Technology Train
for Selected Beneficial Use
i
i
i
i
i
i
i
i
Figure 2-8 User inputs to the BEM to assess project costs for Surface Water Discharge / Instream Flow Augmentation for the Powder River Basin case study.
Case Studies – Utilizing the Produced Water Treatment and Beneficial Use Screening Tool 2-15
User Chosen Project Name Case Study No. 1: PRB ‐ Crop Irrig
Select Beneficial Use
for Project Cost Estimate:Crop Irrigation
Project Location Wyoming
Nearest Major City City A
ENR Index Reference City Denver, CO (used for cost escalation in the economic evaluation only)
Estimated Project Life 15 years
Long‐Term Interest Rate 5%
Estimated Project Area 0 acres
Ownership Leased from BLM
Estimated Conveyance Distance 15 miles
General Type of Terrain Hilly
Energy type Grid transmission lines (Montana)
Energy Unit Cost 0.08 $/kWh
Peak Flow = 2.8 mgd
STORAGE REQUIREMENTS Design Flow Into Treatment Plant = 2.1 mgd
Estimated Storage Volume to hold 60 days of peak flow above the treatment design capacity = 45.4 MG
Type of Storage Storage Pond
Potential New Beneficial Use Infrastructure #1 Retrofit Existing Irrigation SystemPotential New Beneficial Use Infrastructure #2 None
Period of Operation of Treatment Plant 100% of year
Estimated Number of Full‐Time Treatment Staff 2 to operate treatment plant based on the number and complexity of treatment processes.
Estimated Number of Full‐Time Other Staff 1 to operate produced water portion of the project.
Control System Remote (low‐tech)
Current Disposal Method Impoundments Current Disposal Cost $0.43 $/bbl
Estimated Energy Required for Current Disposal KWh energy per barrel (if unknown leave blank)
Needed
Needed
IX
Summary of Treatment Technology Train
for Selected Beneficial Use
i
i
i
i
i
i
i
i
Figure 2-9 User inputs to the BEM to assess project costs for Crop Irrigation for the Powder River Basin case study.
Case Studies – Utilizing the Produced Water Treatment and Beneficial Use Screening Tool 2-16
COMPARE BENEFICIAL USES OR VARIATIONS ON A PROJECT
Units 3 2 1
‐‐ Case Study No. 1: PRB ‐ Crop Irrig Case Study No. 1: Instream Flow Case Study No. 1: Perc Ponds
‐‐ City A, Wyoming ‐‐‐ Wyoming, Powder River City A, Wyoming ‐‐‐ Wyoming, Powder River City A, Wyoming ‐‐‐ Wyoming, Powder River
Data Source = All Formations Data Source = All Formations Data Source = All Formations
‐‐ Crop Irrigation Surface Water Discharge/ Instream Flow Augmentation Aquifer Recharge, Storage and Recovery
‐‐ IX Filter‐NF‐Re‐inject. Filter‐NF‐Re‐inject.
mgd 1.9 1.9 1.9
gpm 1300 1300 1300
bbl/day 45000 45000 45000
years 15 15 15
% 0.05 0.05 0.05
$ million 29.86 34.87 45.07
$mil/year 2.46 3.12 3.98
$mil/year 2.05 1.08 1.85
$mil/year 4.51 4.20 5.82
avg $/bbl 0.27 0.26 0.35
$mil/year 7.06 7.06 7.06
avg $/bbl 0.43 0.43 0.43
$mil/year $0.3 ‐ $3.1 $3.8 ‐ $15.4 $3.4 ‐ $10
$mil/year n/a $0.2 ‐ $1.24 n/a
$mil/year $0.07 ‐ $3.59 $0.03 ‐ $3.94 $0.03 ‐ $3.94
Key Input of Interest
Project
Location
Beneficial Use
Project life
Water Quality Source
Water Quantity (Design Flow)
Treatment Train
Estimated Project Capital Cost Total
Annualized Capital Costs
Annual O&M Costs
Interest Rate
Total Annualized Costs
Estimated Value of Produced Water for
Selected Beneficial Use
Estimated Environmental Benefits
Estimated Social Benefits
Current Cost of Disposal
i
Figure 2-10 Comparison of three potential benefit uses, or project scenarios, for the Powder River Basin case study.
Case Studies – Utilizing the Produced Water Treatment and Beneficial Use Screening Tool 3-1
Section 3: San Juan Basin (Case Study No. 2)
Y Energy Company (YEC) is a hypothetical energy company that operates multiple well fields for CBM extraction in the San Juan Basin in New Mexico. The San Juan River runs through the area and northwest into Utah, where it joins the Colorado River at Lake Powell. The focus of the present case study is a 550-square mile area in which YEC operates over 1,500 wells, with continual development of new wells via increasing well density and development in new areas.
YEC used the Screening Tool to evaluate treatment technologies and project costs associated with potential beneficial uses. Each of the four modules (Water Quality, Treatment Selection, Beneficial Use Selection, and Beneficial Use Economic Modules) was run using YEC inputs.
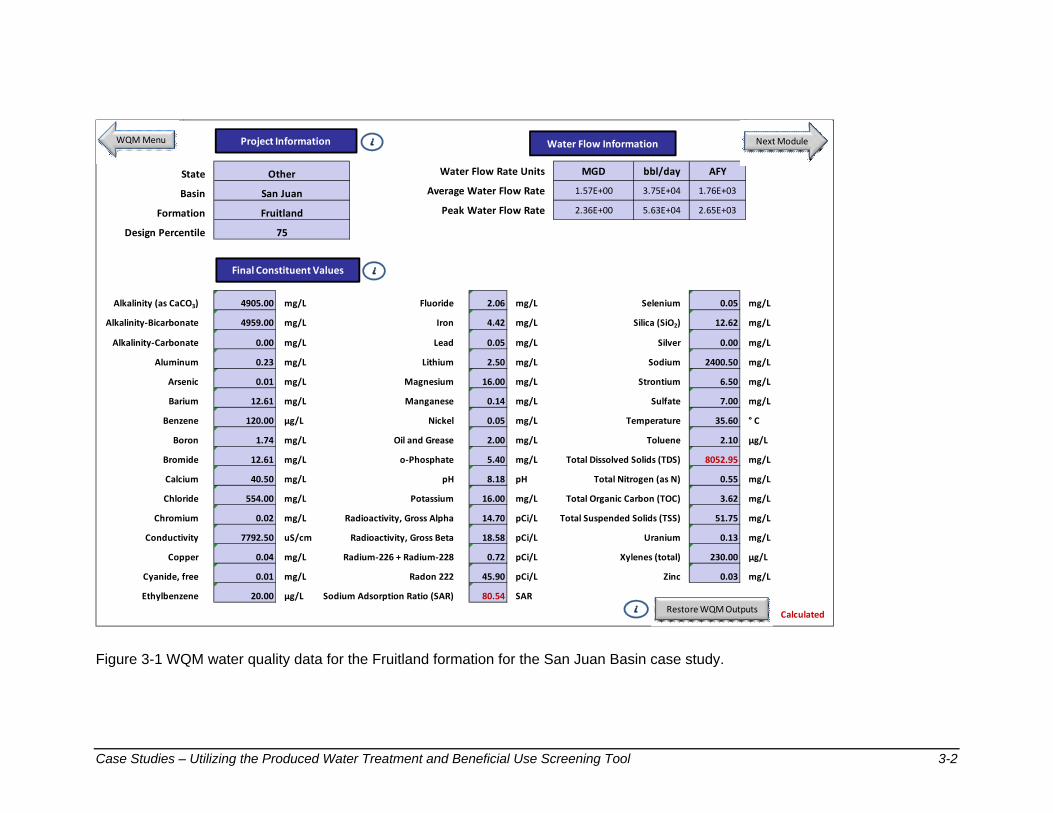
3.1 Water Quality Module Based on the location of their operations, YEC input the state (Other), basin (San Juan), and target formation (Fruitland) for the required Project Information in the WQM. A design percentile of 75% was selected in order to be fairly conservative with respect to the anticipated water quality of the produced water, to account for the fact that the water quality may change over time or be more variable than anticipated. Also input were the total average (37,500 bbl/day) and peak (56,250 bbl/day) daily water flow rates estimated for YEC operations. YEC estimated the peak water flow rate as a 50% increase of the average flow rate, to account for the fact that additional wells may be operated at certain times (the peak flow rate estimate will determine the required size of the influent storage facility for the treatment plant in the BEM).
Rather than entering site-specific well data, YEC utilized the default water quality data available in the Screening Tool as an estimate. YEC selected “WQM Output” to review the default data, which is based on the user input basin and formation. This water quality data is presented in Figure 3-1. YEC then selected “Next Module” to proceed to the TSM.
3.2 Treatment Selection Module Using the Screening Tool’s TSM, YEC identified potential technologies to treat the produced water (having influent quality obtained from the WQM) to levels appropriate for different beneficial uses.
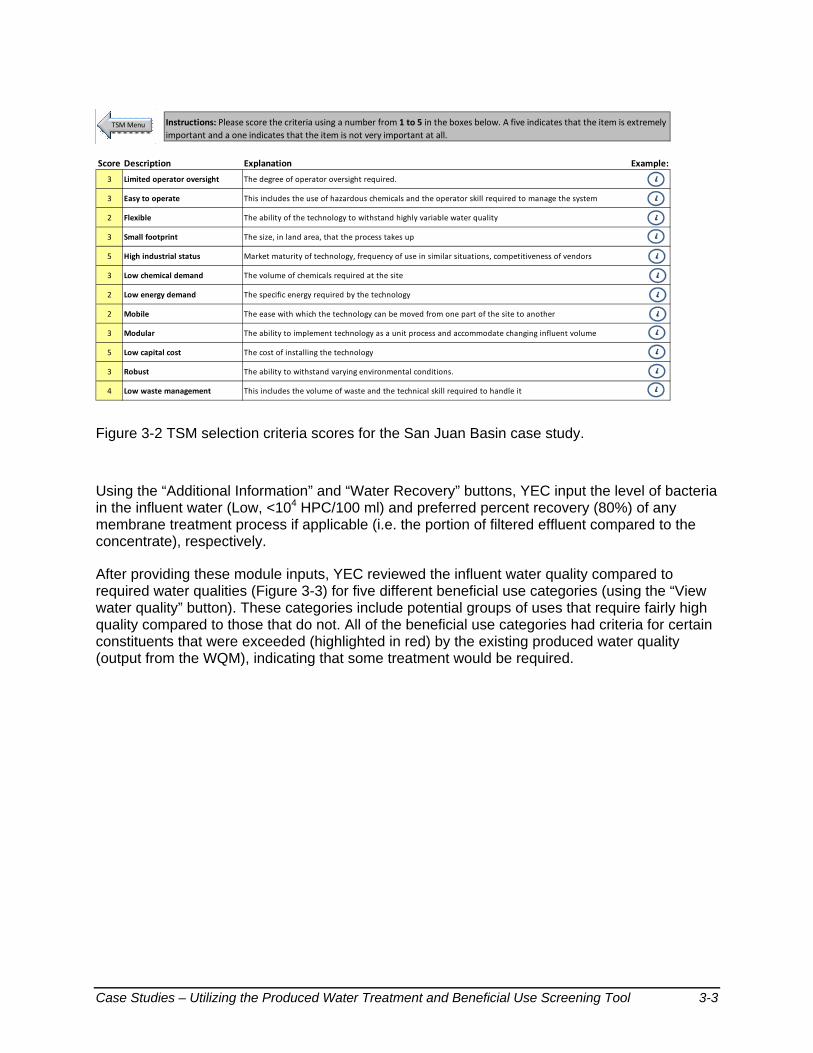
First, YEC scored 12 screening criteria (Figure 3-2) to ensure that the treatment technologies recommended by the Screening Tool would be appropriate for YEC’s operations. The screening criteria “Flexible”, “Low Energy Demand”, and “Mobile” were given relatively low scores, because they were not considered very important (changes to produced water quality are not anticipated, energy is available at a reasonable cost, and the treatment system is unlikely to need to be moved). “Low capital cost” was rated very highly to minimize cost, as well as “High industrial status” to favor a more mature technology. Other criteria were given moderate to fairly high scores.
Case Studies – Utilizing the Produced Water Treatment and Beneficial Use Screening Tool 3-2
Water Flow Rate Units MGD bbl/day
Average Water Flow Rate 1.57E+00 3.75E+04
Peak Water Flow Rate 2.36E+00 5.63E+04
4905.00 mg/L 2.06 mg/L 0.05 mg/L
4959.00 mg/L 4.42 mg/L 12.62 mg/L
0.00 mg/L 0.05 mg/L 0.00 mg/L
0.23 mg/L 2.50 mg/L 2400.50 mg/L
0.01 mg/L 16.00 mg/L 6.50 mg/L
12.61 mg/L 0.14 mg/L 7.00 mg/L
120.00 µg/L 0.05 mg/L 35.60 ° C
1.74 mg/L 2.00 mg/L 2.10 µg/L
12.61 mg/L 5.40 mg/L 8052.95 mg/L
40.50 mg/L 8.18 pH 0.55 mg/L
554.00 mg/L 16.00 mg/L 3.62 mg/L
0.02 mg/L 14.70 pCi/L 51.75 mg/L
7792.50 uS/cm 18.58 pCi/L 0.13 mg/L
0.04 mg/L 0.72 pCi/L 230.00 µg/L
0.01 mg/L 45.90 pCi/L 0.03 mg/L
20.00 µg/L 80.54 SAR
Calculated
Arsenic
Barium
Ethylbenzene
Formation
Bromide
Calcium
Chloride
Chromium
Cyanide, free
Benzene
Aluminum
Basin
State Other
San Juan
Fruitland
Design Percentile 75
Alkalinity (as CaCO3)
Alkalinity‐Bicarbonate
Alkalinity‐Carbonate
Radium‐226 + Radium‐228
Radon 222
Fluoride
Lithium
Conductivity
Nickel
Oil and Grease
o‐Phosphate
Copper
Boron
Sodium Adsorption Ratio (SAR)
Selenium
Silica (SiO2)
AFY
1.76E+03
2.65E+03
Lead
Iron
Silver
Sodium
Strontium
pH Total Nitrogen (as N)
Magnesium
Manganese
Zinc
Sulfate
Temperature
Toluene
Total Dissolved Solids (TDS)
Xylenes (total)
Uranium
Potassium
Radioactivity, Gross Alpha
Radioactivity, Gross Beta
Total Organic Carbon (TOC)
Total Suspended Solids (TSS)
Project Information
Final Constituent Values
NextModuleWater Flow Information
i
iWQM Menu
Restore WQM Outputsi
Figure 3-1 WQM water quality data for the Fruitland formation for the San Juan Basin case study.
Case Studies – Utilizing the Produced Water Treatment and Beneficial Use Screening Tool 3-3
Score Description Explanation Example:
3
3 Easy to operate
2 Flexible
3 Small footprint
5 High industrial status
3 The volume of chemicals required at the site
2
2 Mobile
3 Modular
5 Low capital cost
3 Robust
4 Low waste management
Instructions: Please score the criteria using a number from 1 to 5 in the boxes below. A five indicates that the item is extremely
important and a one indicates that the item is not very important at all.
Low energy demand
Limited operator oversight
Low chemical demand
The ability to withstand varying environmental conditions.
The degree of operator oversight required.
This includes the use of hazardous chemicals and the operator skill required to manage the system
The ability of the technology to withstand highly variable water quality
The size, in land area, that the process takes up
This includes the volume of waste and the technical skill required to handle it
Market maturity of technology, frequency of use in similar situations, competitiveness of vendors
The specific energy required by the technology
The ease with which the technology can be moved from one part of the site to another
The ability to implement technology as a unit process and accommodate changing influent volume
The cost of installing the technology
TSM Menu
i
i
i
i
i
i
i
i
i
i
i
i
Figure 3-2 TSM selection criteria scores for the San Juan Basin case study.
Using the “Additional Information” and “Water Recovery” buttons, YEC input the level of bacteria in the influent water (Low, <104 HPC/100 ml) and preferred percent recovery (80%) of any membrane treatment process if applicable (i.e. the portion of filtered effluent compared to the concentrate), respectively.
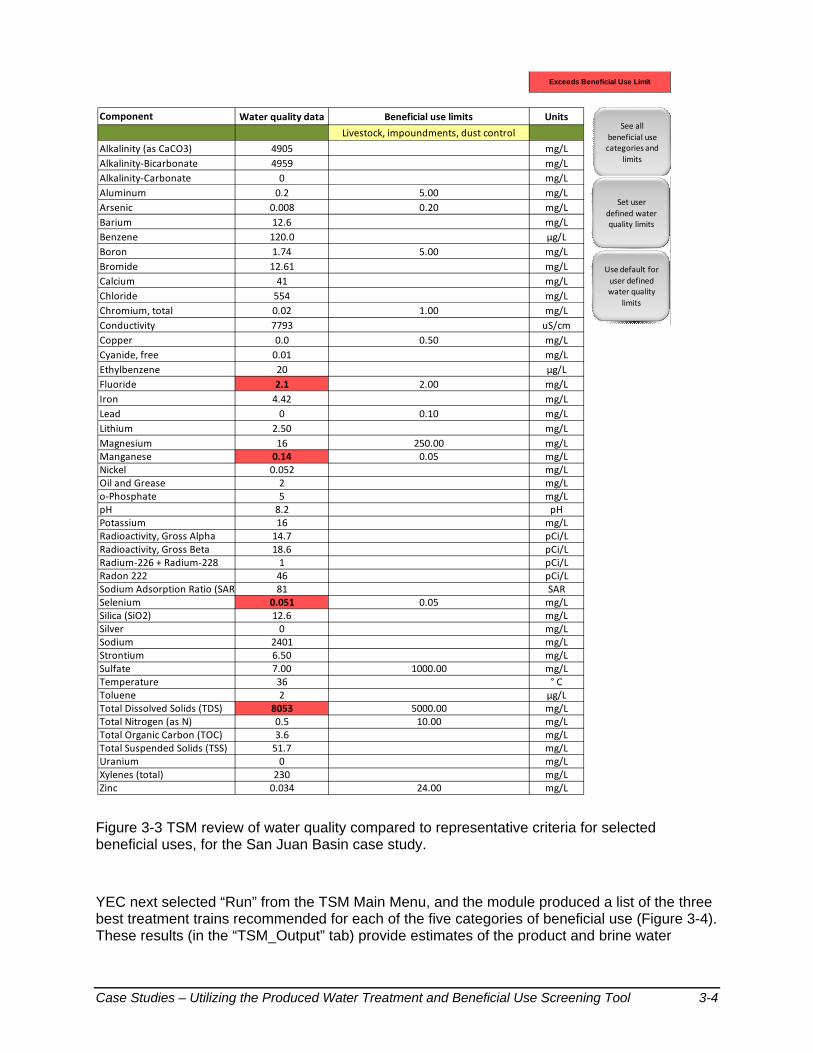
After providing these module inputs, YEC reviewed the influent water quality compared to required water qualities (Figure 3-3) for five different beneficial use categories (using the “View water quality” button). These categories include potential groups of uses that require fairly high quality compared to those that do not. All of the beneficial use categories had criteria for certain constituents that were exceeded (highlighted in red) by the existing produced water quality (output from the WQM), indicating that some treatment would be required.
Case Studies – Utilizing the Produced Water Treatment and Beneficial Use Screening Tool 3-4
Water quality data Beneficial use limits Units
Livestock, impoundments, dust control W
QAlkalinity (as CaCO3) 4905 mg/L
Alkalinity‐Bicarbonate 4959 mg/L
Alkalinity‐Carbonate 0 mg/L
Aluminum 0.2 5.00 mg/L
Arsenic 0.008 0.20 mg/L
Barium 12.6 mg/L
Benzene 120.0 µg/L
Boron 1.74 5.00 mg/L
Bromide 12.61 mg/L
Calcium 41 mg/L
Chloride 554 mg/L
Chromium, total 0.02 1.00 mg/L
Conductivity 7793 uS/cm
Copper 0.0 0.50 mg/L
Cyanide, free 0.01 mg/L
Ethylbenzene 20 µg/L
Fluoride 2.1 2.00 mg/L
Iron 4.42 mg/L
Lead 0 0.10 mg/L
Lithium 2.50 mg/L
Magnesium 16 250.00 mg/LManganese 0.14 0.05 mg/LNickel 0.052 mg/LOil and Grease 2 mg/Lo‐Phosphate 5 mg/LpH 8.2 pHPotassium 16 mg/LRadioactivity, Gross Alpha 14.7 pCi/LRadioactivity, Gross Beta 18.6 pCi/LRadium‐226 + Radium‐228 1 pCi/LRadon 222 46 pCi/LSodium Adsorption Ratio (SAR 81 SARSelenium 0.051 0.05 mg/LSilica (SiO2) 12.6 mg/LSilver 0 mg/LSodium 2401 mg/LStrontium 6.50 mg/LSulfate 7.00 1000.00 mg/LTemperature 36 ° CToluene 2 µg/LTotal Dissolved Solids (TDS) 8053 5000.00 mg/LTotal Nitrogen (as N) 0.5 10.00 mg/LTotal Organic Carbon (TOC) 3.6 mg/LTotal Suspended Solids (TSS) 51.7 mg/LUranium 0 mg/LXylenes (total) 230 mg/LZinc 0.034 24.00 mg/L
Component
Exceeds Beneficial Use Limit
See all
beneficial use categories and
limits
Set user
defined water quality limits
Use default for
user defined water quality
limits
Figure 3-3 TSM review of water quality compared to representative criteria for selected beneficial uses, for the San Juan Basin case study.
YEC next selected “Run” from the TSM Main Menu, and the module produced a list of the three best treatment trains recommended for each of the five categories of beneficial use (Figure 3-4). These results (in the “TSM_Output” tab) provide estimates of the product and brine water
Case Studies – Utilizing the Produced Water Treatment and Beneficial Use Screening Tool 3-5
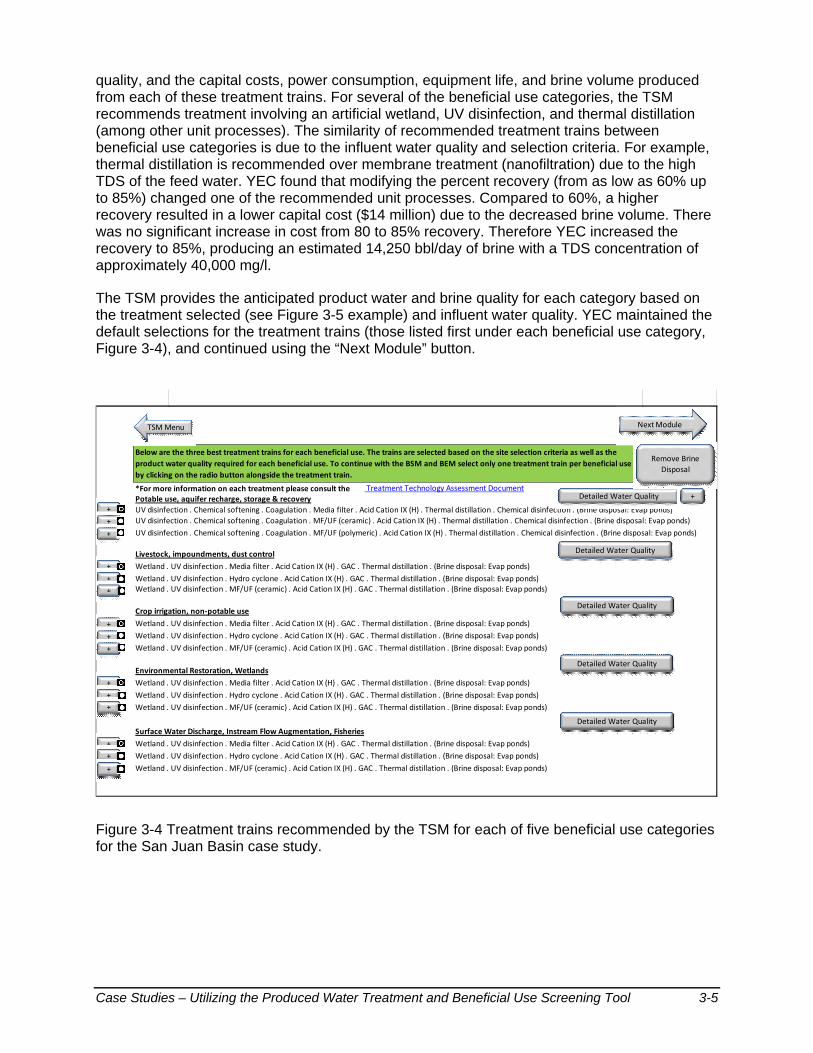
quality, and the capital costs, power consumption, equipment life, and brine volume produced from each of these treatment trains. For several of the beneficial use categories, the TSM recommends treatment involving an artificial wetland, UV disinfection, and thermal distillation (among other unit processes). The similarity of recommended treatment trains between beneficial use categories is due to the influent water quality and selection criteria. For example, thermal distillation is recommended over membrane treatment (nanofiltration) due to the high TDS of the feed water. YEC found that modifying the percent recovery (from as low as 60% up to 85%) changed one of the recommended unit processes. Compared to 60%, a higher recovery resulted in a lower capital cost ($14 million) due to the decreased brine volume. There was no significant increase in cost from 80 to 85% recovery. Therefore YEC increased the recovery to 85%, producing an estimated 14,250 bbl/day of brine with a TDS concentration of approximately 40,000 mg/l.
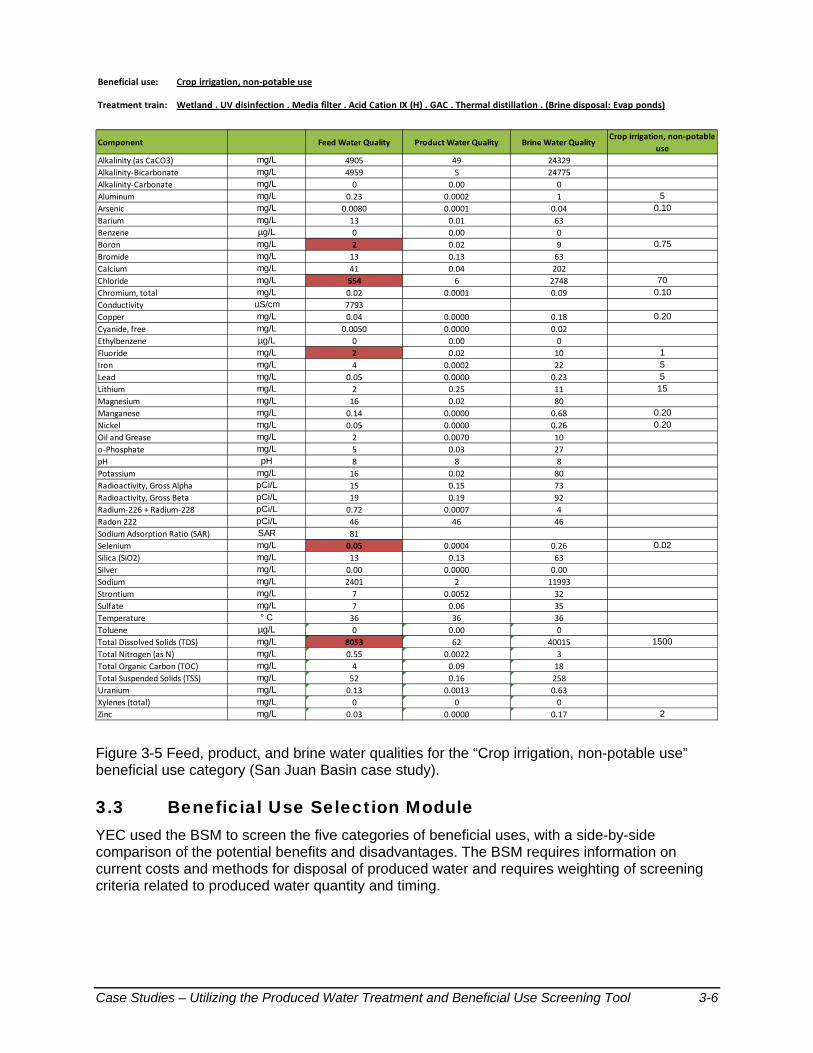
The TSM provides the anticipated product water and brine quality for each category based on the treatment selected (see Figure 3-5 example) and influent water quality. YEC maintained the default selections for the treatment trains (those listed first under each beneficial use category, Figure 3-4), and continued using the “Next Module” button.
Treatment Technology Assessment Document
Potable use, aquifer recharge, storage & recovery
UV disinfection . Chemical softening . Coagulation . Media filter . Acid Cation IX (H) . Thermal distillation . Chemical disinfection . (Brine disposal: Evap ponds)
UV disinfection . Chemical softening . Coagulation . MF/UF (ceramic) . Acid Cation IX (H) . Thermal distillation . Chemical disinfection . (Brine disposal: Evap ponds)
UV disinfection . Chemical softening . Coagulation . MF/UF (polymeric) . Acid Cation IX (H) . Thermal distillation . Chemical disinfection . (Brine disposal: Evap ponds)
Livestock, impoundments, dust control
Wetland . UV disinfection . Media filter . Acid Cation IX (H) . GAC . Thermal distillation . (Brine disposal: Evap ponds)
Wetland . UV disinfection . Hydro cyclone . Acid Cation IX (H) . GAC . Thermal distillation . (Brine disposal: Evap ponds)Wetland . UV disinfection . MF/UF (ceramic) . Acid Cation IX (H) . GAC . Thermal distillation . (Brine disposal: Evap ponds)
Crop irrigation, non‐potable use
Wetland . UV disinfection . Media filter . Acid Cation IX (H) . GAC . Thermal distillation . (Brine disposal: Evap ponds)
Wetland . UV disinfection . Hydro cyclone . Acid Cation IX (H) . GAC . Thermal distillation . (Brine disposal: Evap ponds)
Wetland . UV disinfection . MF/UF (ceramic) . Acid Cation IX (H) . GAC . Thermal distillation . (Brine disposal: Evap ponds)
Environmental Restoration, Wetlands
Wetland . UV disinfection . Media filter . Acid Cation IX (H) . GAC . Thermal distillation . (Brine disposal: Evap ponds)
Wetland . UV disinfection . Hydro cyclone . Acid Cation IX (H) . GAC . Thermal distillation . (Brine disposal: Evap ponds)
Wetland . UV disinfection . MF/UF (ceramic) . Acid Cation IX (H) . GAC . Thermal distillation . (Brine disposal: Evap ponds)
Surface Water Discharge, Instream Flow Augmentation, Fisheries
Wetland . UV disinfection . Media filter . Acid Cation IX (H) . GAC . Thermal distillation . (Brine disposal: Evap ponds)
Wetland . UV disinfection . Hydro cyclone . Acid Cation IX (H) . GAC . Thermal distillation . (Brine disposal: Evap ponds)
Wetland . UV disinfection . MF/UF (ceramic) . Acid Cation IX (H) . GAC . Thermal distillation . (Brine disposal: Evap ponds)
*For more information on each treatment please consult the
Below are the three best treatment trains for each beneficial use. The trains are selected based on the site selection criteria as well as the
product water quality required for each beneficial use. To continue with the BSM and BEM select only one treatment train per beneficial use
by clicking on the radio button alongside the treatment train.
Detailed Water Quality
Detailed Water Quality
Detailed Water Quality
Detailed Water Quality
Detailed Water Quality
TSM Menu Next Module
Remove Brine
Disposal
+
+
+
+
+
+
+
+
+
+
+
+
+
+
+
+
Figure 3-4 Treatment trains recommended by the TSM for each of five beneficial use categories for the San Juan Basin case study.
Case Studies – Utilizing the Produced Water Treatment and Beneficial Use Screening Tool 3-6
Beneficial use: Crop irrigation, non‐potable use
Treatment train:
Component Feed Water Quality Product Water Quality Brine Water QualityCrop irrigation, non‐potable
use
Alkalinity (as CaCO3) mg/L 4905 49 24329
Alkalinity‐Bicarbonate mg/L 4959 5 24775
Alkalinity‐Carbonate mg/L 0 0.00 0
Aluminum mg/L 0.23 0.0002 1 5
Arsenic mg/L 0.0080 0.0001 0.04 0.10
Barium mg/L 13 0.01 63
Benzene µg/L 0 0.00 0
Boron mg/L 2 0.02 9 0.75
Bromide mg/L 13 0.13 63
Calcium mg/L 41 0.04 202
Chloride mg/L 554 6 2748 70
Chromium, total mg/L 0.02 0.0001 0.09 0.10
Conductivity uS/cm 7793
Copper mg/L 0.04 0.0000 0.18 0.20
Cyanide, free mg/L 0.0050 0.0000 0.02
Ethylbenzene µg/L 0 0.00 0
Fluoride mg/L 2 0.02 10 1
Iron mg/L 4 0.0002 22 5
Lead mg/L 0.05 0.0000 0.23 5Lithium mg/L 2 0.25 11 15
Magnesium mg/L 16 0.02 80
Manganese mg/L 0.14 0.0000 0.68 0.20
Nickel mg/L 0.05 0.0000 0.26 0.20
Oil and Grease mg/L 2 0.0070 10
o‐Phosphate mg/L 5 0.03 27
pH pH 8 8 8
Potassium mg/L 16 0.02 80
Radioactivity, Gross Alpha pCi/L 15 0.15 73
Radioactivity, Gross Beta pCi/L 19 0.19 92
Radium‐226 + Radium‐228 pCi/L 0.72 0.0007 4
Radon 222 pCi/L 46 46 46
Sodium Adsorption Ratio (SAR) SAR 81
Selenium mg/L 0.05 0.0004 0.26 0.02
Silica (SiO2) mg/L 13 0.13 63
Silver mg/L 0.00 0.0000 0.00
Sodium mg/L 2401 2 11993
Strontium mg/L 7 0.0052 32
Sulfate mg/L 7 0.06 35
Temperature ° C 36 36 36
Toluene µg/L 0 0.00 0
Total Dissolved Solids (TDS) mg/L 8053 62 40015 1500
Total Nitrogen (as N) mg/L 0.55 0.0022 3
Total Organic Carbon (TOC) mg/L 4 0.09 18
Total Suspended Solids (TSS) mg/L 52 0.16 258
Uranium mg/L 0.13 0.0013 0.63
Xylenes (total) mg/L 0 0 0
Zinc mg/L 0.03 0.0000 0.17 2
Wetland . UV disinfection . Media filter . Acid Cation IX (H) . GAC . Thermal distillation . (Brine disposal: Evap ponds)
Figure 3-5 Feed, product, and brine water qualities for the “Crop irrigation, non-potable use” beneficial use category (San Juan Basin case study).
3.3 Beneficial Use Selection Module YEC used the BSM to screen the five categories of beneficial uses, with a side-by-side comparison of the potential benefits and disadvantages. The BSM requires information on current costs and methods for disposal of produced water and requires weighting of screening criteria related to produced water quantity and timing.
Case Studies – Utilizing the Produced Water Treatment and Beneficial Use Screening Tool 3-7
After selecting the “Input” button on the main menu of the BSM, YEC input the estimated current cost of produced water disposal, $2.00/bbl, and selected “Deep Well Injection” for the current method of disposal.
The three BSM screening criteria are “Water Quantity, “Supply Timing and Reliability” and “Duration of Supply”. The water quantity range (1 mgd < base flow < 5 mgd) matches the estimated produced water flow from YEC’s operations (approximately 37,500 bbl/d, or 1.6 mgd). Because the flow of produced water is expected to be fairly consistent (given that flows from many wells will be combined and equalized for treatment) and operations are expected to be long-term (15 to 20 years, and up to 30 years depending on continued development), YEC selected “Consistent base flow for 30 years” for the “Supply Timing and Reliability Range” and “Base flow for at least 30 years” for the “Duration of Supply Range”. For all three criteria, YEC was uncertain of their importance and therefore input weights of 5. YEC next selected “BSM Output”.
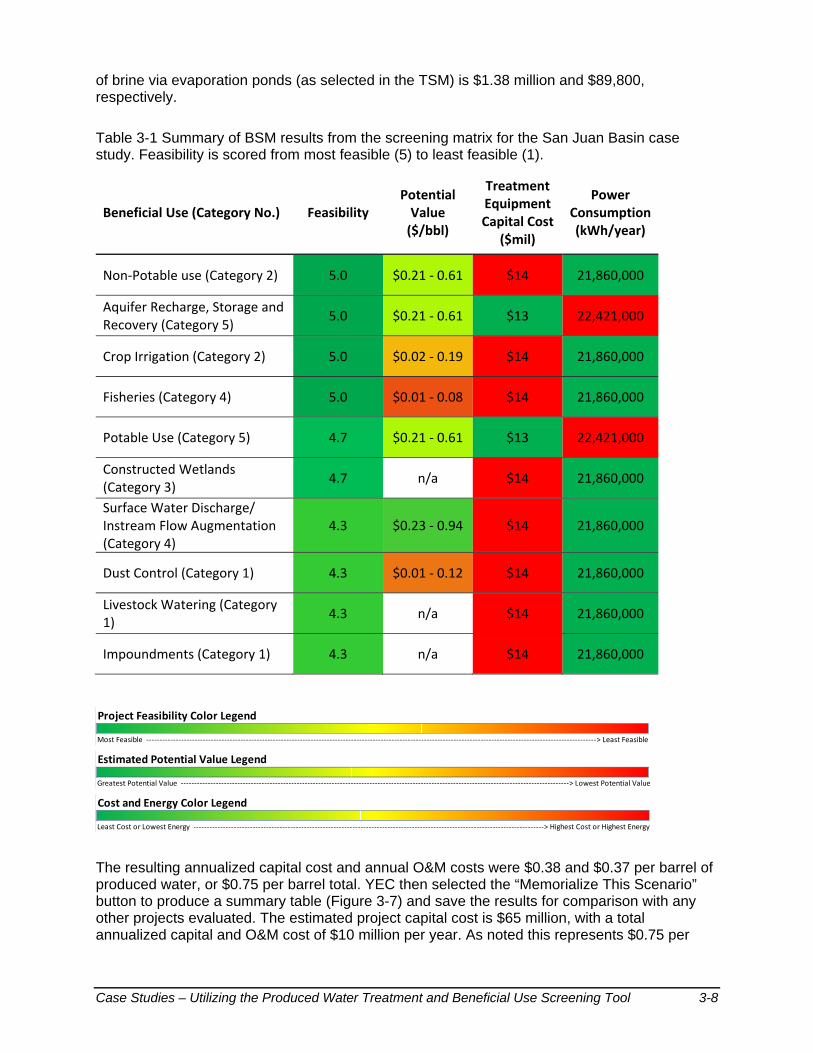
The BSM output (screening matrix) provides information on the project feasibility, potential economic value, capital cost for treatment equipment, and power consumption for each of the five beneficial use categories. The feasibility assessment takes into account the three screening criteria. A summary of the BSM output for YEC produced water is compiled in Table 3-1 in order of decreasing feasibility, using the same color-coding scheme used in the BSM. All beneficial use categories were characterized as highly feasible, given that the water quantity is large, the supply reliability is high, and the duration is long-term.
The rationale for the feasibility scores is provided on the tab “Bin Influence Graphs”. Some of the Category 1 uses (dust control and livestock watering) ranked lower in terms of feasibility. According to the BSM output, this is due to a lower feasibility score for water quantity, suggesting that the produced water supply anticipated may be significantly larger than the demand for this type of use. If Category 1 uses were to be employed by YEC, then additional beneficial uses could be evaluated to apply the excess produced water. All categories had similar capital costs and energy requirements associated with treatment due to the similar treatment trains recommended. Surface Water Discharge/Instream Flow Augmentation ranked highest in terms of potential value (i.e. to potential downstream users).
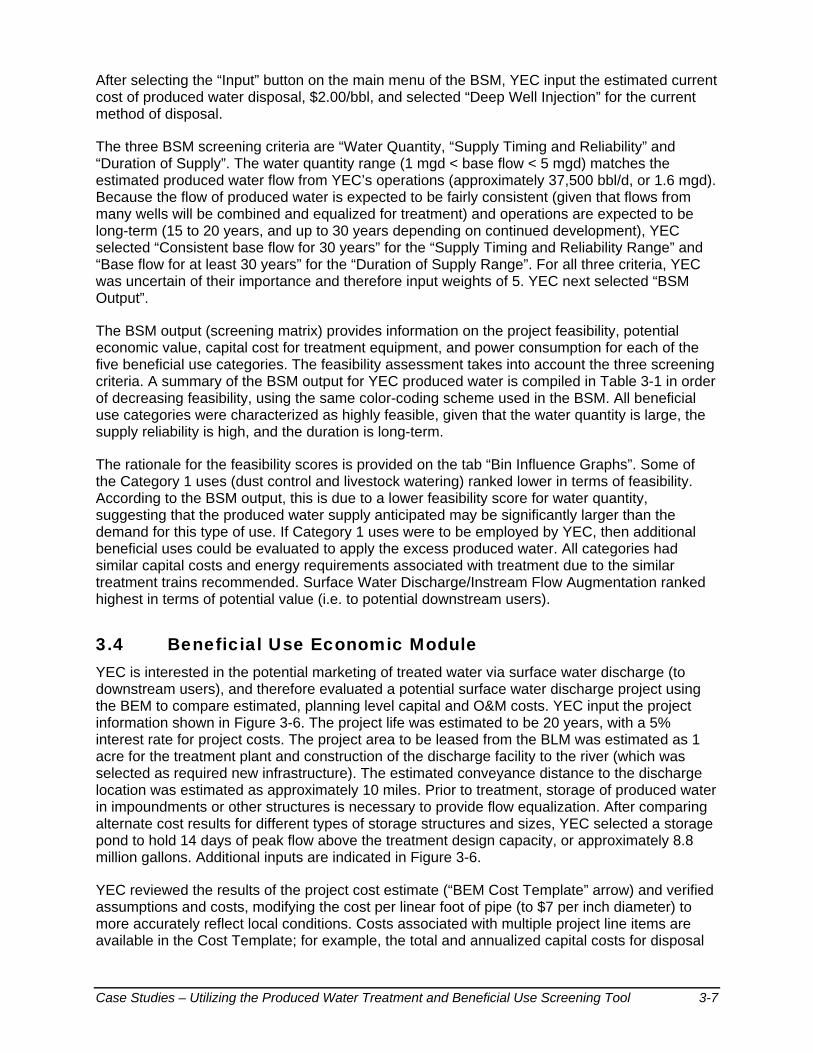
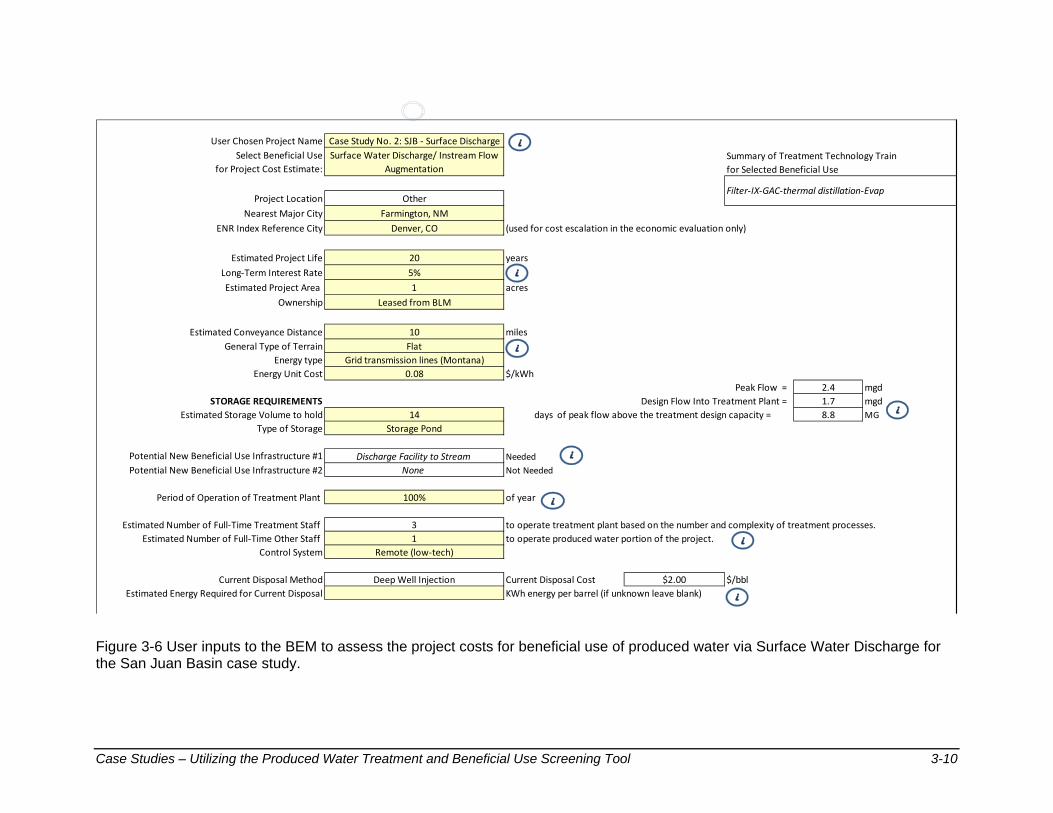
3.4 Beneficial Use Economic Module YEC is interested in the potential marketing of treated water via surface water discharge (to downstream users), and therefore evaluated a potential surface water discharge project using the BEM to compare estimated, planning level capital and O&M costs. YEC input the project information shown in Figure 3-6. The project life was estimated to be 20 years, with a 5% interest rate for project costs. The project area to be leased from the BLM was estimated as 1 acre for the treatment plant and construction of the discharge facility to the river (which was selected as required new infrastructure). The estimated conveyance distance to the discharge location was estimated as approximately 10 miles. Prior to treatment, storage of produced water in impoundments or other structures is necessary to provide flow equalization. After comparing alternate cost results for different types of storage structures and sizes, YEC selected a storage pond to hold 14 days of peak flow above the treatment design capacity, or approximately 8.8 million gallons. Additional inputs are indicated in Figure 3-6.
YEC reviewed the results of the project cost estimate (“BEM Cost Template” arrow) and verified assumptions and costs, modifying the cost per linear foot of pipe (to $7 per inch diameter) to more accurately reflect local conditions. Costs associated with multiple project line items are available in the Cost Template; for example, the total and annualized capital costs for disposal
Case Studies – Utilizing the Produced Water Treatment and Beneficial Use Screening Tool 3-8
of brine via evaporation ponds (as selected in the TSM) is $1.38 million and $89,800, respectively.
Table 3-1 Summary of BSM results from the screening matrix for the San Juan Basin case study. Feasibility is scored from most feasible (5) to least feasible (1).
Beneficial Use (Category No.) Feasibility Potential Value ($/bbl)
Treatment Equipment Capital Cost
($mil)
Power Consumption (kWh/year)
Non‐Potable use (Category 2) 5.0 $0.21 ‐ 0.61 $14 21,860,000
Aquifer Recharge, Storage and Recovery (Category 5)
5.0 $0.21 ‐ 0.61 $13 22,421,000
Crop Irrigation (Category 2) 5.0 $0.02 ‐ 0.19 $14 21,860,000
Fisheries (Category 4) 5.0 $0.01 ‐ 0.08 $14 21,860,000
Potable Use (Category 5) 4.7 $0.21 ‐ 0.61 $13 22,421,000
Constructed Wetlands (Category 3)
4.7 n/a $14 21,860,000
Surface Water Discharge/ Instream Flow Augmentation (Category 4)
4.3 $0.23 ‐ 0.94 $14 21,860,000
Dust Control (Category 1) 4.3 $0.01 ‐ 0.12 $14 21,860,000
Livestock Watering (Category 1)
4.3 n/a $14 21,860,000
Impoundments (Category 1) 4.3 n/a $14 21,860,000
Project Feasibility Color Legend
Most Feasible ‐‐‐‐‐‐‐‐‐‐‐‐‐‐‐‐‐‐‐‐‐‐‐‐‐‐‐‐‐‐‐‐‐‐‐‐‐‐‐‐‐‐‐‐‐‐‐‐‐‐‐‐‐‐‐‐‐‐‐‐‐‐‐‐‐‐‐‐‐‐‐‐‐‐‐‐‐‐‐‐‐‐‐‐‐‐‐‐‐‐‐‐‐‐‐‐‐‐‐‐‐‐‐‐‐‐‐‐‐‐‐‐‐‐‐‐‐‐‐‐‐‐‐‐‐‐‐‐‐‐‐‐‐‐‐‐‐‐‐‐‐‐‐‐‐‐‐‐‐‐‐‐‐‐‐‐‐‐‐‐‐‐‐‐‐‐‐> Least Feasible
Estimated Potential Value Legend
Greatest Potential Value ‐‐‐‐‐‐‐‐‐‐‐‐‐‐‐‐‐‐‐‐‐‐‐‐‐‐‐‐‐‐‐‐‐‐‐‐‐‐‐‐‐‐‐‐‐‐‐‐‐‐‐‐‐‐‐‐‐‐‐‐‐‐‐‐‐‐‐‐‐‐‐‐‐‐‐‐‐‐‐‐‐‐‐‐‐‐‐‐‐‐‐‐‐‐‐‐‐‐‐‐‐‐‐‐‐‐‐‐‐‐‐‐‐‐‐‐‐‐‐‐‐‐‐‐‐‐‐‐‐‐‐‐‐‐‐‐‐‐‐‐‐‐‐‐> Lowest Potential Value
Cost and Energy Color Legend
Least Cost or Lowest Energy ‐‐‐‐‐‐‐‐‐‐‐‐‐‐‐‐‐‐‐‐‐‐‐‐‐‐‐‐‐‐‐‐‐‐‐‐‐‐‐‐‐‐‐‐‐‐‐‐‐‐‐‐‐‐‐‐‐‐‐‐‐‐‐‐‐‐‐‐‐‐‐‐‐‐‐‐‐‐‐‐‐‐‐‐‐‐‐‐‐‐‐‐‐‐‐‐‐‐‐‐‐‐‐‐‐‐‐‐‐‐‐‐‐‐‐‐‐‐‐‐‐‐‐‐‐‐‐‐‐‐> Highest Cost or Highest Energy
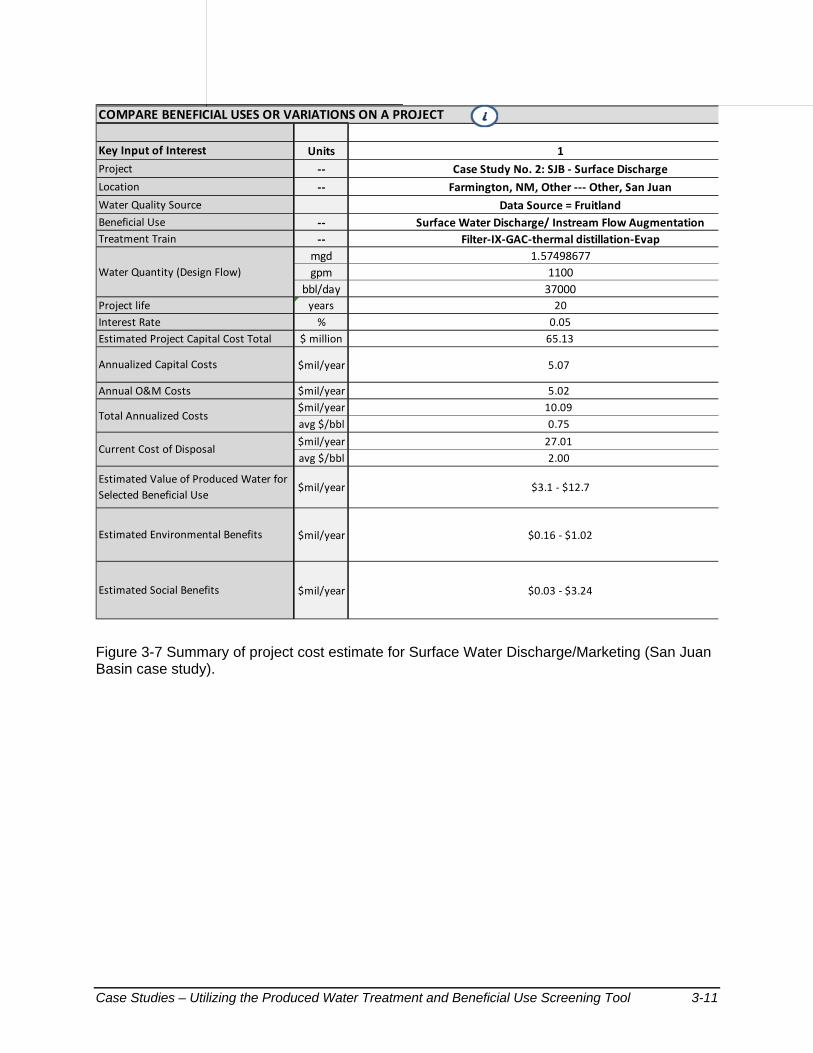
The resulting annualized capital cost and annual O&M costs were $0.38 and $0.37 per barrel of produced water, or $0.75 per barrel total. YEC then selected the “Memorialize This Scenario” button to produce a summary table (Figure 3-7) and save the results for comparison with any other projects evaluated. The estimated project capital cost is $65 million, with a total annualized capital and O&M cost of $10 million per year. As noted this represents $0.75 per
Case Studies – Utilizing the Produced Water Treatment and Beneficial Use Screening Tool 3-9
barrel of produced water, which compares to the current disposal cost of $2 per barrel ($27 million per year). The results of the BEM indicate that the potential beneficial use project may be less costly than the current disposal method.
Based on the results of the Screening Tool, YEC has an estimate of the treatment technology and associated costs that may be required for stream discharge of produced water from their San Juan Basin well fields. Further, the potential economic value (ranging $3 to $13 million per year, Figure 3-7) could significantly offset or even exceed the beneficial use project costs, if realized by seeking revenue for provision of the high quality produced water to a downstream user. Given the high demand for water and its economic value in the Colorado River Basin, interstate marketing of discharged produced water by YEC to downstream users (e.g. at Lake Powell) may be feasible.
Case Studies – Utilizing the Produced Water Treatment and Beneficial Use Screening Tool 3-10
User Chosen Project Name Case Study No. 2: SJB ‐ Surface Discharge
Select Beneficial Use
for Project Cost Estimate:
Surface Water Discharge/ Instream Flow
Augmentation
Project Location Other
Nearest Major City Farmington, NM
ENR Index Reference City Denver, CO (used for cost escalation in the economic evaluation only)
Estimated Project Life 20 years
Long‐Term Interest Rate 5%
Estimated Project Area 1 acres
Ownership Leased from BLM
Estimated Conveyance Distance 10 miles
General Type of Terrain Flat
Energy type Grid transmission lines (Montana)
Energy Unit Cost 0.08 $/kWh
Peak Flow = 2.4 mgd
STORAGE REQUIREMENTS Design Flow Into Treatment Plant = 1.7 mgd
Estimated Storage Volume to hold 14 days of peak flow above the treatment design capacity = 8.8 MG
Type of Storage Storage Pond
Potential New Beneficial Use Infrastructure #1 Discharge Facility to StreamPotential New Beneficial Use Infrastructure #2 None
Period of Operation of Treatment Plant 100% of year
Estimated Number of Full‐Time Treatment Staff 3 to operate treatment plant based on the number and complexity of treatment processes.
Estimated Number of Full‐Time Other Staff 1 to operate produced water portion of the project.
Control System Remote (low‐tech)
Current Disposal Method Deep Well Injection Current Disposal Cost $2.00 $/bbl
Estimated Energy Required for Current Disposal KWh energy per barrel (if unknown leave blank)
Needed
Not Needed
Filter‐IX‐GAC‐thermal distillation‐Evap
Summary of Treatment Technology Train
for Selected Beneficial Use
i
i
i
i
i
i
i
i
Figure 3-6 User inputs to the BEM to assess the project costs for beneficial use of produced water via Surface Water Discharge for the San Juan Basin case study.
Case Studies – Utilizing the Produced Water Treatment and Beneficial Use Screening Tool 3-11
COMPARE BENEFICIAL USES OR VARIATIONS ON A PROJECT
Units 1
‐‐ Case Study No. 2: SJB ‐ Surface Discharge
‐‐ Farmington, NM, Other ‐‐‐ Other, San Juan
Data Source = Fruitland
‐‐ Surface Water Discharge/ Instream Flow Augmentation
‐‐ Filter‐IX‐GAC‐thermal distillation‐Evap
mgd 1.57498677
gpm 1100
bbl/day 37000
years 20
% 0.05
$ million 65.13
$mil/year 5.07
$mil/year 5.02
$mil/year 10.09
avg $/bbl 0.75
$mil/year 27.01
avg $/bbl 2.00
$mil/year $3.1 ‐ $12.7
$mil/year $0.16 ‐ $1.02
$mil/year $0.03 ‐ $3.24
Key Input of Interest
Project
Location
Beneficial Use
Project life
Water Quality Source
Water Quantity (Design Flow)
Treatment Train
Estimated Project Capital Cost Total
Annualized Capital Costs
Annual O&M Costs
Interest Rate
Total Annualized Costs
Estimated Value of Produced Water for
Selected Beneficial Use
Estimated Environmental Benefits
Estimated Social Benefits
Current Cost of Disposal
i
Figure 3-7 Summary of project cost estimate for Surface Water Discharge/Marketing (San Juan Basin case study).

Case Studies – Utilizing the Produced Water Treatment and Beneficial Use Screening Tool References - I
References
AQWATEC. 2010. Produced Water Treatment and Beneficial Use Information Center: State Regulations. (Colorado School of Mines, Advanced Water Technology Center). Available: http://aqwatec.mines.edu/produced_water/regs/state/index.htm [accessed December 8 2010].
Montana DEQ. 2003. Record of Decision for Montana Statewide Oil and Gas Environmental Impact Statement, Department of Environmental Quality. Billings: Montana Board of Oil & Gas Conservation. Available: http://bogc.dnrc.state.mt.us/pdf/rodaug7_03.pdf [accessed December 14 2010].
NRC. 2010. Management and Effects of Coalbed Methane Produced Water in the Western United States. Washington, D.C.: National Research Council of the National Academies.