
CASE Network Report 95 -
62
-
Upload
case-center-for-social-and-economic-research -
Category
Documents
-
view
268 -
download
0
Transcript of CASE Network Report 95 -


CASE Network Report No.95
The views and opinions expressed here reflect the authors’ point of view and not necessarily
those of CASE Network.
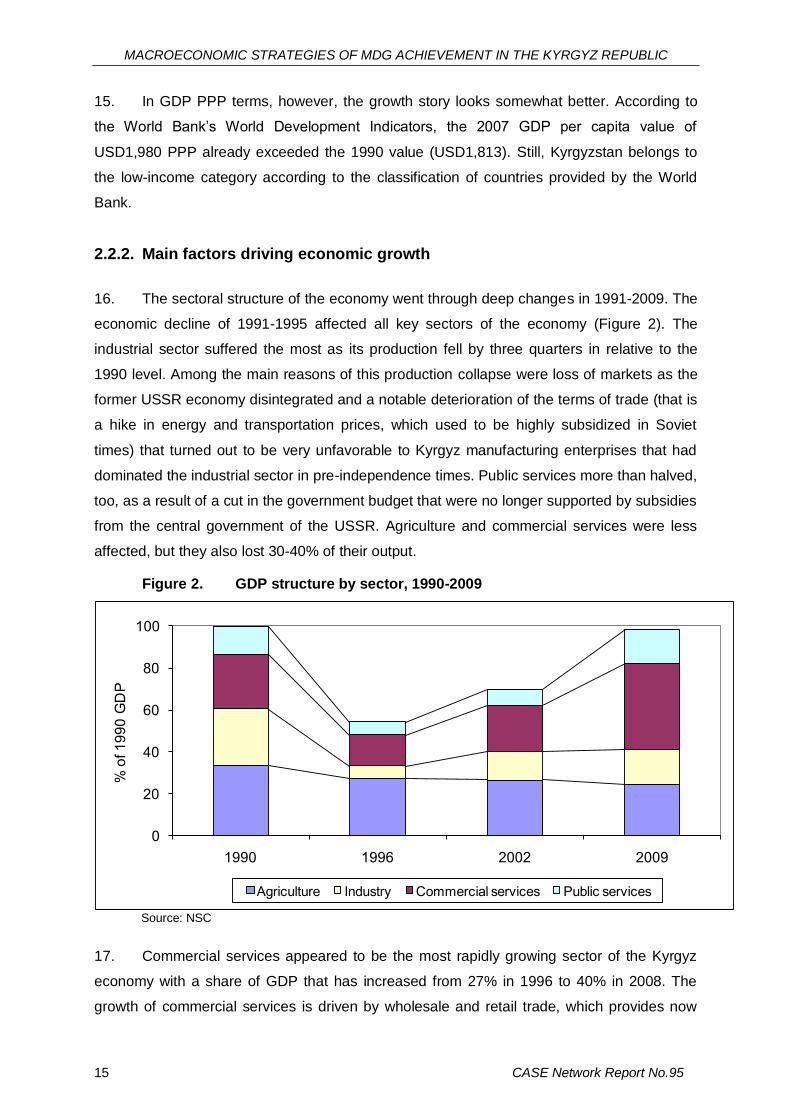
This paper has been prepared in the framework of the project “Assessing Development
Strategies to Achieve the MDGs in Asia” implemented in the Kyrgyz Republic with
methodological and financial support from the United Nations Department of Economic and
Social Affairs and the United Nations Development Programme.
This publication has been produced thanks to the financial support of the PEKAO SA.
Keywords: CGE model, Kyrgyzstan, macroeconomic policies, Millennium Development Goals JEL Codes: D58, E61, E62, H50, H51, H52, H54, H6, I1, I2, O11, O15, O53
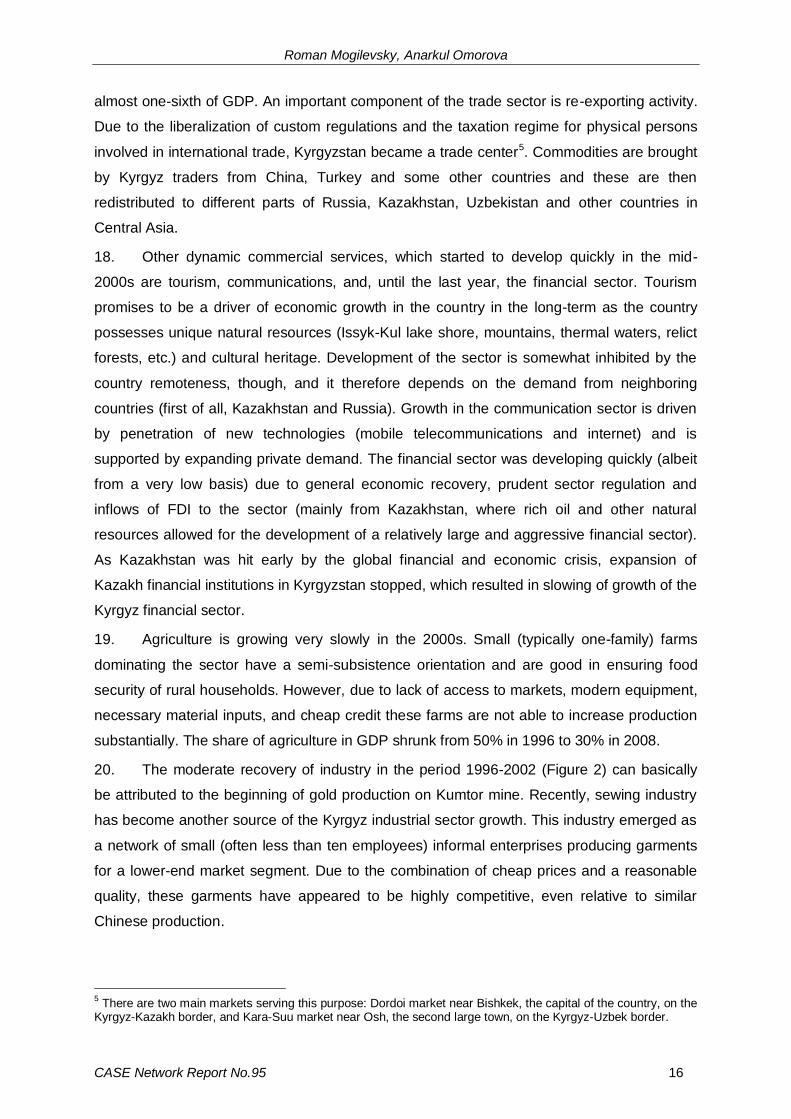
© CASE – Center for Social and Economic Research, Warsaw, 2011
Graphic Design: Agnieszka Natalia Bury
EAN 9788371785368
Publisher:
CASE-Center for Social and Economic Research on behalf of CASE Network
12 Sienkiewicza, 00-010 Warsaw, Poland
tel.: (48 22) 622 66 27, fax: (48 22) 828 60 69
e-mail: [email protected]
http://www.case-research.eu

MACROECONOMIC STRATEGIES OF MDG ACHIEVEMENT IN THE KYRGYZ REPUBLIC
2 CASE Network Report No.95
The CASE Network is a group of economic and social research centers in Poland,
Kyrgyzstan, Ukraine, Georgia, Moldova, and Belarus. Organizations in the network regularly
conduct joint research and advisory projects. The research covers a wide spectrum of
economic and social issues, including economic effects of the European integration process,
economic relations between the EU and CIS, monetary policy and euro-accession,
innovation and competitiveness, and labour markets and social policy. The network aims to
increase the range and quality of economic research and information available to policy-
makers and civil society, and takes an active role in on-going debates on how to meet the
economic challenges facing the EU, post-transition countries and the global economy.
The CASE Network consists of:
• CASE – Center for Social and Economic Research, Warsaw, est. 1991,
www.case-research.eu
• CASE – Center for Social and Economic Research – Kyrgyzstan, est.
1998, www.case.elcat.kg
• Center for Social and Economic Research - CASE Ukraine, est. 1999,
www.case-ukraine.kiev.ua
• CASE –Transcaucasus Center for Social and Economic Research, est.
2000, www.case-transcaucasus.org.ge
• Foundation for Social and Economic Research CASE Moldova, est.
2003, www.case.com.md
• CASE Belarus - Center for Social and Economic Research Belarus, est.
2007

MACROECONOMIC STRATEGIES OF MDG ACHIEVEMENT IN THE KYRGYZ REPUBLIC
3 CASE Network Report No.95
Contents
Abbreviations ................................................................................................................................ 5
Abstract.......................................................................................................................................... 7
Executive Summary ...................................................................................................................... 8
1. Introduction ...................................................................................................................... 10
2. Macroeconomic policies and economic performance in 1991-2009 ............................ 12
2.1. Economic reforms and policies ...................................................................................... 12
2.2. Evolution of the economy during the period of independence .................................... 14
2.2.1. Economic growth ............................................................................................................. 14
2.2.2. Main factors driving economic growth ........................................................................... 15
2.2.3. Growth and poverty ......................................................................................................... 18
2.2.4. Inflation, unemployment and balance of payments ...................................................... 20
2.3. Some key economic development issues ...................................................................... 23
2.3.1. Public finances ................................................................................................................ 23
2.3.2. Terms of trade and other external shocks ..................................................................... 28
3. Social policy and MDG achievement .............................................................................. 29
3.1. Social policy during the period 1991-2009 ..................................................................... 29
3.1.1. Education ......................................................................................................................... 29
3.1.2. Health................................................................................................................................ 30
3.1.3. Social protection and social security ............................................................................. 31
3.1.4. Access to safe water and improved sanitation .............................................................. 33
3.2. Evolution and structure of public social spending ....................................................... 34
3.3. Evolution of the MDGs during the period 1991-2008 ..................................................... 37
3.3.1. Is the country on-track to achieve the MDGs?............................................................... 37
3.3.2. Policies for MDG achievement ........................................................................................ 38
4. Sector analysis of MDG determinants ............................................................................ 40
5. Calibration of MAMS with country-specific data ........................................................... 44
6. MAMS scenario analysis ................................................................................................. 45
6.1. Baseline scenario ............................................................................................................ 46
6.2. MDG scenarios ................................................................................................................. 48

Roman Mogilevsky, Anarkul Omorova
CASE Network Report No.95 4
6.3. Analysis of micro-simulation results for MDG1 ............................................................. 52
7. Conclusions and policy implications ............................................................................. 54
References ................................................................................................................................... 56
Appendix I. Simulation results ................................................................................................... 59
TABLES
Table 1. General government revenue, % of GDP, 2009 ....................................................... 25
Table 2. General government expenditures by functional classification, 2009 .................. 26
Table 3. Key MDG indicators in Kyrgyzstan .......................................................................... 37
Table 4. MDG determinants in education, health and access to water and sanitation ....... 41
Table 5. Elasticity values of the MDG determinants with regards to their
determinants.............................................................................................................. 43
Table 6. Additional government expenditures necessary for the MDGs achievement ....... 50
Table A1. Results of scenario simulations for achievement of the MDG2 – MDG7 ............... 59
Table A2. Poverty and inequality estimates for the MDG achievement scenarios ................ 61
FIGURES
Figure 1. Real GDP index and growth rate, 1991-2009 ........................................................... 14
Figure 2. GDP structure by sector, 1990-2009 ......................................................................... 15
Figure 3. GDP structure by expenditure, 1990-2008 ............................................................... 17
Figure 4. Poverty indicators, 1996-2009 ................................................................................... 19
Figure 5. Inflation rate by CPI (December-to-December), 1992-2009 .................................... 20
Figure 6. Current account balance, 1993-2009 ........................................................................ 22
Figure 7. Dynamics of general government budget indicators, 1992-2009 ............................. 24
Figure 8. External debt of Kyrgyzstan, 1993-2009 .................................................................. 27
Figure 9. Shares of social expenditures in the general government budget ............................ 35
Figure 10. Index of real general government budget social expenditures per capita ............... 35
Figure 11. Public expenditures on education and health per capita, 2007 ................................ 36
Figure 12. Dynamics of the MDG indicators under the baseline scenario, 2006-2015 ............. 47
MACROECONOMIC STRATEGIES OF MDG ACHIEVEMENT IN THE KYRGYZ REPUBLIC
5 CASE Network Report No.95
Abbreviations
BPFC Benefit for Poor Families with Children
CGE Computable general equilibrium
CIS Commonwealth of Independent States
CPI Consumer Price Index
FDI Foreign Direct Investment
GDP Gross Domestic Product
HIPC Highly Indebted Poor Countries
HIV/AIDS Human Immunodeficiency Virus/Acquired Immune Deficiency Syndrome
ILO International Labor Organization
IMF International Monetary Fund
lhs Left-hand side (axis)
MAMS Maquette for MDG Simulations
MDG Millennium Development Goals
MoF Ministry of Finance of the Kyrgyz Republic
NBKR National Bank of the Kyrgyz Republic
NSC National Statistical Committee of the Kyrgyz Republic
OLS Ordinary Least Squares
PIP Public Investment Program
PISA Program for International Student Assessment
PPP Purchasing Power Parity
rhs Right-hand side (axis)
SAM Social Accounting Matrix
SME Small and Medium Enterprises
SOE State-Owned Enterprise
UMB Unified Monthly Benefit
UNDESA United Nations Department of Social and Economic Affairs
UNDP United Nations Development Programme
UNESCO United Nations Educational, Scientific and Cultural Organization
USSR Union of the Soviet Socialist Republics
USD Dollar of the United States of America
VAT Value Added Tax
WHO World Health Organization
WTO World Trade Organization
Roman Mogilevsky, Anarkul Omorova
CASE Network Report No.95 6
Roman Mogilevsky is Executive Director of the Center for Social and Economic
Research CASE-Kyrgyzstan and CASE Fellow. He works on various problems in the
CIS countries, including fiscal and social policy, international trade and foreign aid,
macroeconomics, labor market and labor migration. He has extensive experience in
providing advice and training to governments and civil society organizations in the
majority of CIS countries.
Anarkul Omorova is economist at the Center for Social and Economic Research
CASE-Kyrgyzstan.

MACROECONOMIC STRATEGIES OF MDG ACHIEVEMENT IN THE KYRGYZ REPUBLIC
7 CASE Network Report No.95
Abstract
The paper aims at analyzing macroeconomic and financial strategies, which are to
ensure achievement of the Millennium Development Goals (MDGs) in the Kyrgyz
Republic. The paper is based on results of simulations generated through the
application of standard MAMS, a computable general equilibrium model adjusted to
the country situation and calibrated with data of Kyrgyzstan. MAMS-model-based
simulation results indicate that a continuation of the current policies under the
baseline scenario would allow for achieving MDG1 (poverty reduction) only; the
country would fall short of the targets for other MDGs. In order to achieve all MDGs,
the country needs to increase government spending on MDG-relevant sectors
(education, health, water and sanitation) by 7.8-8.1% of GDP per annum in
comparison to the baseline scenario. The scenario that combines increased taxes
and aid inflows seems to be the most realistic, but it would still require very
substantial increases in tax collections and grant aid. The situation is going to be
easier, if the economic growth rates 2011-2015 would be higher than 7% per annum.
This is possible, if the government would be more successful in implementation of
structural reforms, FDI and private domestic investments attraction and mobilization
of resources for infrastructure development. Another possible way out is a substantial
increase in government spending efficiency allowing for receiving higher social
returns for money spent.

Roman Mogilevsky, Anarkul Omorova
CASE Network Report No.95 8
Executive Summary
This study has been prepared in the framework of the project ―Assessing Development
Strategies to Achieve the MDGs in Asia‖ implemented in the Kyrgyz Republic with
methodological and financial support from the United Nations Department of Economic and
Social Affairs (UN-DESA) and UNDP. This paper aims at analyzing macroeconomic and
financial strategies aimed at ensuring achievement of the Millennium Development Goals
(MDGs) in the Kyrgyz Republic.
The paper is based on results of simulations generated through the application of with
standard MAMS, a computable general equilibrium model developed by the World Bank.
This model was adjusted to the country situation and was calibrated with data of the Kyrgyz
Republic. The exercise enabled the analysis of selected MDGs for extreme poverty (MDG1),
primary education completion (MDG2), under-five and maternal mortality (MDGs 4 and 5,
respectively), and access to safe water and sanitation (MDGs 7a and 7b, respectively).
The analysis indicates that responsible macroeconomic policies in 2000-2008, adaptation of
population to new realities and new opportunities and positive developments in the
economies of neighboring countries allowed for several years of good economic growth and
significant poverty reduction. Yet, the country remains vulnerable to numerous external and
internal shocks, and its public finance and balance of payments are still fragile. The social
policies in Kyrgyzstan have always been directed towards sustaining the most important
country’s achievements in education, health and access to water and sanitation. While the
access to essential social services has been mostly preserved, quality of a broad range of
services has suffered. Achievement of many MDGs is at risk.
MAMS-model-based simulation results indicate that a continuation of the current policies
under the baseline scenario would allow for achieving MDG1 only; the country would fall
short of the targets for other MDGs.
In order to achieve all MDGs, the country needs to increase government spending on MDG-
relevant sectors (education, health, water and sanitation) by 7.8-8.1% of GDP per annum in
comparison to the baseline scenario. This increase in government spending could be
financed either through increased domestic tax collections, or through official foreign
transfers to the government, or through concessional foreign borrowing, or through a mix of
these options. All of these financing options seem to be politically difficult and hardly
MACROECONOMIC STRATEGIES OF MDG ACHIEVEMENT IN THE KYRGYZ REPUBLIC
9 CASE Network Report No.95
implementable. The scenario that combines increased taxes and aid inflows seems to be the
most realistic, but it would still require very substantial increases in both tax collections (by
2.5% GDP per annum) and grant aid (by 6.1% GDP per annum).
The situation is going to be easier, if the economic growth rates 2011-2015 would be higher
than 7% per annum. This is possible, if the government would be more successful in
implementation of structural reforms, FDI and private domestic investments attraction and
mobilization of resources for infrastructure development. Another possible way out is a
substantial increase in government spending efficiency allowing for receiving higher social
returns for money spent.
Thus, the MDG achievement in the Kyrgyz Republic seems to require combination of four
types of policies: (i) promotion of economic growth in the country, (ii) increased domestic
financing of MDG-related sectors through redistribution of resources between sectors, (iii)
increase in cost efficiency of social policies, and (iv) increased attraction of foreign aid.

Roman Mogilevsky, Anarkul Omorova
CASE Network Report No.95 10
1. Introduction
1. This study is prepared in the framework of the project ―Assessing Development
Strategies to Achieve the MDGs in Asia‖ implemented by country teams in the Kyrgyz
Republic, the Philippines and the Republic of Uzbekistan with methodological and financial
support from the United Nations Department of Economic and Social Affairs (UN-DESA) and
UNDP. This paper aims at analyzing macroeconomic and financial strategies aimed at
ensuring achievement of the Millennium Development Goals (MDGs) in the Kyrgyz Republic.
2. Kyrgyzstan is making progress towards achievement of the MDGs and is on track to
achieve MDG1 on halving extreme poverty by 2015, from the base year 2001. However,
achievement of other MDGs is at risk due to problems remaining in the development of the
country. Key policies, which are to ensure good progress in the MDG-related areas, have
been formulated in a number of government strategic documents and summarized in two
MDG progress reports (2003 and 2009). However, human, material and financial resources
available in the country have never been fully sufficient for practical implementation of these
policies, so finding a realistic path towards the MDGs is still an open issue in Kyrgyzstan.
Progress in the MDG achievement has also been inhibited by the governance problems and
associated political instability in the country during last years. Fully recognizing an acute
need in fundamental improvement in all areas of governance, this paper concentrates on
macroeconomic and sector policies and resources necessary for timely MDG
achievement in the country. Identification of such policies and resource requirements is the
main objective of this study. The analysis provided in this paper contributes to selection of a
feasible mix of policies, for which necessary resources could be mobilized inside and outside
of the country.
3. The 2010 political events in Kyrgyzstan have resulted in an acute humanitarian crisis
in the southern part of the country. Many components of the education, health and other key
public services, which are considered in this study, have been severely damaged. This
damage is currently being assessed by the government and international experts, and
substantial domestic and donor resources are being mobilized in order to recover the social
system. Only very rough estimates of the damage and additional resource requirements
have been published so far. Against this background, this paper is based on an assumption
that additional resources for the post-conflict recovery will be possible to mobilize and utilize
to compensate the damage. As this paper is aimed at analyzing the longer-term trends and
the resources needed for a normal, conflict-free development of the country, the additional
conflict-related resource requirements have not been included into the estimates provided.
MACROECONOMIC STRATEGIES OF MDG ACHIEVEMENT IN THE KYRGYZ REPUBLIC
11 CASE Network Report No.95
4. The paper is based on results of simulations generated through the application of with
standard MAMS, a computable general equilibrium model developed by the World Bank. Full
description of the model is provided in Lofgren and Diaz-Bonilla (2009). This model was
adjusted to the country situation and was calibrated with data of the Kyrgyz Republic with
technical support from UN-DESA. The exercise enabled the analysis of selected MDGs for
extreme poverty (MDG1), primary education completion (MDG2), under-five and maternal
mortality (MDGs 4 and 5, respectively), and access to safe water and sanitation (MDGs 7a
and 7b, respectively). The progress shown in achieving these MDGs can be explained in
close association with economic and financial policies. Other MDGs are not part of the
analysis.
5. The paper has the following structure. Chapter 2 is devoted to the analysis of
macroeconomic developments in the country throughout history of its independence. Section
2.1 is focused on economic reforms and policies implemented in the country in 1991-2009.
Section 2.2 describes growth performance of the economy on different stages of its
development, the relationship between growth and poverty in Kyrgyzstan, and main
economic imbalances. Section 2.3 considers major sources of vulnerability of the economy:
public finance problems, terms of trade fluctuations and other external shocks. Chapter 3
contains a brief analysis of social policies in Kyrgyzstan. Section 3.1 provides a review of
government policies in education, health, social protection and supply of water and
sanitation. Section 3.2 analyses the evolution and structure of public social spending. Section
3.3 addresses the issue of social policies’ implications for poverty reduction in the country
and describes progress of the country towards MDG achievement. Chapter 4 discusses
MDG determinants and their inter-dependence for education, child and maternal mortality
and access to safe water and improved sanitation. Chapter 5 describes key data sources,
assumptions and the methodology used to estimate parameters that were used in the
calibration of MAMS for the Kyrgyz Republic. Chapter 6 contains an analysis of baseline and
different MDG achievement scenarios focusing on macroeconomic and labor market
outcomes as well as on estimated resource requirements under different financing strategies.
Finally, Chapter 7 summarizes the main findings of the paper and discusses some policy
implications.

Roman Mogilevsky, Anarkul Omorova
CASE Network Report No.95 12
2. Macroeconomic policies and economic performance in 1991-2009
2.1. Economic reforms and policies
6. When Kyrgyzstan gained independence in 1991, the conditions for its development
were largely determined by its natural resources, geographical location and the structural
and institutional legacy of the Soviet era. Among the most significant initial conditions were
the following:
geographic location: landlocked and remote from major economic centers;
agro-industrial structure of the economy: most of the large industry worked for the
needs of the whole Soviet Union (including military industrial facilities) and, therefore,
it was heavily dependent on suppliers and consumers in other Soviet republics and
on the USSR federal budget;
lack of easily extractable energy resources and minerals;
well developed social infrastructure and relatively high living standards1 of the
population;
lack of many of the institutions typical for an independent state (central bank, border
guard, customs, etc);
lack of experience with independence, democracy and market economy.
7. After gaining independence, the above fundamental factors coincided with the
consequences of macroeconomic instability (inflation, a severe shortage of consumer goods,
etc.) of the late perestroika period. The dissolution of the USSR led to the termination of
Union budget subsidies and cheap energy supplies from other republics, a crisis in inter-
republican trade, a collapse in the demand for military production, a drastic change in relative
prices, a huge increase in transportation costs, and the need to address the completely new
tasks that the government and people faced. Heavy social and economic repercussions were
witnessed as a result:
hyperinflation and a severe output decline led to the loss of half of the officially
recorded GDP and three-quarters of industrial production, and agriculture also
suffered considerably;
decreased real wages and social benefits, increased unemployment and lack of
experience to subsist in a market economy led to increased poverty and inequality;
poverty and instability promoted a quite significant outward migration;
noticeable deterioration of education, health care, culture and other social services.
1 Compared to what it might have been without the USSR central budget subsidies.

MACROECONOMIC STRATEGIES OF MDG ACHIEVEMENT IN THE KYRGYZ REPUBLIC
13 CASE Network Report No.95
8. However, during the early transition period, both the government and the people
could quickly adapt to the new conditions. The complex institutional, economic and social
reforms conducted in the first half of 1990s helped to build basic state institutions, overcome
the output decline, achieve initial macroeconomic stabilization, and prevent social services
from utterly collapsing. Price liberalization, privatization of State-Owned Enterprises (SOE),
de-collectivization in agriculture coupled with equitable land reform2 and external economic
liberalization3 increased the contribution of the private sector represented mostly by the SME
sector to both GDP and employment to a level far exceeding 50%. These changes also
helped new social groups such as entrepreneurs, private farmers, and traders (including the
so-called shuttle traders) to emerge.
9. Unfortunately, these reforms were not always consistent and comprehensive enough.
The state budget remained unbalanced; many structural reforms (privatization, restructuring
of the infrastructural sectors, etc.) were incomplete; social commitments exceeded real
financing possibilities and so on. All these flaws undermined the social and economic stability
of the country and resulted in the financial crisis of 1998-1999, which had fairly harsh
implications in terms of poverty growth, macroeconomic destabilization, external
indebtedness among other problems.
10. After the crisis, the socio-economic situation of Kyrgyzstan has improved, and poverty
has fallen significantly. This was the result of many people managing to adapt themselves to
the new conditions, and becoming able to assume responsibility for themselves and for the
welfare of their families.
11. A more responsible economic and social policy has managed to reduce inflation to a
low single-digit level, create a more favorable tax regime for SME in the area of trade and
services, and implement a complex health care reform among other achievements. Key
directions of the current economic policy are:
maintenance of macroeconomic stability through controlling government budget
deficit, public debt, and inflation, and
promotion of sustainable economic growth through easing and more equally
distributing the tax burden on the economy, expanding public investments in infrastructure,
improving of business and investment climate, integrating the economy into the global
economic system, and implementing structural reforms for the development of key sectors of
the economy (energy production, mining, processing of agricultural production, tourism,
transport, financial sector, etc.).
2 The reform provided every rural household with a land plot proportional to the number of people in the
household. 3 Kyrgyzstan was the first country of the Commonwealth of Independent States (CIS) that joined the WTO in
1998.

Roman Mogilevsky, Anarkul Omorova
CASE Network Report No.95 14
2.2. Evolution of the economy during the period of independence
2.2.1. Economic growth
12. The economic decline in the first half of 1990s was deep; by 1995 the country’s GDP
almost halved (Figure 1). In 1996, the economy started to recover driven by reformed
agriculture and gold production4. The crisis of 1998-1999 resulted in deceleration of
economic growth but by 2000 the economy returned to a more sustainable growth path,
showing GDP growth rates in the range of 5-7% per annum.
Figure 1. Real GDP index and growth rate, 1991-2009
-25%
-20%
-15%
-10%
-5%
0%
5%
10%
0%
25%
50%
75%
100%
1991 1992 1993 1994 1995 1996 1997 1998 1999 2000 2001 2002 2003 2004 2005 2006 2007 2008 2009
%
% o
f 1990 G
DP
Real GDP index (lhs) Real GDP growth rate (rhs)
Source: National Statistical Committee of the Kyrgyz Republic (NSC)
13. Technological problems faced by the largest enterprise, Kumtor mine, and
unfavorable climate conditions that affected agriculture took the economic growth to be near
zero in 2002 and 2005. The biennium 2007-2008 was, however, good for the economy as
during this period of time GDP cumulatively increased by 16.8%. The global economic crisis
that erupted during the second half of 2008 affected Kyrgyzstan moderately, mainly through
a decline in remittances and exports, but GDP remained positive.
14. Because of the mixed growth performance during the period of independence real
GDP in 2009 still did not achieve the level of 1990 (but is very close to this level), while its
structure is now very different from that of the last year of the Soviet period (as explained in
the next subsection).
4 The largest enterprise of the country—Kumtor gold mine and associated refinery—had been built in 1993-1996
and started its operations in 1997.
MACROECONOMIC STRATEGIES OF MDG ACHIEVEMENT IN THE KYRGYZ REPUBLIC
15 CASE Network Report No.95
15. In GDP PPP terms, however, the growth story looks somewhat better. According to
the World Bank’s World Development Indicators, the 2007 GDP per capita value of
USD1,980 PPP already exceeded the 1990 value (USD1,813). Still, Kyrgyzstan belongs to
the low-income category according to the classification of countries provided by the World
Bank.
2.2.2. Main factors driving economic growth
16. The sectoral structure of the economy went through deep changes in 1991-2009. The
economic decline of 1991-1995 affected all key sectors of the economy (Figure 2). The
industrial sector suffered the most as its production fell by three quarters in relative to the
1990 level. Among the main reasons of this production collapse were loss of markets as the
former USSR economy disintegrated and a notable deterioration of the terms of trade (that is
a hike in energy and transportation prices, which used to be highly subsidized in Soviet
times) that turned out to be very unfavorable to Kyrgyz manufacturing enterprises that had
dominated the industrial sector in pre-independence times. Public services more than halved,
too, as a result of a cut in the government budget that were no longer supported by subsidies
from the central government of the USSR. Agriculture and commercial services were less
affected, but they also lost 30-40% of their output.
Figure 2. GDP structure by sector, 1990-2009
0
20
40
60
80
100
1990 1996 2002 2009
% o
f 1
99
0 G
DP
Agriculture Industry Commercial services Public services
Source: NSC
17. Commercial services appeared to be the most rapidly growing sector of the Kyrgyz
economy with a share of GDP that has increased from 27% in 1996 to 40% in 2008. The
growth of commercial services is driven by wholesale and retail trade, which provides now
Roman Mogilevsky, Anarkul Omorova
CASE Network Report No.95 16
almost one-sixth of GDP. An important component of the trade sector is re-exporting activity.
Due to the liberalization of custom regulations and the taxation regime for physical persons
involved in international trade, Kyrgyzstan became a trade center5. Commodities are brought
by Kyrgyz traders from China, Turkey and some other countries and these are then
redistributed to different parts of Russia, Kazakhstan, Uzbekistan and other countries in
Central Asia.
18. Other dynamic commercial services, which started to develop quickly in the mid-
2000s are tourism, communications, and, until the last year, the financial sector. Tourism
promises to be a driver of economic growth in the country in the long-term as the country
possesses unique natural resources (Issyk-Kul lake shore, mountains, thermal waters, relict
forests, etc.) and cultural heritage. Development of the sector is somewhat inhibited by the
country remoteness, though, and it therefore depends on the demand from neighboring
countries (first of all, Kazakhstan and Russia). Growth in the communication sector is driven
by penetration of new technologies (mobile telecommunications and internet) and is
supported by expanding private demand. The financial sector was developing quickly (albeit
from a very low basis) due to general economic recovery, prudent sector regulation and
inflows of FDI to the sector (mainly from Kazakhstan, where rich oil and other natural
resources allowed for the development of a relatively large and aggressive financial sector).
As Kazakhstan was hit early by the global financial and economic crisis, expansion of
Kazakh financial institutions in Kyrgyzstan stopped, which resulted in slowing of growth of the
Kyrgyz financial sector.
19. Agriculture is growing very slowly in the 2000s. Small (typically one-family) farms
dominating the sector have a semi-subsistence orientation and are good in ensuring food
security of rural households. However, due to lack of access to markets, modern equipment,
necessary material inputs, and cheap credit these farms are not able to increase production
substantially. The share of agriculture in GDP shrunk from 50% in 1996 to 30% in 2008.
20. The moderate recovery of industry in the period 1996-2002 (Figure 2) can basically
be attributed to the beginning of gold production on Kumtor mine. Recently, sewing industry
has become another source of the Kyrgyz industrial sector growth. This industry emerged as
a network of small (often less than ten employees) informal enterprises producing garments
for a lower-end market segment. Due to the combination of cheap prices and a reasonable
quality, these garments have appeared to be highly competitive, even relative to similar
Chinese production.
5 There are two main markets serving this purpose: Dordoi market near Bishkek, the capital of the country, on the
Kyrgyz-Kazakh border, and Kara-Suu market near Osh, the second large town, on the Kyrgyz-Uzbek border.
MACROECONOMIC STRATEGIES OF MDG ACHIEVEMENT IN THE KYRGYZ REPUBLIC
17 CASE Network Report No.95
21. The development of public services depends on the situation of the government
budget. A recent increase in government budget revenues and expenditures (see section
2.3.1) allowed to push up salaries of public servants, teachers and doctors and other
components of public spending, so the share of these services rose somewhat, though their
absolute per capita level is still much lower than in 1990.
22. The economic growth pattern in Kyrgyzstan could also be seen from the GDP
expenditure side (Figure 3). Private consumption has been growing quickly (on average 11%
per annum in real terms) during last several years. This consumption growth has been
accompanied with poverty reduction (see the next section), so it affected all layers of the
society. Investments were a GDP component, which grew even faster than private
consumption – on average, by 15% per annum in real terms in 2003-2008. Exports have also
grown robustly by 11% per annum. Government consumption, on the other hand, is the GDP
component that has grown more slowly (4% per annum in 2003-2008), which is partially
attributed to some redistribution of government resources from consumption to investments
in public infrastructure. The expansion of private consumption and investments boosted the
demand for imports which grew very quickly at an average annual growth rate of 20%.
Figure 3. GDP structure by expenditure, 1990-2008
-90
-60
-30
0
30
60
90
120
150
180
210
1990 1996 2002 2008
% o
f 1
99
0 G
DP
Private consumption Government consumption Investments Exports Imports
Source: NSC
23. Remittances from Kyrgyz labor migrants working mainly in Russia and Kazakhstan
have been driving part of the growth in private consumption. By different estimates, from 250
to 500 thousand Kyrgyz workers (roughly 12 to 25% of total labor force) seek employment in
other countries. According to the NBKR estimates, their remittances in 2008 exceeded
USD1.4 billion or 28% of GDP. The inflow of remittances also allowed financing increasing
imports.
Roman Mogilevsky, Anarkul Omorova
CASE Network Report No.95 18
24. The growth of investments in recent years has mainly been driven by increased
domestic private and public investments and inflows of FDI which increased by more than
30% per annum in USD terms during the last six years.
25. The expansion of exports has been explained by growing demand for Kyrgyz goods
and services in the markets of Russia and Kazakhstan; two oil-producing countries that have
experienced rapid economic growth due to favorable international prices for energy products.
Taking into account that remittances and FDI also came mostly from these countries, one
could infer that recent growth of the Kyrgyz economy reflects a spillover effect from growth in
these large neighboring countries.
26. It has to be noted that the Kyrgyz economy has a very large informal component.
There are many small enterprises and self-employed people active in agriculture, retail trade,
transport, construction, tourism and other services and some industrial sectors (e.g., in
sewing industry), which do not report or underreport on their economic results. Activities of
the informal sector are only partially accounted in official GDP and employment data.
Available estimates of the size of unobserved part of informal sector vary from 18.3% of GDP
(NSC for 2007) to 53.2% GDP (UNDP for 2004). The dynamics of the unobserved part of the
informal economy may also be quite different from the official economy growth indicators. So,
all GDP data should be treated with some caution.
2.2.3. Growth and poverty
27. Poverty is measured in Kyrgyzstan since 1996 in consistency with the World Bank’s
methodology. Two poverty lines are in use: the general poverty line and the extreme (food)
poverty line. The extreme poverty line reflects the cost of a food basket ensuring
consumption of 2100 Kcal per person per day. The general poverty line takes the food
poverty line and adds-up the cost of basic non-food expenditures. As of 2008, the general
poverty line was 18,323 soms per person per annum (about USD3.13 PPP per person per
day), and the extreme poverty line was 11,710 soms per person per annum (USD2.00 PPP
per person per day). Data on household expenditures are based on the Kyrgyz Integrated
Household Survey covering more than 5,000 households interviewed quarterly. For poverty
measurement, household consumption per capita is used as a household welfare indicator.
28. The dynamics of poverty (Figure 4) is pretty consistent with that shown by GDP.
There was a decline in poverty in 1997 corresponding to a good growth in agriculture and
industry in 1996-1997. During the 1998-1999 period of crisis there was a considerable
increase in the poverty level. Starting in 2001, economic growth has been accompanied by a
steady, uninterrupted poverty reduction. Interestingly, the poverty dynamics has been

MACROECONOMIC STRATEGIES OF MDG ACHIEVEMENT IN THE KYRGYZ REPUBLIC
19 CASE Network Report No.95
smoother than that of GDP, partially because a great deal of the GDP fluctuations has been
explained by gold production: that is, such fluctuations have mostly been due to exports
rather than private consumption, a macroeconomic indicator that is most closely related to
household consumption.
Figure 4. Poverty indicators, 1996-2009
0
10
20
30
40
50
60
70
1996 1997 1998 1999 2000 2001 2002 2003 2004 2005 2006 2007 2008 2009
% o
f popula
tion
Poverty level Extreme poverty level
Source: NSC
29. Between 2002 and 2009, general poverty went down from 54.8% to 31.7% and
extreme poverty from 23.3% to 3.1%. In the same period, real GDP per capita grew
cumulatively by 29.9%. Correspondingly, the elasticity of the general poverty rate with
respect to GDP is equal to -0.77, and the elasticity of extreme poverty rate with respect to
GDP -0.68. These elasticity values seem to be rather high. Possible explanations for such
pro-poor growth are prevalence of low inflation, which was maintained in the country until
2007 and which, of course, was beneficial for poor6, and the growth of consumption driven by
remittances, substantial part of which was accrued by the poor rural areas. Social policies of
the government have also somewhat impacted the poverty reduction in the country. Despite
of the limited scope and efficiency of the income redistribution policies (see section 3.1.3),
some social protection/insurance mechanisms (e.g., pensions) did play an extreme-poverty-
preventing role in the most difficult period of the country’s development at the end of 1990s –
early 2000s (World Bank, 2003).
30. Income inequality in Kyrgyzstan is relatively high and shows an ambiguous trend.
According to NSC, the Gini coefficient for household incomes fluctuated in the range 0.41-
6 Zero inflation in 2009 is also among factors contributing to poverty reduction in 2009 despite of the economic
deceleration during the crisis.

Roman Mogilevsky, Anarkul Omorova
CASE Network Report No.95 20
0.45 during the period 1996-2009 with some decline to 0.37 in 2009. This type of inequality
dynamics seems to be consistent with the nature of economic growth in 2001-2009, which
was beneficial for different layers of society, and limited scope of redistribution policies by the
government (see section 2.1.3). Gradual reduction in income inequality during last years was
one among other factors that has allowed economic growth to translate into poverty
reduction.
2.2.4. Inflation, unemployment and balance of payments
31. Despite recent economic growth and significant poverty reduction, different
imbalances still persist in the economy. The most important of them relate to inflation,
unemployment, and government budget (see section 2.3.1) and balance of payments
deficits.
32. Inflation. The history of the Kyrgyz economy belonging to an independent State
started with a period of hyperinflation (1992-1994, Figure 5). This was caused by inflationary
pressure that had accumulated during the pre-independence period which became apparent
through the shock of price liberalization in 1992 and attempts by the government to finance
the budget deficit and support enterprises by printing money. Starting in 1994, the
Government kept from resorting to the inflationary sources of budget deficit financing and this
allowed for gradual decline of the CPI-based inflation rate to 13% in 1997. However, core
problems causing macroeconomic instability—huge budget and current account deficits—
had not been eliminated and, as a result, the economy was strongly affected by the 1998-
1999 global crisis. In 1999 the inflation rate went up to the level of almost 40%.
Figure 5. Inflation rate by CPI (December-to-December), 1992-2009
2032.7
929.9
62.1
1
10
100
1000
10000
1992 1993 1994
%
32.134.8
13.016.8
39.9
9.6
3.7
2.3
5.62.8
4.9 5.1
20.1 20.0
0.00
10
20
30
40
1995 1996 1997 1998 1999 2000 2001 2002 2003 2004 2005 2006 2007 2008 2009
%
Source: NSC
33. In the 2000s, the Government switched to a much more conservative monetary and
fiscal policy reducing the government budget deficit and making low inflation the main target
MACROECONOMIC STRATEGIES OF MDG ACHIEVEMENT IN THE KYRGYZ REPUBLIC
21 CASE Network Report No.95
of monetary policy. This set of policies took the inflation rate to nearly 5% per annum in
2001-2006.
34. Several years of low inflation substantially reduced inflationary expectations, which
had been high in 1990s. This created conditions to an increase in demand for money and
remonetization of the economy. Monetization of the economy (measured by M2x-to-GDP
ratio) increased from 11.1% in 2001 to 30.3% in 2007.
35. During these years the money supply grew very quickly, such that the average annual
growth rate of M2x was 32%. For a while, increasing demand for money resulted in such fast
increase in the money supply without adding any significant inflation, but the economy was
gradually being exposed to inflationary pressure. In 2007, inflationary pressure started to turn
into actual inflation as the country was negatively affected by the global hike in food and fuel
prices: in fact, the CPI grew by more than 20% and, later, in July 2008, the 12-month inflation
rate had climbed to 32.4%. Anti-inflationary efforts by the Government and the NBKR,
coupled with a price decline in the global commodity markets in mid-2008, allowed for some
reduction in inflation up to 0 for the 12-month inflation rate in December 2009. This inflation
story seems to demonstrate that the scope for expansionary monetary policies in Kyrgyzstan
is still very limited.
36. Unemployment. Two unemployment rates are used in Kyrgyzstan: namely, the official
unemployment rate and ILO-definition-based unemployment rate. As incentives to register as
unemployed are very weak (the unemployment benefit is very small, vacancies provided by
government employment services are usually not attractive, retraining programs are very few
and it is perceived they do not increase the chances to find a job much), the official
unemployment rate is usually 2.5-3 times less than the ILO-definition-based rate. Another
factor reducing the official unemployment rate is the law-based rule for treatment of peasants
having some land plot. Currently, every peasant having a plot above some very low threshold
is automatically considered as employed regardless of whether or not income from the plot
farming is sufficient for living. Taking into account that due to land reform implemented in
1990s almost every peasant has some land, this rule prevents the majority of peasants from
registering as unemployed.
37. The official unemployment rate has been measured since 1992. It started from 0.1%
and climbed to 4.3% in 1996 (the highest value for all years). Next, it gradually declined and
for already more than ten years it fluctuates in the range 2.8% to 3.5%. The official
unemployment rate was 2.6% by late 2009.
38. The ILO-definition-based unemployment rate is measured since 2003, when a labor
force module was added to the regular household survey run by NSC. It was estimated at
9.9% in 2003, it stayed between 8% and 9% in the following years and the latest rate for

Roman Mogilevsky, Anarkul Omorova
CASE Network Report No.95 22
2009 was 8.4%. While this value seems to reflect reality better compared to the official
unemployment rate, it seems to have no close linkage to GDP dynamics—substantial GDP
growth in previous years was not accompanied by a decline in unemployment indicators.
This lack of correlation between economic growth and unemployment rate may be related to
different, often very flexible and fluid forms of employment in the informal sector of the
Kyrgyz economy7, which may not be captured by the unemployment measuring
methodology.
39. In general, the labor market situation in the country is difficult and number of well-paid
jobs is limited. According to NSC, the average monthly wage in 2009 was 6161 soms (about
USD150). In such conditions many people look for employment abroad (mostly in Russia and
Kazakhstan) and are considered as not participating in domestic labor force.
40. Balance of payments. Kyrgyzstan is a small and very open economy. Many essential
consumer goods (e.g., cereals, sugar, and shoes) are imported, and a large number of
economic agents are involved in exporting activities. The share of exports of goods and
services in GDP was growing almost all the time and reached the level of 56% in 2009. The
share of imports in GDP is much higher; it was 93% in 2008. So, openness of the economy
measured as the ratio of total exports plus imports of goods and services to GDP was near
140% in 2008-2009.
Figure 6. Current account balance, 1993-2009
-25
-20
-15
-10
-5
0
5
1993 1994 1995 1996 1997 1998 1999 2000 2001 2002 2003 2004 2005 2006 2007 2008 2009
% G
DP
Source: NBKR
41. Imports have always been higher than exports. The trade deficit was especially high
in 1995-1999 (with the only exception of 1997). Then, after a sharp devaluation of the som
7 Such as partial or seasonal employment of many rural and urban people combined with labor migration or, for
students, with studies in universities.

MACROECONOMIC STRATEGIES OF MDG ACHIEVEMENT IN THE KYRGYZ REPUBLIC
23 CASE Network Report No.95
(by 2.5 times) in 1998-1999, the trade deficit went closer to zero and it then started to widen
again as GDP grew and the demand for imports increased fast. Inflows of FDI and foreign
aid helped financing the current account deficit in the 1990s when this was particularly high
(Figure 6). Later on, remittances have become one of the main sources of deficit financing.
42. Most probably, another important source of foreign exchange covering this deficit was
income from re-exports of commodities from China to Russia and Central Asia. This type of
export revenue is not captured by official statistics. But judging from the discrepancies
between Kyrgyz statistics on imports from China and Chinese statistics on exports to
Kyrgyzstan8 as well as on the size of the ―errors and omissions‖ item of the balance of
payments of Kyrgyzstan (which in 2008 was roughly equal to the current account deficit), one
could consider these flows as very large.
43. Since the moment of the introduction of the national currency som in 1993, the
exchange rate regime was defined as managed floating. The NBKR never had enough
international reserves to effectively fix the exchange rate. From its introduction in May 1993,
the som began to devaluate from 4 soms/USD to 48.44 soms/USD in 2001. In the 2002-2008
period, the som appreciated up to reaching 36.57 soms/USD in 2008. This was a reflection of
both the improving economic situation in the country and a global trend of USD depreciation.
As it happened to many other currencies in the world in 2009, the som devaluated to 42.89
soms/USD. In the 2000s, until the inflation hike in the second half of 2007, the real exchange
rate of the som relative to the currencies of major trading partners (Russian ruble and
Kazakh tenge) was moderately depreciating. So, the exchange rate dynamics did not have
as much effect on trade as it really had it on external debt (see section 2.3.1).
2.3. Some key economic development issues
2.3.1. Public finances
44. The country inherited a system of public finances heavily dependent on transfers from
the central budget of the USSR with expenditures much exceeding the level of domestically
mobilized revenues. For example, in 1992 the level of government expenditures (in % of
GDP) was almost twice as much as the level of government revenues. The attempts to cover
the budget deficit by monetary emission in the early 1990s resulted in hyperinflation. Around
1995-1996 the government stopped using direct credits of the NBKR for deficit financing and
switched to the concessional foreign borrowing. Even so, the deficit remained very high—
8 In some years Kyrgyz customs reported less than one-tenth of the trade volumes reported by Chinese
authorities.

Roman Mogilevsky, Anarkul Omorova
CASE Network Report No.95 24
around 10% of GDP (Figure 7). The high deficit was not sustainable and made the entire
macroeconomic system of Kyrgyzstan extremely fragile. Relatively minor external shocks
associated with the global crisis of 1998-1999 (transmitted through Russia) resulted in a
sharp currency devaluation, more inflation, and decline in the GDP growth rate. Also, the
external public debt (accumulated during the period of massive borrowing from foreign
donors) leveled off above 100% of GDP.
Figure 7. Dynamics of general government budget indicators, 1992-2009
-20
-10
0
10
20
30
40
50
1992 1993 1994 1995 1996 1997 1998 1999 2000 2001 2002 2003 2004 2005 2006 2007 2008 2009
% G
DP
Revenues Expenditures Fiscal balance
Source: MoF, NSC
45. In the situation of crisis and immediately after it (2000-2001), the government had to
go through a process of expenditure cuts from 33.5% of GDP in 1998 to 26.6% of GDP in
2001. This was done mainly through non-indexation of government spending to inflation,
while in some cases expenditure cuts in nominal terms were also implemented. The deficit of
the general government budget9 was reduced to the level of around 6% of GDP. Economic
growth in 2002-2007 permitted the budget situation to improve substantially: the deficit was
brought almost to zero in 2008 when government revenues and expenditures managed to
growth simultaneously. The situation in 2009, however, changed dramatically and the deficit
returned to the level of 10%..
46. The improvement in tax collections—the main component of government revenues—
in 2001-2008 should be attributed to the growth of imports, because import taxes (VAT,
excises and import tariffs) are the best administered component of the tax system. In 2007,
the share of import taxes was close to 50% of total tax collections. Later on, due to the
9 General government budget includes consolidated republican and local budgets, separately implemented donor-
funded Public Investment Program (PIP) and extra-budgetary Social Fund (accumulating pension and mandatory health insurance contributions).
MACROECONOMIC STRATEGIES OF MDG ACHIEVEMENT IN THE KYRGYZ REPUBLIC
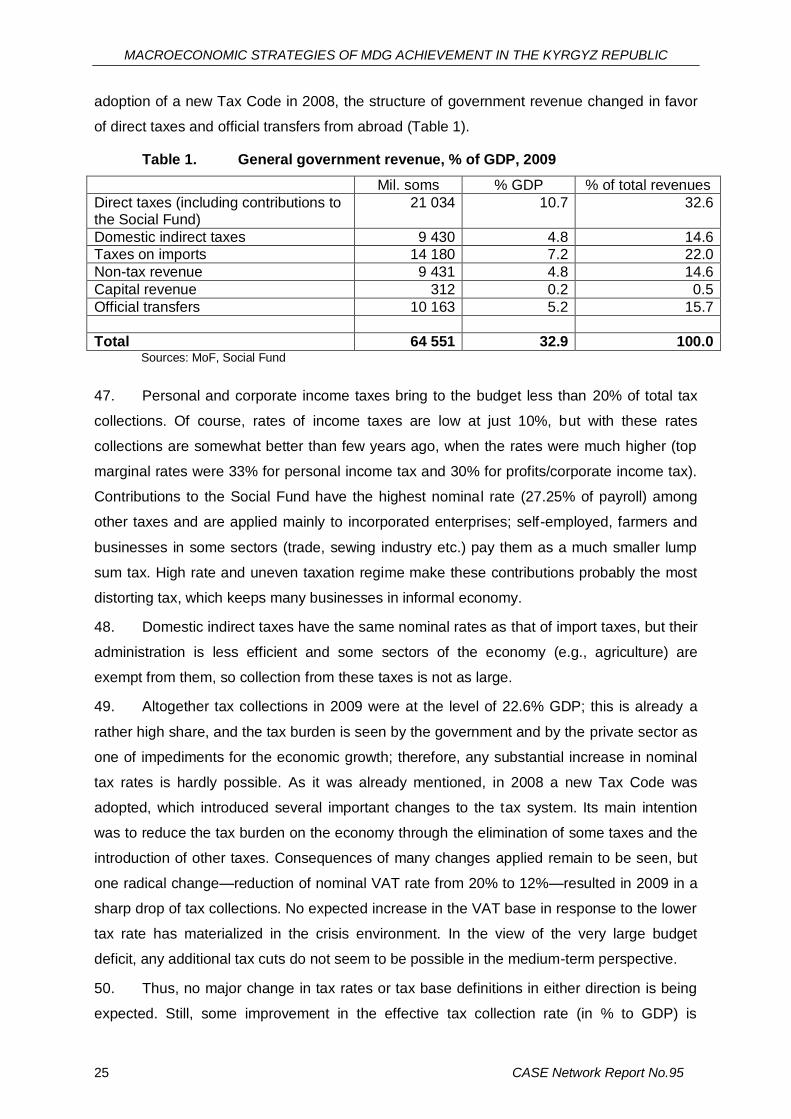
25 CASE Network Report No.95
adoption of a new Tax Code in 2008, the structure of government revenue changed in favor
of direct taxes and official transfers from abroad (Table 1).
Table 1. General government revenue, % of GDP, 2009
Mil. soms % GDP % of total revenues
Direct taxes (including contributions to the Social Fund)
21 034 10.7 32.6
Domestic indirect taxes 9 430 4.8 14.6
Taxes on imports 14 180 7.2 22.0
Non-tax revenue 9 431 4.8 14.6
Capital revenue 312 0.2 0.5
Official transfers 10 163 5.2 15.7
Total 64 551 32.9 100.0
Sources: MoF, Social Fund
47. Personal and corporate income taxes bring to the budget less than 20% of total tax
collections. Of course, rates of income taxes are low at just 10%, but with these rates
collections are somewhat better than few years ago, when the rates were much higher (top
marginal rates were 33% for personal income tax and 30% for profits/corporate income tax).
Contributions to the Social Fund have the highest nominal rate (27.25% of payroll) among
other taxes and are applied mainly to incorporated enterprises; self-employed, farmers and
businesses in some sectors (trade, sewing industry etc.) pay them as a much smaller lump
sum tax. High rate and uneven taxation regime make these contributions probably the most
distorting tax, which keeps many businesses in informal economy.
48. Domestic indirect taxes have the same nominal rates as that of import taxes, but their
administration is less efficient and some sectors of the economy (e.g., agriculture) are
exempt from them, so collection from these taxes is not as large.
49. Altogether tax collections in 2009 were at the level of 22.6% GDP; this is already a
rather high share, and the tax burden is seen by the government and by the private sector as
one of impediments for the economic growth; therefore, any substantial increase in nominal
tax rates is hardly possible. As it was already mentioned, in 2008 a new Tax Code was
adopted, which introduced several important changes to the tax system. Its main intention
was to reduce the tax burden on the economy through the elimination of some taxes and the
introduction of other taxes. Consequences of many changes applied remain to be seen, but
one radical change—reduction of nominal VAT rate from 20% to 12%—resulted in 2009 in a
sharp drop of tax collections. No expected increase in the VAT base in response to the lower
tax rate has materialized in the crisis environment. In the view of the very large budget
deficit, any additional tax cuts do not seem to be possible in the medium-term perspective.
50. Thus, no major change in tax rates or tax base definitions in either direction is being
expected. Still, some improvement in the effective tax collection rate (in % to GDP) is
Roman Mogilevsky, Anarkul Omorova
CASE Network Report No.95 26
possible due to improvements in the tax administration and due to the possible post-crisis
response of the economy on the tax incentives provided in the past.
51. Non-tax revenues are also an important source of government revenues. To a large
extent, these are revenues of budget-financed institutions (including medical establishments,
universities etc.) from paid services. These revenues are accounted in the budget, but are
left at the entities offering the services, so the government has a limited discretion power
over this money. Foreign official transfers have an important role in the budget revenues.
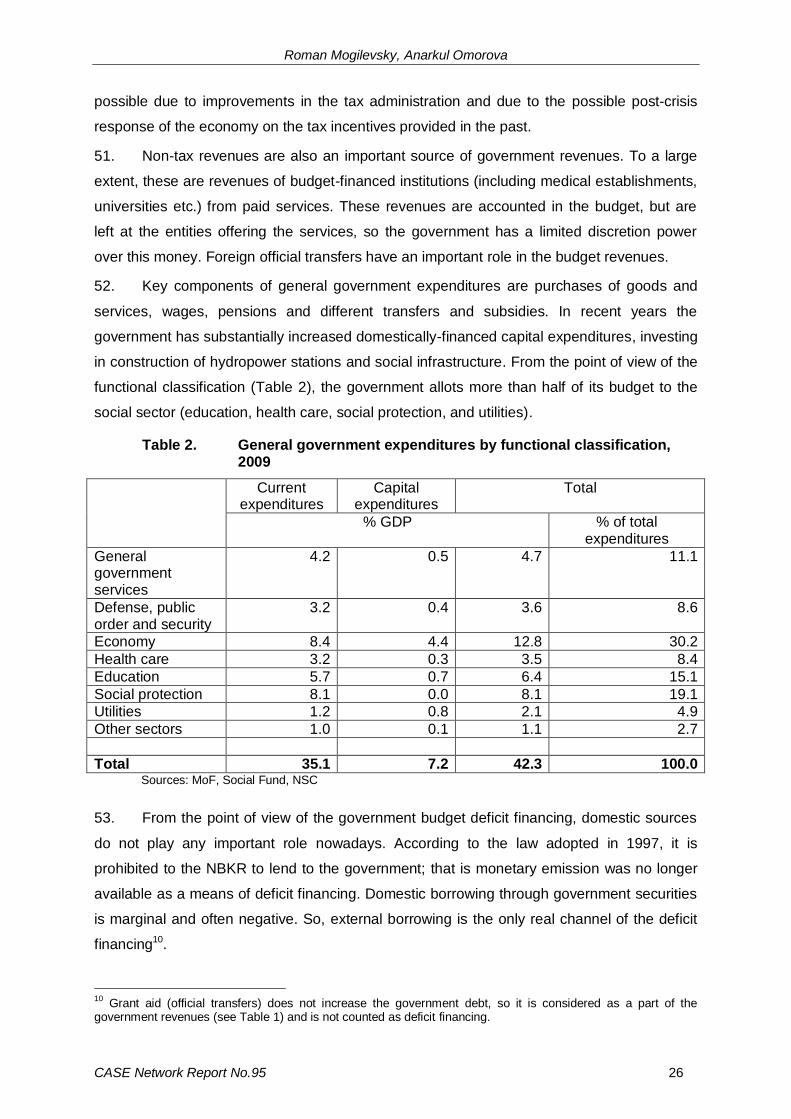
52. Key components of general government expenditures are purchases of goods and
services, wages, pensions and different transfers and subsidies. In recent years the
government has substantially increased domestically-financed capital expenditures, investing
in construction of hydropower stations and social infrastructure. From the point of view of the
functional classification (Table 2), the government allots more than half of its budget to the
social sector (education, health care, social protection, and utilities).
Table 2. General government expenditures by functional classification, 2009
Current expenditures
Capital expenditures
Total
% GDP % of total expenditures
General government services
4.2 0.5 4.7 11.1
Defense, public order and security
3.2 0.4 3.6 8.6
Economy 8.4 4.4 12.8 30.2
Health care 3.2 0.3 3.5 8.4
Education 5.7 0.7 6.4 15.1
Social protection 8.1 0.0 8.1 19.1
Utilities 1.2 0.8 2.1 4.9
Other sectors 1.0 0.1 1.1 2.7
Total 35.1 7.2 42.3 100.0 Sources: MoF, Social Fund, NSC
53. From the point of view of the government budget deficit financing, domestic sources
do not play any important role nowadays. According to the law adopted in 1997, it is
prohibited to the NBKR to lend to the government; that is monetary emission was no longer
available as a means of deficit financing. Domestic borrowing through government securities
is marginal and often negative. So, external borrowing is the only real channel of the deficit
financing10.
10
Grant aid (official transfers) does not increase the government debt, so it is considered as a part of the government revenues (see Table 1) and is not counted as deficit financing.
MACROECONOMIC STRATEGIES OF MDG ACHIEVEMENT IN THE KYRGYZ REPUBLIC
27 CASE Network Report No.95
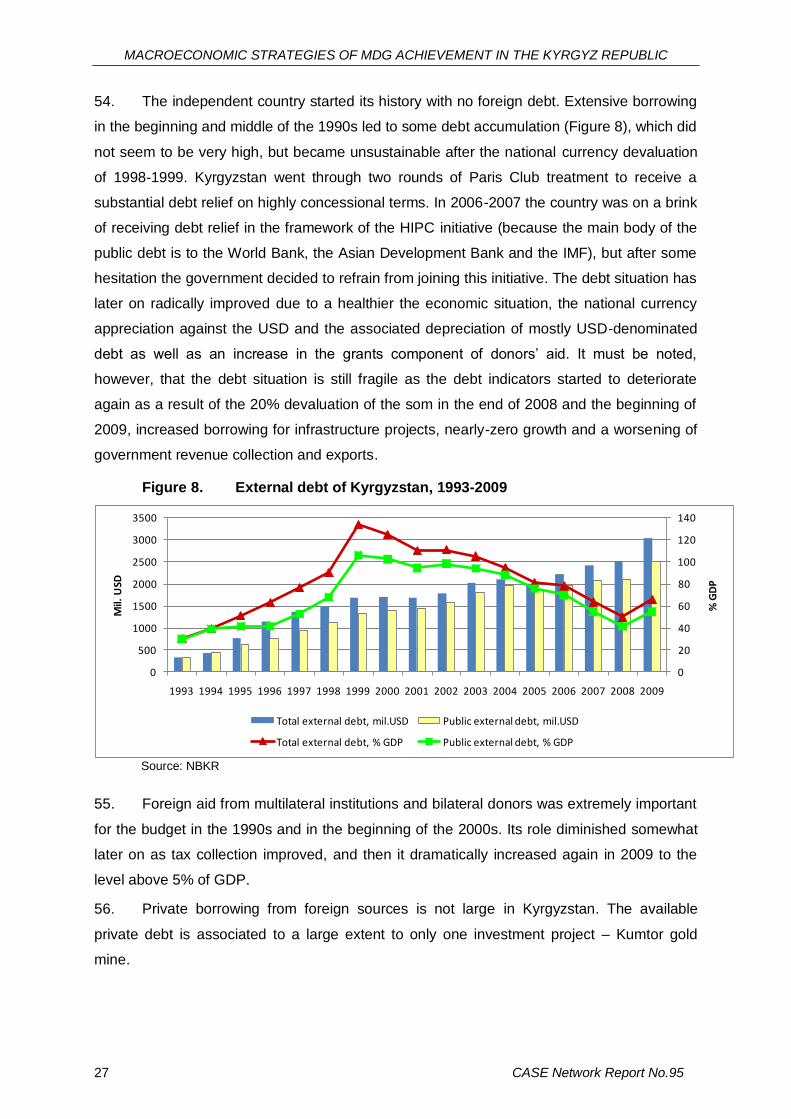
54. The independent country started its history with no foreign debt. Extensive borrowing
in the beginning and middle of the 1990s led to some debt accumulation (Figure 8), which did
not seem to be very high, but became unsustainable after the national currency devaluation
of 1998-1999. Kyrgyzstan went through two rounds of Paris Club treatment to receive a
substantial debt relief on highly concessional terms. In 2006-2007 the country was on a brink
of receiving debt relief in the framework of the HIPC initiative (because the main body of the
public debt is to the World Bank, the Asian Development Bank and the IMF), but after some
hesitation the government decided to refrain from joining this initiative. The debt situation has
later on radically improved due to a healthier the economic situation, the national currency
appreciation against the USD and the associated depreciation of mostly USD-denominated
debt as well as an increase in the grants component of donors’ aid. It must be noted,
however, that the debt situation is still fragile as the debt indicators started to deteriorate
again as a result of the 20% devaluation of the som in the end of 2008 and the beginning of
2009, increased borrowing for infrastructure projects, nearly-zero growth and a worsening of
government revenue collection and exports.
Figure 8. External debt of Kyrgyzstan, 1993-2009
0
20
40
60
80
100
120
140
0
500
1000
1500
2000
2500
3000
3500
1993 1994 1995 1996 1997 1998 1999 2000 2001 2002 2003 2004 2005 2006 2007 2008 2009
% G
DP
Mil.
USD
Total external debt, mil.USD Public external debt, mil.USD
Total external debt, % GDP Public external debt, % GDP
Source: NBKR
55. Foreign aid from multilateral institutions and bilateral donors was extremely important
for the budget in the 1990s and in the beginning of the 2000s. Its role diminished somewhat
later on as tax collection improved, and then it dramatically increased again in 2009 to the
level above 5% of GDP.
56. Private borrowing from foreign sources is not large in Kyrgyzstan. The available
private debt is associated to a large extent to only one investment project – Kumtor gold
mine.

Roman Mogilevsky, Anarkul Omorova
CASE Network Report No.95 28
2.3.2. Terms of trade and other external shocks
57. The small and open economy of Kyrgyzstan is subject to different exogenous shocks
which transmit through several channels. Firstly is the situation in neighboring countries,
especially Russia and Kazakhstan. These countries are major export markets for Kyrgyz
goods and services, major recipient countries of Kyrgyz migrants and key sources of critically
important imports. Therefore, developments in these countries strongly affect economic
development in Kyrgyzstan. These two neighboring countries did very well during the last
years in which oil prices have boomed, and for Kyrgyzstan this brought about growing
demand for Kyrgyz exports, FDI inflows, remittances inflows and lower unemployment due to
outflow of labor migrants. The Custom Union of Belarus, Kazakhstan and Russian
Federation operational starting July 2010 may introduce much stricter custom control
procedures and in this way inhibit the Kyrgyz exports and especially re-exports of Chinese
goods to the countries of the Union.
58. Dependence of Kyrgyzstan’s domestic consumer market on imported commodities is
another channel of vulnerability to external factors. The recent global increase in food and
fuel prices substantially affected both relative prices and general inflation in Kyrgyzstan,
which is to rely on imports of gasoline, kerosene, natural gas and other fuel. Kyrgyz exports
are pretty diversified, so fewer price shocks are transmitted through this channel, while world
prices for gold (the largest export item) do influence export revenues significantly. However,
due to relatively little connection of the gold production to other sectors of the economy any
increase/decrease in gold prices does not have much effect on general macroeconomic
situation.
59. Agriculture still remains the largest sector of the economy. Its dependence on
weather conditions makes the whole economy vulnerable to climate change. Recently,
climate conditions also affected electricity production in the country; few years in series with
lower-than-average inflow of water into reservoirs feeding hydropower stations significantly
reduced energy generation capacity of the country and negatively affected industrial
production and living conditions of the population in 2008-2009.
60. This analysis of the economic and fiscal situation in Kyrgyzstan indicates that the
government managed to maintain short-term macroeconomic stability in the 2000s even
when the economy was affected by sharp exogenous shocks. Still, the economic situation is
vulnerable. Fiscal burden on the economy is already large and further increase in the
government expenditures would be difficult to achieve by political and technical (limited
revenue collection and foreign aid absorption capacity) reasons.
MACROECONOMIC STRATEGIES OF MDG ACHIEVEMENT IN THE KYRGYZ REPUBLIC
29 CASE Network Report No.95
3. Social policy and MDG achievement
3.1. Social policy during the period 1991-2009
61. The country inherited a well-developed and expensive system of social services from
the Soviet period, which could be usually found in countries with much higher level of GDP
per capita. Therefore, social policies in the period of independence were mainly directed to
sustaining the already achieved level of social development, when available resources
reduced considerably.
3.1.1. Education
62. Restructuring of the education sector went in several directions: (i) limiting the scope
of government commitments; (ii) maintaining those components of the system, which were
left in the public domain; (iii) allowing private provision of education services; (iv) adjusting
the education contents and structure to the requirements of the labor market.
63. Before 1993, general secondary education (10, and then 11 grades) was mandatory
and available for all children free of charge. With the adoption of the Constitution in 1993,
basic secondary education (1-9 grades) had become mandatory. Access to general
secondary education remained free in public schools, but it was not guaranteed to everybody
any more. Another area where government commitments were substantially reduced was
pre-school education. Many public pre-school establishments were closed; their number was
reduced from 1,696 in 1990 to 402 in 2001, and it then went up to 594 in 2009. The number
of children in pre-school establishments decreased almost five-fold from 1990 to 2001, and
then increased by approximately one-half by 2009.
64. The situation in primary and secondary education11 developed quite differently. The
number of schools increased by 25% in 2009 in comparison to 1990 and the number of
schoolchildren rose by 12% (mostly due to the increase in total population) during the same
period. The student-to-teacher ratio has barely changed from 13.7 in 1990 to 14.8 in 2009.
The possibility to get secondary education in the native language has been maintained for an
absolute majority of the population; public schools provide education in Kyrgyz, Russian,
Uzbek and Tajik, private schools provide education on some other minority languages.
Because of financial problems and despite the government’s efforts, teachers’ salaries
relative to the average wage in the economy slipped to 59% in 2009 from 77% in 1990.
Spending on teachers’ salaries and utility services for schools accounts for the larger part of
11
In Kyrgyzstan, primary (1-4 grades), basic secondary (5-9 grades) and general secondary (10-11 grades) education is mostly provided in the same school.

Roman Mogilevsky, Anarkul Omorova
CASE Network Report No.95 30
total secondary education expenditures; while little remains to be spent on new textbooks,
equipment and other items necessary for the normal education process. This, of course, has
implications for the education quality (see below).
65. Private educational establishments funded by parents’ contributions have been
created in all education cycles, but their role is still marginal in pre-school, primary, basic and
general secondary education (much less than 1% of all enrolled children). The role of private
institutions is much more important in tertiary education: 33% of all universities with 11% of
all students are private.
66. Until recently the contents of primary and secondary education and the professional
structure of tertiary education have not changed very much in comparison to pre-
independence times. Changes have been mainly in the area of languages and humanities. In
the last few years, the ministry of education started to pursue more aggressive policies
towards the adjustment of programs and budget-funded professional training to the realities
of the modern economy of Kyrgyzstan.
67. While these policies allowed preserving and improving the enrollment numbers (see
section 2.4.1) and the system of education as such, the quality of education has visibly
deteriorated. For example, according to the results of an independent assessment of fourth
grade students’ learning achievements, in 2001 80% of the students successfully passed a
test on math and 60% a test on reading, numbers that went down respectively to just 38%
and 36% in 2007. Similarly discouraging results have been received, when Kyrgyzstan took
part in 2006 PISA study on schoolchildren’s literacy in reading, math and sciences. So, it
seems that the quality of education is the main current problem of the Kyrgyz education
system.
3.1.2. Health
68. Unlike mostly conservative education policies, in health the government has been
implementing a far-reaching reform program aimed at increased effectiveness of the health
care system and maintenance of nearly-universal access of the population to health care
services. Implementation of the reform started in 1996 with significant support from WHO,
World Bank and other donors.
69. Key components of this reform are: (i) restructuring of the health care system,
implying strengthening of primary care and optimization/reduction of the network of health
care establishments; (ii) changing in financing mechanisms in the sector, including the
introduction of mandatory medical insurance, patient’s copayments, division of providers and
payers in the system, transition from input-based (e.g., per bed) to output-based (e.g., per
MACROECONOMIC STRATEGIES OF MDG ACHIEVEMENT IN THE KYRGYZ REPUBLIC
31 CASE Network Report No.95
treated case) system of financing of medical establishments, and so on.; (iii) changing
medical treatment practices towards improved quality of medical services, introduction of
elements of evidence-based health care, etc.; (iv) strengthening of the public health system;
and (v) transferring of some health care system functions (e.g., provision of medicines and
dental care) to private establishments and organizational changes in the government-funded
health care. Due to its systematic and coherent reform in all components, the Kyrgyz health
care model, which is already distinctively different from the inherited Soviet model, has
become well recognized.
70. Health care reforms are still ongoing and it seems to be premature to make definite
judgments on its successes and failures. Some outcome indicators12 of the health system
reform are improving (e.g., more effective use of available resources) whereas others are not
(e.g., the level of patients’ unofficial payments during treatment in hospitals). However, the
main result of the reform is that the health care system seems to be sustained at
considerably lower levels of government health expenditures (see section 3.2) without radical
deterioration of the health situation in the country: that is, efficiency has improved.
3.1.3. Social protection and social security
71. The protection of the poor and vulnerable in the country is performed mainly through
social insurance and social assistance systems.13 The social insurance system consists
mainly of pensions for former employees or farmers (for old age and disability) and their
dependents (survivorship). Other social insurance benefits are sickness or maternity benefits
for contributors, and funeral benefits for pensioners. The social assistance system includes a
number of cash benefits and privileges.
72. Pensions are the main social protection tool in the country from the point of view of
both coverage and the impact on welfare, and in 2009 accounted for some 80% of public
social protection expenditure. As of late-2009, there were 565,000 pensioners (10.6% of the
total population). Of these, 407,000 were in receipt of old-age pensions, 77,000 disability
pensions and 81,000 survivorship pensions. Total expenditure on pensions in 2009 was
equivalent to 6.4% of GDP.
73. The country inherited from the Soviet Union a pension system with a low pensionable
age (55 for women and 60 for men) and practically universal coverage. Pension entitlements
in this system were generous14 in comparison to the fiscal potential of the state15, with the
12
See impact indicators of health care in section 3.4.1. 13
There are also quite small components of social services for vulnerable groups of the population and labor market policies. 14
Even in 1994, when pensions were already falling, the replacement rate (average pension as percentage of average wage) was 63% – a high value for low-income country.

Roman Mogilevsky, Anarkul Omorova
CASE Network Report No.95 32
result that with the collapse of the Soviet Union, the pension system in the 1990s was
characterized by substantial arrears16. Delays in the payment of pensions and their payment
in kind were the frequent result. The need for pension reform became evident for the
Government, donors, and a broad range of other stakeholders. A new pension law for the
Kyrgyz Republic was adopted in 1997. Important features of the new pension system were:
(i) the gradual increase in the retirement age to 63 for men and 58 for women by 2007; (ii)
the abolition of some pension privileges; and (iii) the introduction of a three-part pension
system. The first component is the so called base pension, which is equal for everybody
having the necessary number of working years (25 years for men and 20 years for women).
The second component is to smooth the transition from the old to the new system. The third
component is a new notionally defined contribution based supplement, which will eventually
replace the second component. The reforms allowed for the transfer of pension liabilities
from the Government to an increasingly balanced Social Fund. The pension system has also
become an effective instrument for reducing poverty amongst the elderly: World Bank data
shows households with pensioners have 20% less risk of becoming poor compared to
households without pensioners. Even so, pensions remain low in Kyrgyzstan: the average
old age pension at the end of 2009 was marginally above USD50 a month17. The longer-term
sustainability of pension system was weakened by amendments introduced into the Pension
Law in 2007 which effectively returned the pension age to 60/55, increasing the number of
pensioners substantially as a result, forcing the introduction of further adjustments to the
system in order to rebalance Social Fund financing in order to meet growing pension
liabilities.
74. In the social assistance system, there are two targeted cash benefit programs: the
Benefit for Poor Families with Children (BPFC) and social allowances. The BPFC is a
means-tested cash benefit for individuals from the poorest families with children, who are
unable to support themselves. At the end of 2009, 6.9% of the population benefited from the
BPFC; the average UMB paid out amounted to 172 soms (USD4) per month. Social
allowances are cash benefits paid to defined categories of individuals unable to work (people
with disabilities, families with children with disabilities, orphans, or mothers with many
children, and elderly people without pensions). Approximately 1.2% of the population
received social allowances at the end 2009, and the average allowance amounted to 827
soms per month, i.e., about 5 times higher than average BPFC amount.
15
The source of fiscal sustainability problems for the pension system did not, as in many developed countries, result from the ageing of the population, but rather from the cessation of transfers from the USSR central budget and the subsequent development of a substantial informal sector making no contribution to the pension system. 16
In 1996, for example, total pension liabilities were equal to 6.9% of GDP with a financing gap of 1.7% GDP. 17
The replacement rate is now 38%, which is considerably lower than in majority of other countries.
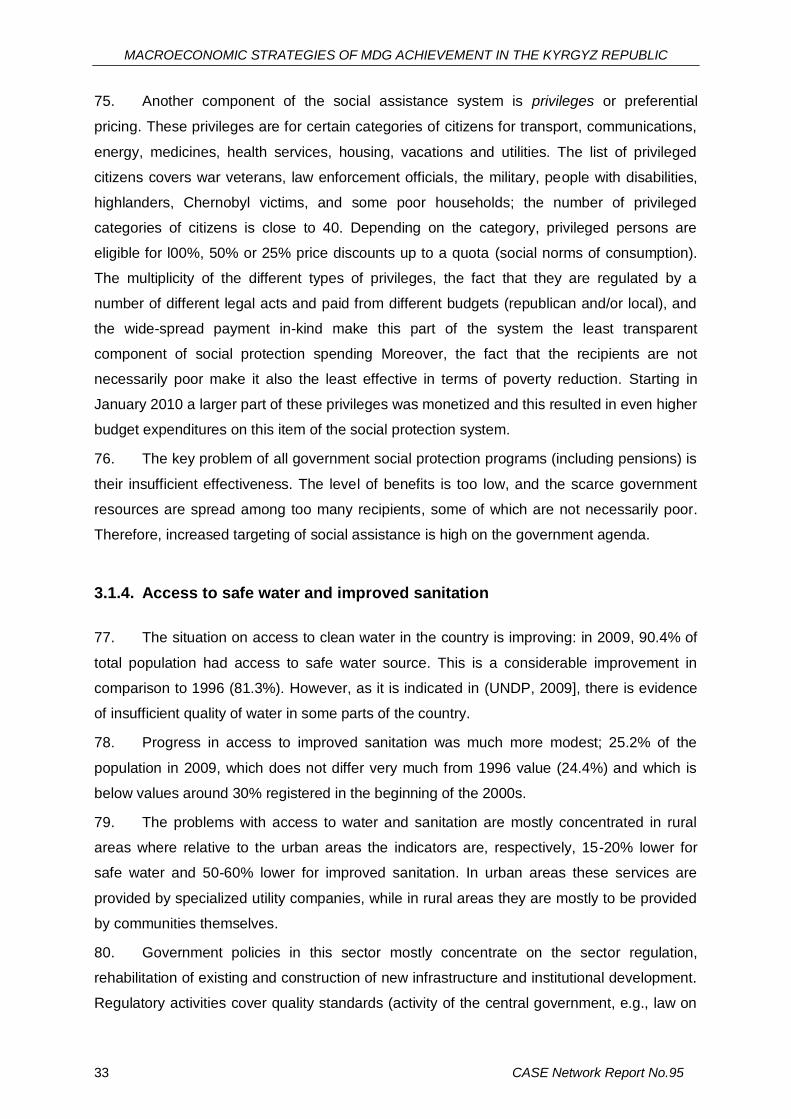
MACROECONOMIC STRATEGIES OF MDG ACHIEVEMENT IN THE KYRGYZ REPUBLIC
33 CASE Network Report No.95
75. Another component of the social assistance system is privileges or preferential
pricing. These privileges are for certain categories of citizens for transport, communications,
energy, medicines, health services, housing, vacations and utilities. The list of privileged
citizens covers war veterans, law enforcement officials, the military, people with disabilities,
highlanders, Chernobyl victims, and some poor households; the number of privileged
categories of citizens is close to 40. Depending on the category, privileged persons are
eligible for l00%, 50% or 25% price discounts up to a quota (social norms of consumption).
The multiplicity of the different types of privileges, the fact that they are regulated by a
number of different legal acts and paid from different budgets (republican and/or local), and
the wide-spread payment in-kind make this part of the system the least transparent
component of social protection spending Moreover, the fact that the recipients are not
necessarily poor make it also the least effective in terms of poverty reduction. Starting in
January 2010 a larger part of these privileges was monetized and this resulted in even higher
budget expenditures on this item of the social protection system.
76. The key problem of all government social protection programs (including pensions) is
their insufficient effectiveness. The level of benefits is too low, and the scarce government
resources are spread among too many recipients, some of which are not necessarily poor.
Therefore, increased targeting of social assistance is high on the government agenda.
3.1.4. Access to safe water and improved sanitation
77. The situation on access to clean water in the country is improving: in 2009, 90.4% of
total population had access to safe water source. This is a considerable improvement in
comparison to 1996 (81.3%). However, as it is indicated in (UNDP, 2009], there is evidence
of insufficient quality of water in some parts of the country.
78. Progress in access to improved sanitation was much more modest; 25.2% of the
population in 2009, which does not differ very much from 1996 value (24.4%) and which is
below values around 30% registered in the beginning of the 2000s.
79. The problems with access to water and sanitation are mostly concentrated in rural
areas where relative to the urban areas the indicators are, respectively, 15-20% lower for
safe water and 50-60% lower for improved sanitation. In urban areas these services are
provided by specialized utility companies, while in rural areas they are mostly to be provided
by communities themselves.
80. Government policies in this sector mostly concentrate on the sector regulation,
rehabilitation of existing and construction of new infrastructure and institutional development.
Regulatory activities cover quality standards (activity of the central government, e.g., law on

Roman Mogilevsky, Anarkul Omorova
CASE Network Report No.95 34
drinking water adopted in 1999) and size of user fees in urban areas collected by utility
companies (local governments). Institutional development relates to establishing and
enabling self-governing Rural Communities of Drinking Water Users, which received all
previously created rural water pipelines as well as responsibilities for this infrastructure
operation and maintenance and setting of water tariffs.
81. Financing of the sector is organized in such way that recurrent expenditures of utility
companies and rural water suppliers are covered by user fees. The size of fees does not
provide utility companies with resources for any considerable investments, so development
of water and sanitation infrastructure is based almost solely on government spending. In
2000s, the government implemented ―Taza Suu‖ (clean water) program supported by loans
of the World Bank and the Asian Development Bank in total worth USD70 million. Hundreds
of villages and water supply projects have been implemented in the framework of this
program. Some smaller donor-supported infrastructure, institutional development and
awareness raising projects have also been implemented through the country. Apparently,
further improvement of the access of the population to safe water and appropriate sanitation
require continuous public investments. Along with this, households’ financed and
implemented improvements (especially with regards to sanitation facilities in rural areas) are
to be encouraged.
3.2. Evolution and structure of public social spending
82. Social spending has always been a very large component of government
expenditures in Kyrgyzstan. For all years since 1990 the share of social spending in general
government expenditures was above or equal to 50% (Figure 9). The share of these
expenditures was especially high in the mid-1990s, when the economy was going through its
most difficult episode. In the 2000s, the government managed to sustain and even increase
the shares of education and health in government expenditures, as these were considered
priority sectors. At the same time, starting from the late-1990s the share of social protection
was on the decline, in part because the government allowed for a decrease of social benefits
in real terms and of pensions in relation to wages.
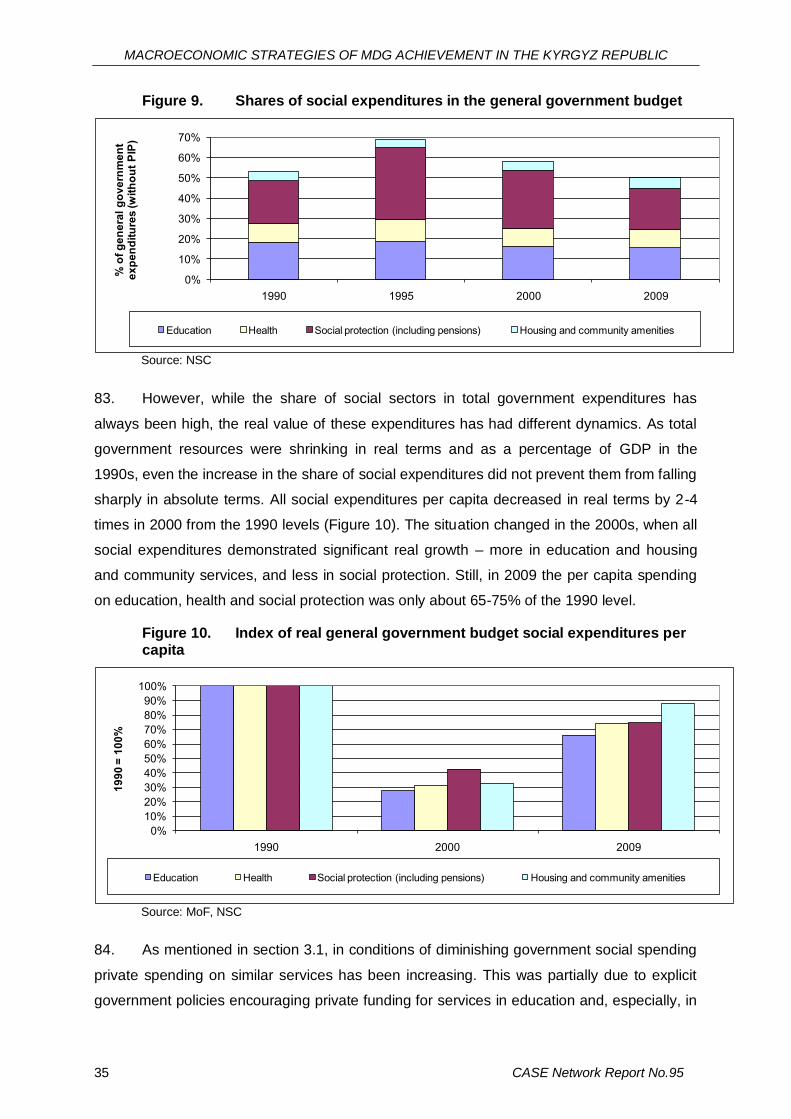
MACROECONOMIC STRATEGIES OF MDG ACHIEVEMENT IN THE KYRGYZ REPUBLIC
35 CASE Network Report No.95
Figure 9. Shares of social expenditures in the general government budget
0%
10%
20%
30%
40%
50%
60%
70%
1990 1995 2000 2009
% o
f g
en
era
l g
ov
ern
me
nt
ex
pe
nd
itu
res
(w
ith
ou
t P
IP)
Education Health Social protection (including pensions) Housing and community amenities
Source: NSC
83. However, while the share of social sectors in total government expenditures has
always been high, the real value of these expenditures has had different dynamics. As total
government resources were shrinking in real terms and as a percentage of GDP in the
1990s, even the increase in the share of social expenditures did not prevent them from falling
sharply in absolute terms. All social expenditures per capita decreased in real terms by 2-4
times in 2000 from the 1990 levels (Figure 10). The situation changed in the 2000s, when all
social expenditures demonstrated significant real growth – more in education and housing
and community services, and less in social protection. Still, in 2009 the per capita spending
on education, health and social protection was only about 65-75% of the 1990 level.
Figure 10. Index of real general government budget social expenditures per capita
0%
10%
20%
30%
40%
50%
60%
70%
80%
90%
100%
1990 2000 2009
19
90
= 1
00
%
Education Health Social protection (including pensions) Housing and community amenities
Source: MoF, NSC
84. As mentioned in section 3.1, in conditions of diminishing government social spending
private spending on similar services has been increasing. This was partially due to explicit
government policies encouraging private funding for services in education and, especially, in

Roman Mogilevsky, Anarkul Omorova
CASE Network Report No.95 36
health (see sections 3.1.1 and 3.1.2) and partially due to high population demand for these
services. Purely private establishments in social service provision are relatively few; much
more often government establishments offer services paid by consumers (e.g., patients or
students’ parents) along with services paid from the government budget. In 2009, 15% of
total financing of government educational establishments were received from paid services
(this share is higher in secondary professional training and especially in university education)
and official payments of patients in the health care system were 10% of total government
budget of the sector. Accounting for other out-of-pocket expenses in health care (medicines,
informal payments etc.), the share of private funding of health services in total health
spending was 57%, i.e., considerably higher than the share of public spending.
Figure 11. Public expenditures on education and health per capita, 2007
0
50
100
150
200
250
300
350
400
450
500
550
600
650
Education Health
USD
PP
P
Kyrgyz Republic Kazakhstan Russian Federation
Source: World Development Indicators
85. This reduction in public spending on education and health takes place at the same
time that the pattern is contrary in other countries that are investing heavily in human capital.
This creates a gap between Kyrgyzstan and its neighbors (Figure 11). In 2007, the Kyrgyz
government spent on education 4.6 times less than the government did in Russia and 2.3
times less than in Kazakhstan18; the gap in health spending was even larger: more than 7
times difference with Russia and 3.8 times with Kazakhstan. Obviously, the quantity and
especially quality of services depend very much on the absolute level of spending. Therefore,
18
Due to smaller share of children in population of these countries in comparison to Kyrgyzstan, the gap in per student terms was considerably higher.

MACROECONOMIC STRATEGIES OF MDG ACHIEVEMENT IN THE KYRGYZ REPUBLIC
37 CASE Network Report No.95
the current level of public education and health spending in Kyrgyzstan should be seen as
insufficient for maintenance of service quality corresponding to any reasonable modern
international standards.
3.3. Evolution of the MDGs during the period 1991-2008
3.3.1. Is the country on-track to achieve the MDGs?
86. In Kyrgyzstan, monitoring of the country progress towards MDGs is implemented on a
regular basis. The first MDG progress report was published in 2003 and the second in 2009.
Taking into account its development situation, the country has substantially adjusted some of
the MDG targets and indicators. A summary of key MDG indicators, the most relevant for the
purposes of this paper, is provided in Table 3.
Table 3. Key MDG indicators in Kyrgyzstan
Baseline Last observation 2015 target
Progress assessment Year Value Year Value
Goal 1. Radical reduction of extreme poverty
Extreme poverty level19, % 2000 32,9 2007 6.6 12,9 On track
Goal 2. Achieve universal basic secondary20 education
Net enrolment ratio in basic secondary education, girls, %
1990 92.3 2007 97.3 100
On track Net enrolment ratio in basic secondary education, boys, %
1990 91.7 2007 97.8 100
Goal 3. Promote gender equality and empower women
Ratio of women’s wages to men’s wages, %
1996 73 2007 67.3 100 Off track
Goal 4. Reduce child mortality
Under-five mortality rate, per 1,000 live births
1990 41.3 2007 35.3 10.4 Off track
Goal 5. Improve maternal health
Maternal mortality ratio, per 100,000 live births
1990 62.9 2007 51.9 15.7 Off track
Goal 6. Combat HIV/AIDS, malaria and other diseases
Tuberculosis prevalence, cases per 100,000 people
1990 52.1 200721 115.5 52.0 Off track
Goal 7. Ensure environmental sustainability
Proportion of the population with sustainable access to an improved water source, %
1996 81.3 2007 93.0 90.0 On track
Proportion of the population with access to improved sanitation, %
1996 24.0 2007 24.2 40.0 Off track
Source: UNDP
19
National poverty line. 20
Different from primary education in international goal formulation. 21
2001 value of this indicator was 167.8.

Roman Mogilevsky, Anarkul Omorova
CASE Network Report No.95 38
87. As follows from the table, the assessment of the country’s progress towards MDGs is
mixed. The country is on track with regards to extreme poverty reduction (MDG1), providing
universal access to basic secondary education22 (MDG2) and access to improved water
source (MDG7). The country made some, albeit insufficient, progress towards reduction of
child and maternal mortality (MDGs 4 and 5) and TB prevalence (MDG6). There was no
progress – or the country has even witnessed setbacks – regarding gender equality (MDG3)
and access of the population to improved sanitation (MDG7). In addition, it is worth to note
that, as mentioned above, the poverty situation in Kyrgyzstan is fragile and dependent on
exogenous shocks and the main problem in education is not so much enrollment, but quality.
Finally, the second MDG Progress Report (UNDP, 2009) stipulates that quality of potable
water does not always correspond to standards. Thus, the country has a very dense MDG
achievement agenda up to 2015. There is a high probability that some MDGs would not be
achieved by 2015.
3.3.2. Policies for MDG achievement
88. According to the Government’s newly adopted Country Development Strategy 2009-
2011 and the latest MDG progress report, key policies aimed at MDG achievement23 include:
Goal 1.
Promotion of sustainable economic growth
Maintenance of macroeconomic stability and control over inflation
Rural and regional development
Targeted and effective social protection
Goal 2.
Improvement of quality of education
Modernization of the contents of education
Increased efficiency of organization and financing of education
Goals 4-5.
Improved access of population to and quality of antenatal and perinatal care through
creation of better health care infrastructure and better supply of medicines and other inputs
as well as retention of skilled medical personnel in the sector and in the country
Improved access of population to early childhood development programs including
programs implemented on community level
22
However, with regards to the net basic secondary school completion rate—another MDG indicator, which is used internationally and also in the MAMS model—the country is off track. Based on UNESCO data, this rate has been estimated at the level of 84.1% (2006) with reasonable target of 95% by 2015. 23
Only goals 1, 2, 4-5, and part of the goal 7 relevant to this study are considered.

MACROECONOMIC STRATEGIES OF MDG ACHIEVEMENT IN THE KYRGYZ REPUBLIC
39 CASE Network Report No.95
Public information campaigning on healthy living style and maternity protection, family
planning methods etc.
Goal 7.
Proper monitoring of the situation with the water and sanitation infrastructure
Ensuring of financial sustainability of utility enterprises providing water and sanitation
supply services
Public information campaigning on sanitary issues
Strengthening coordinating role of the government in the sector
89. These policies seem to be based on much more careful accounting of existing
problems and resources available for their solution than before. It is planned to combine
increased government funding in some directions (e.g., energy, roads and other production
infrastructure, health) with significant increase in efficiency of government expenditures in all
sectors (especially social protection and education) and mobilization of private resources
(e.g., in water and sanitation supply through economically meaningful user fees).
90. The developments in social sector described above seem to provide a mixed picture
of the impact of reforms on the poor. On one side, the government managed to preserve
basic social infrastructure and access of all layers of the population to critically important
services. Some important welfare indicators are improving (e.g., access to improved water
source, child and maternal mortality), while sometimes more slowly than needed, some
negative trends (e.g., increase in TB morbidity) have been reversed. As it was mentioned,
the gap between the poor and the rich in access to health services has been somewhat
reduced. Pensions and (to a lesser extent) other social protection programs do serve as an
extreme-poverty-preventing mechanism.
91. Some positive improvements are to be attributed not so much to social policies, but to
responsible macroeconomic policies in 2000s (e.g., control over inflation) and changes in
economic and social behavior of the population (increased labor migration generating
remittances, reduced fertility causing decline in child and maternal mortality, urbanization
easing clean water supply).
92. On the other side, social policies have not prevented from general deterioration of
service quality (e.g., in education and more sophisticated health care). Limited supply of
quality services is being balanced with existing demand mainly by means of out-of-pocket
user payments. In such situation, the access of poor population to quality services suffered to
a disproportionally large extent.

Roman Mogilevsky, Anarkul Omorova
CASE Network Report No.95 40
4. Sector analysis of MDG determinants
93. This section’s purpose is to identify the factors determining dynamics of MDG
indicators covered by MAMS and to link them to the key economic/fiscal variables available
in the model. This allows for establishing explicit mechanisms to transmit changes in
macroeconomic and sector policies into MDG outcomes.
94. Analysis in this section covers the following MDGs and indicators:
MDG2 ―Achievement of universal basic secondary education‖; MAMS target indicator
for this goal is the net completion rate for basic secondary education24.
MDG4 ―Reduction of child mortality‖; MAMS target indicator for this goal is the under-
five mortality rate.
MDG4 ―Improvement of maternal health‖; MAMS target indicator for this goal is the
maternal mortality ratio.
MDG7a ―Improvement of access of the population to safe drinking water‖; MAMS
target indicator for this sub-goal is the proportion of the population with sustainable
access to an improved water source.
MDG7b ―Improvement of access of the population to basic sanitation‖; MAMS target
indicator for this sub-goal is the proportion of the population with access to improved
sanitation.
95. Basic secondary education completion rate is a result of interaction of two variables:
(i) net enrolment rate for the first grade, and (ii) average share of students passing in each
grade (for grades 1-8). MAMS requires establishing rules governing dynamics of each of
these two variables. In addition, determinants for few other variables describing students’
behavior on the second and third cycles of education are to be identified. These variables
include: (i) share of graduates from the previous cycle entering the first grade of a new cycle
(for secondary and tertiary education), and (ii) average shares of students passing in each
grade on secondary and tertiary cycles.
96. Potential determinants for all indicators have been selected on the basis of previous
studies on MDG achievement in Kyrgyzstan. Testing of significance of these determinants’
influence on the MDG indicators (or their components) and assigning of the relationships’
functional form and their ―parametrization‖ have been based on three main sources of data:
Kyrgyz Integrated Household Survey database for 2007 (source – NSC);
24 Basic secondary education (1-9 grades) is the first cycle in the education system of the Kyrgyz Republic; the
second cycle includes general secondary education (10-11 grades) or secondary professional education in
technical colleges and similar educational establishments; the third cycle refer to university education.
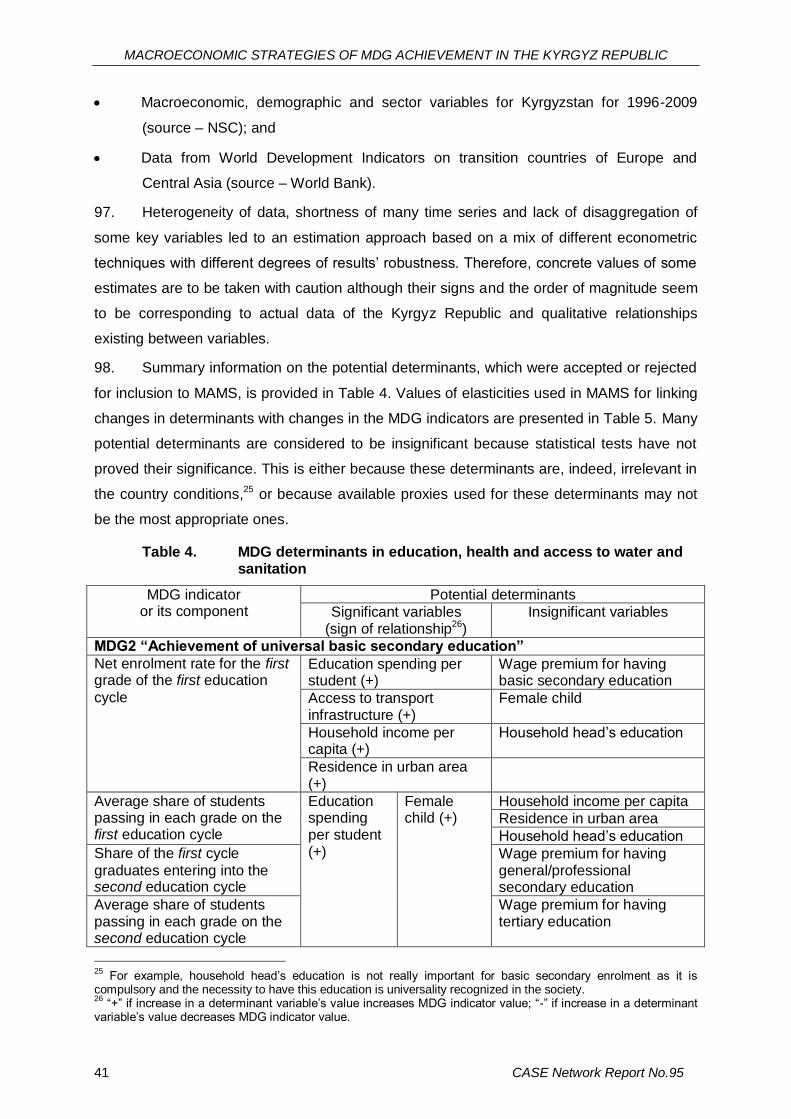
MACROECONOMIC STRATEGIES OF MDG ACHIEVEMENT IN THE KYRGYZ REPUBLIC
41 CASE Network Report No.95
Macroeconomic, demographic and sector variables for Kyrgyzstan for 1996-2009
(source – NSC); and
Data from World Development Indicators on transition countries of Europe and
Central Asia (source – World Bank).
97. Heterogeneity of data, shortness of many time series and lack of disaggregation of
some key variables led to an estimation approach based on a mix of different econometric
techniques with different degrees of results’ robustness. Therefore, concrete values of some
estimates are to be taken with caution although their signs and the order of magnitude seem
to be corresponding to actual data of the Kyrgyz Republic and qualitative relationships
existing between variables.
98. Summary information on the potential determinants, which were accepted or rejected
for inclusion to MAMS, is provided in Table 4. Values of elasticities used in MAMS for linking
changes in determinants with changes in the MDG indicators are presented in Table 5. Many
potential determinants are considered to be insignificant because statistical tests have not
proved their significance. This is either because these determinants are, indeed, irrelevant in
the country conditions,25 or because available proxies used for these determinants may not
be the most appropriate ones.
Table 4. MDG determinants in education, health and access to water and sanitation
MDG indicator or its component
Potential determinants
Significant variables (sign of relationship26)
Insignificant variables
MDG2 “Achievement of universal basic secondary education”
Net enrolment rate for the first grade of the first education
cycle
Education spending per student (+)
Wage premium for having basic secondary education
Access to transport infrastructure (+)
Female child
Household income per capita (+)
Household head’s education
Residence in urban area (+)
Average share of students passing in each grade on the first education cycle
Education spending per student (+)
Female child (+)
Household income per capita
Residence in urban area
Household head’s education
Share of the first cycle
graduates entering into the second education cycle
Wage premium for having general/professional secondary education
Average share of students passing in each grade on the second education cycle
Wage premium for having tertiary education
25
For example, household head’s education is not really important for basic secondary enrolment as it is compulsory and the necessity to have this education is universality recognized in the society. 26
―+‖ if increase in a determinant variable’s value increases MDG indicator value; ―-‖ if increase in a determinant variable’s value decreases MDG indicator value.

Roman Mogilevsky, Anarkul Omorova
CASE Network Report No.95 42
MDG indicator or its component
Potential determinants
Significant variables (sign of relationship26)
Insignificant variables
Share of the second cycle graduates entering into the third education cycle
Access to transport infrastructure
Average share of students passing in each grade on the third education cycle
MDG4 “Reduction of child mortality”
Under-five mortality rate Public health expenditures per capita (-)
GDP per capita / Household expenditures per capita
Proportion of the population with sustainable access to an improved water source /MDG7a/ (-)
Fertility rate
Proportion of the population with access to improved sanitation /MDG7b/ (-)
MDG5 “Improvement of maternal health”
Maternal mortality ratio Public health expenditures per capita (-)
GDP per capita / Household expenditures per capita
Proportion of the population with access to improved sanitation /MDG7b/ (-)
Proportion of the population with sustainable access to an improved water source (MDG7a)
Fertility rate (+)
MDG7a “Improvement of access of the population to safe drinking water”
Proportion of the population with sustainable access to an improved water source
Spending on water and sanitation (+)
Household income per capita (+)
Spending on other infrastructure27 (+)
Residence in urban area (+)
MDG7b “Improvement of access of the population to basic sanitation”
Proportion of the population with access to improved sanitation
Household income per capita (+)
Spending on water and sanitation (+)
Spending on other infrastructure (+)
Residence in urban area (+)
Source: Authors’ calculations
27
Total infrastructure expenditures less spending on infrastructure in education, health care and water and sanitation.

MACROECONOMIC STRATEGIES OF MDG ACHIEVEMENT IN THE KYRGYZ REPUBLIC
43 CASE Network Report No.95
Table 5. Elasticity values of the MDG indicators with regards to their determinants
MDG indicator or its component
Health expenditures
per capita
Expenditures on water and
sanitation per capita
Education expenditures per student
Capital stock in other
infrastructure
Household consumption
per capita
MDG7a indicator
MDG7b indicator
Under-five mortality rate (MDG4)
-0.592 -0.711 -0.698
Maternal mortality ratio (MDG5)
-0.312 -0.851
Proportion of the population with sustainable access to an improved water source (MDG7a)
0.389 0.602 0.004
Proportion of the population with access to improved sanitation (MDG7b)
0.687 0.242 0.340
Net enrolment rate for the first grade of the first education cycle (MDG2)
0.141 0.058 0.007
Average share of students passing in each grade on the first education cycle (MDG2)
0.059
Share of the first cycle graduates entering into the second education cycle (MDG2)
1.383
Average share of students passing in each grade on the second education cycle (MDG2)
0.059
Share of the second cycle graduates entering into the third education cycle (MDG2)
0.587
Average share of students passing in each grade on the third education cycle (MDG2)
0.054
Source: Authors’ calculations
99. As follows from the Tables 4 and 5, there is some interdependence between MDG
indicators, i.e., progress towards MDG7 contributes also to progress in MDGs 4 and 5. This
synergy effect is important, because, as indicated in chapter 6 of this paper, this allows for
saving resources in comparison to isolated treatment of each goal.
100. This analysis of MDG determinants allow for identifying factors, which contribute to
the progress towards MDGs and could serve as policy variables in the MAMS simulations.
These factors include28: (i) government spending in relevant sector, (ii) general economic
growth to the extent it results in growth of household incomes, (iii) investments into other
(transport and energy) infrastructure.
28
Some other factors, which influence MDG outcomes, could not be considered as policy variables as the government would not be able to change them in any significant way, e.g., fertility rate and residence of a household in urban/rural area.

Roman Mogilevsky, Anarkul Omorova
CASE Network Report No.95 44
5. Calibration of MAMS with country-specific data
101. The MAMS model has been calibrated to generate simulation results to be relevant to
the situation in Kyrgyzstan. Calibration has been implemented on the basis of actual Kyrgyz
statistical data.
102. MAMS includes the following key data blocks:
Social accounting matrix (SAM);
Miscellaneous macroeconomic and education-related time series; and
Elasticities, i.e., parameters of relationships between variables in the model.
103. The SAM describes all key components of the economy. The Kyrgyz SAM has 12
sectors of economy (and correspondingly 12 commodities produced): agriculture, mining and
metallurgy, manufacturing, energy, other infrastructure (construction and roads), commercial
services, general government services as well as five MDG-related sectors: three cycles of
education, health, and water and sanitation. Other SAM components/accounts are
production factors (three labor types according to the highest level of education achieved by
a worker and four capital types: one for private capital and three for government capital
employed in water and sanitation, other infrastructure, and government services), three
institutions (households, government, and rest of the world), three types of taxes (direct,
import, and other indirect taxes). The SAM also contains several other accounts related to
different types of investments, interest payments, savings and capital. Altogether the SAM
contains 54 accounts.
104. The base year for the SAM and, hence, for MAMS in general is 2006. This year has
been selected because the latest Input-Output table—key source of information for building
of the SAM—is available for 2006. Other information sources for the SAM include balance of
payments (NBKR), fiscal accounts (MoF and IMF), and education sector information (NSC).
105. Macroeconomic time series used for calibration of the model include data on
population in total and by age group, employment by labor type, unemployment rates by
labor type, government investments and consumption by sector, public and private foreign
debt. Sources for this data are also NSC, NBKR and MoF as well as the UN Department of
Statistics with regards to the population dynamics.
106. Education sector data used in the model include total enrolment to educational
institutions by cycle and detailed information on behavior of children/students in enrolment to
school, passing in from one grade to another and from one cycle to the next one, grade
repetition, dropping out of education system etc. These data have been mostly taken from a
detailed UNESCO database and supplemented by NSC data.

MACROECONOMIC STRATEGIES OF MDG ACHIEVEMENT IN THE KYRGYZ REPUBLIC
45 CASE Network Report No.95
107. For the estimation of elasticities required by MAMS, long time series describing
relatively stable economic situation in the country are needed. These are not available in
Kyrgyzstan with its relatively short history of independent development in turbulent conditions
of transition from one social-economic system to another. Therefore, values of elasticities for
the model have been borrowed from other countries comparable to Kyrgyzstan in terms of
size of the economy, its sector structure, and degree of openness. Multiple runs of the model
for different scenarios demonstrated the ability of these elasticity values to provide a
reasonable description of behavior of the Kyrgyz economy.
108. The analysis of poverty and inequality indicators is not directly generated by MAMS.
A typical CGE model such as MAMS needs to be complemented with a micro-simulation
methodology to make better judgment of the evolution of poverty and inequality in the
scenarios simulates. We follow the approach explained in Vos and Sanchez (2010): that is, a
micro-simulation methodology that takes labor market results from the CGE model and
imputes these into a household- and individual-person-level dataset. Data from the Kyrgyz
Integrated Household Survey (source – NSC) have been used for this purpose.
6. MAMS scenario analysis
109. The scenario analysis of this paper includes consideration of two types of scenarios:
(i) baseline, which implies no significant changes in policies and no major exogenous shocks
to affect the economy in 2011-2015, and (ii) MDG achievement scenarios, which imply
achievement of some or all29 MDGs simultaneously by 2015 due to increased government
spending in sectors directly relevant for MDGs (primary cycle of education for MDG2, health
for MDGs 4 and 5, water and sanitation for MDGs 7a and 7b).
29
―All MDGs‖ relates to the MDGs covered by MAMS, i.e., MDGs 2, 4, 5, 7a, 7b. Achievement of MDG1 is analyzed separately in the section 6.3 through the aforementioned micro-simulations.

Roman Mogilevsky, Anarkul Omorova
CASE Network Report No.95 46
6.1. Baseline scenario
110. The baseline scenario is calibrated in a way to reproduce key actual developments
(GDP growth rate etc.) in the economy in 2007-2010 and is based on the assumption that in
2011-2015 GDP will grow by 7% per annum, which is consistent with the government’s and
IMF’s projections. Export and import prices and remittances in the coming years are
expected to grow at 5% per annum, which reflect previous trends in these variables and
seem to be conservative assumptions. The baseline scenario also assumes that all
government expenditures change in fixed proportion to domestic absorption. Foreign
transfers received by the government and FDI are assumed to change in proportion to GDP,
and government foreign borrowing is expected to stay fixed in USD terms at the 2006 level.
111. Simulation results in MAMS are dependent on the so called closure rules determining
those variables, which change endogenously to maintain macroeconomic balances
(government budget, savings-investments, and external balance) and equilibrium in the
factor markets. In the baseline scenario, taxes adjust endogenously to clear the government
budget balance; saving-investment balance is cleared by household’s savings rate; external
balance is maintained through flexible real exchange rate. Labor markets for all three labor
types are cleared through unemployment rate (if it is above minimum level) or through wages
(if the unemployment rate is at minimum level30). Simulations show that the labor market
clearing by unemployment rate works for relatively abundant labor types (with basic
secondary education and with tertiary education), while for relatively scarce labor type (with
general/professional secondary education) the market is cleared by wages.
112. Simulation results for the baseline scenario show (see Table A1 in Appendix I) that of
all GDP components only exports are expected to grow faster than GDP; all other
components would grow in 2007-2015 by an average rate in the range of 4-5% per annum.
113. Government expenditures would be on the level of 31.3% of GDP on average; this is
below the 2006 level. The role of taxes as a source of government receipts is going to
increase replacing the diminishing share of foreign borrowing. This is based on an
assumption that with the expected resumption of economic growth in 2011-2015 the recent
tax rate cuts (see section 2.3.1) would result in higher tax collections. Under this scenario,
the government expenditures in the MDG-related sectors are going to shrink from 8.2% GDP
in 2006 to 7.0% GDP per annum on average in 2007-2015.
30
The minimum unemployment level in the model is set at 4%.

MACROECONOMIC STRATEGIES OF MDG ACHIEVEMENT IN THE KYRGYZ REPUBLIC
47 CASE Network Report No.95
Figure 12. Dynamics of the MDG indicators under the baseline scenario, 2006-2015
MDG2 MDG7a
84
86
88
90
92
94
96
2006 2007 2008 2009 2010 2011 2012 2013 2014 2015
% o
f to
tal p
op
ula
tio
n o
f re
leva
nt
age
Net basic secondary school completion rate Target
89.5
90.0
90.5
2006 2007 2008 2009 2010 2011 2012 2013 2014 2015
% o
f to
tal p
op
ula
tio
n
Population with sustainable access to an improved water source
Target
MDG4 MDG7b
0
5
10
15
20
25
30
35
40
2006 2007 2008 2009 2010 2011 2012 2013 2014 2015
Pe
r 1
,00
0 li
ve b
irth
s
Under-five mortality rate Target
20
25
30
35
40
45
2006 2007 2008 2009 2010 2011 2012 2013 2014 2015
% o
f to
tal p
op
ula
tio
n
Population with sustainable access to an improved sanitation Target
MDG5
0
10
20
30
40
50
60
2006 2007 2008 2009 2010 2011 2012 2013 2014 2015
Pe
r 1
00
,00
0 li
ve b
irth
s
Maternal mortality ratio Target
Source: Authors’ calculations
114. The skill composition of the labor force and employment is projected to change
towards an increased share of unskilled workers (those with basic secondary education
only). This is a consequence of the transition from the mandatory general secondary to the
basic secondary education made in 1993 (see section 3.1.1 of this paper). Young people,
many of whom leave the education system after completion of the first cycle, would be
gradually replacing retiring workers with mostly general/professional secondary education.
Due to high university enrolment, the number of workers with higher education is expected to
grow faster than total employment. This dynamics of labor supply explains changes in real
Roman Mogilevsky, Anarkul Omorova
CASE Network Report No.95 48
wages, implied by the baseline scenario: wages for abundant labor type with basic
secondary education is going to decrease, and wages for scarce labor type with
general/professional secondary education are to increase.
115. The baseline scenario leads to some improvement in all MDG indicators under
consideration; nevertheless, no one among MDGs 2-7 is going to be achieved under this
scenario (see Figure 12). Thus, lack of pro-active policies aimed at MDG achievement is
associated with a high risk of non-fulfillment of the MDG agenda in the country.
6.2. MDG scenarios
116. Several MDG scenarios are considered in this paper. All MDG scenarios imply
targeted resource mobilization, i.e., increased financing of those sectors, which contribute
directly to the MDG achievement. These scenarios differ from two points of view: (i) which
MDGs are to be achieved, i.e., in which sectors resources are concentrated, and (ii) which
source of financing for the increased MDG-related expenditures is used.
117. For MDG2, the policy variables (spending item responsible for MDG achievement)
are government consumption and investments in the primary cycle of education; for MDGs 4
and 5 these variables are government consumption and investments in health; and for MDGs
7a and 7b the policy instrument is government investments in water and sanitation. As long
as MDGs 4 and 5 (and MDGs 7a and 7b) share the same policy variable, only simultaneous
achievement of these goals is possible in the model; no separate scenarios for these goals
are considered. So, there could be MDG2, MDG45 and MDG7 scenarios. Apart from these, a
combined scenario of simultaneous achievement of all MDGs is possible. Policy variables for
―All MDGs‖ scenario would be government consumption/investments in primary cycle of
education, health and water and sanitation.
118. Selection of an appropriate financing mechanism for MDG achievement is a central
issue in the MAMS scenario analysis. Available financing options include increased: (i)
collections of all or some domestic taxes, (ii) domestic borrowing of the government from
private sector, (iii) foreign borrowing of the government, (iv) foreign transfers to the
government from the rest of the world, and, as considered for this paper in particular, (v) a
mix of some of these options. As follows from the discussion in section 2.3.1 of the paper,
option (ii) is not really possible as domestic financial market is shallow and unable to supply
substantial resources required for financing of MDG achievement programs. Therefore,
increased tax collections (tax), foreign transfers to the government (ftr) and a mix of these
two (mix) are considered as financing options in this paper. The option of foreign borrowing
(fb) has also been added for illustrative purposes while it does not seem to be politically

MACROECONOMIC STRATEGIES OF MDG ACHIEVEMENT IN THE KYRGYZ REPUBLIC
49 CASE Network Report No.95
feasible taking into account the vulnerability of external debt situation in the country and the
well-known hesitation of the government to borrow for social programs.
119. The choice of financing source is to affect simulation results significantly. Tax
financing means that substantial resources are to be redistributed from the private sector to
the government budget; this is to result in slower growth of private consumption, crowding
out of private investments and, hence, in lower economic growth rates and less progress in
poverty reduction. Financing through foreign transfers to the government, on one side,
increases the total amount of resources in the economy and do not reduce resources of the
private sector, so an increase in both private and government consumption and investments
could be expected. However, on the other side, massive inflow of foreign exchange to the
economy is to cause some kind of ―Ditch disease‖ effect: appreciation of real exchange rate,
reduction in exports and increase in imports of goods and services. Foreign borrowing option
is to be very similar to the ftr option; the only differences are additional government
expenditures for interest payments and accumulation of the government’s foreign debt.
Mixed financing option is to produce results somewhere in between the two extreme cases—
tax and ftr—requiring less reduction in economic growth rates than tax option. In this paper,
mix option consists in increase in collections of domestic indirect taxes (VAT, excises, sales
tax etc.) up to 15% GDP (from 11.7% in 2006) with foreign transfers to the government left to
be endogenously determined.
120. Different financing mechanisms also imply different closure rules. For government
closure, tax and mix options are not different from the baseline, while the ftr/fb scenarios are
based on the use of foreign transfers to/borrowing by the government as the clearing variable
respectively. For savings-investments closure, investments and not household savings rate
are endogenous in the MDG scenarios.
121. Altogether, ten MDG scenarios are considered: MDG2-ftr, MDG2-tax, MDG45-ftr,
MDG45-tax, MDG7-ftr, MDG7-tax, All MDG-ftr, All MDG-fb, All MDG-tax, and All MDG-mix.
122. The main results of simulations are presented in Table A1. As expected, with regards
to the economic growth rates all tax scenarios lead to slower growth, and all ftr/fb scenarios
lead to roughly the same growth as in the baseline scenario. The scale of deviation from the
baseline scenario depends on the amount of resources required for achievement of this or
that MDG. For MDGs 2 and 7 this deviation is not very large, and it is quite substantial for
MDGs 4 and 5 achievement scenarios. These goals are among the most problematic from
the point of view of their achievement (see Table 3), so resource requirements in health
spending to achieve them are of significance. Also, as expected, the utilization of the mix
financing scenario allows for less reduction in the economic growth rates in comparison to

Roman Mogilevsky, Anarkul Omorova
CASE Network Report No.95 50
the tax scenario. ―All MDGs‖ scenarios require less increase in government consumption and
investments as they allow for capturing the synergy effect mentioned in section 4.
123. All MDG-related scenarios require a considerable increase in government spending in
comparison to the baseline scenario (Table 6 and Table A1). The highest government
spending level above 39% of GDP is expected under ―All MDGs‖ scenarios. This is
understandable as the government spending is to increase in all three MDG-related sectors
(education, health and water and sanitation). Total government expenditure increase
necessary to the MDGs achievement has been estimated to be in the range 7.8-8.1% of
GDP. It is worth noting, however, that required increase in spending in this case is much less
than the sum of additional spending requirements assessed for each of three sectors taken
alone. Analysis of government spending by sector indicates that main increases are needed
for recurrent spending in primary cycle of education (2.0-2.2% of GDP per annum depending
on financing option in comparison to the baseline scenario), recurrent health spending (1.9-
2.0% of GDP per annum) and especially investments in primary cycle of education (2.9-3.1%
of GDP per annum31). All these increases look quite sensitive, and their implementation
would require making hard policy choices.
Table 6. Additional government expenditures necessary for the MDGs achievement
Expenditure items Increase in comparison to the baseline scenario
MDG2 MDG45 MDG7 All MDGs
ftr tax ftr tax Ftr tax ftr/fb tax mix
Annual average for 2007-2015, % GDP
All MDG-related expenditures 5.1 5.1 6.1 6.7 0.7 0.7 7.8 8.1 7.9
Final consumption in the primary cycle of education
2.1 2.0 0.1 0.0 0.0 0.0 2.2 2.0 2.1
Final consumption in health
0.1 0.0 5.6 6.2 0.0 0.0 1.9 2.0 1.9
Final consumption in water and sanitation
0.0 0.0 0.0 0.0 0.4 0.4 0.4 0.6 0.5
Investments in the primary cycle of education
2.9 3.1 -0.1 -0.1 0.0 0.0 2.9 3.1 3.0
Investments in health 0.0 0.0 0.5 0.6 0.0 0.0 0.1 0.1 0.1
Investments in water and sanitation
0.0 0.0 0.0 0.0 0.3 0.3 0.3 0.3 0.3
Source: Authors’ calculations
124. Scenarios based solely on the tax financing option require a very substantial (up to
8.3% of GDP) increase in the tax collections; this is a real challenge for the government
31
This number is high, but it could be expected taking into account two decades of under-investments in the sector and increasing number of children in the country.

MACROECONOMIC STRATEGIES OF MDG ACHIEVEMENT IN THE KYRGYZ REPUBLIC
51 CASE Network Report No.95
revenue collection service. On the other side, the ftr financing option allows for keeping tax
collections on the baseline scenario’s level or even below it; this is quite feasible. However,
an additional inflow of foreign grant aid in the amount equivalent to 9.1% of GDP per annum
(under ―All MDGs‖ scenarios) is needed for this option. This is a huge amount (roughly
USD400+ million per year), and the ability of international community to supply this amount
seems to be far from being guaranteed. The mix financing option is more acceptable as it
requires only a relatively moderate increase in tax collections (by 2.5% of GDP in
comparison to the baseline) and smaller (albeit still very high) inflow of grant aid (6.1% of
GDP in comparison to 9.1% of GDP under the ftr option). The foreign borrowing option leads
to additional government debt servicing expenditures equivalent of 0.3% of GDP per annum
in comparison to the ftr scenario32 and to the expected foreign debt accumulation of 71.8%
GDP at the end of 201533; all other resource requirements under the fb and ftr scenarios are
the same.
125. Labor market outcomes of the MDG achievement scenarios are not that dramatic.
Consistently with slower economic growth projections, employment of unskilled workers is to
grow slower than under the baseline scenario. Real wages of this labor type are to fall a bit
more than under the baseline. In contrast, wages of skilled workers (those, who completed
tertiary education cycle) are to improve under the MDG achievement scenarios reflecting
higher demand for skilled workers in education and health.
126. Targeted MDGs are, of course, achieved under the MDG scenarios. However, as
follows from Table A1, without targeting, just due to general growth and progress in other
sectors, no MDG is going to be achieved.
127. Summarizing the analysis above, it is possible to conclude that no one of the
scenarios looks feasible from the financing point of view. All of them require financial
resource mobilization of a scale, which is hardly possible to achieve in practice. But even if
these resources are mobilized, their absorption is going to be a challenge. The required rate
of increase in sector spending34 may not be implementable taking into account existing
human resource and governance limitations.
128. Additional MDG-related resource requirements could be reduced, if either (i) higher
economic growth rates would be achieved in 2011-2015 under the baseline scenario, or (ii)
measures increasing cost efficiency of policies would be implemented. It is worth to note that
both promotion of sustainable economic growth and radical improvement in the cost
efficiency of social policies are high priorities of the government policy. MAMS simulations
32
And correspondingly even higher requirements in additional foreign aid inflow (in the form of loans, not grants) by 9.4% of GDP per annum. 33
All other scenarios lead to the foreign debt levels in the range 24.1-26.2% of GDP at the end of 2015. 34
Depending on the financing option and sector, the increases in annual spending may vary from 69% to 9 times!

Roman Mogilevsky, Anarkul Omorova
CASE Network Report No.95 52
indicate that, indeed, increase in the baseline GDP growth rate from 7% to 8% per annum in
2011-2015 results in the reduction of the additional MDG-related government expenditures
by 0.3% of GDP per annum. Similarly, 25% increase in elasticities of MDG indicators with
regards to all government spending variables (the way to simulate an improvement in cost
efficiency of the policies in education, health care and water and sanitation) allows for
tangible (albeit not radical) savings in the range of 0.14-0.17% of GDP.
6.3. Analysis of micro-simulation results for MDG1
129. Results of poverty and inequality simulations of the baseline and the MDG scenarios
are presented in Table A2 (Appendix I). Poverty rates and Gini coefficient values in this table
incorporate all effects related to changes in unemployment rates, shifts in employment by
labor type (i.e., workers’ education) and by sector, and wages’ general level and sector
structure.
130. The results indicate that MDG1 is going to be achieved under any scenario. This is
expected as this goal has been achieved already in the base year of the model (that is,
2006). It seems that MDG1 formulation in Kyrgyzstan could be revised in order to set more
ambitious target in poverty reduction. One option is to formulate MDG1 setting the target for
general (and not extreme) poverty rate at the level of, say, 20% by 2015.
131. One could observe a quite substantial variation in poverty rates between different
scenarios. The higher economic growth rate and education spending in a scenario the lower
poverty rates are. All ftr/fb scenarios, which imply faster economic growth, produce better
results than tax scenarios. The baseline scenario also produces poverty outcomes better
than the majority of tax scenarios. So, there is a kind of trade-off between higher economic
growth rates and faster progress in achievement of MDG1 under the baseline scenario, on
one side, and achievement of MDGs 4, 5, 7, but slower growth and less poverty reduction
under the MDG-tax scenarios, on the other side. The story with MDG2 is different; increased
spending on education results in better households’ incomes35 and lower poverty rates even
under MDG2-tax scenario in the conditions of economic growth slower than in the baseline.
132. Values of Gini coefficient vary little between scenarios. MDG2-5 scenarios result in
slightly lower inequality than in the baseline (due to some shift of employment from lower-
paid agriculture and some other sectors to higher-paid government services as well as
general improvement in labor skills composition), so from this perspective MDG2-5
35
As follows from the simulations results, the higher education spending the better skills composition in the labor force with positive consequences for average wages and households’ incomes.
MACROECONOMIC STRATEGIES OF MDG ACHIEVEMENT IN THE KYRGYZ REPUBLIC
53 CASE Network Report No.95
achievement policies are slightly more pro-poor than current policies simulated in the
baseline scenario. Tax scenarios tend to produce a bit higher inequality than ftr scenarios.

Roman Mogilevsky, Anarkul Omorova
CASE Network Report No.95 54
7. Conclusions and policy implications
133. After a difficult period in the 1990s, the economic situation has substantially improved
in 2000s in Kyrgyzstan. Responsible macroeconomic policies in 2000-2008, adaptation of
population to new realities and new opportunities and positive developments in the
economies of neighboring countries allowed for several years of good economic growth and
significant poverty reduction. Yet, the country remains vulnerable to numerous external and
internal shocks, and its public finance and balance of payments are still fragile.
134. The government’s social policies have been directed towards sustaining the most
important country’s achievements in education, health and access to water and sanitation.
While the access to essential social services has been mostly preserved, quality of a broad
range of services has suffered. Achievement of many MDGs is at risk.
135. MAMS-model-based simulation results indicate that a continuation of the current
policies under the baseline scenario would allow for achieving MDG1 only; the country would
fall short of the targets for MDGs 2, 4, 5, 7a, 7b. Large deviations from the targets are
expected in reducing child and maternal mortality, accessing improved sanitation for a large
share of the population, and in increasing the net completion rate for basic secondary
education.
136. In order to achieve all MDGs, the country needs to increase government spending on
MDG-relevant sectors (education, health, water and sanitation) by 7.8-8.1% of GDP per
annum in comparison to the baseline scenario.
137. This increase in government spending could be financed either through increased
domestic tax collections, or through official foreign transfers to the government, or through
concessional foreign borrowing, or through a mix of these options. All of these financing
options seem to be politically difficult: the estimated increase in government revenue
collections by 8.3% GDP in comparison to the baseline would require a substantial upgrade
in government’s tax collection capacity, implementation of rather radical sector shifts in the
government expenditures (almost all additional revenues are to go to the social sector only
increasing its share in the general government expenditures enormously) and would result in
a somewhat slower economic growth (-0.4% per annum on average). On the other side,
scenarios based on inflows of grant aid do not create these problems, but are based on an
ungrounded assumption that donors would channel levels of aid (9.6% GDP per annum) that
have never been seen in the past of Kyrgyzstan. In the foreign borrowing scenario the level
of the government foreign debt sets above 70% of GDP. This is below the levels registered in
the recent history of Kyrgyzstan, but taking into account that most probably the government

MACROECONOMIC STRATEGIES OF MDG ACHIEVEMENT IN THE KYRGYZ REPUBLIC
55 CASE Network Report No.95
would also borrow for different energy, transport and other infrastructure projects, the
summary level of the foreign debt is going to become unsustainable. Finally, the scenario
that combines increased taxes and aid inflows seems to be more realistic, but it would still
require very substantial increases in both tax collections (by 2.5% GDP per annum) and
grant aid (by 6.1% GDP per annum). Thus, all the MDG-achievement scenarios under
consideration do not seem to be feasible. Obviously, an underlining issue is that the targets
for the MDGs 2-7 are very ambitious in Kyrgyzstan, and time remaining for their achievement
by 2015 is pretty short.
138. The situation is going to be easier, if projected economic growth rates would be
higher. Then, the resources, which are to be redistributed to the MDG-related sectors, would
amount to a smaller share of GDP making this redistribution more politically feasible. This is
possible, if the government would be more successful in implementation of structural
reforms, FDI and private domestic investments attraction and mobilization of resources for
infrastructure development.
139. Another possible way out is a substantial increase in government spending efficiency
allowing for receiving higher social returns for money spent. This seems to correspond to the
government policies as they have been formulated in strategic documents of the country. If
properly implemented, efficiency-oriented policies are able to reduce resource requirements
substantially.
140. Thus, the MDG achievement in the Kyrgyz Republic seems to require combination of
four types of policies: (i) promotion of economic growth in the country, (ii) increased domestic
financing of MDG-related sectors through redistribution of resources between sectors, (iii)
increase in cost efficiency of social policies, and (iv) increased attraction of foreign aid.

Roman Mogilevsky, Anarkul Omorova
CASE Network Report No.95 56
References
Chowdhury, Abdur R. (2003) Private Savings in Transition Economies: are there Terms of
Trade Shocks? William Davidson Institute, Working Paper No. 572.
Gottret, Pablo, Schieber, George J., and Waters, Hugh R. (2008) Good practice in health
financing: lessons from reforms in low and middle-income countries, World Bank.
Hammill, Matthew (2006) Determinants of selected MDGs in the framework of the MAMS
model in Nicaragua, UN ECLAC.
International Monetary Fund (2008) Kyrgyz Republic: Request for an 18-Month Arrangement
Under the Exogenous Shocks Facility—Staff Report; Staff Supplement; Press Release on
the Executive Board Discussion; and Statement by the Executive Director for Kyrgyz
Republic.
Iradian, Garbis (2007) Rapid Growth in the CIS: Is It Sustainable? WIIW Research Reports
336.
Lofgren, Hans, Lee Harris, Rebecca and Robinson, Sherman (2002) A standard computable
general equilibrium (CGE) model in GAMS.
Lofgren, Hans and Carolina Diaz-Bonilla (2010) ―MAMS: An economy-wide model for
analysis of MDG country strategies—an application to Latin America and the Caribbean.‖ In
Marco V. Sanchez, Rob Vos, Enrique Ganuza, Hans Lofgren and Carolina Diaz-Bonilla
(eds.), Public Policies for Human Development: Achieving the Millennium Development
Goals in Latin America. New York and London: Pelgrave/Macmillan for the United Nations.
Ministry of Economic Development of the Kyrgyz Republic (2007) Country Development
Strategy 2007-2010.
Ministry of Economic Development of the Kyrgyz Republic (2009) Country Development
Strategy 2009-2011.
National Bank of the Kyrgyz Republic (2004-2010) Balance of Payments of the Kyrgyz
Republic.
National Bank of the Kyrgyz Republic (2010) Bulletin of the NBKR No. 5 (172).
National Statistical Committee of the Kyrgyz Republic (2007) Review of indicators of the
―Education for All‖ program in the Kyrgyz Republic.
National Statistical Committee of the Kyrgyz Republic (2008) Education and science in the
Kyrgyz Republic.

MACROECONOMIC STRATEGIES OF MDG ACHIEVEMENT IN THE KYRGYZ REPUBLIC
57 CASE Network Report No.95
National Statistical Committee of the Kyrgyz Republic (2008) Employment and
unemployment: results of integrated household survey in 2007.
National Statistical Committee of the Kyrgyz Republic (2008) Input-Output table of the Kyrgyz
Republic for 2006.
National Statistical Committee of the Kyrgyz Republic (2008) National accounts of the Kyrgyz
Republic. 2003-2007.
Round, Jeffery I. (2003) Constructing SAMs for Development Policy Analysis: Lessons
Learned and Challenges Ahead, Economic Systems Research, Vol. 15, No. 2.
Sánchez, Marco V. (2004) Rising Inequality and Falling Poverty in Costa Rica’s Agriculture
during Trade Reform. A Macro-Micro General Equilibrium Analysis, Chapter 6. Pp.:159-188.
Maastricht: Shaker Publishing.
Sánchez, Marco V. and Giacomo Sbrana (2009) Determinants of attendance in Jordan’s
education, Department of Economic and Social Affairs (DESA), United Nations, New York.
UNICEF (2008) Children who do not attend school in Kyrgyzstan.
United Nations - Department of Economic and Social Affairs (2008) Assessing Development
Strategies to Achieve the MDGs in Asia. Steps to build the SAM for MAMS for Kyrgyzstan.
United Nations Development Programme (2003) The first progress report on the Millenium
Development Goals in the Kyrgyz Republic.
United Nations Development Programme (2006) Methodology of the MDG needs
assessment in the Kyrgyz Republic (in Russian).
United Nations Development Programme (2008) Manual on the MDG needs assessment in
the Kyrgyz Republic (in Russian).
United Nations Development Programme (2009) The second periodic progress report on the
Millennium Development Goals in the Kyrgyz Republic.
Vashneva, Nina (2009) Kyrgyzstan: Program Taza Suu for improvement of rural water supply
and sanitation conditions (# 360).
Vos, Rob and Marco V. Sánchez (2010) A Non-Parametric Micro-simulation Approach to
Assess Changes in Inequality and Poverty. International Journal of Microsimulation 3(1): 8-
23.
World Bank (2003) Kyrgyz Republic. Enhancing pro-poor growth.
World Bank (2008) Project performance assessment report for Kyrgyz Republic: Health
sector reform project and Second health sector reform project.

Roman Mogilevsky, Anarkul Omorova
CASE Network Report No.95 58
World Bank (2008) Reaching the poor with health services: Reducing Financial Burden of
Health Care for the Poor—the Case of Kyrgyz Health Financing Reform.
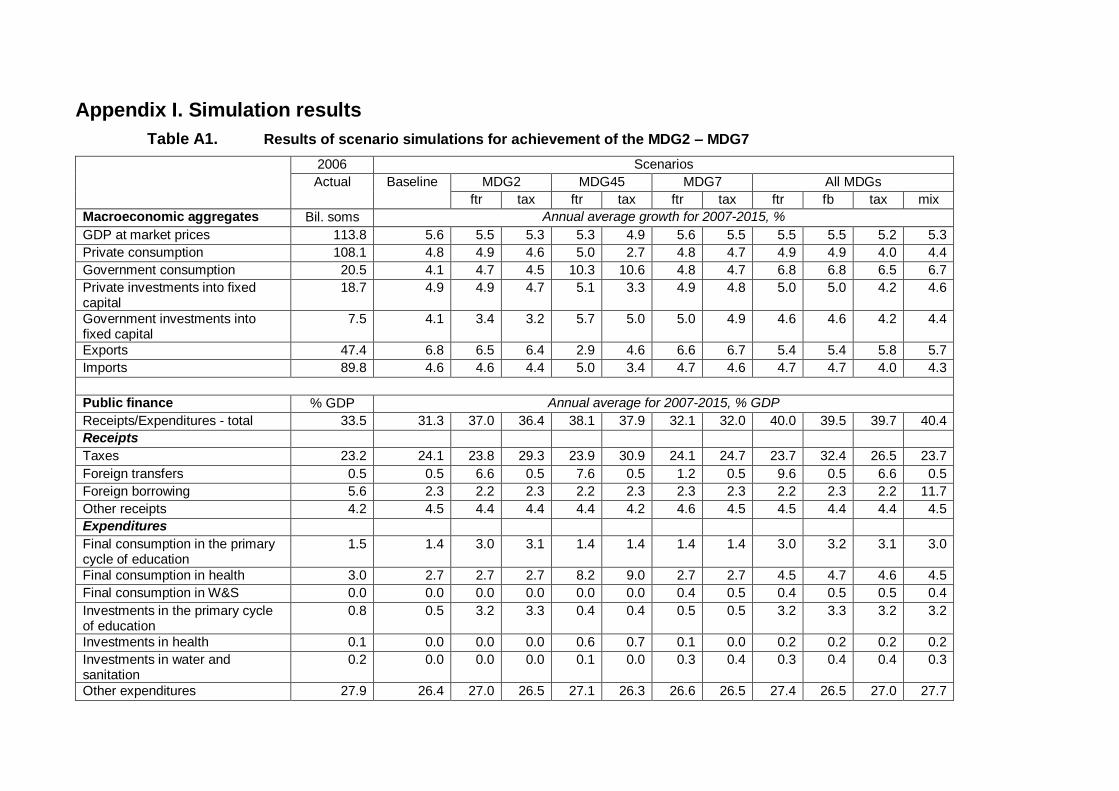
Appendix I. Simulation results
Table A1. Results of scenario simulations for achievement of the MDG2 – MDG7
2006 Scenarios
Actual Baseline MDG2 MDG45 MDG7 All MDGs
ftr tax ftr tax ftr tax ftr fb tax mix
Macroeconomic aggregates Bil. soms Annual average growth for 2007-2015, %
GDP at market prices 113.8 5.6 5.5 5.3 5.3 4.9 5.6 5.5 5.5 5.5 5.2 5.3
Private consumption 108.1 4.8 4.9 4.6 5.0 2.7 4.8 4.7 4.9 4.9 4.0 4.4
Government consumption 20.5 4.1 4.7 4.5 10.3 10.6 4.8 4.7 6.8 6.8 6.5 6.7
Private investments into fixed capital
18.7 4.9 4.9 4.7 5.1 3.3 4.9 4.8 5.0 5.0 4.2 4.6
Government investments into fixed capital
7.5 4.1 3.4 3.2 5.7 5.0 5.0 4.9 4.6 4.6 4.2 4.4
Exports 47.4 6.8 6.5 6.4 2.9 4.6 6.6 6.7 5.4 5.4 5.8 5.7
Imports 89.8 4.6 4.6 4.4 5.0 3.4 4.7 4.6 4.7 4.7 4.0 4.3
Public finance % GDP Annual average for 2007-2015, % GDP
Receipts/Expenditures - total 33.5 31.3 37.0 36.4 38.1 37.9 32.1 32.0 40.0 39.5 39.7 40.4
Receipts
Taxes 23.2 24.1 23.8 29.3 23.9 30.9 24.1 24.7 23.7 32.4 26.5 23.7
Foreign transfers 0.5 0.5 6.6 0.5 7.6 0.5 1.2 0.5 9.6 0.5 6.6 0.5
Foreign borrowing 5.6 2.3 2.2 2.3 2.2 2.3 2.3 2.3 2.2 2.3 2.2 11.7
Other receipts 4.2 4.5 4.4 4.4 4.4 4.2 4.6 4.5 4.5 4.4 4.4 4.5
Expenditures
Final consumption in the primary cycle of education
1.5 1.4 3.0 3.1 1.4 1.4 1.4 1.4 3.0 3.2 3.1 3.0
Final consumption in health 3.0 2.7 2.7 2.7 8.2 9.0 2.7 2.7 4.5 4.7 4.6 4.5
Final consumption in W&S 0.0 0.0 0.0 0.0 0.0 0.0 0.4 0.5 0.4 0.5 0.5 0.4
Investments in the primary cycle of education
0.8 0.5 3.2 3.3 0.4 0.4 0.5 0.5 3.2 3.3 3.2 3.2
Investments in health 0.1 0.0 0.0 0.0 0.6 0.7 0.1 0.0 0.2 0.2 0.2 0.2
Investments in water and sanitation
0.2 0.0 0.0 0.0 0.1 0.0 0.3 0.4 0.3 0.4 0.4 0.3
Other expenditures 27.9 26.4 27.0 26.5 27.1 26.3 26.6 26.5 27.4 26.5 27.0 27.7
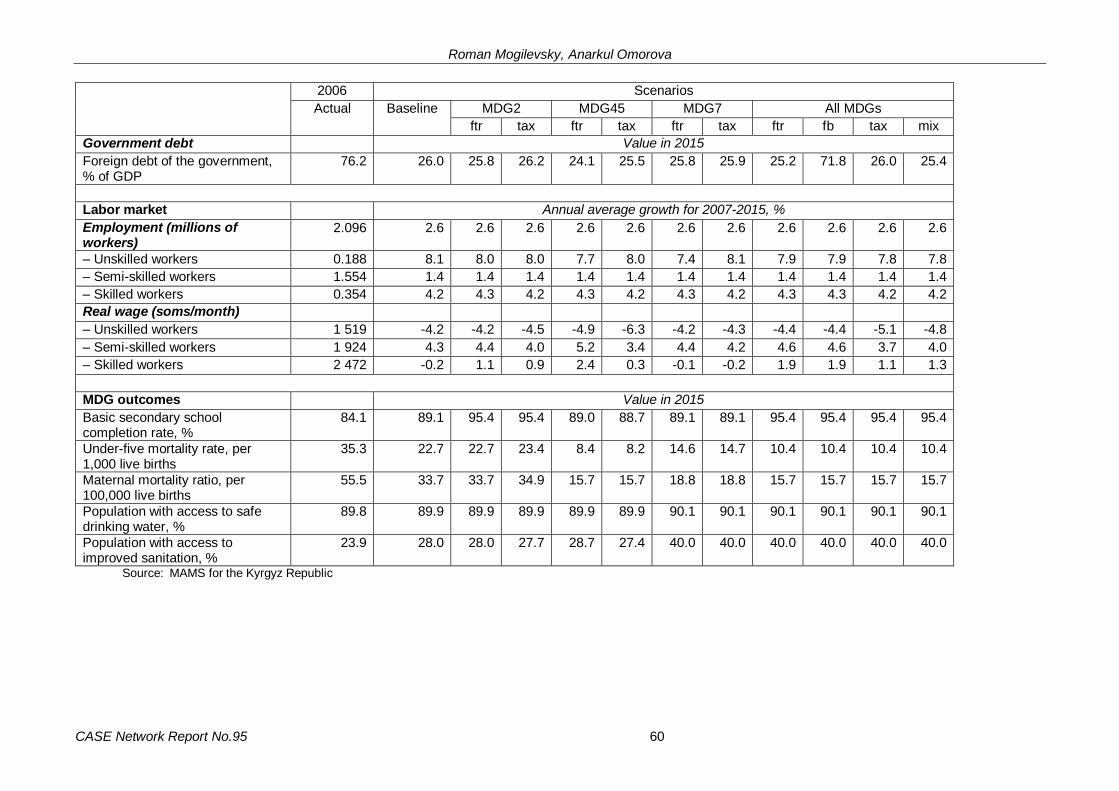
Roman Mogilevsky, Anarkul Omorova
CASE Network Report No.95 60
2006 Scenarios
Actual Baseline MDG2 MDG45 MDG7 All MDGs
ftr tax ftr tax ftr tax ftr fb tax mix
Government debt Value in 2015
Foreign debt of the government, % of GDP
76.2 26.0 25.8 26.2 24.1 25.5 25.8 25.9 25.2 71.8 26.0 25.4
Labor market Annual average growth for 2007-2015, %
Employment (millions of workers)
2.096 2.6 2.6 2.6 2.6 2.6 2.6 2.6 2.6 2.6 2.6 2.6
– Unskilled workers 0.188 8.1 8.0 8.0 7.7 8.0 7.4 8.1 7.9 7.9 7.8 7.8
– Semi-skilled workers 1.554 1.4 1.4 1.4 1.4 1.4 1.4 1.4 1.4 1.4 1.4 1.4
– Skilled workers 0.354 4.2 4.3 4.2 4.3 4.2 4.3 4.2 4.3 4.3 4.2 4.2
Real wage (soms/month)
– Unskilled workers 1 519 -4.2 -4.2 -4.5 -4.9 -6.3 -4.2 -4.3 -4.4 -4.4 -5.1 -4.8
– Semi-skilled workers 1 924 4.3 4.4 4.0 5.2 3.4 4.4 4.2 4.6 4.6 3.7 4.0
– Skilled workers 2 472 -0.2 1.1 0.9 2.4 0.3 -0.1 -0.2 1.9 1.9 1.1 1.3
MDG outcomes Value in 2015
Basic secondary school completion rate, %
84.1 89.1 95.4 95.4 89.0 88.7 89.1 89.1 95.4 95.4 95.4 95.4
Under-five mortality rate, per 1,000 live births
35.3 22.7 22.7 23.4 8.4 8.2 14.6 14.7 10.4 10.4 10.4 10.4
Maternal mortality ratio, per 100,000 live births
55.5 33.7 33.7 34.9 15.7 15.7 18.8 18.8 15.7 15.7 15.7 15.7
Population with access to safe drinking water, %
89.8 89.9 89.9 89.9 89.9 89.9 90.1 90.1 90.1 90.1 90.1 90.1
Population with access to improved sanitation, %
23.9 28.0 28.0 27.7 28.7 27.4 40.0 40.0 40.0 40.0 40.0 40.0
Source: MAMS for the Kyrgyz Republic

MACROECONOMIC STRATEGIES OF MDG ACHIEVEMENT IN THE KYRGYZ REPUBLIC
61 CASE Network Report No.95
Table A2. Poverty and inequality estimates for the MDG achievement scenarios
2006 Scenarios
Actual Baseline MDG2 MDG45 MDG7 All MDGs
ftr tax ftr tax ftr tax ftr/fb tax mix
Value in 2015
Extreme poverty rate, % 9.1 7.1 6.2 6.9 6.3 8.6 6.9 7.4 6.3 7.9 6.6
General poverty rate, % 39.9 25.1 22.2 24.5 19.7 26.7 24.2 26.1 22.4 27.7 23.8
Gini coefficient 0.402 0.409 0.406 0.406 0.406 0.403 0.410 0.409 0.405 0.404 0.404 Source: MAMS for the Kyrgyz Republic


