CASE Network Report 90 - Social Security, Labour Market and Restructuring: Current Situation and...
98
-
Upload
case-center-for-social-and-economic-research -
Category
Economy & Finance
-
view
97 -
download
5
description
The paper focuses on the social safety nets in Russian Federation and Ukraine in the view of changes on the labour market since the beginning of economic transition. The authors showed that many past phenomena (e.g. restructuring of the economy, wage and pension arrears, new groups at-risk-of-poverty, demographic transition) caused a need to change an old type social safety net (SSN) into the new one, better adapted to emerging more liberal economy problems. Additionally, the authors analysed some gender specific issues related to social security that are caused mainly by inequalities in the labour market. Differences of earnings between men and women in Russia caused by sector segregation account for seem to be more important than the gap between gender earnings attributed to the position. In Ukraine the main contributors to gross gender differential of log earnings (that equals to 32%) explained by our model are sector segregation and occupation. The authors also pointed out to future policy challenges in the area of social security systems in both countries. The retirement reforms introduced recently are a step in the right direction, although their impact will not be felt for a number of years. Other reforms, with more immediate results, are necessary. Social safety nets should be made more efficient and social benefits should be better targeted. Authored by: Marek Gora, Grzegorz Kula, Oleksandr Rohozynsky, Magdalena Rokicka, Anna Ruzik-Sierdzinska Published in 2009
Transcript of CASE Network Report 90 - Social Security, Labour Market and Restructuring: Current Situation and...

The views and opinions expressed here reflect the authors’ point of view and not necessarily those of CASE Network.
The report was prepared within a project on Economic and Social Conse-quences of Industrial Restructuring in Russia and Ukraine (ESCIRRU) carried out under the FP6 (Sixth Framework Program) and financed by DG Research. The project was led by the German Institute for Economic Research (DIW Berlin – German Institute for Economic Research) and partners from across the EU as well as Russia and the Ukraine. The report summarizes the results of the Workpackage WP8 – DP1on Social security, labour market and restructuring: Current situation and expected outcomes of reforms coordinated by CASE – Center for Social and Economic Research. The content of this publication is the sole responsibility of the authors and can in no way be taken to reflect the views of the European Union or any other institutions the authors may be affiliated to.
Keywords: Social safety net, labour market, transitional economies JEL: E24, H55, J31, J21, J23, P2 © CASE – Center for Social and Economic Research, Warsaw, 2009 Graphic Design: Agnieszka Natalia Bury EAN 9788371785030 Publisher: CASE-Center for Social and Economic Research on behalf of CASE Network 12 Sienkiewicza, 00-010 Warsaw, Poland tel.: (48 22) 622 66 27, fax: (48 22) 828 60 69 e-mail: [email protected] http://www.case-research.eu

The CASE Network is a group of economic and social research centers in Po-land, Kyrgyzstan, Ukraine, Georgia, Moldova, and Belarus. Organizations in the network regularly conduct joint research and advisory projects. The research cov-ers a wide spectrum of economic and social issues, including economic effects of the European integration process, economic relations between the EU and CIS, monetary policy and euro-accession, innovation and competitiveness, and labour markets and social policy. The network aims to increase the range and quality of economic research and information available to policy-makers and civil society, and takes an active role in on-going debates on how to meet the economic chal-lenges facing the EU, post-transition countries and the global economy.
The CASE network consists of:
• CASE – Center for Social and Economic Research, Warsaw, est. 1991, www.case-research.eu
• CASE – Center for Social and Economic Research – Kyrgyzstan,
est. 1998, www.case.elcat.kg
• Center for Social and Economic Research – CASE Ukraine, est. 1999, www.case-ukraine.kiev.ua
• CASE –Transcaucasus Center for Social and Economic Research,
est. 2000, www.case-transcaucasus.org.ge
• Foundation for Social and Economic Research CASE Moldova, est. 2003, www.case.com.md
• CASE Belarus – Center for Social and Economic Research Belarus,
est. 2007.

Marek Góra, Grzegorz Kula, Magdalena Rokicka, Oleksandr Rohozynsky, Anna Ruzik
CASE Network Reports No. 90 4
Contents Introduction ........................................................................................................... 8 1. Economic Development and Poverty Profile in Russia and Ukraine.......... 10
1.1. Gross domestic product ............................................................................ 10 1.2. Inflation .................................................................................................... 11 1.3. Demography ............................................................................................. 12 1.4. Employment and human capital ............................................................... 13 1.5. Poverty...................................................................................................... 16
2. Labour Markets and the Social Security Nets in Russia and Ukraine ....... 20 2.1. Labour demand......................................................................................... 21 2.2. Impact on household income and demand for a social safety net ............ 25 2.3. Labour supply ........................................................................................... 31 2.4. Unemployment ......................................................................................... 36 2.5. Demographic and further challenges to the social safety nets.................. 42
3. Gender Specific Issues Related to Participation in Social Security .......... 46 3.1. Labour market - gender perspective ......................................................... 46
3.1.1. Female migration .............................................................................. 48 3.1.2. Gender pay gap ................................................................................. 49 3.1.3. Occupational segregation .................................................................. 51 3.1.4. Quantitative analysis ......................................................................... 54
3.2. Feminization of poverty............................................................................ 59 3.3. Social security system – gender dimension .............................................. 60
3.3.1. Social benefits related to work – pension ......................................... 60 3.3.2. Other social benefits.......................................................................... 61
4. Policy Challenges for Social Security Systems in Russia and Ukraine...... 64 4.1. The Social Safety Net Programs until beginning of the 21st century .......... 64
4.1.1. Ukraine.............................................................................................. 65 4.1.2. Russia ................................................................................................ 66
4.2. Recent reforms in the area of labour market and social security.............. 68 4.2.1. Ukraine.............................................................................................. 68 4.2.2. Russia ................................................................................................ 70
4.3. Financial situation of social security (current and projected)................... 71 4.3.1. Ukraine.............................................................................................. 73 4.3.2. Russia ................................................................................................ 76
4.4. Technical problems of running social security in both countries ............. 77 5. Concluding Remarks....................................................................................... 81 References............................................................................................................. 84 Annex 1. Tables and figures................................................................................ 91 Annex 2. Results of Models Estimations............................................................ 94

SOCIAL SECURITY, LABOUR MARKET AND RESTRUCTURING…
CASE Network Reports No. 90 5
The authors Marek Góra is a professor of economics at the Warsaw School of Economics
(SGH), where he got his Ph.D. and habilitation. He has been lecturing and con-ducting research at SGH since 1984. Currently, Marek Góra teaches macroeco-nomics, pension economics, labour economics, and economic policy for graduate and Ph.D. students. Previously, he also taught econometrics and economic fore-casting. During his academic carrier, Marek Góra completed research at the Lon-don School of Economics, Erasmus University Rotterdam and Ifo Institute for Economic Research in Munich. Marek Góra is a Research Fellow at the William Davidson Institute, University of Michigan and a Research Fellow at Institute for the Study of Labor (IZA), Bonn. Marek Góra is an author of various articles in the fields of pension economics, labour economics, unemployment, labour market policies. Marek Góra is the co-author of the design of the pension reform called Security through Diversity and the leader of a team of experts who worked on the reform.
Grzegorz Kula received a master degree in Economics at University of War-
saw in 1998. In 1999 he started his PhD studies at Tinbergen Institute. In 2004 he obtained PhD at Erasmus University, Rotterdam with PhD thesis entitled "Optimal retirement decision". Since 2004 he works as an assistant professor at Faculty of Economic Sciences, University of Warsaw, and since 2008 as an economic expert at Economic Institute, National Bank of Poland. His research interests are in the fields of public finance and labor economics
Magdalena Rokicka is a researcher at CASE (Warsaw). A graduate of Univer-
sity of Warsaw (2001, M.A. in International Economics), she is currently a PhD candidate at the University of Essex (ISER-Institute for Social and Economic Re-search). Her research interests are focused on applied microeconomics, labor mar-ket, gender inequalities and social issues. She has participated as a researcher in several international projects, including: a study of shadow economy in Poland, analysis of gender pay gap in CIS, study of gender specific issues related to par-ticipation in social security in Ukraine and Russia. She also coordinated a study on mobility of Polish researchers and participated in advisory panel for an integrated programme AliCE (Analysing Life Chances in Europe) which examines life chances and living standards across both the “old” and the “new” member states of the EU.

Marek Góra, Grzegorz Kula, Magdalena Rokicka, Oleksandr Rohozynsky, Anna Ruzik
CASE Network Reports No. 90 6
Oleksandr Rohozynsky, Ph.D. in Policy Analysis (2007, Dissertation on Social Safety Net Reform in Ukraine), holds masters degrees in Applied Mathematics, Economics, Policy Analysis, and Business Administration. He is an economist and researcher with over nine year experience working in Ukraine and the US, includ-ing: leading and managing projects for Ukrainian think-tank; working with various international organizations, including World Bank, Soros International Economic Advisory Group, HIID/CASE; and providing support and advise to decision-makers in Ministry of Economy, Ministry of Finance, and Prime-Minister of Ukraine. Olek-sandr Rohozynsky has been working with CASE Ukraine since 1999.
Anna Ruzik, Ph. D., is an expert and an author of publications in fields of the
labour economics and social security. Since 2004, she has been participating in numerous research projects carried out by CASE Foundation. Additionally, she is employed as an assistant professor at the Warsaw School of Economics and part-time at the Institute of Labour and Social Studies in Warsaw. Between Sept. 2002 and March 2003 she spent six months at the Center for Economic Research in Tilburg, NL.

SOCIAL SECURITY, LABOUR MARKET AND RESTRUCTURING…
CASE Network Reports No. 90 7
Abstract The paper focuses on the social safety nets in Russian Federation and Ukraine
in the view of changes on the labour market since the beginning of economic tran-sition. We showed that many past phenomena (e.g. restructuring of the economy, wage and pension arrears, new groups at-risk-of-poverty, demographic transition) caused a need to change an old type social safety net (SSN) into the new one, bet-ter adapted to emerging more liberal economy problems.
Additionally, we analysed some gender specific issues related to social security that are caused mainly by inequalities in the labour market. Differences of earn-ings between men and women in Russia caused by sector segregation account for seem to be more important than the gap between gender earnings attributed to the position. In Ukraine the main contributors to gross gender differential of log earn-ings (that equals to 32%) explained by our model are sector segregation and occu-pation.
We also pointed out to future policy challenges in the area of social security systems in both countries. The retirement reforms introduced recently are a step in the right direction, although their impact will not be felt for a number of years. Other reforms, with more immediate results, are necessary. Social safety nets should be made more efficient and social benefits should be better targeted.

Marek Góra, Grzegorz Kula, Magdalena Rokicka, Oleksandr Rohozynsky, Anna Ruzik
CASE Network Reports No. 90 8
Introduction
Ukraine and Russia are large countries both in terms of population and land. They have large potential for economic growth. However, their prospects are strongly dependent on successful solving of a number of difficult problems, some of which are real challenges. The problems can be divided into two groups: (1) country and/or region specific problems primarily stemming from their past heri-tage (shorter: transition to markets, longer; communist legacy, and also very long: imperial position), (2) universal problems, such as population ageing, similar to those faced by other European and also non-European countries.
In the majority of the research areas covered by the ESCIRRU project, the country or region specific problems strongly dominate. Their impact on the current situation and its developments is stronger. However, the area covered by Work Package 8 is partially different. The universal problems do not dominate but their relative impact is more substantial.
The scope of our research related to the broad topic “Restructuring and Social Safety Nets in Russia and Ukraine” involves demographic issues to a large extent. Not going into specific demographic problems the authors of this paper, as well as other papers presented under the same general topic, analyse the effects of demo-graphic developments in both countries. As mentioned above, the developments are both general, for instance very low fertility – which is similar to developments observed in numerous other countries, as well as specific, low longevity (very low in the case of Russian and Ukrainian men) – which is much below European stan-dards. The latter can be illustrated by a comparison of life expectancy in the EU, in the EU neighbouring countries (or close in geographical terms) and those sharing similar economic transition experience, as well as developments in Russia and Ukraine. Their development seems to follow economic transition understood as deep economic and social restructuring.1 Lack or limited scale of such deep re-structuring keeps the population in a very undesirable or even worsening situation. Longevity is one of the key indicators of human wellbeing. It can also be used as a proxy for measuring successful developments in the countries analysed.
1 The authors do not provide demographic evidence and analysis that can allow them draw stronger conclusions.

SOCIAL SECURITY, LABOUR MARKET AND RESTRUCTURING…
CASE Network Reports No. 90 9
Demographic developments strongly affecting both countries analysed simul-taneously do not determine all other processes in their economies. The following paper presents selected economic phenomena in Russia and Ukraine since the beginning of 1990s and their impact on and interactions with social security sys-tems. First, we describe general trends in demographic and economic develop-ment, output decline and recovery, changes in the labour market and changes in the social safety net since the collapse of the centrally managed economy. Then, we focus on specific policy challenges for social security systems in Ukraine and Russia, as well as including a comparison with selected European and Former Soviet Union states.
The data used are taken from statistical yearbooks of Ukraine and Russia. Some data come from websites of the World Bank, International Monetary Fund and International Labour Organization, but these data are also often based on offi-cial information of statistical offices. Additionally, when stated, micro data from Russian Longitudinal Monitoring Survey (RLMS) and Ukrainian Longitudinal Monitoring Survey (ULMS) from the years 1999-2005 are used.
In the early 1990s, in the turmoil following the collapse of the Soviet Union, statistical services had to switch to new conditions of forming independent coun-tries. This is probably the reason why there is limited information, particularly concerning Ukraine, in this period. Another problem is the reliability of the data gathered since the official registered statistics in the early years of transition do not necessarily give the full picture. The most serious problem, which makes the com-parison in time and between countries very difficult, is the methodological changes. There were several major changes in the methodology of data collection over the period 1992-2006. As a result, different types of data were gathered in different years, and the data gathered were aggregated in different ways.
This paper is one of four papers on “Restructuring and Social Safety Nets in Russia and Ukraine” and provides the background for a deeper analysis provided in the other three papers. It also concentrates on gender issues that are not covered by the other papers in such detail.
Marek Góra, Grzegorz Kula, Magdalena Rokicka, Oleksandr Rohozynsky, Anna Ruzik
CASE Network Reports No. 90 10
1. Economic Development and Poverty Profile in Russia and Ukraine
Transition from a centrally-managed to a more free-market oriented economy began in the described region in the 1990s. Economic performance in the CIS and Central and Eastern Europe countries during the first years of the transition was characterized by an initial output shock, usually accompanied by increasing infla-tion, and an increase in income dispersion of the population. Eventually, develop-ment of the private sector and growth in this area contributed to the recovery.
These countries began the transition with similar institutions, based on Soviet practice (see e.g. Fox 2003). Both were characterized by high levels of urbaniza-tion, dominating wage employment, which served as the basis for a broad social insurance program, and a large social service infrastructure with a common ap-proach to social services provision. Additionally, relatively high levels of educa-tion and low inequality (relatively to per capita income) were observed in these countries.
1.1. Gross domestic product The CIS countries took the path of slow reform. They experienced a long (more
than 6 years) and deep (60-80 percent of GDP cumulative decline) economic slowdown. Due to this slowdown, the average tax revenues felt from around 28 percent of GDP in 1992 to 22 percent of GDP in 1998; some countries, with an even slower transition, such as Georgia, Kyrgyzstan, Tajikistan, experienced a drop in revenues under 15 percent of GDP (see: World Bank 2000). In the Russian Federation and Ukraine, negative economic growth was observed even in the sec-ond half of the 1990s (Figure 1.1.)

SOCIAL SECURITY, LABOUR MARKET AND RESTRUCTURING…
CASE Network Reports No. 90 11
Figure 1.1. Real GDP growth in selected CIS countries 1995-2006
-20
-10
0
10
20
30
40
1995 1996 1997 1998 1999 2000 2001 2002 2003 2004 2005 2006
Armenia Azerbaijan BelarusGeorgia Moldova Russian FederationUkraine
Source: Eurostat.
Since the USSR split into 15 independent republics in 1991, both Russia and Ukraine have struggled to build a democratic political system and market econ-omy. In Russia, oil, natural gas, metals, and timber account for a vast majority of country exports, making the country vulnerable to swings in world prices. After the 1998 financial crisis, the country began to recover and experienced many years of growth, averaging 6.4 percent annually. High oil prices and a relatively cheap ruble were important drivers of the economic rebound in Russia. Since 2000, in-vestment and consumer-driven demand have played a noticeably increasing role in this growth. As a result, in the last few years real personal incomes increased over 12% a year on average and poverty has declined.
Ukraine followed a pattern common for CIS countries. After Russia, the Ukrainian Republic was the most important economic area of the former Soviet Union in terms of output. After its independence, Ukraine suffered an economic downturn that continued for 6 years. In 1998, real GDP felt to 41 percent of GDP in 1990. GDP began growing in 1999, and by 2004, it was increasing by 12 per-cent a year. However, in 2005, GDP growth slowed to just 2.6 percent due to po-litical instability and the new social and fiscal policy which will be discussed later.
1.2. Inflation High inflation in the first years of transition was usually a result of the financial
repression preceding the transition. However, in 2006, a majority of the countries in the region succeeded in stabilisation of the price increase (Table 1.1.)

Marek Góra, Grzegorz Kula, Magdalena Rokicka, Oleksandr Rohozynsky, Anna Ruzik
CASE Network Reports No. 90 12
Table 1.1. Inflation rate in selected CIS countries 1996-2006 (%) 1996 1997 1998 1999 2000 2001 2002 2003 2004 2005 2006 Armenia 18.7 14.0 8.7 0.6 -0.8 3.2 1.1 4.7 7.0 0.6 2.9 Azerbaijan 19.9 3.7 -0.8 -8.5 1.8 1.5 2.8 2.2 6.7 9.6 8.3 Belarus 52.7 63.8 73.0 293.7 168.6 61.1 42.6 28.4 18.1 10.3 7.0 Georgia 39.4 7.1 3.6 19.2 4.0 4.7 5.6 4.8 5.7 8.2 9.2 Moldova 24.0 11.9 7.8 39.4 31.2 9.6 5.2 11.6 12.4 11.9 12.7 Russian Federation 47.8 14.8 27.7 85.7 20.8 21.5 15.8 13.7 10.9 12.7 9.7
Ukraine 80.3 15.9 10.6 22.7 28.2 12.0 0.8 5.2 9.0 13.5 9.1 Source: Eurostat.
1.3. Demography As far as the demographic situation is concerned, Ukraine has experienced a
massive decline in the population since the onset of transition. Due to the in-creased death rates, decreased birth rate, and large migration out of the country, the population shrunk from 52 million in 1991 to 46.9 million in 2005. Although the proportion of people of working age did not change, the proportion of younger people decreased and this negative population growth was observed in 2006. The population became more economically active during the recession because most pensioners able to work were forced to look for some job to supplement their pen-sion income. At the same time, the proportion of pensioners in the total population grew from 25 percent in 1991 to 30 percent in 2005.
Currently, the Russian population of 142.9 million is experiencing negative growth and the long-term demographic forecasts show that Russia will face quick ageing in the future, with a sharp decline in the economically active population in relation to the size of the non-active population. Due to the life expectancy grow-ing steadily since 1996 (after a dramatic decline in the first half of 1990s) and a declining birth rate, the proportion of the elderly among the Russian population is increasing rapidly. Currently, the relation of pensioners to workers is 1 to 1.4.
In recent years, the rate of population decline has been decreasing, but it is dif-ficult to say if this is a temporary or permanent change. It is also possible that the countries have only experienced deferred births (but not a higher number of births).

SOCIAL SECURITY, LABOUR MARKET AND RESTRUCTURING…
CASE Network Reports No. 90 13
Figure 1.2. Population (in millions of people) and population growth Russian Federation
139
140
141
142
143
144
145
146
147
148
149
1990 1991 1992 1993 1994 1995 1996 1997 1998 1999 2000 2001 2002 2003 2004 2005 2006-8-7-6-5-4-3-2-10123
population natural increase Ukraine
44
45
46
47
48
49
50
51
52
53
1990 1991 19921993 1994 19951996 1997 19981999 20002001 2002 20032004 2005 2006-9-8-7-6-5-4-3-2-1012
population natural increase
Source: Statistical offices of Russian Federation and Ukraine.
1.4. Employment and human capital Another result of the transition to the market economy was liberalisation, priva-
tisation and an initial decrease in employment in the majority of CIS countries.

Marek Góra, Grzegorz Kula, Magdalena Rokicka, Oleksandr Rohozynsky, Anna Ruzik
CASE Network Reports No. 90 14
Table 1.2. shows three periods. In the first period, a decrease in GDP was usually accompanied by a drop in employment, while in the second and third periods, the situation was different and dependent on the country economy, institutions and policies. Table 1.2. Employment and GDP dynamics in the CIS countries, average growth rate
1990-1994 1995-1998 1999-2002 Employment GDP Employment GDP Employment GDP
Armenia -2.2 -16.2 -2.2 5.8 -0.94 7.9 Azerbaijan -0.5 -17.0 0.5 1.0 0.12 9.7 Belarus -2.3 -7.8 -1.5 2.7 -0.40 4.6 Georgia -10.8 -27.5 -0.3 6.6 -0.65 3.8 Kazakhstan -4.2 -9.6 -1.8 -2.1 2.30 8.8 Kyrgyzstan -1.5 -14.4 0.9 3.3 2.06 3.6 Moldova -5.1 -20.5 -0.6 -4.2 0.00 -1.1 Russian Federation -2.3 -10.3 -2.0 -2.9 0.69 0.8
Tajikistan -1.1 -20.1 -0.7 -2.7 0.00 0.9 Turkmenistan 3.5 -9.2 2.5 -5.2 0.00 3.8 Ukraine -2.4 -14.1 -0.7 -6.9 -0.18 -0.1 Uzbekistan 1.3 -4.9 1.9 1.9 0.35 1.0
Source: Economic Survey of Europe 2004; EBRD Transition reports; author’s calculations.
The transition to a market economy had an influence on the Russian labour market as well. However, official unemployment remained low in the first half of the 1990s because workers were employed part-time (through informal agreements with employers), on long holidays, etc. (see e.g. Lehmann, 1995) One of the rea-sons for this was low social benefits and the difficulty associated with collecting them. This situation was maintained for a long time, and can be partially observed through the alternative (ILO definition) estimate of unemployment. There was significant difference between the ILO and officially documented registered un-employment observed from 1992-1998.
A similar situation was observed in Ukraine. Although the proportion of the employed decreased from 47 percent in 1995 to 42 percent in 2005, similar to other CIS countries, the economic depression did not result in large unemployment in the country. The highest unemployment since independence was around 12 percent from 1999-2000, and the unemployment rate was decreasing after that partially due to the decrease in the economically active population from 52 percent in 1998 to 47 percent in 2005.
With economic stabilization at the beginning of this century, the situation stabi-lized. We observe that the ILO-defined unemployment figures converge with reg-

SOCIAL SECURITY, LABOUR MARKET AND RESTRUCTURING…
CASE Network Reports No. 90 15
istered unemployment in both countries, and unemployment stabilized at a level that is reasonable from the view of economic theory. It seems that current unem-ployment levels are not irreversible; however, the long-term perspective is unclear. Falling employment (in absolute terms) will strongly affect restructuring and other economic and social developments which, in turn, may result in high structural unemployment. Figure 1.3. Employment in Ukraine (projection)
0
5
10
15
20
25
2006
2009
2012
2015
2018
2021
2024
2027
2030
2033
2036
2039
2042
2045
2048
2051
2054
millions
Source: Ukrainian Centre for Social Reforms (2006).
An important feature of the labour markets in both countries is the level of hu-man capital of the (potential) labour force. Pre-transition educational system, with broad access, and high levels of scholarly achievement, has long been a source of strength. For many years the enrollment rate for both secondary and tertiary educa-tion has been increasing and after the start of transition, an increase in the share of private sector enrollment could be observed. However, the Soviet education system was very centralized and, in the course of transition, there were aims to move responsibility – mainly at lower levels of education – to local governments. This change may result in uneven quality of education and lower enrolment, mak-ing the quality of the future labour force unclear.
The absolute number of students entering tertiary education is increasing in both countries. Gross enrollment rate to tertiary level increased between 1998–99 and 2002–03 both for Ukraine and Russia and for both genders. In Ukraine, for men in 2002–03 it was 56.5 percent of this age group, for women 67.2 percent. In Russia, the same ratio for men was 59.1 percent and for women 79.3 percent (UNESCO database).

Marek Góra, Grzegorz Kula, Magdalena Rokicka, Oleksandr Rohozynsky, Anna Ruzik
CASE Network Reports No. 90 16
Figure 1.4. Students in tertiary education (ISCED level 5 and 6) from 1995-2005 in millions
4.8 5.0 5.4 5.86.4
7.28.0
8.7 9.2 9.6 9.8
1.6 1.6 1.7 1.7 1.8 2.0 2.1 2.3 2.5 2.6 2.7
0
2
4
6
8
10
12
1995 1996 1997 1998 1999 2000 2001 2002 2003 2004 2005
Russian Federation Ukraine
Source: Eurostat.
1.5. Poverty The economic downturn resulted in an increase in poverty in the CIS and nei-
ther Ukraine nor Russia was an exception. Table 1.3 presents a comparison of poverty occurrence in selected countries between 1989 and 2004. Table 1.3. Poverty rates in CIS countries (% of people living below national poverty line)
1989 Max 1992-1996
Max 1997-1998 1999 2000 2001 Average
2002-2004 Armenia 14.3 54.7 53.7 53.7 47.4 42.5 Azerbaijan 33.6 72.2 71.2 54.3 52.3 49.6 Belarus 3.3 38.6 33.0 46.7 41.9 28.9 25.1 Georgia 13.0 80.0 50.2 51.4 51.4 52.0 52.0 Kazakhstan 15.5 34.6 39.9 34.5 31.8 28.4 24.2 Kyrgyzstan 32.9 51.9 63.6 64.1 62.5 56.4 Moldova 11.8 61.6 71.1 70.5 62.3 Russian Federation 33.5 23.3 28.3 28.9 27.3 20.8
Tajikistan 51.2 95.7 83.0 Ukraine 6.0 29.5 28.5 27.8 26.4 27.2 27.2
Sources: Ovcharova et al.(1999), Falkingham (2003), and publications of national gov-ernments.

SOCIAL SECURITY, LABOUR MARKET AND RESTRUCTURING…
CASE Network Reports No. 90 17
It is established that during the Soviet Union only about 6 percent of the popu-lation of Ukraine lived below the national poverty line and this was primarily the rural population in depressed western regions. The poverty reached its maximum during the recession period 1992-1996, when about 30 percent of the population lived below the national poverty line. The poverty reduced with the first signs of economic growth, but remained stable at 27 percent of the population below the national poverty line from 1999 to 2004. The international standards approach reveals that the poverty was, in fact, declining: a World Bank study in 1999 found that 29.4 percent of the population lived on less than $4.30 a day (see World Bank, 2001), and the latest study from 2005 shows that the poverty rate was only 22.2 percent in 2003 (World Bank, 2005a).
The World Bank Poverty Assessment in Ukraine in 2005 (World Bank, 2005a) found that the Ukrainian poverty profile was similar to most CIS countries. First, there is an increasing poverty gap between the rural and urban populations. Ac-cording to official statistics, 11 percent of population in large cities lived below the poverty line, and 28 percent in rural areas. This largely affects the regional distribution of poverty: the rural regions of Western Ukraine and the Black See coastline have above average poverty indicators, while the more industrialized Northeast of Ukraine and capital city of Kiev have poverty indicators below aver-age. Special cases are the densely populated, coal-mining regions of Donetsk and Lugansk. This industrialized region has a poverty rate around the country average, but there are pockets of deep poverty in towns around the mines that were closed during the transition.
Poverty was larger in the households with a large number of dependents, mainly children. In the described period, only 20 percent of the population lived in households of four people or more, but more than 40 percent of people living in large households were among the poor. Large families with a large number of children constituted the poorest group of the rural population.
Surprisingly, the elderly population constituted only 11 percent of all poor. As we mentioned earlier, pensioners were able to work supplement their pension in-come with some part-time jobs, and the pensions and subsidies received by pen-sioners are sufficient to keep most families with elderly members out of poverty. Another reason is that, generally, pension benefits provided by the old-type pen-sion systems were a relatively generous part of the SSN.
The risk of poverty is twice higher for families with unemployed heads of household, when compared to families with employed heads of household. Al-though registered unemployment is not high in Ukraine, underemployment is con-sidered to be significant. World Bank researchers found that underemployment increased from 8.4 percent of the population in 1999 to 9.2 percent in 2002. In the

Marek Góra, Grzegorz Kula, Magdalena Rokicka, Oleksandr Rohozynsky, Anna Ruzik
CASE Network Reports No. 90 18
self-reporting survey, the underemployed are usually easily identified as people who reported to be unemployed and reported some wage income below minimum wage at the same time.
The social welfare system built over the years since independence currently provides about 21 percent of the income of poor families. Another 23 percent comes from self-grown agricultural products, and only 40 percent of the income in poor families comes from wage income (World Bank, 2005a). Despite being the largest expenditure item, due to a lack of funding, until quite recently the pension became the only co-payment for working pensioners, and by itself did not provide income sufficient to stay out of poverty (see World Bank, 2000). For example, in Ukraine the average pension was only 36 percent of average wages in 2003.
In recent years, Ukraine recorded a significant decline in poverty due to a rapid increase in labour productivity and increasing domestic and foreign investment. Following an increase in wages and social transfers (such as pension payments or childbirth assistance introduced in 2005), household expenditures increased. An increase in household tariffs for energy in 2006 did not have an impact large enough to offset the favourable outcome of this period of development.
In Russia, following the 1998 financial crisis, a steep drop in consumption oc-curred across all income groups. This drop was especially pronounced for the poor. The economy recovered in the following years, primarily benefiting from high oil prices which had a positive impact on wages, reduced unemployment, reduced the arrears in wages and increased various social transfers.
As the World Bank (2005b) noted, government social spending had been pro-cyclical, “exacerbating the negative impact of the downturn but strengthening the positive household impact of the recovery”.
A study by the World Bank (2005b) presents a more detailed picture of the poor population in Russia at the beginning of the 21st century. In 2002, 30.4 per-cent of the rural population was living in poverty in 2002, and 15.7 percent of the urban population was poor. Children have a higher than average incidence of poverty, and unemployment and a low level of education make people much more likely to be poor than the general population. There are large regional differences in the incidence of poverty, which varied between 3.1 percent and 55.6 percent in 2002. Additionally, a high share of workers with wages below the official poverty line was concentrated in education, culture, health, and other public services. It seems also that there is still scope for better targeting of the programs specifically aimed at the poor.
The financial situation of the elderly was unfavourably influenced by the crisis. In 1999 in Russia about 4 million elderly were receiving only the minimum pen-sion of less than $10 per month (World Bank 2005b). However, this was only in

SOCIAL SECURITY, LABOUR MARKET AND RESTRUCTURING…
CASE Network Reports No. 90 19
theory. In practice, the situation was even worse as a result of pension arrears, and problems in the banking and postal systems which resulted in many pensioners not receiving any official benefits for months. In Ukraine in 1997, the average pension was very close to the minimum cost of food and more than 80 percent of retirees were receiving benefits below the minimum consumption level2. In 1998, the av-erage pension constituted less than 80 percent of the official poverty line. The minimum pension of any kind (retirement, invalid, etc.) was only about 23 percent of the poverty line. Pension arrears were also substantial.
2 For the detailed numbers see Dobronogov (1998), p. 3.

Marek Góra, Grzegorz Kula, Magdalena Rokicka, Oleksandr Rohozynsky, Anna Ruzik
CASE Network Reports No. 90 20
2. Labour Markets and the Social Security Nets in Russia and Ukraine
The countries that have undergone fundamental economic transformation in the transition period have sometimes taken different paths. From the point of view of employment, the initial situation was quite similar: before the transition there was no unemployment, at least officially. Everybody was employed, and there were many redundant jobs, or cases of over-employment, particularly in industry. During the transition in many CEE countries these features of the labour market lead to sharp rise in unemployment. However, this was not the case in Russia and Ukraine, where unemployment began to rise much later in the transition process and even then it was not very high. Unemployment (as defined by ILO) was not regularly measured, but fragmentary data for countries such as Russia, Ukraine, and Moldova register double-digit levels, without the decline observed in the richer countries (Rashid and Rutkowski 2001). Therefore, discussing labour supply in Russia and Ukraine we have to pay particular attention to the informal sector, barter economy, and the con-tinuation of artificial employment. Unfortunately, sometimes we have to base re-search on scarce data, in particular for the early 1990s.
As already mentioned, major changes in methodology were introduced a num-ber of times, the last of which we are aware of came into effect around 2003. These new methods of calculating the number of unemployed or the size of the economically active population, for example, result in differences reaching even up to a few percentage points. This means that sometimes we cannot directly com-pare the data even from two subsequent years, and we are left with the analysis of a general trend. Thus, we must bear this in mind while analysing the graphs and tables presented below.
At the very beginning of the transformation process, the pension level in Russia was lower than in other CEE countries. In 1989, social transfers amounted to just 14.6 percent of GDP, while in Poland and Hungary they made up more than 22 per-cent of GDP. The situation was similar if we consider only pension expenditures: 8 percent, 15.2 percent and 13.4 percent of GDP respectively (Milanovic, 1992). This

SOCIAL SECURITY, LABOUR MARKET AND RESTRUCTURING…
CASE Network Reports No. 90 21
means that either the number of people receiving the social transfers was small, or the level of transfers was low. The second possibility seems to be true.
In 1988 in the Soviet Union, the average pension was equal to just 36.5 percent of the average state sector wage. Since up to the beginning of transition it was difficult to have any official additional monetary income, the result of such low pensions was that pensioners in Russia and Ukraine had low disposable incomes. Therefore, despite the difficulties, they tried to retire later, somehow combine retirement with work, or earn money in the informal market. The first two choices were difficult, since there were restrictions on employment of the elderly. Other forms of social transfers also did not focus on helping the poor, since the majority of them, at the beginning of transition, were evenly distributed in the population, according to demographic characteristics. Only social assistance was well targeted, but its level was low (Milanovic, 1992). However, it did not matter much in a so-ciety with full employment, where the minimum wage allowed for a modest (quite often very modest) living. Therefore, most of the social support, as well as the creation and maintenance of infrastructure, was delivered by state enterprises, which provided their workers with places to live, with help and care for children, or with assistance in spending their free time.
In such a society there was (at least in theory) no need and no place for any in-stitutionalised poverty reduction programs or unemployment assistance. Obvi-ously, after the start of the transformation process, such institutions become neces-sary, even with unemployment remaining low. It meant that the whole structure of the social transfer system had to be changed to answer the new and still volatile situation. Unfortunately, as we know now, and as some people predicted at the beginning of transition, the socialist state was not prepared for these reforms and their effects on economies and societies. As a result, we can even claim that the social safety net in Ukraine and Russia collapsed in the early years of the transi-tion process. This collapse and subsequent reforms have had a strong impact on the labour supply in both Russia and Ukraine.
2.1. Labour demand No doubt that employment in both Russia and Ukraine was high. Although in
both countries there was initially a fall in the employment rates, with rates higher than 65 percent for people between 15 and 70 (or 72 for Russia) at the beginning of transition and reaching, for example, 53 percent in Russia in 1998, it was fol-lowed by a rise in the rates to 61.2 percent in Russia and 57.7 percent in Ukraine

Marek Góra, Grzegorz Kula, Magdalena Rokicka, Oleksandr Rohozynsky, Anna Ruzik
CASE Network Reports No. 90 22
in 2005. As we can see in Figure 2.1. employment in both countries fared better that employment in most of the CEE countries during transition. It has fallen rela-tively slowly, not following the sharp decrease of GDP. Since the graphs show the unweighted average for all the countries there is no problem of one, large country dominating and distorting the results. To make the patterns more visible, Fig-ure 2.2. shows the changes in employment and GDP in Poland, the largest country from those included in Figure 2.1. In Poland, GDP dropped significantly at the beginning of transition and then rebounded much faster than the average for the CEE countries, while employment followed the average, initially falling and af-terwards increasing very slowly. In both Ukraine and Russia, despite a deeper fall in GDP than in other CEE countries (much deeper than in Poland), employment stayed relatively high, without any sudden decreases, characteristic for CEE coun-tries. In this section we will try to explain how this has happened. Figure 2.1. Employment and Output Adjustment (year of start of transition = 100)
Notes. Unweighted average of all the countries of Central and Eastern Europe (Bulgaria, Czech Republic, Hungary, Poland, Romania, Slovakia, Slovenia) and of the following countries of the former Soviet Union: Russia, and Ukraine (which account for 78 percent of the GDP of the former Soviet Union in 1996). Start of transition: 1991 = 100 for former Soviet Union; 1989 = 100 for Poland; 1990 = 100 for all other Central and Eastern Euro-pean countries. Source: Boeri and Terrell (2002).
As far as the demographic situation of the labour force is concerned, Lehmann (1995) claims that “…the labour market experience of various demographic groups is in fact sector-specific…”3 While there are some characteristics common 3 Lehmann (1995), p. 50

SOCIAL SECURITY, LABOUR MARKET AND RESTRUCTURING…
CASE Network Reports No. 90 23
for most sectors, like higher labour force withdrawal rates for elderly workers, other patterns connected with age, gender or education are different for each sec-tor. Thus, in the early years of transition process, women, elderly and people with a lower level of education were employed, or were looking for employment, mostly in the state sector. Men, the young and better educated people had better perspectives in the private sector or as self-employed. Returns to education and occupation increased. As Lehmann concludes: “…a strong element of labour hoarding [of state firms] (…) seems to help those groups which in other transition economies bear the brunt of the restructuring effort…”4 Figure 2.2. Employment and Output Adjustment in Poland (1989 = 100)
employment
GDP
50
55
60
65
70
75
8085
90
95
100
105
110
115
1 2 3 4 5 6 7 8 9 10
Years since the start of transition
Source: own calculations based on data from Polish Central Statistical Office and ILO.
The result of “labour hoarding” was that pay arrears were increasing. Accord-ing to Alam et al. (2005, p. 123), “…In Russia, for example, the proportion of workers with arrears rose steadily from 1994 through 1998, when it reached 63 percent, then fell sharply in 2000 to 29 percent. Similarly, the average number of overdue monthly wages fell from 3 to 1 between 1998 and 2000…”. In 2004, only 15 percent of workers were owed wages. The recovery after 1998 crisis was quite rapid and lead to a reduction in poverty rates, with Gini index falling from 0.369 in 1998 to 0,332 in 2003 (Mitra, 2006).
4 Ibid., p. 50.

Marek Góra, Grzegorz Kula, Magdalena Rokicka, Oleksandr Rohozynsky, Anna Ruzik
CASE Network Reports No. 90 24
An obvious question is what was the interest of the firms in “labour hoarding”? The answer is that the firms were paid to do it by government in form of subsidies, credits and tax privileges5. Sometimes such actions of local governments resulted in inefficiencies like overprovision of some public goods (Haaparanta et al., 2003). Enterprises were also under pressure from government - local and federal - to limit the flow of workers into unemployment. Therefore, we can ask what was the inter-est of the government in “labour hoarding”? Here the answer is obvious: political reasons. According to Kapstein and Milanovic (2000, p. 7) “…the Yeltsin gov-ernment pursued a strategy of maximizing votes from managers and workers…”. The losers of this strategy were first of all pensioners and their benefits. The mechanism was that managers were gaining from privatisations and their workers were kept maybe not happy but at least not rebellious by subsidising their jobs. Because of this, those, who in other countries were the biggest opponents of radi-cal reforms, i.e. workers, unemployed or pensioners, in Russia did not really con-stitute a significant obstacle for changes. The reforms were blocked by those who were the winners of the transition: new owners of the firms (including oligarchs), private bankers, local officials, or the mafia. In this way they wanted to prolong the existence of distortions which had made their gains possible.
There is also an alternative explanation of labour hoarding, suggested by Kou-makhov and Najman (2001). They claim that it is only an expression of internal flexibility of the firm and does not have much to do with government dislike for increases in unemployment. They distinguish two major firm policies connected with labour hoarding: administrative leave and short time work. The first one is used by the firms to keep employees with specific skills who, according to Kou-makhov and Najman, probably would not find another job anyway. Such a policy means that workers without firm-specific skills are more likely to be fired. The second policy allows firms to satisfy the demand for basic skills without using the firm’s specialized work force. Workers with basic skills are easy to find and hire to perform simple tasks, and they are equally easy to fire.
There may be some truth in this alternative explanation of the reasons of labour hoarding, but a longer discussion on the subject is not in the scope of this paper. We are more interested in why workers agreed to such a system. Many workers were on extended leave from their primary jobs in the state sector, working at the same time in the private sector. These second jobs quite often had short working hours, higher salary, but were more risky than employment in the state sector. In a way it is another reason why firms were interested in labour hoarding: new firms have tended to be closely linked to existing state or privatised firms and have been widely dependent on part-time, informal labour. Therefore, workers remained 5 In practice a “tax privilege” meant usually acceptance of tax avoidance.

SOCIAL SECURITY, LABOUR MARKET AND RESTRUCTURING…
CASE Network Reports No. 90 25
officially employed in a state firm, but worked in practice in a private firm con-nected with their legal employer.
Other workers did not even have second jobs. According to Riboud and Chu (1997), in Ukraine, it is estimated that in 1995 approximately 2 million employees of state-owned enterprises stayed on the payroll although working for shorter hours or on leave without pay. This is, obviously, a form of hidden unemployment and we may ask again why those people had not quit their jobs. We have provided some answers to this question in the section discussing unemployment. Here we can add one more reason: the fact of being officially employed offered some kind of feeling of security.
On extended leaves and without pay, workers tried to find a way to maintain themselves and their families. Quite often their only choice was to turn to informal activities. For example in Ukraine in 1995, over 65 percent of men and women employed by a state or private enterprise reported spending additional time work-ing on land plots. Over half of those who did not report being employed in the formal sector indicated that they worked on land plots. According to Riboud and Chu (1997, p. 8) the end result was that “…a significant proportion of the labour force allocates time – sometimes exclusively - to occupations that can be qualified as informal and thus not subject to tax enforcement leads to a significant reduction in the number of contributors to the public social security system…”.
2.2. Impact on household income and demand for a social safety net In both Russia and Ukraine many firms, not able to pay their dues in cash,
turned to non-monetary transactions and payments in kind. Together with social transfers in kind, which were much higher than in the West, the share of goods and services received in kind in the final consumption of households was very high.
The non-monetary payments of enterprises are included in the Figure 2.3 show-ing goods and services received from other sources. They are much lower than goods and services in kind received as social transfers, but they are still quite sub-stantial. In a way, it should not be surprising, since enterprises were already pro-viding their workers with other benefits than money. According to Commander and Tolstopiatenko (1996, p. 7): “…One important inheritance of the Soviet sys-tem was that firms commonly provided a wide range of social benefits, including housing, child and health care, to their workers […] Survey evidence suggests that in 1992/93 benefits comprised roughly 30 percent of total labour costs in Russia (…) many firms -- particularly the larger firms -- have received compensating

Marek Góra, Grzegorz Kula, Magdalena Rokicka, Oleksandr Rohozynsky, Anna Ruzik
CASE Network Reports No. 90 26
finance for benefits provision from various levels of government…” In this way a substantial part of the social safety net was still provided by enterprises and not by state. One may even say that it was necessary, since at least in the first half of the 1990s most of the infrastructure, such as housing, kindergartens, etc., belonged to enterprises. “…In 1994 one third of the firms with fewer than 500 employees pro-vided housing, the share increasing to 100 percent for enterprises with more than 10,000 employees. In the beginning of the 1990’s, some 70 percent of large and medium-sized enterprises offered medical services while over 75 percent of large and 50 percent of medium-sized enterprises had kindergartens…”6. Haaparanta et al. (2003) even claim that the quality of services provided by enterprises was bet-ter than that of municipal authorities. This was another reason why workers pre-ferred to remain employed without salary: they were receiving other benefits. Figure 2.3. Share of goods and services received in kind in final consumption of household
4
9
14
19
24
1992 1993 1994 1995 1996 1997 1998 1999 2000 2001 2002 2003 2004 2005from social transfers from other sources
Source: Statistical office of Russian Federation.
The situation changed after 1992/1993, when all privatised firms had to transfer their social assets to the local authorities. According to Haaparanta et al. (2003), by the end of 1997 “…Roughly 80 percent of housing stock, 76 percent of kinder-gartens, 82 percent of medical services, 84 percent sports facilities, 75 percent of children’s summer camps, 60 - 70 percent of recreation facilities became munici-
6 Haaparanta et al. (2003), p. 13.

SOCIAL SECURITY, LABOUR MARKET AND RESTRUCTURING…
CASE Network Reports No. 90 27
pal…”7, although regional variations were high. Nevertheless, firms were and are still helping their workers, providing them with medical care, giving subsidies for workers and their families, lending money for housing and guaranteeing housing loans of their workers. What is more, outsiders also can benefit from social ser-vices provided by enterprises for a small fee or for free, depending on the deal between the local authorities and the management. “…The share of users other than employees in an average firm that allows outsider-use is around 40 percent for housing, day-care, and recreation facilities, and approximately 20 percent for medical care”8.
However, in the ‘90s, some firms reduced the benefits, while others started providing payments in kind instead of monetary salaries. Often they used their products to pay off their workers, business partners and even tax authorities. The extent of the non-monetary economy cannot be ignored: Commander et al. (2000) states that, in Russia in 1998, the share of non-monetary transactions in industrial sales was about 50 percent. Marin et al. (2000) estimate that, in 1997 in Ukraine, barter reached 51 percent of industrial sales. According to Commander et al. (2000), there were many reasons for the development of the barter economy: prob-lems with liquidity, credit constraints, or agreement of tax authorities to accept tax payments in such a form. However, Marin et al. (2000) claim that “…the most common explanations of barter - the lack of market discipline, lack of restructur-ing, the virtual economy, and tax avoidance - are not supported by the data…”9. In their opinion “…in the absence of trust and functioning capital markets barter is a self-enforcing response to imperfect input and financial markets in the former Soviet Union…”10.
Whatever the reasons, such a phenomenon clearly had an impact on labour in-come and public finance. First, if workers were paid in goods they produced them-selves, they had to sell them in order to raise money, or exchange them for other goods11. This led the workers straight to the informal sector. Second, if taxes were paid in non-monetary form, there was no money to pay the social benefits of any type, thus leading to payment arrears. This particular problem in the first half of the ‘90s was solved by paying for benefits in kind. As Owen and Robinson (2003) wrote: “...The emblematic picture from that time was one of pensioners trying to
7 Ibid., p. 14. 8 Ibid., p. 26. 9 Marin et al. (2000), p. 14. 10 Ibid., p. 1. 11 The most radical example I have heard about is the case of a Ukrainian train carriages factory, where the employees received their monthly salary in the form of two carriages. However, I was not able to find any evidence to prove that this story is true, and not just a rumour.

Marek Góra, Grzegorz Kula, Magdalena Rokicka, Oleksandr Rohozynsky, Anna Ruzik
CASE Network Reports No. 90 28
sell bread (which they received in lieu of pensions) to buy other necessities of life...”12. With improving economic conditions the share of transactions in kind is obviously decreasing, although their level remains very high if we compare it with Western countries.
Decreasing labour demand and labour income, paired with a decrease in in-kind benefits provided by firms, increased population dependence on social safety nets and the share of SSN income. Different types of social transfers constitute about 15 percent of the population’s monetary incomes in Russia, and about 25 percent of household monetary income in Ukraine. The structure of monetary in-comes is presented in Figure 2.4. The observed differences, such as the one in the share of social transfers or that of income from sales of agricultural products, which is significant for Ukraine and does not appear for Russia, may result from differences between population and household incomes, and the methodology used to calculate them. However, the huge share of different types of social transfers is visible in both countries and it is clear that the demographic changes described above make financing these transfers difficult. Figure 2.4. Structure of monetary incomes in years 1990-2005 (Ru) and 1999-2004 (Ukr) Russian Federation (population incomes) Ukraine (household incomes)
0
10
20
30
40
50
60
70
80
90
100
1990 1993 1996 1999 2000 2001 2002 2003 2004 2005
other incomes
social transfers
property incomes
income fromentrepreneurshiplabourremuneration
0
10
20
30
40
50
60
70
80
90
100
1999 2000 2001 2002 2003 2004
other incomes
cash pensions,stipends and benefits
income from sales ofagricultural products
income fromentrepreneurship andself-employmentlabour remuneration
Source: Statistical offices of Russian Federation and Ukraine.
The main portion of social safety nets in Russia and Ukraine constitute pen-sions, and the structure of pension benefits is similar in both countries. As we can see from Tables 2.1a and 2.1b, the majority of pensioners receive old age pen-sions. In Ukraine, a slightly higher percent than in Russia receives disability bene-fits. Other benefits presented in the table are not that ‘popular’. We should note
12 Owen and Robinson (2003), citation from the overview presented on the IMF website.

SOCIAL SECURITY, LABOUR MARKET AND RESTRUCTURING…
CASE Network Reports No. 90 29
that the share of people with disability pensions has been decreasing recently in both countries, while in Russia the share of individuals covered by welfare pen-sions is increasing. This last trend may result from increased generosity of the system in which the government uses money from oil revenues to finance social transfers. Table 2.1a. Pensioners by the type of benefits in Russia
Year Total in thousand Old-age Disability Survivors Pensions for
long service Social assis-
tance pensions 1995 37083 78.2 11.5 6.7 0.5 3.0 1996 37827 76.9 12.0 6.5 1.4 3.2 1997 38184 75.9 12.6 6.6 1.5 3.3 1998 38410 75.6 12.5 6.8 1.6 3.5 1999 38381 75.4 12.5 6.8 1.7 3.5 2000 38411 75.0 12.6 5.5 1.8 5.2 2001 38630 75.0 12.5 6.8 1.7 3.8 2002 38432 77.3 11.8 6.6 - 4.2 2003 38164 76.7 11.8 7.2 - 4.3 2004 38184 76.5 11.5 7.6 - 4.3 2005 38313 76.7 11.3 7.2 - 4.7
Source: Statistical office of the Russian Federation. Table 2.1b. Pensioners by the type of benefits in Ukraine
Year Total in thousand Old-age Disability Survivors Pensions for
long service Social assis-
tance pensions 1995 14515 73.5 11.9 8.5 2.9 3.2 1996 14487 73.3 12.5 8.2 3.0 3.0 1997 14487 73.1 12.9 8.0 3.1 2.9 1998 14535 72.6 13.2 8.0 3.2 2.9 1999 14521 72.1 13.6 7.9 3.4 2.9 2000 14530 71.7 13.8 7.9 3.6 3.0 2001 14447 71.3 13.9 8.0 3.8 3.0 2002 14423 71.2 14.1 7.8 3.9 3.0 2003 14376 71.5 14.1 7.6 4.0 2.8 2004 14348 71.8 13.8 7.5 4.1 2.8 2005 14065 73.7 12.7 6.6 4.3 2.8
Source: Statistical office of Ukraine.
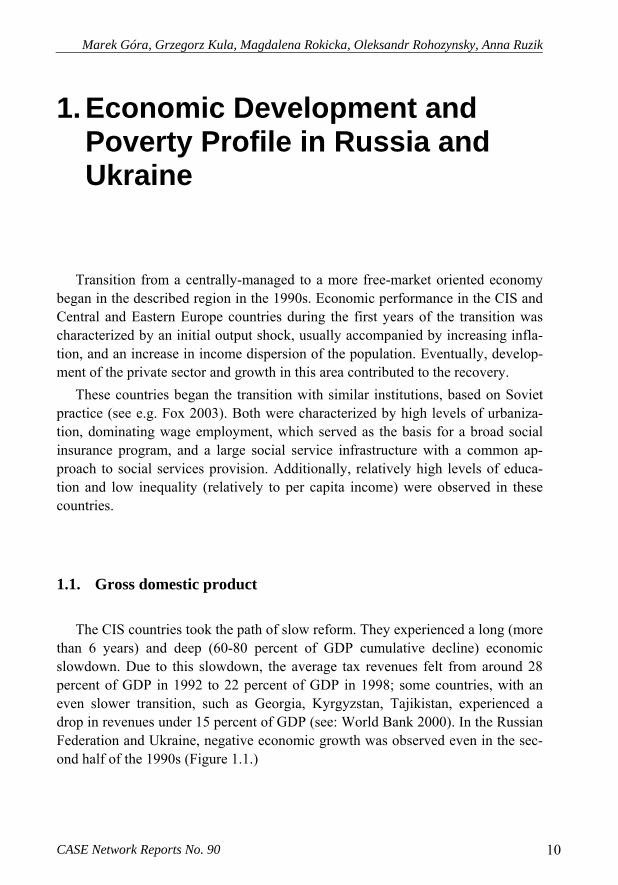
The actual number of pensioners is slowly decreasing due to shorter life spans and increased labour force participation of the elderly. However, combined with a decrease in fertility rates, the share of pensioners in the population is actually in-creasing (although in Ukraine it fell slightly in 2005 – see Figure 2.5a). As we can see, this share is much higher in Ukraine. Dobronogov (1998) suggests that this is

Marek Góra, Grzegorz Kula, Magdalena Rokicka, Oleksandr Rohozynsky, Anna Ruzik
CASE Network Reports No. 90 30
at least partially the result of Ukrainian legislation in the ‘90s, which increased the number of professions entitled to early retirement, decreasing the actual retirement age to 58 for men and 54 for women13. Such a large and increasing share of pen-sioners means trouble for financing the social safety net. Luckily, for the system, the number of employees per one pensioner has stabilised and is even slowly in-creasing, as shown in Figure 2.5b. Nevertheless, this increase is not very high and the system dependency ratio remains low. Again the situation is more difficult in Ukraine with only about one and a half employees per one pensioner. However, the sharp change between 1998 and 1999 is at least partially due to the change in methodology of the statistical office of Ukraine, and not only to some sudden in-crease in the number of pensioners or fall in employment, although these have probably taken place in response to the economic crisis.
In Russia, according to the IMF (2004), the old-age dependency ratio is cur-rently about 30 percent and it is projected to rise to 40 percent by 2020 and even to 60 percent by 2040. This is faster than the European Union average, with the fore-casted increase from 25 percent in 2000 to 50 percent in 2040. With such an in-crease of pensioners and a decrease of the number of people of working age, social insurance contributions are not enough to cover the expenditures of the social se-curity system, even assuming that everybody pays their contributions, which is also a problem. Figure 2.5. Pensioners in Russia and Ukraine in relation to population a) Pensioners per 1000 population
230
240
250
260
270
280
290
300
310
1992 1993 1994 1995 1996 1997 1998 1999 2000 2001 2002 2003 2004 2005Russia Ukraine
13 Dobronogov (1998), p. 6.
SOCIAL SECURITY, LABOUR MARKET AND RESTRUCTURING…
CASE Network Reports No. 90 31
b) Number of employees per one pensioner
1.2
1.4
1.6
1.8
2
2.2
1992 1993 1994 1995 1996 1997 1998 1999 2000 2001 2002 2003 2004 2005Russia Ukraine
Source: Statistical offices of Russian Federation and Ukraine.
Thus, the situation of pensioners during transition was very difficult. According to Kapstein and Milanovic (2000, p. 9): “…In 1993-94, some 26 percent of all Russians living in poverty were pensioners, making them an over-represented group, since they make up only 19 percent of the total population…”. These people had to find some means of living, usually in the informal sector. The situation of current pen-sioners influences the choices of future pensioners. According to economic theory, the more difficult it is to survive on pensions, the less willing people should be to retire. Interestingly, Figure 2.3, which we have discussed above, suggests that such a scenario indeed takes place. Indeed, this figure possibly can be used as an argument for increasing the pension age in order to increase the labour supply of elderly. As a response to the sharp income decline and cuts in public spending, in Ukraine, labour force participation rates increased sharply for both men and women in the older age group: in the age group 60-64, rates increased from 32 to 77 percent between 1989 and 1995 for men, and from 14 to 67 percent for women (Riboud and Chu, 1997). However, as we have stated before, it is doubtful that the rise in the registered activity was really due to an increase in the actual labour force participation of the elderly.
2.3. Labour supply Decreased labour incomes of working family members and decreased social
security incomes of other population groups during the transitions forced the

Marek Góra, Grzegorz Kula, Magdalena Rokicka, Oleksandr Rohozynsky, Anna Ruzik
CASE Network Reports No. 90 32
population to increase economic activity. Although the size of the population be-tween 15 and 65 years of age is decreasing, the labour supply of elderly people spiked dramatically at the beginning of the 1990s (Figure 2.6). Another spike in economic activity was observed in Russia in 1999, and Ukraine experienced a large decrease in the economically active population the same year, after the monetary crises of 1998. This effect can be interpreted as a post-1998 crisis recov-ery in Russia and the delayed effect of this crisis in Ukraine. In Russia, people affected by the crisis increased activity to find means of living, and in Ukraine firms continued firing workers at the same time. Unfortunately, in 1999, there was a change in methodology of the statistical offices and we are not able to say to what extent the change in the data reflects actual economic processes and to what extent the new methodology. Table 2.2 shows that, currently, the number of eco-nomically active people stabilized in Ukraine and is slightly increasing in Russia. This is the result of the improving economic situation in both countries. Neverthe-less, the problem of decreasing population remains, since the population reserves, out of which new entries to the labour force are possible, are getting both smaller and older. Table 2.2. Population in different states of economic activity (in thousand)
Russian Fed. (population aged 15-72) Ukraine (population aged 15-70) Active Active Year
Total Employed Unemployed Inactive Total Employed Unemployed Inactive
1995 70740 64055 6684 37924 25562 24125 1437 12110 1996 69660 62928 6732 39696 26112 24114 1998 11560 1997 68079 60021 8058 41197 26086 23756 2330 10754 1998 67339 58437 8902 42872 25936 22998 2937 10714 1999 72175 63082 9094 38016 22747 20048 2699 13783 2000 72332 65273 7059 38777 22831 20175 2656 13318 2001 71411 65124 6288 39995 22755 20238 2517 13529 2002 72421 66266 6155 39513 22232 20091 2141 13668 2003 72835 67152 5683 39047 22171 20163 2008 13688 2004 72909 67134 5775 38743 22202 20296 1907 13623 2005 73811 68603 5208 37686 22281 20680 1601 13560 Note. The sudden fall in the Ukrainian active population between 1998 and 1999 is due not only to the economic crisis but also to a change in the methodology used by the Ukrainian statistical office. Source: Statistical offices of the Russian Federation and Ukraine.
The average rate of economic activity in Russia is about 65 percent and in Ukraine about 62 percent, so the differences are not large. Desegregation by age and gender shows that the structure of the economically active population changed over the last 15 years. First, we can observe an increase of the labour force par-

SOCIAL SECURITY, LABOUR MARKET AND RESTRUCTURING…
CASE Network Reports No. 90 33
ticipation of elderly for both males and females between 1989 and 1995. Then, while the labour force of elderly remains high, it is slightly declining during 1995-2005, substituted by increased economic activity of younger generations. Figure 2.6. Ukraine labour force participation rates at the beginning of transformation
Source: Riboud and Chu, 1997.
The size of the actual increase in economic activity of the elderly is question-able. Definitely, some of the increase can be attributed to delayed retirement, returning to a job as a part-time employee or employment in the shadow economy. For example, a number of elderly began cultivating their plots of land, producing food for themselves and their families. However, there is also the possibility that some of the difference can be attributed to the change in statistical methodology. Some elderly were working even before the start of transition, performing some small tasks, cultivating plots of land, helping their friends and relatives. These activities were not registered as labour and the economic activity of elderly should spike when these activities are included in the new statistics..
Figure 2.7. shows the situation after the start of transition. Because of data ag-gregation the picture is not as clear as in Figure 2.6. However, some facts are visi-ble. In Russia, activity of the group aged 25-29 increased, although it is hard to point out the reason. The activity rates of the elderly remain relatively high. In both Russia and Ukraine, activity of people aged 50 and over decreased and then increased slightly, but stayed below the initial levels, i.e. from 1992 for Russia and from 1995 for Ukraine. The increase can be associated with the improved eco-nomic situation, but the initial decrease contradicts this intuition. During the time of the crisis, the economic activity of elderly increased, most likely because they

Marek Góra, Grzegorz Kula, Magdalena Rokicka, Oleksandr Rohozynsky, Anna Ruzik
CASE Network Reports No. 90 34
needed to find means of living when there were no jobs and a non-functioning social safety. Deferred retirement decreased opportunities for the younger age group, decreasing the inactivity rate of the youngest group. If the most severe cri-sis was over and there was no need to look for additional means of living, the eco-nomic activity of elderly decreased and we can observe a substitution of older workers with the younger generation.
This discussion leads us to a hypothesis that can explain changes in the patterns of the economic activity of elderly. It seems that the initial increase was due mainly to a change in the statistical methodology: many elderly were performing the same activities in the Soviet Union, but it was not treated as labour and formed part of the unofficial, grey economy. After the start of transition, with worsening living conditions, the collapse of social safety nets, and problems with paying out benefits, some elderly indeed became active on the labour market. However, for many of them, labour force participation remained the same: they were still culti-vating their plots of land and doing things as before. Later, as statistical offices adopted the ILO methodology, they were treated as economically active. After-wards, with improving economic conditions, rebuilding of the social safety nets and decreasing pension arrears, the labour force participation of the elderly has fallen as some of them have been able to live from their pensions and other bene-fits. This explanation fits the figures presented, but it is only a hypothesis. Unfor-tunately, we do not have the data to study it in detail and to confirm that this hy-pothesis holds.
As far as the differences in the activity rates between sexes are concerned, women, and in particular elderly women, are less active than men. However, there are no substantial differences in the shape of the graphs in Figure 2.7., as if, apart from the levels of activity rates, the patterns were similar, at least for 2002 and 2005. The differences for earlier years are a bit more pronounced. We would have expected lower rates for women of child-bearing age, but this is not the case al-though the number of nurseries and kindergartens has fallen during transition (by 35.6 percent between 1989 and 1997), and family benefits for households with small children have had no influence on whether and how much mothers work (Lokshin, 2004). In fact, for both sexes, in particular for women, the average par-ticipation rate is quite high if we compare it with other countries14. A more de-tailed analysis of the gender situation in the labour market and SSN is presented in the next section of the paper.
14 Lokshin (2004), p. 1097.

SOCIAL SECURITY, LABOUR MARKET AND RESTRUCTURING…
CASE Network Reports No. 90 35
Figure 2.7. Activity rates by sex and age groups Russian Federation Ukraine
men
0
10
20
30
40
50
60
70
80
90
100
15-19 20-24 25-29 30-49 50-54 55-59 60-721992 1996 2002 2005
0
10
20
30
40
50
60
70
80
90
100
15-19 20-24 25-29 30-34 35-39 40-49 50-54 55-59 60-701995 1999 2002 2005
women
0
10
20
30
40
50
60
70
80
90
100
15-19 20-24 25-29 30-49 50-54 55-59 60-721992 1996 2002 2005
0
10
20
30
40
5060
70
80
90
100
15-19 20-24 25-29 30-34 35-39 40-49 50-54 55-59 60-701995 1999 2002 2005
Source: ILO, own calculations.
Labour supply in Russia and Ukraine was also significantly influenced by la-bour migration. Here the situations in both countries differ, as shown in Figure 2.8 below: Ukraine is loosing people through migration, while Russia is gaining. Al-though we do not have the complete data for Ukraine, this trend has been visible since in the early ‘90s, and it is only recently that net migration became positive. We believe that negative migration should be largely attributed to economic de-cline and political changes taking place in this country. As a result, the accumu-lated (net) migration to Russia from Kazakhstan, Uzbekistan, and Ukraine was more than 2.5 million individuals(according to IMF, see 2006b) from 1993-2004. In the record year 1994, almost one million people migrated to Russia from other CIS countries. These are the official figures, but the actual figures can be substan-tially higher since a large share of migration to Russia, estimated to be between 2 to 5 million, is illegal. Official migrations were composed to a significant degree from Russians living in other parts of the former Soviet Union and returning to Russia. Illegal immigration was composed of other nationalities, mostly people of Asian and Caucasian origins. However, recently migration to Russia has begun to

Marek Góra, Grzegorz Kula, Magdalena Rokicka, Oleksandr Rohozynsky, Anna Ruzik
CASE Network Reports No. 90 36
decrease: on the one hand there are not so many ethnic Russians left outside Rus-sia; and on the other, the government has imposed restrictions on immigration, for example by increasing the cost of residence permits (IMF, 2006b). Figure 2.8. Net migration rates (per 1000)
-4
-3
-2
-1
0
1
2
3
4
5
1995 1996 1997 1998 1999 2000 2001 2002 2003 2004 2005 2006
Russian Federation Ukraine
Source: Eurostat.
2.4. Unemployment Decreased labour demand and increased economic activity (labour supply)
should result in increased unemployment. It is a phenomenon of CIS countries (clearly observed in Russia and Ukraine) that unemployment rates did not reflect this imbalance in the labour market for a long time. As stated before, according to the World Bank study (Lehmann, 1995), in Russia in the first half of the ‘90s, firms decided not to fire redundant workers, but instead they persuaded them to “…work short-time, to go on involuntary extended leave or to work without pay for long periods of time…”15 Workers did not quit their jobs for three reasons. First, they hoped that the situation would improve and they would receive their salaries. Second, it was difficult to get unemployment benefits, because of the strict eligibility criteria and the level of benefits was very low. Third, it was possi-ble, while being officially employed, to work in the informal sector.
15 Lehmann (1995), p. 47.

SOCIAL SECURITY, LABOUR MARKET AND RESTRUCTURING…
CASE Network Reports No. 90 37
Because of the measurement problems with the data, it is hard to present de-tailed information on the labour force in Russia in the first half of the ‘90s. How-ever, according to Lehmann (1995), some facts are clear. As can be seen from Figure 2.9, there is a substantial difference between official, registered unemploy-ment and unemployment measured according to International Labour Organization standards. There is also a visible relation between unemployment and growth: with positive growth, unemployment began falling. Figure 2.9. GDP growth and unemployment
Russian Federation
-25
-20
-15
-10
-5
0
5
10
15
1991 1992 1993 1994 1995 1996 1997 1998 1999 2000 2001 2002 2003 2004 2005 2006
GDP growth Unemployment (ILO) Registered unemployment Ukraine
-25
-20
-15
-10
-5
0
5
10
15
1991 1992 1993 1994 1995 1996 1997 1998 1999 2000 2001 2002 2003 2004 2005 2006
GDP growth Unemployment (ILO) Registered unemployment
Source: Statistical offices of Russian Federation and Ukraine, data from ILO and IMF.

Marek Góra, Grzegorz Kula, Magdalena Rokicka, Oleksandr Rohozynsky, Anna Ruzik
CASE Network Reports No. 90 38
In the early ‘90s unemployment was low, much lower than in other CEE coun-tries. In the late ‘90s, it began increasing and actual unemployment reached levels similar to other countries, although the official one stayed very low. What is the reason for such a significant difference between actual and registered unemploy-ment? Obviously, there are many factors affecting the situation. Some of them, such as “labour hoarding” and unwillingness of firms to fire workers, are dis-cussed in the section on the situation of workers. As a result, many workers, though officially employed, were unemployed according to ILO standards. Quite often, if someone registered as unemployed, it was the result of quitting voluntar-ily and not a forced separation. According to Lehmann “…The majority of separa-tions in 1992 and 1993 has been voluntary quits while employment reductions were only the second most important reason for separation…”16 However, workers themselves were not willing to register as unemployed. The main problems lie in the legislation and organization of the unemployment protection, which provided incentives against registering. They included rules such as: persons who received severance pay in 1992 and 1993 were not eligible for unemployment benefits, when you were fired and registered as unemployed; the probability that you obtain the benefits is low, etc. As far as the organization of the unemployment protection is concerned, the most important problem was that in the rural areas the distance to an Employment Centre could be very large. Figure 2.10. Duration of job search among unemployed looking for a job
Russian Federation Ukraine
0
20
40
60
80
100
1995 1996 1997 1998 1999 2000 2001 2002 2003 2004 2005less than 3 months 3 to 6 months 6 to 12 months more than 1 year
0
20
40
60
80
100
1995 1996 1997 1998 1999 2000 2001 2002 2003 2004 2005less than 3 months 4 to 6 months 7 to 12 months more than 1 year
Source: Statistical offices of Russian Federation and Ukraine, own calculations. Lehmann observed that unemployment in Russia (at least official unemploy-
ment) was dynamic, with short unemployment spells, low probability of becoming
16 Ibid., p. 48.

SOCIAL SECURITY, LABOUR MARKET AND RESTRUCTURING…
CASE Network Reports No. 90 39
unemployed and relatively high probability (about 60 percent between 1992 and 1993) of finding a job and leaving unemployment. In the 1990s, this outflow from unemployment was mainly to state enterprises, which he attributes to state subsi-dies. Let us compare Lehmann’s observations with Figure 2.10. As we can see, at least after 1995, people looking for a job for more than one year formed the largest group among the unemployed, although in Ukraine the share of this group was shrinking and in 2005, most of the unemployed looked for a job for less than 3 months. This is obviously a result of the improving economic situation.
There are reasons to believe that this change in Ukraine was just temporary. Kupets (2005) reports estimates of the determinants of unemployment duration (without data for 2005), which suggest that unemployment in Ukraine is stagnant and not reacting to the economic upturn. They imply “…that a temporary shock in the early 90s has brought long-lasting effects in terms of high and persistent un-employment and that unemployment in Ukraine during the last years can be char-acterized as mainly structural…”17. In her opinion this can be explained, at least partially, by additional earnings activities or farming.
A comparison of the average duration of a job search between Russia and Ukraine reveals differences that may mean long-term structural changes occurred in Ukraine. The job search in Ukraine is getting shorter. The Figure 2.11 below suggests that up until the Russian crisis, the time of the job search was getting longer and after the crisis, when economies started to rebound, it began to de-crease. During the last years, the job search time in Russia remained stable, despite high growth rates. This may be explained by the fact that Russian growth is driven by growth in natural resources, mainly the oil sector. It is not necessarily, or at least equally, transferred to other sectors of the economy. At the same time, the average duration of the job search in Ukraine decreased significantly. One of the explanations may be that the population groups with longer job-search time gave up and dropped out of the labour force, leaving only highly-competitive labour with short spells of unemployment. An alternative explanation is that there was a large increase in labour demand in the country from both observed and hidden economic growth.
We should note as well high regional differences in unemployment, with low unemployment in large cities like Moscow, Kiev or St. Petersburg, and much higher unemployment in poor regions far from big cities.
Regional differences are significant and much more pronounced in Ukraine. For Russia, the unemployment rate in Moscow, in the regions with the lowest rates and the national average are quite close, with the national average about twice as
17 Kupets (2005), p. 60.

Marek Góra, Grzegorz Kula, Magdalena Rokicka, Oleksandr Rohozynsky, Anna Ruzik
CASE Network Reports No. 90 40
high as the minimum, which would suggest that the differences between regions are not so large. What is more, there were years in which Moscow was not the city with the lowest registered unemployment. Figure 2.11. Average duration of job search
6
6.5
7
7.5
8
8.5
9
9.5
10
10.5
11
1995 1996 1997 1998 1999 2000 2001 2002 2003 2004 2005Russia Ukraine
Source: Statistical offices of Russian Federation and Ukraine.
In turn, the highest regional rates are very high and volatile. There are obvious reasons for this volatility: while Chechnya is excluded, some of the neighbouring republics are among the regions with the highest unemployment. However, other regions with high rates are from other parts of Russia. Anyway, the spread of un-employment rates between the maximum and minimum can be quite high. Accord-ing to Lehmann (1995, p. 49), a comparison of the ratio of registered unemploy-ment and notified vacancies shows that, for Moscow, the ratio was below one, while in the Ivanovskaja Oblast, for example, it reached 75 in June 1994. In an-other study Commander and Yemtsov (1995), who compared regional inflow and outflow rates to and from unemployment from 1992 to 1994, also found large differences between regions, reaching almost 110 percentage points for outflow rates.
For Ukraine, the situation follows another pattern. There are no regions with very high registered unemployment rates and volatility is much lower. Kiev al-ways has the lowest rate, but some big cities have rates that are quite similar.

SOCIAL SECURITY, LABOUR MARKET AND RESTRUCTURING…
CASE Network Reports No. 90 41
Figure 2.12. Regional registered unemployment Russian Federation (without Chechnya)
0
5
10
15
20
25
30
1996 1997 1998 1999 2000 2001 2002 2003 2004 2005country regional min regional max capital (Moscow)
Ukraine
0123456789
1996 1997 1998 1999 2000 2001 2002 2003 2004 2005 2006country regional min regional max capital (Kiev)
Source: Statistical offices of Russian Federation and Ukraine.
In general, even disregarding the problems with registered unemployment, we can see from the figures above that the highest levels of unemployment in Russia and Ukraine during transition were lower than in many other CEE countries, with the highest rates below 15 percent, far from the almost 20 percent in Poland or Slovakia. As far as the differences between sexes are concerned, in Russia at the beginning of transition, the share of unemployed women was much higher than that of men. However, “…The gap between male and female unemployment rates closed by 1994, and in 1996, 9 percent of women were unemployed, compared with 9.6 percent of men…”18.
18 Lokshin (2004), p. 1097.

Marek Góra, Grzegorz Kula, Magdalena Rokicka, Oleksandr Rohozynsky, Anna Ruzik
CASE Network Reports No. 90 42
2.5. Demographic and further challenges to the social safety nets Increased long-term unemployment mentioned above is only one of the factors
that will increase demand and financial challenges for the social safety nets in Russia and Ukraine. Another long-term factor is demographic changes occurring in these countries.
The demographic situation in both countries is quite similar, with their popula-tions decreasing substantially. The fall is a bit more pronounced in Ukraine with three consecutive years (2000, 2001 and 2002) of population growth equal to -7.6 percent. The Russian situation was better, but here also the population loss was very big. In recent years, the rate of the shrinking of population is decreasing, but it is difficult to say if it is a temporary or permanent change. And even if it is a permanent change, it will be a very long time before populations begin growing again. The forecasts for Russia presented by the IMF (2006b, p. 61) are that “…If current trends continue, Russia’s population is expected to decline by over 30 per-cent during the next 50 years…”. This is a very important problem for both coun-tries from a cultural, social and economic point of view. Equally important are the changes in the sex and age structure of the population.
Figure 2.13a. Population by age groups in Russia (in millions people)
0
5
10
15
20
25
30
35
40
45
50
1990 1992 1994 1996 1998 2000 2002 2004 20060-14 15-24 25-44 45-64 65 and more
Source: Statistical office of Russian Federation, own calculations/

SOCIAL SECURITY, LABOUR MARKET AND RESTRUCTURING…
CASE Network Reports No. 90 43
Figure 2.13b. Population by age groups in Ukraine (in millions people)
0
2
4
6
8
10
12
14
16
1990 1992 1994 1996 1998 2000 2002 2004 20060-14 15-24 25-44 45-64 65 and more
Source: Statistical offices of Ukraine, own calculations.
In both countries, the number of elderly (65 and older) is increasing. The num-ber of young people (between 15 and 24) is also increasing, but it is not enough to offset the rising population of elderly. What is more, in Ukraine recently, the number of elderly for the first time is higher than the number of young people. Combined with a decreasing number of children and general fall in the population, all these elements point to a dangerous trend of a quickly aging society, as shown in Figure 2.14.19. As we can see, the share of elderly is approximately 2 percentage points higher in Ukraine than in Russia, but in both countries the rate of increase of the share of people aged 65 and over in the population is similar, and slightly increasing, after the slowdown around the year 2000. The process is similar to the one taking place in other Central and Eastern European countries and in Germany, but at a slower rate.
Falling life expectancy did influence the size of the population in Ukraine and Russia. It is more pronounced in Russia, where male life expectancy at birth is below 60 years, while women can expect to live more than 70 years on average. In Ukraine the situation is better, with female life expectancy at birth remaining close
19 In this figure, as in a few other figures in the paper, it appears that the dynamics of the processes in Russia and Ukraine are very similar, although the levels are different and seem to be shifted by a constant. In some cases it is relatively easy to explain: both econo-mies are very closely related, but Russia dominates. Thus, whenever there is a change in the Russian economy, the Ukrainian one is very likely to follow with some delay. How-ever, in other cases, such as demographic problems, this shift is difficult to interpret with-out a very detailed analysis.

Marek Góra, Grzegorz Kula, Magdalena Rokicka, Oleksandr Rohozynsky, Anna Ruzik
CASE Network Reports No. 90 44
to 75 years. However, men live on average more than 10 years less and their life expectancy, after a slight increase around 1998, continues to fall. The result is that men die relatively young, leaving an increasing number of elderly women without husbands who are still the main earners in the majority of households. The dispro-portion in life expectancy is not reflected in the social safety net in both countries. On the contrary, women are eligible to retire five years earlier than men. Figure 2.14. Share of people aged 65 and over in the population
9
10
11
12
13
14
15
16
17
1990 1992 1994 1996 1998 2000 2002 2004 2006Russia Ukraine
Source: Statistical offices of Russian Federation and Ukraine. Figure 2.15. Life expectancy at birth
Russian Federation
55
60
65
70
75
1990 1991 1992 1993 1994 1995 1996 1997 1998 1999 2000 2001 2002 2003 2004 2005men women

SOCIAL SECURITY, LABOUR MARKET AND RESTRUCTURING…
CASE Network Reports No. 90 45
Ukraine
55
60
65
70
75
1990 1991 1992 1993 1994 1995 1996 1997 1998 1999 2000 2001 2002 2003men women
Source: Statistical offices of Russian Federation and Ukraine.
The research on the shrinking population and high mortality rates in the former Soviet Union, for example Brainerd and Cutler (2004), show that there are two principal causes of this crisis: increased alcohol consumption and the stress from the transition process. The former mainly results from lower prices of alcohol and easier access to alcohol after the fall of communism. The latter is obviously con-nected with the tremendous changes in the social and economic environment. However, and this is very interesting from the point of view of this paper, the Brainerd and Cutler results also suggest a direct relation between this stress and reductions in the social safety net. These two causes explain about half of the in-crease in the mortality rate and each seems equally important. The authors were not able to find factors responsible for the other half. There was no evidence of the influence of poorer quality medical services, nor of the change in the diet of the population.
Marek Góra, Grzegorz Kula, Magdalena Rokicka, Oleksandr Rohozynsky, Anna Ruzik
CASE Network Reports No. 90 46
3. Gender Specific Issues Related to Participation in Social Security
Some changes that occurred in Ukraine and Russia in the last decade and a half have affected women and men in different ways. Gender asymmetry can be ob-served in employment cuts, changes of employment between sectors/branches, and access to jobs in the private sector. As a consequence, gender differences are also noted when discussing a wage gap, vulnerability and the risk of falling into pov-erty, especially within a group of elderly women.
The aim of this part is to assess whether the existing social security systems in Ukraine and Russia are meeting critical gender needs, and how the transformation process determined the changes of social policy towards the equal treatment of men and women.
One of the major obstacles to adequate analysis of gender related social issues is the lack and inadequacy of much of the existing data. This problem was largely discussed and recommendations by major international organisation were provided (Gender Plan of Action, USAID 2001, Gender Issues in Ukraine, UNDP 2003, Making the...,WB 1999) which resulted in national declarations to improve gender sensitive data.
3.1. Labour market - gender perspective The gender dimensions of the social security system should be analyzed not
only by considering the benefits that are available to women and men, but as well from the perspective of the labour market. The labour market is an essential basis for many of the advantages and disadvantages of various social groups, and as a consequence, it has some role in determining their needs for social security. Given this connection, the labour market is the starting point for analysis.
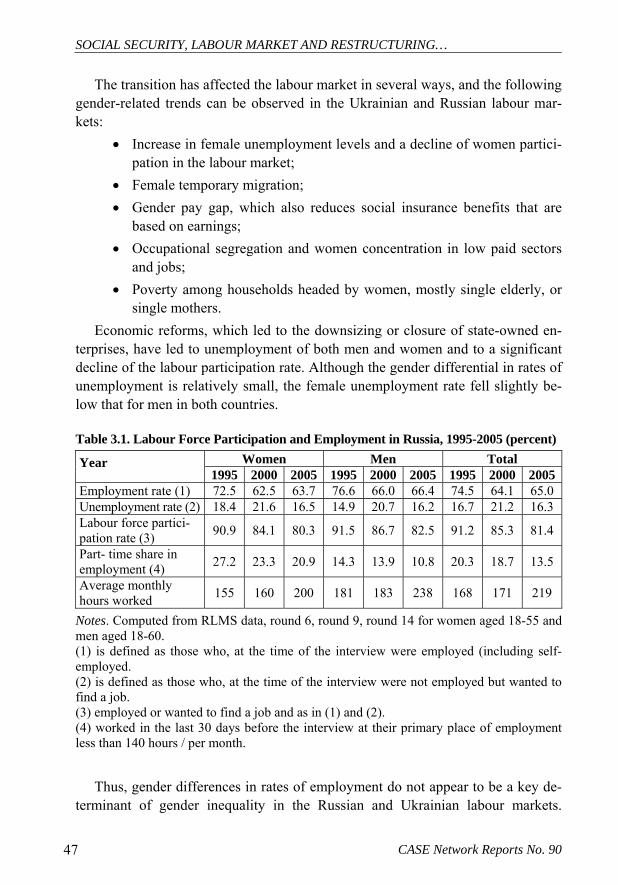
SOCIAL SECURITY, LABOUR MARKET AND RESTRUCTURING…
CASE Network Reports No. 90 47
The transition has affected the labour market in several ways, and the following gender-related trends can be observed in the Ukrainian and Russian labour mar-kets:
• Increase in female unemployment levels and a decline of women partici-pation in the labour market;
• Female temporary migration; • Gender pay gap, which also reduces social insurance benefits that are
based on earnings; • Occupational segregation and women concentration in low paid sectors
and jobs; • Poverty among households headed by women, mostly single elderly, or
single mothers. Economic reforms, which led to the downsizing or closure of state-owned en-
terprises, have led to unemployment of both men and women and to a significant decline of the labour participation rate. Although the gender differential in rates of unemployment is relatively small, the female unemployment rate fell slightly be-low that for men in both countries. Table 3.1. Labour Force Participation and Employment in Russia, 1995-2005 (percent)
Women Men Total Year 1995 2000 2005 1995 2000 2005 1995 2000 2005
Employment rate (1) 72.5 62.5 63.7 76.6 66.0 66.4 74.5 64.1 65.0 Unemployment rate (2) 18.4 21.6 16.5 14.9 20.7 16.2 16.7 21.2 16.3 Labour force partici-pation rate (3) 90.9 84.1 80.3 91.5 86.7 82.5 91.2 85.3 81.4
Part- time share in employment (4) 27.2 23.3 20.9 14.3 13.9 10.8 20.3 18.7 13.5
Average monthly hours worked 155 160 200 181 183 238 168 171 219
Notes. Computed from RLMS data, round 6, round 9, round 14 for women aged 18-55 and men aged 18-60. (1) is defined as those who, at the time of the interview were employed (including self-employed. (2) is defined as those who, at the time of the interview were not employed but wanted to find a job. (3) employed or wanted to find a job and as in (1) and (2). (4) worked in the last 30 days before the interview at their primary place of employment less than 140 hours / per month.
Thus, gender differences in rates of employment do not appear to be a key de-terminant of gender inequality in the Russian and Ukrainian labour markets.

Marek Góra, Grzegorz Kula, Magdalena Rokicka, Oleksandr Rohozynsky, Anna Ruzik
CASE Network Reports No. 90 48
Therefore, to accomplish the analysis, we should compare the labour force activity rate. Figures conform to the historical pattern: female labour activity remains very high and is close to the male activity rate. Some difference is partly attributable to the lower retirement age for women and, in part, to a number of wives who do not work outside the home. Figure 3.1. Unemployment rate (in %) by sex in Russian Federation and Ukraine
Russian Federation
0
2
4
6
8
10
12
1990 2000 2002 2004Male Female
Ukraine
02468
101214
1995 2000 2001 2002 2003 2004 2005
Male Female
Source: Russian and Ukrainian Statistical Office.
As reported by Ruminska-Zimny (2002), men, especially those with narrow technical skills and living in declining regions, have been hit by employment cuts. In many regions of the Russian Federation or Ukraine, but also elsewhere, they have little chances for new jobs. Basic figures do not reflect the complexity of unem-ployment problems. It was revealed that in the Russian Federation, women's long-term unemployment is much worse than men's. The most at risk are middle-aged women with higher education and young women with small children. A similar occurrence was observed in Ukraine, where the level of unemployed women who have completed higher education is higher than for men (according to statistics for 2001: 7 percent of unemployed women and 6.6 percent of unemployed men)20.
3.1.1. Female migration One of the significant forms of migration in Ukraine is temporary “shuttle migra-
tion”. The assessment of its level is difficult since most of the migrating workers leave for 3 month periods, giving tourism or another reason for crossing the boarder. However, the introduction of visa regulations in the New Members States in 2004 20 Gender Issues...,UNDP Kyiv 2003.

SOCIAL SECURITY, LABOUR MARKET AND RESTRUCTURING…
CASE Network Reports No. 90 49
resulted in a sharp decline of temporary workers coming from Ukraine to other CEE states. It is hard to estimate the actual number of Ukrainians leaving for temporary jobs but estimates range from 2 million to about 7 million. According to the estima-tion made by the Ministry of Foreign Affaires, several years ago about 300,000 Ukrainians worked in Poland, 200,000 in Italy, up to 200,000 in the Czech Republic, 200,000 in Spain, and 150,000 in Portugal. In regards to female workers, there is a high demand for domestic workers. Thus, the opportunities for female job seekers are robust, mainly in such gender specific fields as: housemaids, entertainers, and nurses. However, it can be anticipated that further expansion of the Schengen area will strengthen the border protection system and will result in the restriction of visa procedures, which might result in lower levels of temporary migration.
3.1.2. Gender pay gap The pay gap is one of the widely discussed characteristics of the labour market
both in Russia and Ukraine. Women’s salaries are reported as being, on average, 30 percent less than the equivalent for men in Ukraine21 and almost the same dif-ferences exists in Russia, where the gender wage ratio is calculated at 71%.22 A similar share was also observed while analysing the most recent household sur-veys. The adjusted earnings per hour demonstrated slightly smaller differences– women earn approximately 20% less than men. A worrying fact is that the pay gap in Russia seems to diverge, even while comparing per hour earnings (Table 1.7).
Currently, in both analyzed countries, women are excessively employed in the state sector, while a significant number of men shifted into private sector. It also should be highlighted that average wages in state enterprises are generally lower than those offered in the private sector. The difference in wages becomes more significant, as well, between the female-dominated budgetary sphere and the en-terprise sector of the economy. Due to the growing budget deficit, wages and sala-ries in the non- productive budgetary system were set at a level significantly lower than that set by self-financed enterprises. As figures for Ukraine show, the largest gender gap in job remuneration is in the area of finance, while the smallest is in agriculture where the level of salaries is generally much lower than in all other branches of economic activity. According to recent analyses based on the Russia Longitudinal Monitoring Survey23, the gender wage ratio is calculated at 71 per- 21 Gender Issues...,UNDP Kyiv 2003. 22 Ogloblin C., (1999). 23 Implied female/male ratio; Computed from the RLMS data, Round 6, Round 14 , for women aged 18-55 and men aged 18-60 who worked in the 30 days before the interview at their primary place of employment.

Marek Góra, Grzegorz Kula, Magdalena Rokicka, Oleksandr Rohozynsky, Anna Ruzik
CASE Network Reports No. 90 50
cent, and most of the difference is found to result from occupational and industrial employment segregation by gender. Table 3.2. Earnings in Russia for men (M) and women (F), 1995, 2000, 2005
1995 2000 2005
F M
F/M earnings
ratio
Im-plied F/M ratio
F M
F/M earn-ings ratio
F M
F/M earn-ings ratio
Im-plied F/M ratio
Mean monthly earnings in rubles
2095 3243 0.65 0.65 1498 2425 0.62 2478 4153 0.60 0.62
Mean earning per hour
16.58 23.56 0.70 0.80 10.91 14.81 0.74 19.37 25.53 0.76 0.71
Notes. Implied female/male ratio is (exp(lnwf)/exp(lnwm)), where ln wf and ln wm are, respectively the average log female and log male wages. Earnings are given in 2000 prices. Data are given with taking into account denomination: in January 1998 prices were de-nominated 1000 to 1. Computed from the RLMS data, Round 6, Round 14, for women aged 18-55 and men aged 18-60 who worked in the 30 days before the interview at their primary place of employment.
Figure 3.2, which displays the gender pay gap at the indicated percentiles of the male and female wage distributions, shows that the gender pay gap rises substan-tially throughout the wage distribution in Ukraine, with a rather converging trend in Russia above the 75th percentile. The figure also indicates wage convergence at the bottom of the distribution both in Ukraine and Russia, and the largest dispro-portion between the “wage groups” in Russia.
Figure 3.2. Log Hourly Earnings in Russia and Ukraine (by percentile)
4
5
6
7
8
9
10
11
1 5 10 25 50 75 90 95 99
Percentile
log wage
2005 MEN 2005 WOMEN
3
4
5
6
7
8
9
10
1 5 10 25 50 75 90 95 99
Percentile
log wage
2002 MEN 2002 WOMEN

SOCIAL SECURITY, LABOUR MARKET AND RESTRUCTURING…
CASE Network Reports No. 90 51
Table 3.3. Earnings in Ukraine by Gender, 2002
F M F/M earn-ings ratio
Implied F/M ratio
Mean monthly earnings in hrywnas 241.57 354.80 0.68 0.72
Mean earning per hour 1.58 2.14 0.74 0.78 Notes. Implied female/male ratio is (exp(lnwf)/exp(lnwm)), where ln wf and ln wm are, respectively the average log female and log male wages. Computed from ULMS 2003, for women aged 18-55 and men aged 18-60 who worked in the 30 days before the interview at their primary place of employment.
Furthermore, women’s share in part-time employment increased and the gender differences in hours worked and in worker status (part-time or full-time) appear to be significant in Russia, as well as in Ukraine. Women work about five hours less per week than men do, and the percentage of women working part-time is about twice as high as that of men.24 It is almost certain that such a situation is not evi-dence of gender discrimination, rather it is likely to be a deliberate choice of women, offering them more time for family and household chores.
Job segregation and employment status could partially explain why women's wages have declined sharply relative to men's wages. Although it should be admit-ted that it has nothing to do with the importance of female occupation (there are a significant number of women doctors and teachers) or level of their education (many of the professions in the ‘female’ branches demand long university studies).
3.1.3. Occupational segregation As it was already mentioned, the wage gap in Ukraine and Russia is primarily
explained by gender occupational segregation. Data on sectoral changes and self-employment in Ukraine and Russia illustrate that women did not benefit as often as men from job opportunities in the private sector and in the most dynamic branches of the service sector. However, in most cases they possessed the required qualifications and educational background.
Some extremes and peculiarities of occupational segregation by gender are worth mentioning. In Ukraine, sectors which guarantee a higher wage (fuel indus-tries, ferrous and coloured metals) have a low proportion of female labour and a large differential in wages between men and women. Whereas in such sectors as light industries, with one of the lowest wages, women dominate.
24 as above.

Marek Góra, Grzegorz Kula, Magdalena Rokicka, Oleksandr Rohozynsky, Anna Ruzik
CASE Network Reports No. 90 52
Statistics for Ukraine for 1999-2002 reveal a high percentage of women in the wholesale, retail and real estate trades, with education and healthcare at the top of the list. It is worth mentioning the high number of women in financial, legal and social services. Activities where men predominate include transport, mining, met-allurgical and machine-building industries. Table 3.4. Female and male employment in Ukraine by sector (percent)
2000 2001 Women Men Women Men All involved in economic activity 48.6 51.4 48.7 51.3 Agriculture 42.5 57.5 42.9 57.1 Mining and manufacturing 40.2 59.8 38.4 61.6 Construction 22.1 77.9 19.5 80.5 Wholesale and retail trade 57.1 42.9 57.7 42.3 Transport and communications 31.9 68.4 32.6 67.4 Financial Activity 58.6 41.4 56.6 43.4 Education, health, social support 79.1 20.9 78.3 21.7 Other 44.8 55.2 48.2 51.9
Source: Gender issues in Ukraine..., UNDP 2003.
A surprisingly high proportion of women is employed in the information and accounting services (64.8 percent according to figures for 2000), as well as in non-manufacturing types of services (73.2 percent) and state administration (48.2 per cent in 2001). Such a structure is relatively favourable for women as it is linked to post-industrial sectors, with prospects for fast development.
The women’s wage gap is mainly attributed to the fact that women account for more than two-thirds of all civil servants in childcare, health care, education, so-cial welfare, and administration. Despite the high public esteem, working condi-tions in these public sectors are below average with extremely low earnings.
Male employment is almost entirely concentrated in the industrial and agricul-tural sectors. There is a risk of further decline and future unemployment in these areas, and also a need for male job reorientation. This is also confirmed by the data from the recent household surveys- which indicate that women are overrepre-sented in such positions as technicians and associate professionals, professionals and service workers.
In Russia we could observe similar trends: 79 percent of economists, 94 per-cent of accountants, and 98 percent of bookkeepers in Russia are women.25 Whereas men are practically absent from such occupations as pre-school and pri-mary-school teacher and nurse, with very little presence in administration. Women 25 Ogloblin C., (1999). Analyses is based on the data from 1994 to 1996

SOCIAL SECURITY, LABOUR MARKET AND RESTRUCTURING…
CASE Network Reports No. 90 53
have also kept their high prevalence in such industries as finance and real estate. Relatively low-paid in the past, these industries and occupations have become prestigious and highly paid during the transition. This, however, does not signifi-cantly influence the gender earnings differential, since the shares of total employ-ment in these industries and occupations remain small. Figure 3.3. Employment in Ukraine by occupation and gender (2003)
7.45
9.89
9.06
3.11
4.34
4.17
29.79
9.84
19.46
2.89
4.60
18.62
19.77
10.02
13.36
1.48
9.47
2.19
20.32
0.16
0 5 10 15 20 25 30 35
Senior Officials and ManagersProfessionals
Technicians and Associate ProfessionalsClerks
Service Workers and Shop WorkersSkilled Agricultural and Fishery Workers
Craft and Related Trades WorkersPlant and Machine Operators
Elementary OccupationsArmed forces
MEN WOMEN
Note. Computed from ULMS 2003, for women aged 18-55 and men aged 18-60 who worked in the 30 days before the interview at their primary place of employment, percent of the working female and working male subgroups.
Figure 3.4. Employment in Russian Federation by occupation and gender (2005)
7.74
7.50
10.70
1.17
5.02
1.00
24.40
29.44
12.64
4.80
20.83
23.51
10.58
18.01
0.12
5.25
6.86
10.18
0 5 10 15 20 25 30 35
Senior Officials and Managers
Professionals
Technicians and Associate Professionals
Clerks
Service Workers and Shop Workers
Skilled Agricultural and Fishery Workers
Craft and Related Trades Workers
Plant and Machine Operators
Elementary Occupations
MEN WOMEN
Note. Computed from the RLMS data, Round 6, Round 14, for women aged 18-55 and men aged 18-60 who worked in the 30 days before the interview at their primary place of employment.

Marek Góra, Grzegorz Kula, Magdalena Rokicka, Oleksandr Rohozynsky, Anna Ruzik
CASE Network Reports No. 90 54
Women’s employment in public sectors provides them with the minimum so-cial benefits although they do not guarantee additional in kind contributions, such as supplementary private pensions funds or medical allowances.
As revealed by Maltseva (2005), the occupational structure of employment in Russia is vastly segregated: among 27 occupational groups only 6 or 7 can be called integrated, while the majority of occupations are dominated either by men or by women. She further highlights that between 1985 and 2002 women repre-sented 90 percent of employees in occupational groups of the life science and health associate professionals, office clerks, customer service clerks, and teaching associate professionals. On the other hand, women were virtually nonexistent in such occupations as metal, machinery and related trades workers, as well as driv-ers and operators of mobile plants.
Some trends of gender segregation in Russia were as well analysed by Malt-seva (2005). She found that from1985 to 1994, the occupational segregation level grew; however, a decrease in segregation level was observed in 1994-2002, with a continuing entrance of men into "female" occupations (e.g. clerks, sales and ser-vices occupations.). Simultaneously, in this period, there was an evident decrease of the overall employment level in some gender-dominated occupations (e.g. in-dustrial workers).
The differential in wages between men and women can also be explained by ver-tical segregation: different levels of the professional hierarchy with predominantly male or female labour. According to the Ukrainian Population’ survey from 2002, the female share of top management in industry is around 20.2 per cent, with the highest share of women managers found in the non-productive sectors26. Despite high representation of women in the state administration, they are overrepresented in the support staff category, while their participation at decision-making levels and in executive power structures in Ukraine is marginal (less than 10 per cent)27.
3.1.4. Quantitative analysis
Methodology As reported previously, the earnings gap in Ukraine and Russia is highly attrib-
uted to occupational segregation and differences between the job characteristics,
26 Gender issues in Ukraine...,UNDP 2003. 27 Ukraine: Civil Service Transition. Volume I. Main Report and Annexes. World Bank 1997.

SOCIAL SECURITY, LABOUR MARKET AND RESTRUCTURING…
CASE Network Reports No. 90 55
for example, the more frequent presence of part time employment among women than men.
We decided to test this hypothesis and find the influences of such indicators as education experience, localisation, sector and position on the earnings distribution.
We used the standard approach according to the method suggested by Oaxaca (1973) and Blinder (1973). We estimated the earnings equation for men and women and then decomposed the differences into productivity allied features and unexplained characteristics.
The wage differential was defined as:
ln Wm – ln Wf = Xm’Bm – Xf
‘ Bf (1)
where Wm , Wf - wages of men and women, Xm , Xf
‘- vectors of mean productivity allied characteristics, Bm Bf – coefficients estimated in the regression
And then:
ln Wm – ln Wf = (Xm’- Xf ‘)Bm + Xf ‘(Bm- Bf) (2)
As well as:
ln Wm – ln Wf= (Xm’- Xf ‘)Bf + Xm ‘(Bm- Bf) (3)
Those components: (Xm’- Xf ‘)Bf, (Xm’- Xf ‘)Bm are explained by different char-acteristics of men and women, while: Xf
‘(Bm- Bf), Xm ‘(Bm- Bf) could be interpreted
as the discrimination component, or unobserved differences. In equation (2) we apply the assumption of male wage structure in the absence of discrimination, as in (3) we assume that in the absence of discrimination the female wage structure would prevail. The non-discriminatory structure should lie somewhere between the two (Cotton, 1988). The wage differential decomposition could be than rewrit-ten as:
Ln Wm – ln Wf=(Xm’- Xf ‘)Bp + Xm ‘(Bm- Bp)+ Xf
‘(Bp- Bf), (4)
where Bp is the estimated non-discriminatory wage structure. In this equation the first term is an estimate of the productivity differential, the
second term is an estimate of the male wage advantage, and the third term is fe-male disadvantages. The non-discriminatory wage structure is often approximated by the least squares coefficient estimates obtained from the pooled sample of males and females.

Marek Góra, Grzegorz Kula, Magdalena Rokicka, Oleksandr Rohozynsky, Anna Ruzik
CASE Network Reports No. 90 56
Data We used the Russian Longitudinal Monitoring Survey RLMS data (round 14,
2005) for Russia, and the Ukrainian Longitudinal Monitoring Survey ULMS data (2003) for Ukraine, which are household based surveys of households and indi-viduals.
We based our analysis on the sub-group of women aged 18-55, and men 18-60 taking into account the actual retirement age.
The earnings regression sample consisted of working-age individuals who con-sidered wage employment their main occupation and worked during the 30 days before the interview at their primary place of employment. The earnings approxi-mation, used in the earnings equations, is the amount of after-tax earnings (includ-ing wages, bonuses, and benefits) received by an individual in the reference month from the principal place of employment. Log earnings adjusted are used as the dependent variable in the regression equations for further gender differential analysis.
Independent variables are divided into human capital characteristics: education and experience described with the use of dummy variables (described in Annex 2) and labour market experience squared is integrated in the model to fit the typical experience-earnings profiles. Another group of independent variables accounts for sectoral and occupational segregation, and a region specific dummy is added to estimate the differences between regions.
Results for Russia Throughout the analysis several independent variables reported not to be statis-
tically significant: extracting industry and clerks in the pooled regression, and construction and business in the men’s population. In the female subgroup, the regional dummy was not statistically significant.
In all cases (pooled, men, female), working in such sectors as: agriculture, edu-cation and health sectors were negatively influencing the log of earnings, and a similar negative relation was observed in relation to the state-owned sector. The most dominant influences on earnings were education at the college and university level, and managerial occupation. The variable describing the part-time job had, as expected, a negative impact on the earnings level.
Decomposition of the gender differential in the log of monthly earnings re-vealed a gross differential of earnings equal to 44%. Differences of earnings caused by sector segregation account for 14% and seem to be more important than hierarchical segregation- the gap between gender earnings attributed to the posi-tion is relatively small (see Table 3.5).

SOCIAL SECURITY, LABOUR MARKET AND RESTRUCTURING…
CASE Network Reports No. 90 57
Table 3.5. Decomposition of the gender differential in the log of monthly earnings in Russia 2005 Gross Differential (1) 0.447163 Differences in Characteristics (2) Education -0.04248 Experience -0.00359 Differences in Sectors
Construction 0.027007 Health 0.007586 Education 0.027223 Total 0.143033
Ownership 0.022053 Occupation
Managers 0.006245 Clerks 0.000316 Craft 0.051491 Plant or Machine Operator or Assembler 0.06308 Total 0.014726
Region 0.003283 Part time job 0.032415
Unexplained Differential (3) 0.281986 Notes. (1) Computed as In Y'm - In Y'f. (2) Computed as (X'm-X'f)Bp. (3) Computed as X'm(Bm- Bp) + X'f(Bp-Bf). Results for Ukraine
Regarding the regression for Ukraine, we observed statistical insignificancy of such variables as general secondary education and within occupation group- clerks in the female subgroup, and services and the southern region in the male sample. In the pooled sample, all variables were at least significant at the 0.5 level.
Surprisingly, in the case of Ukraine, general secondary education negatively in-fluenced earnings. This can be explained by relatively common general secondary education, which is not a distinguishing characteristic of the potential or actually engaged employee.
The model confirmed the hypothesis, mentioned previously, of the negative re-lation between work in such sectors as education and healthcare and earnings dis-tribution, although the direction of the relation between work in public administra-tion and earnings was different than expected. According to the estimation con-ducted, employment in this field has a positive impact on wages, especially in the case of the male population, with an observable substantial difference between genders. This issue should be analysed in more detail since it might be the case that the vertical segregation reported in Ukraine, especially in public administra-

Marek Góra, Grzegorz Kula, Magdalena Rokicka, Oleksandr Rohozynsky, Anna Ruzik
CASE Network Reports No. 90 58
tion, is relatively high. Senior level administration representatives might receive remuneration on the higher level, even in comparison to the private sector.
The most rewarding seems to be working in construction and industry for both women and men, although the number of women present in this sector is limited.
Here again we use decomposition of the gender differential in the log of monthly earnings to identify the main contributors to the gender gap. According to the results obtained, the gross differential of log earnings are on the level of 32%. The main contributors to it are similar to those in the previous regression: sectoral segregation and occupation, while differential unexplained by model seems to account for almost 50% of the earnings differential between genders. Table 3.6. Decomposition of the gender differential in the log of monthly earnings in Ukraine, 2003 Difference Gross Differential (1) 0.32056 Differences in Characteristics (2) Education -0.01156 Experience -0.00649 Differences in Sectors
Construction 0.02423 Industry 0.03873 Transportation 0.01653 Education 0.02774 Public administration 0.00364 Total 0.09333
Occupation Professionals -0.01388
Managers 0.00799 Clerks 0.00757 Craft 0.01703 Plant or Machine Operator or Assembler. 0.01049 Elementary occupation 0.00152 Total 0.04267
Region -0.00202 part 0.02630 Unexplained differential (3) 0.18602
Notes. (1) Computed as In Y'm - In Y'f. (2) Computed as (X'm-X'f)Bp. (3) Computed as X'm(Bm- Bp) + X'f(Bp-Bf).

SOCIAL SECURITY, LABOUR MARKET AND RESTRUCTURING…
CASE Network Reports No. 90 59
3.2. Feminization of poverty Both in Ukraine and Russia there is a slightly higher poverty rate among
women than men, although the differences are fairly small. Some specific features of Russia and Ukraine demography may explain those differences: there are twice as many elderly women as elderly men, and most of the elderly poor are women. Table 3.7. Life expectancy in Russia and Ukraine at selected ages (2005)
Russia Ukraine Age Male Female Male Female At birth 58.7 72.4 61.2 73.1 30-34 32.1 44.3 34.1 45.0 60-64 13.2 19.0 13.8 19.1 80-84 6.0 6.8 5.8 6.6 100+ 2.0 1.9 1.8 1.8
Source: WHO statistics, available at http://www.who.int/whosis/database/life_tables/.
In Russia in 1998, while the average (general) poverty level of pensioners was 46.5 percent, the percentage of poor senior women amounted up to 54 percent28. The second poverty-vulnerable group consists of single mothers, as a worsening of their material status is observed, and the number of one parent families signifi-cantly increased.
According to a World Bank Report, Ukraine is facing similar problems. In Ukraine, gender specific poverty rates confirm women overrepresentation among the poorest in almost all age groups; in general, women have a slightly higher poverty headcount index (32 percent) than men (29 percent).29 Although those differences remain small, 9 percent of all poor households consist of an elderly woman over 64 years of age living alone, and less than 1 percent of all poor households consist of an elderly man living alone.
Poverty is prevalent in families where women do not work outside the home because of child care responsibilities, as well as in single parent families where households without fathers make up 88,5 per cent. Broken homes with children, single persons and families including pensioners and disabled people, are socially most at risk. The highest percentage of poor women among different age catego-ries is observed in the 65-74 age group, an inactive group of pension beneficiaries,
28 Working Towards a Poverty Eradication Strategy in Russia: Analysis and Recommenda-tions, United Nations Theme Group on Poverty ILO Moscow Office, Moscow 2001. 29 Only men age 40-44, and 60-64 were more touched by the poverty. Poverty in Ukraine... WB.

Marek Góra, Grzegorz Kula, Magdalena Rokicka, Oleksandr Rohozynsky, Anna Ruzik
CASE Network Reports No. 90 60
and surprisingly among women aged 30-35 (19.85 percent)30. Here they probably faced problems returning to work after having a child and have children of pre-school age. Female headed households (under 55) are as well more touched by poverty than male headed households (under 60) with a poverty rate of 27.4 per-cent for female headed households and 25.2 percent for their male counterparts, although the male headed households are up to twice as numerous31.
3.3. Social security system – gender dimension Women and men are affected differently by social security systems. Under the
previous system women were given a generous range of benefits, especially non-financial benefits in the form of housing, medical facilities, social care institutions, and childcare provision .When the transition period began, the social security sys-tem had to face a regular deficit and, as a consequence, those entitlements were eliminated or lowered. Minimum wage became the basis of a tariff system in the public sector and state owned enterprises, and social benefits were set up as a per-centage of the minimum wage. Women were affected differently by those changes not because of the inequalities in the social security regulations, but mainly be-cause of a different need for and usage of social security, which were both influ-enced by gender roles.
While analysing the social benefits from gender perspectives we might divide them according to their functions:
• social benefits related to work –pension; • unemployment benefits; • social benefits for poverty reduction and equality.
3.3.1. Social benefits related to work – pension A lower retirement age for women is the most distinctive characteristics of the
gender differential. It is being questioned if women should leave the labour market 5 years earlier than men. Even their higher life expectancy might support the pro-longation of the pension age. In Russia and Ukraine, men 60 years of age or older, who worked for at least 25 years, and women of 55 years of age or older, who 30 Poverty in Ukraine... 31 Poverty in Ukraine...

SOCIAL SECURITY, LABOUR MARKET AND RESTRUCTURING…
CASE Network Reports No. 90 61
worked for at least 20 years, qualify for normal retirement pensions regardless of whether they are still employed or not. The calculations for Russia show that men do not live long enough to be able to fully benefit from retirement schemes due to their early mortality. However, their pensions seem higher than those agreed for women. This is because women, on average, fall in the group of workers with lowest lifetime earnings. The other danger is if pensions are not indexed properly to inflation, females' living standards fall disproportionately with age because women live longer than men. Even if pensions are indexed to prices, older women's living standards will fall relative to those of younger workers if pensions do not rise as wages grow.
Pension benefit formulas in the past were highly redistributive in favour of lower income workers, which, given the prevailing gender wage gap and women’s shorter working tenure, was to women’s advantage. Pension reforms, which started in 2002 in Russia and are under implementation in Ukraine, although in-dispensable, reproduce the gap which exists on labour market by linking contribu-tions and benefits more closely. This closer linkage between contributions and benefits, as well as greater individuality in pension rights, is therefore generally disadvantageous for women. Women experience an inferior position in the labour market and do a disproportional amount of unpaid care work which results in shorter periods of life time contributions.
On the other hand, both in Ukraine and Russia pension schemes provide pen-sion credits for time periods that workers spent out of employment in order to care for young children at home. Given the general gender division of care responsibili-ties, mostly women benefit from this provision. While the rules for including such periods in work history varied in Ukraine and Russia32, in both cases, a year spent outside the workforce was generally treated as equal to a year of employment. This meant that periods of child care leave did not reduce the pension that a parent would receive. Given the social importance of unpaid care work, caring credits are reducing gender inequality in pensions.
3.3.2. Other social benefits Women are found to experience longer unemployment both in Russia and
Ukraine33. In Ukraine it was reported that the effect of gender unemployment ap-
32 In Russia, the duration of childcare leave is included in the total and unbroken service record and occupational work record, with the exception of cases of pension assignment on preferential terms, and is included into the work record up to 3 years. 33 Foley, 1997

Marek Góra, Grzegorz Kula, Magdalena Rokicka, Oleksandr Rohozynsky, Anna Ruzik
CASE Network Reports No. 90 62
peared significant while analysing the exit from employment and entry into inac-tivity. During the first year of unemployment, 31 percent of women and 37 percent of men return to employment, which shows, once again, that women are more exposed to long-term unemployment; furthermore, unemployment benefits are assigned only for the first year of unemployment34. It should also be mentioned that unemployment benefits fail their main function, which is to support the living standards of the unemployed at a socially acceptable level in order to allow them to focus on active job-search, as their level is on average 30 percent of average monthly wages35.
The reduction of previously easily accessible family benefits and social care services had a great impact on female population as a majority of women used those facilities in order to be able to participate in the labour market. Lack of those facilities or their weak adjustment to the new conditions, such as short working hours of child care institution and a decreasing number of such institutions, force women to seek low paid and less prestigious positions to meet their parental obli-gations.
Dramatic demographic changes – falling birth rates and high mortality rates - resulted in relatively generous gender specific benefits. In Russia, working women are receiving 100 percent of earnings payable between 10 weeks and 12 weeks before the expected date of childbirth and between 10 weeks and 16 weeks after childbirth. They as well have the right for parental leave, in which the benefits are equal to 200 percent of the minimum wage and payable up to 18 months. Also, additional “maternity grants” were introduced in Russia in 2007 and according to the new law, every mother of two or more children will be granted a 250,000-ruble (roughly $10,000) grant per baby36. It is still too early to evaluate the overall ef-fects of those new regulations, but certainly they will create an additional burden for the budget.
In Ukraine, women are given slightly lower maternity benefits: 100 percent of earnings for 70 calendar days before and 56 days after the expected date of child-birth. Also, women unemployed due to enterprise liquidation are eligible for the benefit- 100 percent of earnings received at the last place of work; and for those registered as unemployed for at least 10 months, the benefit is 100 percent of the minimum wage. Monthly benefits for parental leave are equal to 100 percent of the minimum wage paid until the child is 3 years old.
34 Kupets O., Determinants of unemployment duration in Ukraine, Moscow, EERC 2005. 35 Kupets O., Determinants of unemployment duration in Ukraine, Moscow, EERC 2005. 36 There are several conditions: mother cannot access the account before the child reaches the age of 3, and money can be spent only on the child’s education, or on better housing. The mother can also add the sum to her future pension.

SOCIAL SECURITY, LABOUR MARKET AND RESTRUCTURING…
CASE Network Reports No. 90 63
In the last decades in Russia the percentage of the family and maternal allow-ance was shrinking in the total volume of allowances: while in 1995 such allow-ances represented 54 percent of the total volume of allowances, in 1999 this per-centage had decreased to 37.3 percent37. Additionally, the 1 to 4 months of arrears make it impossible for recipients to use those benefits according to their needs.
Another important problem is poor targeting of social assistance both in Russia and Ukraine. For example, the effectiveness of social support programs in Russia is assessed on the level of 19 percent38.
This means that a large part of social aid is distributed not to the benefit of households with incomes below the subsistence minimum. For the poor, the al-lowances and benefits received are not adequate to their economic situation. Re-calling the feminization of poverty in both analyzed countries, the existing systems do not seem to be the best mechanism of support for those in real need. It should be redesigned to target, first of all, the most vulnerable groups, among them the single mother with a high risk of poverty.
More detailed analyses of gender access to social benefits and gender related issues of social security are impeded by the lack of appropriate gender specific data. However, some measures were taken and recently in Ukraine, for example, a proposal for improving gender desegregated data was included in the new strategic national programme: “The Action Plan for Improving the Status of Women and Men”.
37 Working towards poverty... 38World Development Report 1996. The World Bank. – 1996.

Marek Góra, Grzegorz Kula, Magdalena Rokicka, Oleksandr Rohozynsky, Anna Ruzik
CASE Network Reports No. 90 64
4. Policy Challenges for Social Security Systems in Russia and Ukraine
The largest social welfare item in the former Soviet Union countries is pen-sions, accumulating and spending from 7 to 12 percent of GDP. Other large parts of the social safety nets in most of the CIS countries are the education and health-care systems, since traditionally these countries declare the right to free education and healthcare in their constitutions. The countries spend a large portion of the state budget on these items, however with time, financing for these parts of the social safety net become lower than required to provide the service of adequate quality. Reform of the education and healthcare systems in these countries of tran-sition is an important issue for sustaining social security nets, but it is generally out of the scope of this paper and we will not discuss it in further detail.
Old age pensions consume over half of the total GDP spending devoted to so-cial safety nets in Russia. Old-age labour pensions form the core of the Russian social security system, determining social conditions for 80 percent of the total of 36 million pensioners, i.e. for 19,5 percent of the Russian population.39. In Ukraine there are over 11 million old-age pensioners who are receiving pension benefits, and contributions are being made on behalf of only 18 million workers.
4.1. The Social Safety Net Programs until beginning of the 21st century Prior to 1992, when the Soviet Union ceased to exist, both Russia and Ukraine
had social safety nets common to all Soviet republics. At that time, the primary goal of the system was to maintain a certain level of family per-capita income by supplementing wages. Because of the near 100 percent employment and the sup-plementary character of the safety net, in most cases its administration was carried out by state enterprises. The safety net relied heavily on in-kind transfers, such as
39 Mikhalev V.,Social security in Russia under economic transformation...

SOCIAL SECURITY, LABOUR MARKET AND RESTRUCTURING…
CASE Network Reports No. 90 65
free housing, childcare, reduced food and goods prices, and it was almost univer-sal. Due to the uniformity of income, the entire population was eligible for ser-vices provided by the system.
The analysed countries, after beginning of the transition, first expanded, then curtailed their social programmes, and have started moving away from collective to individualized solutions in the social field as well. The transition forced gov-ernments to take responsibility over their safety net expenditures that were previ-ously a part of enterprise finances.
4.1.1. Ukraine In Ukraine, the initial years of transformation from the Soviet system experi-
enced the conversion of their generous social protection system that had consisted of social privileges, Chernobyl benefits, housing and utility allowances, and fam-ily benefits. More than 20 social privileges to different population groups existed until the beginning of this century; they were introduced by different laws and presidential decrees, and simulated privileges that existed during the Soviet Union. The Law on “State Assistance to Families with Children”, adopted in 1993, intro-duced about 11 types of different family allowances; most of these allowances are distributed on categorical bases, and only a limited number of the allowances is provided on the income-based mean test basis. The Chernobyl benefits were intro-duced in 1991 by the Law “On the Status and Social Protection of Citizens Who Suffered from the Chernobyl Catastrophe”, and are provided on a categorical basis to the people who resided close to the site of the disaster. Most benefits were pro-vided in-kind. The government is supposed to provide reimbursement for the free services to the producers of such services, for example, telecommunication or transportation companies. Despite the constant attempts to fulfil its obligations, the government constantly failed to finance all obligations, increasing debts to service providers and to beneficiaries.
In 1995, in order to shield families from the impact of rapidly increasing en-ergy and housing prices, the government introduced the “Housing and Municipal Services Allowance Program”. The program increased government responsibilities and pressure on the budget. The allowances were financed from the local budgets, and the regions with a weak revenue base rapidly accumulated arrears.
A major shortcoming of all of the above-mentioned programs was that they were established to preserve the status-quo of the Soviet era privileges rather than to fight poverty. The government of Ukraine has been aware for a long time that the current safety net system is not aimed at the poorest population. The Decree of the President of Ukraine “On the Strategy to Eradicate Poverty” (Decree

Marek Góra, Grzegorz Kula, Magdalena Rokicka, Oleksandr Rohozynsky, Anna Ruzik
CASE Network Reports No. 90 66
#637/2001, August 15, 2001) mentioned that the share of social privileges in the total amount of household income of the poorest and the richest 10 percent of households equalled 5.5 percent and 8.1 percent, respectively in 2000.
The main critique to the social safety net in Ukraine is that it is not designed to alleviate poverty. Most programs by design provide larger benefits to the families or individuals with higher income. And because of the sluggish management, the programs were ineffective in controlling the eligibility for benefits. For example, according to the World Bank and Presidential Administration, 88 percent of peo-ple who received a housing subsidy in 2001 should not have been entitled to it. In the same year, 71 percent of families, that had a right to receive the housing subsi-dies did not receive it, and about 90 percent of families that had been entitled to receive support for low-income families were not among its recipients. Leakages lead to the problems financing the system, and as a result, the support was inade-quate: the payments received by the beneficiaries were not sufficient to bring their income over the subsistence level (World Bank, 2001).
At the same time, joint World Bank and Ministry of Labour and Social Protec-tion (MLSP) research (World Bank, 2001) showed that, in 1999, the state budget already had enough resources to bring all of the poor households above the pov-erty line. For example, in the first three quarters of 1999 the amount of money needed to eradicate poverty was 4.2 billion UAH, while the government spent over 4.5 billion UAH over the same period on the poverty alleviation programs and did not achieve the goal.
Since the above-mentioned programs were unable to eradicate poverty because they targeted too wide a population, in 2000, Verkhovna Rada adopted the Law on “Targeted Social Assistance to Low Income Families”. This law provided families living below subsistence level with compensating benefits up to 75 percent of the minimal subsistence level. The beneficiaries were restricted by asset test to people who do not possess a second apartment, a new car and did not make any substan-tial purchases over the last 12 months. This was the first law that was directly aimed at reducing poverty and that attempted to target the benefits to the people most in need.
4.1.2. Russia Political and economic transition also affected the safety net in Russia. A new
regulatory framework was worked out and implemented in the first half of the 1990s (1995 on disability, 1996 on mandatory pension insurance, 1998 on non-state pension funds, 2001 on public pensions, 2001 on labour pensions, 2001 on

SOCIAL SECURITY, LABOUR MARKET AND RESTRUCTURING…
CASE Network Reports No. 90 67
mandatory pension insurance, 2002 on early labour pension, 2004 tax code, im-plemented in 2005, 1995 on child benefits, 1991 on employment).
At the beginning of the 21st century, 70 percent of the Russian population were entitled to different social benefits. The current system of social benefits and bene-fit payment mechanisms, similar to that of Ukraine, has limited potential for redis-tributing resources to those who need them most.
As Kazakov (1997) mentioned, the Russian pension system, which was based strongly on state pension benefits, failed to support the adequate standard of living of senior citizens in 1992. This fact was strongly determined by the rapid reforms, which took place in Russia in 1992. Data show that 1992 was the worst year for Russian elderly and that there was some improvement in the well being of senior Russians later. As far as financial stability of the generous state pension fund is concerned, prior to 1996 the fund was rather stable. However, poor economic per-formance, weakened tax enforcement and a wave of tax amnesties and exemptions leading up to the presidential elections in 1996 resulted in a sharp decline in pay-roll tax collection, affecting the financial stability of the fund. As a result, ap-proximately 14 million of the 39 million pensioners underwent a period without pension payments (in arrears). The pension crisis had a large impact on living standards, with income declining by over one-third for pensioner households, and poverty rates tripling to more than 50 percent.
The economic revival after the 1998 crisis also had a positive impact on the pension system and the surplus of the Pension Fund has increased from about zero in 1999, to 0.9 percent of GDP in 2000 and 3 percent of GDP in 2001. An increase in the average pension at this time was due to increasing wages on the back of strong economic growth.
Trying to push towards greater efficiency of social policy while cutting overall spending, the Putin administration has so far focused specifically on three objec-tives (see Nies and Walcher, 2002):
• Centralization of financial resources allocated for fulfilling social guar-antees (e.g., elimination of off-budget social funds);
• Redistribution of the social-support burden between various levels of government on the one hand, and employees and employers on the other hand;
• Provision of social benefits on the basis of targeting (means test).

Marek Góra, Grzegorz Kula, Magdalena Rokicka, Oleksandr Rohozynsky, Anna Ruzik
CASE Network Reports No. 90 68
4.2. Recent reforms in the area of labour market and social security International experts agree that the pace of institutional and structural reforms
of the Social Safety Nets in CIS countries slowed at the beginning of the 21st cen-tury and the governments did not use the opportunity of increased economic per-formance during this period. The analysts agree that sluggish progress of reforms may be the result of the electoral cycles in countries such as Kazakhstan, Russia and Ukraine (UNECE, 2005).
4.2.1. Ukraine In Ukraine, the period 2004–2005 was a politically charged election period that
had a tremendous effect on the development of the Ukrainian social safety net. Ukraine had presidential election in November 2004, which resulted in the “Orange Revolution” and ended in January 2005. As a result of the revolution, power to form the government was shifted from the President to Parliament. A year after the first post-revolution government was formed, Ukraine had a Parliamentary election (March 2006). Both elections were dominated by two political forces that had an almost identical number of supporters. In order to win extra votes, both political forces began promising increases in social benefits to pensioners and the poor.
The increases in social benefits were implemented de-facto in the second half of 2004, and then adopted de-jure in 2005. Minimum benefits of most welfare pro-grams increased 3 to 12 times, and average benefits increased by 25-70 percent.
Further increases were planned for 2006 (see MLSP, PFU, 2005). As a result, so-cial welfare expenditures (including pensions) increased from 11.9 percent of GDP in 2003 to 17.4 percent in 2005. The government also increased the minimum wage by 40 percent (about a 30 percent increase in real terms) in 2005, which resulted in the increase of wages paid to the employees in the public sector and increased budget expenditures on healthcare, education, and government employees.
The political situation also did not allow the government to increase the tax rate and they even faced demands to decrease some taxes. For example, current personal income tax law provided a 13 percent flat tax rate for the period of two years that had to be replaced by a permanent 15 percent flat tax rate in 2006. However, due to political reasons, the increase was postponed. Another example is simplified taxa-tion of small businesses. The previous president passed a decree in 2001 establishing “simplified taxation for small businesses”. Businesses with turnover under $100,000 a year and up to 10 employees may pay a flat tax (only 200 UAH, or $40 a month in 2004-2005) instead of all taxes on their businesses, including payroll taxes. The

SOCIAL SECURITY, LABOUR MARKET AND RESTRUCTURING…
CASE Network Reports No. 90 69
decree lost power when the new president was elected in 2004; however, the life of this decree was extended because of the adverse reaction of small business owners. As a result, most employees of the small businesses still do not make sizable contri-butions to the pension or other social insurance funds. They are protected by some social insurances, but their contributions to the pension fund will not allow provid-ing them with anything but a minimal pension when they retire.
Good performance of the 2005 budget led policymakers to believe that increas-ing social welfare benefits may be sustained. Extending the offers to the voters, politicians in the parliamentary election campaign not only promised an increase in social benefits, but also promised to decrease payroll taxes from 39 percent to 25 percent. They expressed beliefs that, in the short-run, the increased social wel-fare benefits can be financed from other revenues of the state budget; at the same time, reduced payroll taxes will stimulate the expansion of the tax base for social insurance funds in the long-run.
However, international experts do not share the belief of the Ukrainian politi-cians that the increased expenditures can be sustained. A recent issue of the Eco-nomic Survey of Europe (see UNECE, 2005) noted that:
the political cycle in Ukraine led to a significant relaxation of fiscal pol-icy as the presidential elections drew closer. Although this is a wide-spread phenomenon, some of the populist pre-election moves (such as the large increases in pensions in September and the planned rise in public sector wages) will have lasting negative fiscal implications as they are equivalent to a general increase in government spending. As a result, the underlying structural fiscal balance is likely to have deterio-rated significantly in 2004. As shown by the experience of some east European countries (for example, Hungary) this type of fiscal loosening (involving notable wage increases) can have a lasting and damaging ef-fect on macroeconomic stability. Furthermore, the negative fiscal impli-cations of such moves are very difficult to reverse or offset, especially during a downturn in the growth cycle.
It seems that policymakers in Ukraine underestimate at least two phenomena that may have an effect on the long-term sustainability of the SSN. First, the in-creased collection of revenues to finance the expanded social budget will have a strong negative effect on the tax base, even if it is done without an increase in tax rates or through taxes other than the payroll tax. Second, the steep increase in the social welfare benefits can trigger a behavioural response by the potential recipi-ents and result in a non-linear increase in expenditures for the welfare programs.

Marek Góra, Grzegorz Kula, Magdalena Rokicka, Oleksandr Rohozynsky, Anna Ruzik
CASE Network Reports No. 90 70
4.2.2. Russia As it was mentioned before, the Putin administration pushed towards the goal
of greater efficiency of social policy, while cutting overall spending (Nies and Walcher, 2002). In July 2000, the government approved the “Strategy of Russia’s Development in the years 2000-2010”, which emphasizes the need to improve the efficiency of the social insurance system. The main part of the strategy was the introduction of the Unified Social Tax (UST), which would reform the collection and distribution of financial resources allocated for social payments.
The new taxation rules reduce the level of personal income tax from 30 percent (top marginal rate) to a flat rate of 13 percent for residents and a rate of 30 percent for non-residents on income from Russian sources. The legislation came into force on 1 January 2001.
The UST consolidates several payroll taxes, simplifies the tax system, and alle-viates the tax burden on the payroll fund. The distribution of the Unified Social Tax rate of 35.6 percent was the following in 2001: 28 percent Pension Fund, 4 percent Social Insurance Fund, 3.6 percent Mandatory Health Insurance Fund (Pricewaterhouse Coopers, Global Tax Bulletin, 10.8.2000, //www.taxnews.com/).
Another important reform of social insurance in Russia in recent years covered the pension system and was introduced in parts. One of the arguments in favour of transformation of the pension system from defined benefit to defined contribution was to establish a clear link between contribution and benefits. By doing so it brings about additional incentives, in terms of higher future pensions, for indi-viduals to reveal wages. Shikalova (2004) estimated that the reform could bring about a 2-5 percent increase in tax compliance, depending on the demographic and macroeconomic scenarios.
The current system comprises a social insurance and a national and individual accounts system. The individual account covers persons born in 1967 or later.
The old-age labour pension benefit is calculated as the sum of three components: • a basic flat-rate benefit according to different categories of beneficiaries, • a benefit based on the national account, and • a benefit based on the value of the individual account (contributions plus
interest) to be paid beginning in 2013. Benefits are adjusted according to the rate of inflation and increases in the av-
erage wage.
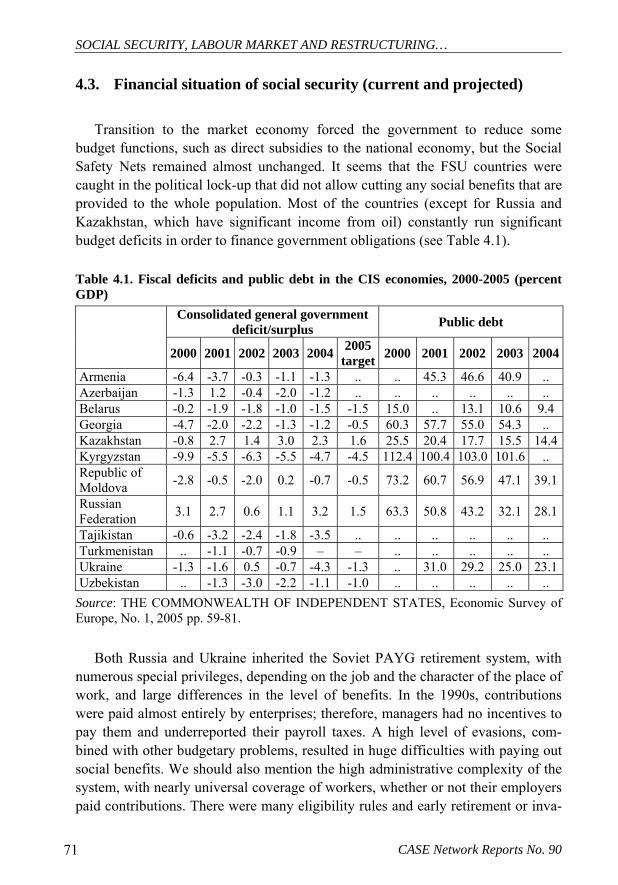
SOCIAL SECURITY, LABOUR MARKET AND RESTRUCTURING…
CASE Network Reports No. 90 71
4.3. Financial situation of social security (current and projected) Transition to the market economy forced the government to reduce some
budget functions, such as direct subsidies to the national economy, but the Social Safety Nets remained almost unchanged. It seems that the FSU countries were caught in the political lock-up that did not allow cutting any social benefits that are provided to the whole population. Most of the countries (except for Russia and Kazakhstan, which have significant income from oil) constantly run significant budget deficits in order to finance government obligations (see Table 4.1). Table 4.1. Fiscal deficits and public debt in the CIS economies, 2000-2005 (percent GDP)
Consolidated general government deficit/surplus Public debt
2000 2001 2002 2003 2004 2005
target 2000 2001 2002 2003 2004
Armenia -6.4 -3.7 -0.3 -1.1 -1.3 .. .. 45.3 46.6 40.9 .. Azerbaijan -1.3 1.2 -0.4 -2.0 -1.2 .. .. .. .. .. .. Belarus -0.2 -1.9 -1.8 -1.0 -1.5 -1.5 15.0 .. 13.1 10.6 9.4 Georgia -4.7 -2.0 -2.2 -1.3 -1.2 -0.5 60.3 57.7 55.0 54.3 .. Kazakhstan -0.8 2.7 1.4 3.0 2.3 1.6 25.5 20.4 17.7 15.5 14.4 Kyrgyzstan -9.9 -5.5 -6.3 -5.5 -4.7 -4.5 112.4 100.4 103.0 101.6 .. Republic of Moldova -2.8 -0.5 -2.0 0.2 -0.7 -0.5 73.2 60.7 56.9 47.1 39.1
Russian Federation 3.1 2.7 0.6 1.1 3.2 1.5 63.3 50.8 43.2 32.1 28.1
Tajikistan -0.6 -3.2 -2.4 -1.8 -3.5 .. .. .. .. .. .. Turkmenistan .. -1.1 -0.7 -0.9 – – .. .. .. .. .. Ukraine -1.3 -1.6 0.5 -0.7 -4.3 -1.3 .. 31.0 29.2 25.0 23.1 Uzbekistan .. -1.3 -3.0 -2.2 -1.1 -1.0 .. .. .. .. ..
Source: THE COMMONWEALTH OF INDEPENDENT STATES, Economic Survey of Europe, No. 1, 2005 pp. 59-81.
Both Russia and Ukraine inherited the Soviet PAYG retirement system, with numerous special privileges, depending on the job and the character of the place of work, and large differences in the level of benefits. In the 1990s, contributions were paid almost entirely by enterprises; therefore, managers had no incentives to pay them and underreported their payroll taxes. A high level of evasions, com-bined with other budgetary problems, resulted in huge difficulties with paying out social benefits. We should also mention the high administrative complexity of the system, with nearly universal coverage of workers, whether or not their employers paid contributions. There were many eligibility rules and early retirement or inva-

Marek Góra, Grzegorz Kula, Magdalena Rokicka, Oleksandr Rohozynsky, Anna Ruzik
CASE Network Reports No. 90 72
lidity pensions, often higher than the actual pensions, reduced the labour supply of elderly and increased the benefits the system was supposed to pay out. The retire-ment system often found this impossible in the ‘90s.
Another problem of non-payment of social benefits, which was a result of the huge difference between the required expenditures and available revenues, was partially resolved by a decrease of real amounts of the payment due to high infla-tion. Until the beginning of the 21st century, the payments were not automatically indexed with inflation, but rather revised on an irregular basis. As a result, by 2003-2004, the welfare payment became symbolic in most countries. For example, the social benefits in Russia amounted to about 6 percent of the average wage, and in Ukraine and Azerbaijan they constituted about 3-4 percent of the average wage.
In 1989, pensions constituted 8 percent of gross income. In 1992, it was just 6.9 percent of GDP and in 1996, 4.5 percent. This fall is explained by the failure of the state to pay the benefits it was due and by declining benefits due to incomplete indexation. Also, in Ukraine in the first half of the ‘90s, expenditures for social protection were decreasing. Although the pension fund remained at about the same level of 8 percent of GDP, GDP itself was falling, providing a lower basis from which the benefits had to be financed. At the same time, the number of pension recipients increased. In 1996, about 80 percent of all pensioners received old-age pensions, while 10 percent received an invalidity pension. In theory, the replace-ment rates were high, starting with 55 percent of the reference earnings for men after 25 years of work. These and other factors led to a situation where pension spending was high and over 25 percent of the population received pensions (Ri-boud and Chu, 1997).
In recent years, the situation has changed with economic recovery. In Russia, the government was able to use revenues from oil and gas to subsidize the social security system, and enterprise arrears in paying social security contributions de-creased. In Ukraine, the recovery was interrupted by political problems. The gov-ernment decided to increase pensions in 2004 and 2005 and the reasons for the rise were at least partially political and not a result of the economic situation and avail-able resources. According to the IMF (2005, p. 101): “...pension spending in 2005 will be ratcheted up by an estimated 5 percent of GDP, to about 15 percent of GDP, one of the world’s highest spending ratios. To close the resulting financial gap of the Pension Fund of Ukraine (PFU), budgetary transfers are projected to rise to about 5 percent of GDP in 2005, from about only 1½ percent of GDP in 2004…”. We should also mention that both countries recently introduced funda-mental reforms of their retirement systems but, as long as governments continue to help social security systems, it should not affect current pensioners.

SOCIAL SECURITY, LABOUR MARKET AND RESTRUCTURING…
CASE Network Reports No. 90 73
4.3.1. Ukraine Over the year, a number of changes were introduced to the legislation govern-
ing social benefits in Ukraine. These changes were intended to reduce the number of benefits, lower the cost of the programs, and change the eligibility criteria. However, reduction in the cost of the programs and targeting remain inefficient, and further reform might be needed in order to reduce the cost of the SSN.
It is possible that the current path of SSN reforms is observed because the de-velopment of the social safety net in Ukraine was not driven by the goal of reduc-ing the poverty, but by the financial constraints on the size of the system. During the existence of the USSR, the government owned enterprises and did not need an extensive tax system to collect budget revenues. The only tax known to the popu-lation at that time was personal income tax, which was a tax on wages with a pro-gressive scale from 0 to 40 percent. Transitioning to a market economy after inde-pendence, the government of Ukraine had established a tax system. The core of the system was based on a 28 percent value added tax, a 30 percent enterprise profit tax, and the above-mentioned progressive personal income tax. In order to finance new social welfare programs, the government introduced a 38 percent payroll tax to the Pension and Social Insurance Fund, a 12 percent payroll tax to the Cherno-byl fund, and a 2 percent to the unemployment fund. Although a small portion of these taxes was considered to be taxes on the employee instead of the employer, since the employer was responsible for collecting and reporting these taxes, the employer taxes on the wage fund (payroll taxes) effectively accounted to 52 percent.
Despite high taxes, the government did not manage to collect revenues suffi-cient to finance its obligations, and ran large budget deficits until 1998 (see Table A1). At the same time, the large taxes are likely to have contributed to a reduction of the tax base and an increase in the shadow economy. Because of the large infla-tion, the nominal wages of workers constantly appeared at the highest scale of the progressive personal income tax scale and were taxed at the 40 percent rate. In addition, the employers had to pay a 52 percent payroll tax, which made the cost of labour 2.5 times higher compared to paying cash to a worker off the books. Taking into account that capital gains or interest on shares were taxed at about 15 percent, one of the cheaper schemes was to employ all workers at minimum wage, pay income tax at 0 percent plus some minimum payroll taxes, and pay the work-ers cash from the pocket of the owner, who in turn received the cash as interest or through some other scheme. It was estimated that the shadow economy in 1996 was the same size as the official economy (see Kaufmann and Kaliberda, 1998) and the shadow (out of the books) employment was about 40 percent of total em-ployment in the same year.

Marek Góra, Grzegorz Kula, Magdalena Rokicka, Oleksandr Rohozynsky, Anna Ruzik
CASE Network Reports No. 90 74
Sustainability and role of the pension system The pension program is the largest social security program in Ukraine and it
was the most severely hit by the decreasing tax base. Prior to the reform in 2003, the pension system of Ukraine was a “pay-as-you-go” (PAYG) system that pro-vided pensions to current retirees by the money collected from current workers. The pension program provided old-age pensions (about 80 percent of expendi-tures), disability pensions, survival, social, and service pensions. The general old-age pensions were provided to women over 55 years old and men over 60 years old, and the special pensions were provided to workers of certain professions (miners, for example) at an earlier age depending on the number of years they worked. The standard replacement rate (the pension as the percentage of the wage) was 55 percent of an average wage before retirement, within the minimum and maximum limits.
Given macroeconomic and population trends, such a generous pension program could not be sustainable in the long run. In 1993, the pension fund ran a deficit of 1 percent of GDP or about 10 percent of pension fund expenditures and had to be taken under the supervision of the Ministry of Finance, which financed the deficit out of the state budget (general revenues). The researchers expressed concern es-pecially because the system dependency ratio (the ratio of beneficiaries to con-tributors) was gradually increasing. While there were approximately 2 workers per every pensioner in 1991, there were only 1.6 workers per pensioner in 1996, and the ratio was declining. In fact, the researchers showed that the ratio of contribu-tors to beneficiaries dropped further, reaching 1.15 contributors per pensioner (Riboud and Chu, 1997). The research carried out in 1995 by Kane from the World Bank (see Kane, 1996) showed that if the current pension system was not reformed, the constant annual deficit of the system will rise to 3 percent of GDP (or 30 percent of expenditures). The recommendations of the researcher where to increase the pension age above 65 for both males and females, and decrease the replacement ratio.
Another World Bank study by Riboud and Chu (Riboud and Chu, 1997) re-vealed that the concerns were correct. The dependence of the pension system ratio increased, and in order to maintain some balance of the pension fund, the replace-ment rate was decreased to about 1/3 of the average wage over the years since independence. It was achieved by indexations that lagged the inflation rate (de-creasing the real pensions) and by narrowing the gap between the minimum and maximum old-age wage. The authors showed that the pension system in these conditions can be sustainable only if there is moderate growth achieved for the next decade. Any attempt to increase the replacements ratio (increase pensions) will result in a pension fund deficit from 3 percent of GDP in 2000 to 7 percent of GDP in 2010. They also mentioned that the pension reform relying on the increase

SOCIAL SECURITY, LABOUR MARKET AND RESTRUCTURING…
CASE Network Reports No. 90 75
in the pension age to 65 years and a reduction of payroll taxes to 23 percent may create a pension system that is sustainable in the long run. Finally, they suggested that the introduction of a fully-funded multi-tier (mandatory and voluntary) pen-sion system can reduce the economic cost of the pension system in the long-run.
As we mentioned earlier, the pension system in Ukraine played an important role in keeping elderly population out of poverty. It is a system that provides siz-able benefits to over 30 percent of Ukrainian voters, and therefore. the government took the advice of the international community and, together with the PADCO/USAID advisory project, developed a new multi-tier pension system. The system was introduced by law in 2003 and has been operating since January 2004. The new system introduced three tiers. The first tier is the PAYG system with benefits based on careful accounting of personal contributions to the system in-stead of average wage and years worked. The pensions of the beneficiaries of the previous pension system were recalculated to the new system, and most benefits were slightly increased. The second tier is a fully-funded pension investment fund run by the government. The third tier is a system of licensed private pension funds.
The sustainability of the new pension system was based on the assumptions of: maintaining the relatively low replacement ratio of the PAYG system, expanding the tax base due to decreasing payroll tax rates, starting the second tier as soon as the capital markets legislation allows for the creation of a state investment fund, and the introduction of the third tier by 2010.
Together with the introduction of the new pension system, the Ukrainian gov-ernment took steps to ensure the expansion of the tax base. In 2003, it cut the per-sonal income tax to a flat rate of 13 percent (which is supposed to be replaced by a 15 percent flat rate in 2006), decreased payroll taxes from 52 to 37 percent plus 2 percent paid by employees, and introduced a cap on the monthly payroll tax for a single employee.
Effectiveness of other programs Another program that affects a large proportion of the population in Ukraine is
subsidies, which also includes other social privileges. By the end of the 1990s, almost 42 percent of Ukrainian households were entitled to some social privileges as a result of the entitlement of at least one household member. They included up to 50 percent discounts on housing and communal service, free phone lines, etc. About 25 percent of households also received targeted subsidies for utilities and housing prices (World Bank, 2001). From 1996-1998 the expenditures for subsi-dies, housing allowances and social privilege programs increased from 0.7 percent to about 1.7 percent of GDP. However, these expenditures were hard to finance, and in 1999 the program was financed in the amount of 1.4 percent of GDP. The cost of subsides was increasing due to the increase in energy prices and utility

Marek Góra, Grzegorz Kula, Magdalena Rokicka, Oleksandr Rohozynsky, Anna Ruzik
CASE Network Reports No. 90 76
costs, but the budget did not have the funding to finance the increased costs. The privilege and subsidy programs suffered periodic cuts of expenditures, and it was obvious that such a generous program could be sustained in the long run. Then, in 2000/2001, the government decided to strengthen the eligibility criteria for the program and to move programs to the local budgets. As a result, the amount of beneficiaries was reduced from 40 percent to about 21 percent of the population (World Bank, 2005). Accelerating growth allowed for an increase in the budget for the program in 2003, however, programs remained underfinanced in poorer re-gions, in which the local governments were unable to collect enough resources and have a larger number of beneficiaries at the same time.
Other social welfare programs, such as support for families with children and maternity benefits also suffered from an economic downturn, and expenditures on these programs decreased over the period 1996-1999 from 4.6 percent of GDP to 0.9 percent of GDP. Some programs were cancelled and the benefits for some programs decreased significantly. For example, benefits of the assistance to fami-lies with children programs were from 10 to 19 UAH a month per child (World Bank, 2001), when the average wage in the country was 126 UAH. The programs started to increase benefits when the economy began to grow in 2000-2004, how-ever these increases were primarily based on the same program design. The policy makers did not take advantage of the favourable financial situation and had not reformed the social welfare sector yet.
There is no final report yet, but the deficit of the pension fund was about 5-6 percent of GDP in 2005, and was financed from the state budget. However, overall performance of the state budget was not a disaster in 2005. The government man-aged to attract about $2bln. from the privatization of KrivorozStal, the largest steel-producing factory in Ukraine. It also managed to increased revenues from the VAT and the enterprise profit tax by eliminating tax exemptions, such as free eco-nomic zones, and prosecuting businesses that avoid paying taxes. As a result, the budget deficit in 2005 was kept under 2 percent of GDP, and the state debt was decreased.
4.3.2. Russia With 8 percent of GDP spent on retirement, disability, and numerous occupa-
tional privileges, demographic forecasts indicate that without a reform those ex-
penditures will have to increase to about 25 percent of GDP in 2050 (see Nies and Walcher, 2002).
Pension transfers in Russia support 38.5 million pensioners. The
centrally managed pension fund has been in a deepening fiscal crisis since 1995. Falling output, tax evasion, and tax offsets at the enterprise level have repeatedly

SOCIAL SECURITY, LABOUR MARKET AND RESTRUCTURING…
CASE Network Reports No. 90 77
forced the pension fund to cut or even suspend pension payments. As a result of the fiscal crisis, and despite periodic upward revisions, there has been a steady erosion of pensions vis-à-vis subsistence needs. In late 1998, pension arrears amounted to 30.5 billion roubles (about 1.1 billion US$) (Nies and Walcher, 2002).
It was estimated by the researchers at the Center of Strategic Research (Russia) that financing needs for the subsidies established by federal law in Russia ex-ceeded 15 percent of GDP in 1999. In order to improve monitoring and targeting of these social benefits, Russia monetized the in-kind benefits in 2005 (Federal Law #122). However, the monetization of the benefits triggered a strong negative social reaction and the reform of social benefits in order to reduce their cost did not begin.
4.4. Technical problems of running social security in both countries Systems are very poorly oriented towards supporting the poor. The social assis-
tance programs remain aimed at providing services or supplementary payments to certain groups of the population (the elderly, children, the disabled) and the task of reducing poverty is not a priority. Reacting to the dramatic change in the structure of expenditures, and in order to retain the Soviet-era system of special rates, the governments of the CIS countries introduced a large number of subsidies or dis-counts, often provided in-kind. For example, until 2005 Russia kept 156 types of subsidies and social payment that were directed to 236 different population groups. Almost 70 percent of the Russian population were recipients of welfare benefits (see CSR, 2000). At the end of the 1990s about 3 percent of GDP in Moldova was distributed among more than 100 different subsidies and discounts. Armenia and Ukraine had the same situation (Fox, 2003).
The unemployment insurance in the CIS countries did not play a significant role in keeping people out of poverty. At the beginning of the transformation pe-riod, most CIS countries tried to implement unemployment insurance programs similar to the programs in developed market economies. However, due to the dif-ficulties in funding the system, the unemployment benefits were rather low and the terms of applying for the unemployment payment were harsh. As a result, despite the increase in unemployment, the percentage of people registered to receive bene-fits was low, and the role of the unemployment system in reducing poverty in CIS countries was extremely low (see Ringold, 2002).
The attempt to finance an expensive social security system with taxes on em-ployees would stimulate high-ability individuals in the “traditional” economy to

Marek Góra, Grzegorz Kula, Magdalena Rokicka, Oleksandr Rohozynsky, Anna Ruzik
CASE Network Reports No. 90 78
shift to the informal economy. This might be one of the reasons why the transition to a market economy in CIS countries was characterized by a rapid growth of the informal sector, reaching 39 percent of the economy in Kyrgyzstan, 44- 45 percent in Armenia and Moldova, 50 percent in Ukraine, 60 percent in Azerbaijan and Georgia (see Djankov and Murrell, 2002). Obviously, the employees of the shadow economy were not covered by unemployment insurance. However, they qualified for other social benefits and subsidies, although they did not contribute to the system.
The expense and poor performance of the post-Soviet SSNs were recognized at the early stages of transition. In his book, Milanovic (Milanovic, 1997) suggested abolishing categorical benefits in SSNs of countries in transition and introducing Minimal Income Guarantee programs, which would provide benefits only for the people whose income is below the guaranteed income, and in an amount only suf-ficient to reach the minimal guaranteed income. Since that time, a number of means-testing programs were introduced in the CEE and CIS countries.
The problem, of the inefficient use of the available resources and, in particular, insufficient targeting of the benefits and leakage from the system, remains today despite the steps taken by the Ukrainian government in 2002 -2004. The govern-ment consolidated benefits of the “Support to families with children program” and introduced an income filter for the recipients. As a result, the share of the program benefits received by 40 percent of families was reduced by 5 percent between 1999 and 2003 (see World Bank, 2005). Joint research of the World Bank and the MLSP in 2005 found that the most successful program in targeting was the “Tar-geted Social Assistance to Low Income Families” program. It provided one of the largest benefits, and more than 50 percent of these benefits reached the poorest 20 percent of the population (World Bank, 2005). However, this is the smallest social security program. The extension of this means-tested program depends on the availability of monitoring and accounting system, but the government of Ukraine, together with the World Bank, are actively developing a computer network at the social welfare offices that is aimed at removing this obstacle to the program devel-opment in the nearest future. As a result, there will be an opportunity to make the social welfare system in Ukraine more efficient and fiscally sustainable by moving funds from non-targeted programs to this means-tested program.
The mean-tested programs are hoped to significantly reduce the cost of the SSN by cutting benefits to the population that is not in deep poverty. International experience suggests that the programs based on Verified Means Testing (VMT), such as those used in the USA, are very precise in targeting the poor, but ex-tremely costly to implement. Less expensive are Unverified Means Testing (UMT) programs, which do not require expensive verification of submitted information. They are proven to be less effective in targeting poor than VMT, but more effec-
SOCIAL SECURITY, LABOUR MARKET AND RESTRUCTURING…
CASE Network Reports No. 90 79
tive than categorical benefits. Another inexpensive approach, based on the asser-tion of income from social characteristics, is called Proxy Means Testing (PMT). This approach was successfully used in Chile, Colombia, Costa Rica and Mexico and provides targeting comparable with VMT programs (Tarsicio et al., 2005). The governments of the CIS countries, with the support of international organiza-tions like the World Bank, were implementing such systems at the national level. The pilot projects of the means-tested social programs proved to be successful at targeting the poor, but to the extent it was applied to projects was negligible. For example, in 2000, Romania provided only 1 percent of total social assistance through mean-tested programs (Fox, 2003).
However, the ability of these programs to substantially reduce poverty at the national level is questionable. By design, the means-tested programs are supposed to provide relatively large benefits to people with a low ability to generate income. However, the number of people who could change their behaviour in order to re-ceive the large social benefits (high-ability workers in a “traditional” economy in the model) should be large, and even means-tested programs with huge benefits will be very expensive as a result of the large leakage from the system.
Another explanation is that any means-testing welfare program requires exten-sive monitoring and constantly updating a system of social indicators. Such sys-tems were not present in the CIS countries in the past and are under development now. The only successful targeted programs in the CIS countries were programs implementing PMT-type targeting, such as the support to families with children (Fox, 2003).
Taxation One aspect of the social safety net we have so far not considered is the tax sys-
tem, in particular personal income tax (PIT). PIT was introduced after the fall of communism and was quite complicated, with a progressive rate structure: three brackets in Russia, more in Ukraine. There were also many exemptions and deduc-tions (Stepanyan, 2003). According to economic theory, such a system can influ-ence labour supply, motivating people to take advantage of the possibilities to lower their taxes, or reducing their labour supply to avoid passing into higher brackets. However, these effects, always difficult to verify, should not have much influence on labour supply in Russia and Ukraine, because of low compliance rates in both countries (income from PIT provided on average 2.5 percent of GDP).
The reform in 2001 in Russia and the reform in 2004 in Ukraine introduced a flat rate personal income tax in both countries. In other accompanying changes in Russia, all the social insurance contributions were merged into the so-called “uni-fied social tax”. It is a much simpler system than the former progressive tax, with a

Marek Góra, Grzegorz Kula, Magdalena Rokicka, Oleksandr Rohozynsky, Anna Ruzik
CASE Network Reports No. 90 80
single rate of 13 percent in both countries and a smaller number of exemptions and deductions. With a simplification of the system, its influence on the labour supply should decrease, in particular the negative effect of multiple tax brackets should disappear. Unfortunately, we are not able to verify such a claim. The only thing we know is that revenues from PIT increased: in Russia after a year by about 26 per-cent in real terms (Ivanova et al., 2005). This is a very good result, although it is difficult to tell if the increase in compliance resulted from the introduction of a flat rate tax or from changes in tax enforcement and strengthening of the tax admini-stration.
What is interesting is the way in which the compliance increased. All the evi-dence shows that people began reporting illegal income or income from the shadow economy. However, since there was neither a substantial increase in em-ployment nor a sharp fall in unemployment rates, we can suspect that people now report their additional incomes from second jobs and occasional activities. Possi-bly it may be a result of strengthening of the tax administration: people who were already paying taxes from their main jobs decided it is safer to pay them from all incomes, while those who were avoiding taxes continued to do so. Such a supposi-tion is partially confirmed by much poorer results of the reform in Ukraine: taxes were also lowered, but the political turmoil following the reform did not help the tax administration. Still, we must remember that we have no way to verify these hypotheses.
After tax reforms, although the number of tax privileges decreased, it is still quite substantial, with deductions for war veterans, heroes of the Soviet Union, parents, invalids, etc. There are also deductions for health and educational expen-ditures, buying new apartments, and charity donations. The complete lists are quite long in both countries, but the Russian list is longer. Nevertheless, the deductions are not very big. The maximum personal deduction in Russia40 (the size of per-sonal deduction depends on earnings) is equal to 4,800 rubles, while the average yearly wage was 81,984 rubles. Deductions for each child are the same as the per-sonal deduction. Such tax privileges form a part of the social safety net, helping families with children, or people who are ill or studying, but the size of the deduc-tions does not seem likely to affect the labour supply of population.
A detailed analysis of the impact of taxation on labour supply and its realloca-tion goes beyond the scope of this paper. A more in-depth analysis is presented in Discussion Paper 3 belonging to the same Working Package 8.
40 All the information about the amounts of deductions and average wages are from 2005. The details on the tax systems are from Kula (2005).

SOCIAL SECURITY, LABOUR MARKET AND RESTRUCTURING…
CASE Network Reports No. 90 81
5. Concluding Remarks
This paper discusses selected demographic, economic and social phenomena in Russia and Ukraine since the beginning of the 1990s, and their impact on social security systems. The paper also analyses selected projections and their impact on the prospects of the countries. One of the aims of this paper was to provide a background for the set of the papers in Work Package 8 on “Restructuring and Social Safety Nets in Russia and Ukraine”. Deeper research results are presented in the following papers of the WP8t. A unique feature of this paper is the discus-sion of gender issues in labour markets and social security programs in these coun-tries in more detail than in other papers of the set.
The demographic situation and the labour supply in Russia and Ukraine were strongly affected by the transition processes. The most important problem is the decreasing size of the population due to low birth rates and short life expectancy, especially among men. Although men are dying relatively young, the share of the elderly in the population is growing, and the aging processes are faster than in the European Union. The number of pensioners is also increasing. In such conditions, social security contributions are not sufficient to finance the benefits, despite that contribution avoidance is decreasing.
In Ukraine, the situation is more difficult than in Russia. In the former there are proportionally more pensioners and the level of benefits was significantly in-creased in recent years, at least partially due to political reasons.
In Russia, the proportion of pensioners is smaller, benefits are lower, and the government can use incomes from oil and gas to finance the social security sys-tem. The situation in both countries forced governments to introduce radical re-forms of retirement systems by switching from pay-as-you-go to funded schemes. However, these reforms have no impact on the current situation.
The very low life expectancy in both countries was caused by a number of fac-tors. The authors have not attempted to go deeper into their characteristics. How-ever, the very low male longevity cannot be assumed as a natural state of demog-raphy. This phenomenon will disappear sooner or later. Then, without a substantial increase in birth rates or migrations, the pace of ageing of both the Russian and Ukrainian population will become particularly strong, which – being the best pos-sible development (increasing longevity) – will create an additional burden on workers. Consequently, labour supply may decrease in comparison to the situation

Marek Góra, Grzegorz Kula, Magdalena Rokicka, Oleksandr Rohozynsky, Anna Ruzik
CASE Network Reports No. 90 82
without that great development of longevity. Labour supply may also ill adjust to that situation. Thus, the countries should prepare their methods of financing social safety nets to this situation that may come sooner than expected.
Despite a falling population and aging problem, the size of the economically active population is stable in Ukraine and increasing in Russia, and activity rates are high. This is the result of increased activity of the young and the elderly, caused by high poverty levels and inefficiencies of social safety nets. Many people work in informal sectors, often helping their families by cultivating small plots of land and producing goods for their own consumption and for sale. Unemployment is low, partially due to the economic recovery of recent years, partially to labour hoarding of enterprises. Workers are willing to stay officially employed, with lower wages, shorter working hours or on forced leave, because it offers them a sense of security and gives some income, social benefits and time to work at a second job. Nevertheless, with growing economies, conditions are improving, unemployment is falling, the share of payments in kind is decreasing and, at least in Russia, there are very low wage arrears.
The specific demographic situation, with an extremely high mortality rate among men, results in an increasing number of old women – one of the groups most at risk of falling into poverty. Feminization of poverty has become another gender specific issue which should be analyzed more carefully. Although in the 21 members of the EU-27 the at-risk-of-poverty rate is also higher for women than men, in none of these countries have such dramatic demographic changes been observed.41
Gender specific issues related to participation in social security in Ukraine and Russia arose mainly from inequalities in the labour market. The activity of women is falling as their compensation for work is low, on average 30 percent lower than that for men; women's long-term unemployment is also much worse than men's unemployment. In comparison, the EU-27 pay gap between women and men was estimated at 15% in 2005, and in contrast to Ukraine and Russia, the female em-ployment rate was increasing. Remarkable is that in Lithuania, a country with a historical past similar to that of Ukraine, the pay gap decreased from 27 percent in 1995 to 15 percent in 200542.
41 Gender inequalities in the risks of poverty and social exclusion for disadvantaged groups in thirty European countries, EC DG Employment, Brussels 2006 42 Communication From The Commission to The Council, The European Parliament, The European Economic and Social Committee and The Committee of The Regions, Tackling The Pay Gap Between Women And Men, Brussels 2007

SOCIAL SECURITY, LABOUR MARKET AND RESTRUCTURING…
CASE Network Reports No. 90 83
Furthermore, specific occupational segregation in Russia and Ukraine make it difficult for women to benefit equally from the transition and shift into the more rewarding private sector. Women are also less present in managerial positions, which increase their wage gap. However, this could also be explained by their preferences for spending more time taking care of family members. It should be stated that this tendency is also observable in EU-27 countries, especially in New Member States such as Cyprus, Estonia, and Slovakia, where the labour market is highly segregated.
Gender issues are not only related to women. In regards to pension reform – the disadvantages for men in the set retirement age were maintained both in Ukraine and Russia, where, in both countries, men are obliged to work 5 years longer than women to obtain the pension.
To summarize, the picture emerging from the analysis above shows an improv-ing situation in both countries, although conditions in Russia are better than in Ukraine. Positive developments in Ukraine were slowed by the political turmoil of recent years. Still, much remains to be done. The increase in the economically active population is a good thing, but there are no reserves out of which this active population may continue to grow. The retirement reforms are a step in the right direction, although their impact will not be felt for a number of years. Other re-forms, with more immediate results, are necessary. Social safety nets should be made more efficient and social benefits should be higher and better targeted, if possible. The differences between registered and actual unemployment prove that changes in unemployment laws and unemployment assistance are needed. The whole system of social protection should be less complex and more transparent. First, something must be done to stop the reduction in these countries’ populations and to increase the number of children.
Some uncertainty about the future situation is linked to the oil prices that will influence both countries, though possibly in different directions. The World Bank (2007) presents simulations of the direct influence of an increase in energy prices on the poverty rate in Ukraine. Using 2005 as a base period, the simulations esti-mate the poverty rates that might result from alternative increases in the price of energy. In this simple model, the main determinant of the impact of the increase in energy prices on poverty is the share of energy in total household expenditures. An increase in energy prices will harm the poor slightly more than the rich because the poor have a slightly higher share of energy in their expenditures.

Marek Góra, Grzegorz Kula, Magdalena Rokicka, Oleksandr Rohozynsky, Anna Ruzik
CASE Network Reports No. 90 84
References
Abedini, J. and N. Péridy, 2008, The Greater Arab Free Trade Area (GAFTA): an Estimation of Its Trade Effects, Journal of Economic Integration 23(4), De-cember 2008; 848-872.
Alam A., M. Murthi, R. Yemtsov, E. Murrugarra, N. Dudwick, E. Hamilton, and E. Tiongson (2005), Growth, Poverty, and Inequality. Eastern Europe and the Former Soviet Union, The World Bank.
Boeri, T., K. Terrell (2002), “Institutional Determinants of Labour Reallocation in Transition”, The Journal of Economic Perspectives, Vol. 16, No. 1., pp. 51-76.
Brainerd E., (1998) Winners and Losers in Russia's Economic Transition, The American Economic Review, Vol. 88, No. 5. (Dec., 1998), pp. 1094-1116.
Brainerd E., (2000) Women in Transition: Changes in Gender Wage Differentials in Eastern Europe and the Former Soviet Union, Industrial and Labor Relations Review, Vol. 54, No. 1. (Oct., 2000), pp. 138-162.
Brainerd, E., D.M. Cutler (2004), “Autopsy on an Empire: Understanding Mortal-ity in Russia and the Former Soviet Union”, NBER Working Paper 10868.
Cangiano, M., C. Cottarelli, L. Cubeddu (1998), “Pension Developments and Re-forms in Transition Economies”, IMF Working Paper, WP/98/151.
Commander, S., A. Tolstopiatenko (1996), Why is Unemployment Low in the Former Soviet Union? Enterprise Restructuring and the Structure of Compen-sation, Policy Research Working Paper 1617, World Bank.
Commander, S., I. Dolinskaya, C. Mumssen (2000), “Determinants of Barter in Russia: An Empirical Analysis”, IMF Working Paper, WP/00/155.
Commander, S., R. Yemtsov (1995), “Russian unemployment: its magnitude, characteristics and regional dimensions”, Policy Research Working Paper 1426, World Bank.
CSR (2000): "Osnovnye Napravleniya Sotsial’no-Ekonomicheskoi Politiki Pravitel’stva Rossiiskoi Federatsii Na Dolgosrochnuyu Perspektivu ", Center of Strategic Research, http://www.csr.ru/about-publications/plan2010.html.

SOCIAL SECURITY, LABOUR MARKET AND RESTRUCTURING…
CASE Network Reports No. 90 85
Denisova I., (2007) Entry to and Exit from Poverty in Russia: Evidence from Lon-gitudinal Data, CEFIR Working Paper No 98, March 2007.
Denisova I., Gorban M., Yudaeva K., (2000) Social Policy in Russia: Pension Fund and Social Security, The European Commission 2000.
Djankov, S., Murrell, P. (2002): "Enterprise Restructuring Transition: A Quantita-tive Survey", Discussion Paper, Centre for Economic Policy Research (CEPR).
Dobronogov, A.V. (1998), Systems Analysis of Social Security in a Transition Economy: The Ukrainian case, International Institute for Applied Systems Analysis, IR-98-73/November.
Engendering development (2001), World Bank, Research Policy Report no.21776.
Fajth G. (1999): Social Security in a Rapidly Changing Environment: The Case of the Post-communist Transformation. Social Policy & Administration 33 (4), 416–436.
Fornero E., Ferraresi P., (2007) Pension Reform and the Development of Pension Systems: An Evaluation of World Bank Assistance, World Bank 2007.
Fox, L. (2003): "Safety Nets in Transition Economies: A Primer ", The World Bank Social Protection Discussion Paper Series 0306, World Bank.
Fultz E., (2006) The Gender Dimensions of Social Security Reform, Volume 2 , Case Studies of Romania and Slovenia, Budapest, International Labour Office, 2006.
Fultz E., Steinhilber S., (2003) Chapter 1: The Gender Dimensions of Social Secu-rity Reform in the, Czech Republic, Hungary, and Poland, Budapest: ILO, 2003.
Gender And Economics Workshop For CIS Countries - Workshop Report (2005), Economic Policy and Gender Initiative, November 29-30, 2005 In Moscow, Russia.
Gender Issues in Ukraine Challenges and Opportunities (2003),UNDP Kyiv 2003.
Goralska H., (2000) Funding of Social Benefits and the Social Service System in Ukraine, Eastern European Economics, vol.38 no. 2, March –April 2000, pp. 24-46.
Haaparanta, P., T. Juurikkala, O. Lazareva, J. Pirttilä, L. Solanko, E. Zhuravskaya (2003), “Firms and public service provision in Russia”, BOFIT Discussion Pa-pers 16/2003.

Marek Góra, Grzegorz Kula, Magdalena Rokicka, Oleksandr Rohozynsky, Anna Ruzik
CASE Network Reports No. 90 86
IMF (1999a), “Russian Federation: Recent Economic Developments”, IMF Staff Country Report No. 99/100.
IMF (1999b), “Ukraine: Recent Economic Developments”, IMF Staff Country Report No. 99/42.
IMF (2004), “Russian Federation: Selected Issues”, IMF Country Report No. 04/316.
IMF (2005), “Ukraine: Selected Issues”, IMF Country Report No. 05/416.
IMF (2006a), “Russian Federation: 2006 Article IV Consultation—Staff Report; Staff Statement; and Public Information Notice on the Executive Board Discus-sion”, IMF Country Report No. 06/429.
IMF (2006b), “Russian Federation: Selected Issues”, IMF Country Report No. 06/430.
International Experience with Social Assistance Schemes, Five Country Case Studies, (2004) Moscow, 2004, ILO, 2004.
Ivanova, A., M. Keen, A. Klemm (2005), “The Russian Flat Tax Reform”, IMF Working Paper, WP/05/16.
Jensen R.T., K. Richter (2000), Social Security, Income Volatility and Health Evi-dence From the Russian Pension Crisis, STICERD/London School of Econom-ics.
Kane, C. T. (1996): "Ukraine: Reforming the Pension System", PSP Discussion Paper #17365, World Bank.
Kapstein, E.B., B. Milanovic (2000), “Dividing the Spoils: Pensions, Privatization, and Reform in Russia's Transition”, Policy Research Working Paper 2292, World Bank.
Kaufmann, D., Kaliberda, A. (1998): "Integrating the Unofficial into the Dynam-ics of Post-Socialist Economies" in Economic Transition in the Newly Inde-pendent States, ed. by B. K. (ed). Armonk, NY: M.E. Sharpe Press.
Kazakov E.A. (1997), Changes in the Standard of Living, Connected with Aging and Retirement: Comparative Perspective (USA, Germany, Russia), LIS Work-ing Paper No. 162.
Koumakhov, R., B. Najman (2001), “Labor Hoarding In Russia: Where Does It Come From?”, William Davidson Working Paper Number 394.

SOCIAL SECURITY, LABOUR MARKET AND RESTRUCTURING…
CASE Network Reports No. 90 87
Kula, G. (2005), “Podatek liniowy w praktyce” (The flat-rate tax in practice), Go-spodarka Narodowa, Nr 11-12/2005.
Kulachek O., (2000) The Gender Causes In Ukraine Within Transformation Pe-riod, NISPAcee 2000, Budapest, April.
Kupets, O. (2005), “Determinants of unemployment duration in Ukraine”, Work-ing Paper Series No 05/01, Economics Education and Research Consortium.
Lehmann, H. (1995), “Active Labor Market Policies in the OECD and in the Se-lected Transition Economies”, Policy Research Working Paper 1502, World Bank.
Linz S., Semykina A., (2005), Gender Differences in Personality and Earnings: Evidence from Russia, William Davidson Institute Working Paper, No 791, April 2005.
Lokshin, M. (2004), “Household Childcare Choices and Women's Work Behavior in Russia”, The Journal of Human Resources, Vol. 39, No. 4., pp. 1094-1115.
Luckhaus L., (2000) Equal Treatment, Social Protection and Income Security for Women, International Labour Review , Vol, 139 (2000), No.2.
Making the Transition Work for Women in Europe and Central Asia (1999), World Bank Discussion Paper No. 411, (1999).
Maltseva I., (2005) Gender Differences in Occupational Mobility and Segregation at the Labor Market, The Case of Russian Economy, Moscow: EERC, 2005.
Marin, D., D. Kaufmann, B. Gorochowskij (2000), “Barter in Transition Econo-mies: Competing Explanations Confront Ukrainian Data”, Discussion paper 2000-6, Department of Economics, University of Munich.
Melota, I., Gregory, P. (2001): "New Insights into Ukrainian Shadow Economy: Has It Already Been Counted?" Institute for Economic Research and Policy Consulting, http://www.ier.kiev.ua/.
Mikhalev V., (1996) Social security in Russia under economic transformation, January 1996. http://findarticles.com/p/articles/mi_m3955/is_n1_v48/ai_18105612/pg_1.
Milanovic, B. (1992), “Distributional Impact of Cash and In Kind Social Transfers in Eastern Europe and Russia”, Policy Research Working Paper 1054, World Bank.
Milanovic, B. (1997): Income, Inequality, and Poverty During the Transition from Planned to Market Economy. World Bank.

Marek Góra, Grzegorz Kula, Magdalena Rokicka, Oleksandr Rohozynsky, Anna Ruzik
CASE Network Reports No. 90 88
Mitra, P., R. Yemtsov (2006), “Increasing Inequality in Transition Economies: Is There More to Come?”, Policy Research Working Paper 4007, World Bank.
MLSP, PFU (2005): "Zagal’noobov’zzkove Derzavne Social’ne Strahuvan’a Ta Pensiyne Zabeppechenya U Chifrah Ta Factah V 2006, (“Mandatory State So-cial Insurance and Pension in Figures and Facts in 2006”)".
Nailis, D. (2001) Gender Plan of Action, USAID Regional Mission for Ukraine, Belarus, and Moldova, Development Alternatives, Inc., April 2001.
Nies S., G. Walcher (2002): The unified social tax and its impact on social policy in Putin’s Russia, Working papers No. 34of the Research Centre for Eastern European Studies, Bremen.
Ogloblin C., G., (1999) The Gender Earnings Differential in the Russian Transi-tion Economy, Industrial and Labor Relations Review, Vol. 52, No. 4. (Jul., 1999), pp. 602-627.
Ostanin D., (2001) Social Security System Reform: Risk Sharing Properties. The Case Of Ukraine, National University “Kyiv-Mohyla Academy”, 2001.
Owen, D.E., D.O. Robinson (2003), Russia Rebounds, IMF.
Paci, P., (2002) Gender in Transition, World Bank.
Poverty in Ukraine (1996), World Bank Report No. 15602-UA, June 1996.
Rashid, Mansoora, and Jan Rutkowski. 2001. “Labor Markets in Transition Economies: Recent Developments and Future Challenges.” World Bank Social Protection Discussion Paper No. 0111. Washington, D.C.
Riboud, M., H. Chu (1997), “Pension Reform, Growth, and the Labor Market in Ukraine”, Policy Research Working Paper 1731, World Bank.
Rimashevskaia N., (2003) Strategies of Social Reform in Russia, Russian Politics and Law, vol. 41, July-August 2003, pp.5-17.
Ringold, D. (2002): "Bednost’ V Stranakh Tsve I Srednei Azii," Quarterly publi-cation of the Local Government and Public Service Reform Initiative, http://lgi.osi.hu/publications/2002/103/ru/summer2002ru_page0.html.
Ruminska-Zimny E., (2002) Gender Aspects of Changes In The Labour Markets in Transition Economies, UNECE ISSUE PAPER, May 2002.
Russian Statistical Yearbooks, Moscow, Russia: State Statistical Agency (GosComStat).
Shikalova M. (2004), Effect of pension reform on tax evasion: Russian case.

SOCIAL SECURITY, LABOUR MARKET AND RESTRUCTURING…
CASE Network Reports No. 90 89
Social security: Issues, challenges and prospects (2001), International Labour Of-fice, Geneva, June 2001.
SSPTW: Europe, (2006).
Statistical Yearbooks of Ukraine, State Committee for Statistics of Ukraine.
Steinhilber S., (2004) Gender dimensions of social security reforms in transition economies, Background Paper VI, Regional Symposium on Mainstreaming Gender into Economic Policies, 28-30 January 2004, Palais des Nations, Ge-neva.
Stepanyan, V. (2003), “Reforming Tax Systems: Experience of the Baltics, Russia and Other Countries of the Former Soviet Union”, IMF Working Paper, WP/03/173.
Tarsicio C., K. Lindert, with B. De la Brière, L. Fernandez, C. Hubert, O. Lar-rañaga, M. Orozco, R. Viquez (2005): "Designing and Implementing House-hold Targeting Systems: Lessons from Latin American and the United States", Discussion paper, World Bank.
The Gender Dimensions of Social Security Reform in the Czech Republic, Hun-gary, and Poland, (2004) A Seminar Sponsored by the Czech Ministry of La-bour and Social Affairs and the International Labour Organization, Ministry of Health, Prague, 29-30 April 2004.
Ukraine: Poverty Assessment, Poverty And Inequality in a Growing Economy, (2005) World Bank Report No. 34631-UA, December 2005.
Ukrainian Centre for Social Reforms (2006): Report within the Project „Пенсійна реформа та розвиток системи соціального страхування в Україні”.
UNECE (2005): "The Commonwealth of Independent States," Economic Survey of Europe, Vol.:1, 59-81.
Women and Employment in Central and Eastern Europe and the Western CIS, UNIFEM 2006.
Working Towards a Poverty Eradication Strategy in Russia: Analysis and Rec-ommendations, (2001) United Nations Theme Group on Poverty ILO Moscow Office, Moscow 2001.
World Bank (2000): "Making Transition Work for Everyone: Poverty and Inequal-ity in Europe and Central Asia," The World Bank.
World Bank (2001): "Ukraine: Social Safety Nets and Poverty Vol. 1", Report # 22677, The World Bank.

Marek Góra, Grzegorz Kula, Magdalena Rokicka, Oleksandr Rohozynsky, Anna Ruzik
CASE Network Reports No. 90 90
World Bank (2005a): "Ukraine: Poverty Assessment, Poverty and Inequality in a Growing Economy", Report No 34631-UA, The World Bank.
World Bank (2005b): “Russian Federation Reducing Poverty through Growth and Social Policy Reform”, Report No. 28923-RU, The World Bank.
World Bank (2007): UKRAINE: Poverty Update, Report No. 39887 – UA.
Zhurzhenko T.(1998) Ukrainian Women in the Transitional Economy, Labour Focus on Eastern Europe, No. 60, 1998.

SOCIAL SECURITY, LABOUR MARKET AND RESTRUCTURING…
CASE Network Reports No. 90 91
Annex 1. Tables and figures
Table A.1. Economic indicators for Ukraine Consolidated budget as percent of
GDP* Year Real GDP (1990=100)
Real GDP growth Revenues Expenditures Deficit
Pension fund ex-
penditures 1991 91.3 -8.7% 9.5% 1992 82.3 -9.9% 24.4% 38.1% -13.7% 7.9% 1993 70.6 -14.2% 33.5% 38.6% -5.1% 8.3% 1994 54.4 -22.9% 43.5% 52.4% -8.9% 7.4% 1995 47.8 -12.2% 38.0% 44.6% -6.6% 7.9% 1996 43.0 -10.0% 37.0% 41.9% -4.9% 9.3% 1997 41.7 -3.0% 30.1% 36.7% -6.6% 10.2% 1998 40.9 -1.9% 28.2% 30.4% -2.2% 9.3% 1999 40.8 -0.2% 25.2% 26.7% -1.5% 9.5% 2000 43.2 5.9% 28.9% 28.3% 0.6% 8.4% 2001 47.2 9.2% 26.9% 27.2% -0.3% 8.8% 2002 49.7 5.2% 27.4% 26.7% 0.7% 10.1% 2003 54.4 9.6% 28.2% 28.4% -0.2% 9.1% 2004 61.0 12.1% 26.5% 29.7% -3.2% 11.4% 2005 62.6 2.6% 31.6% 33.4% -1.8% 14.6%
* Note that the Ukrainian official figures are different from reported in World Bank data-bases due to the difference in methodologies. Source: Committee for Statistics of Ukraine, www.ukrstat.gov.ua, Bulletins of the Pension Fund, www.pension.kiev.ua. Table A. 2. Summary of current social welfare programs in Ukraine
Program name Eligibility
Number of recipients
in 2005
Expen-ditures in 2005
Changes in 2005
Changes in 2006
Pension
Old-age: women over 55 and men over 60, special pensions for lower ages disable, survivors
13.4 mln. 61,107 mln. UAH
Minimum pension in-creased 3.6 times Average pension in-creased 73%
Minimum pension in-creased 8% Average pension in-creased 29%
Unemploy-ment Unemployed 2.9 mln.
2,525.7 mln. UAH
Min benefits increased 25%
Minimal benefit in-creased 28%

Marek Góra, Grzegorz Kula, Magdalena Rokicka, Oleksandr Rohozynsky, Anna Ruzik
CASE Network Reports No. 90 92
Program name Eligibility
Number of recipients
in 2005
Expen-ditures in 2005
Changes in 2005
Changes in 2006
Temporary disability insurance
Temporary dis-abled, carrying about seek child, on maternity leave to care about child up to 3 years old, giving birth, fu-neral costs for workers, health-care-related vaca-tions
around 6 mln. people a year
5.1mln UAH
Funeral cost reimburse-ment in-creased to 1000 UAH One-time birth support increased 10 times
Funeral ex-penses in-creased 20% Minimal support for carrying for seek child increased 10%
Support to families with children
Single parents if per-capita monthly family income is lower than 50% of minimum subsis-tence level during the last 6 months
around 1.5 mln. fami-lies
14.1 bln. UAH
Benefits increased about 3 times
Benefit in-creased around 28%
Support to low-income families
Families living under the minimal subsistence level who do not pos-sess second apartment, car, and did not make large purchases over the last 12 months
2.8 mln. families
11 bln. UAH
Benefit in-creased around 28%
Benefit in-creased around 30%

SOCIAL SECURITY, LABOUR MARKET AND RESTRUCTURING…
CASE Network Reports No. 90 93
Figure 1. Effectiveness of Social Insurance and Assistance programs in Ukraine
Source: “UKRAINE POVERTY ASSESSMENT: Poverty and Inequality in a Growing Economy”, The World Bank report # 34631-UA.

Marek Góra, Grzegorz Kula, Magdalena Rokicka, Oleksandr Rohozynsky, Anna Ruzik
CASE Network Reports No. 90 94
Annex 2. Results of Models Estimations
Variable definitions
Variable name Definition in case of Russian data
Definition in case of Ukrainian data
EDUCATIONAL VARIABLE- dummy variables GENSEC General secondary school General secondary school SPECSEC Specialized secondary school Specialized secondary school
COL College institute, university, academy ,
College institute, university, academy ,
EXPER Potential experience , computed as age - 15-years of schooling after 15 years
Potential experience , com-puted as age - 15-years of schooling after 15 years
EXPER2 Square of experience Square of experience SECTOR VARIABLES43 – dummy variables
AGRIC Agriculture - EXTRACTIND Extracting industry - IND - Industry CONSTR Construction Construction BUS Business and repair service -
TRADE - Sale, maintenance and repair of mot Trade
TRANSP - Transport, post and telecom-munication
UTIL - Utility
HEALTH_EDU - Education, health, and social protection
HEALTH Health care - EDUC Education -
PUBADM Public administration Public administration and de-fense
FINANCE Financial intermediation, real estate
Financial intermediation, real estate
GOVOWN State sector - PRIVOWN Private sector -
43 Sectoral divisions are slightly different for both countries , as the different sector struc-ture was used in the survey.

SOCIAL SECURITY, LABOUR MARKET AND RESTRUCTURING…
CASE Network Reports No. 90 95
Variable name Definition in case of Russian data
Definition in case of Ukrainian data
SLFOWN Respondent own more than 5% - OCCUPATION VARIABLES- dummy variables44
MGR Legislators, senior officials and managers
Legislators, senior officials and managers
PROF Professionals Professionals CLER Clerks Clerks
SERV Service workers and shop and market sales workers
Service workers and shop and market sales workers
CRAFT Craft and related trades work-ers
Craft and related trades work-ers
PLANT Plant and machine operators and assemblers
Plant and machine operators and assemblers
ELEM Elementary occupations Elementary occupations REGIONAL VARIABLES KIEV - City of Kiev EAST - East part of Ukraine SOUTH PART - South part of Ukraine EURRUSURB European urban area of Russia MOSCOW City of Moscow - NORTHREGS Northern regions of Russia - SIBERURB Urban area in Siberia - STPETER St. Petersburg city - URALURB Ural, urban area - VOLGAURB Volga region, urban area -
Note. To avoid the linearity of dummy in each category we omitted certain category, for example in education the elementary education, in sectoral analysis we drop armed forces, agriculture, and business in case of Ukraine and utility, trade and transport in case of Russia. In occupation we omitted elementary occupation in Russia and armed forces and agriculture in Ukraine. As for the regional dummy in Ukraine the Central and West part of Ukraine was omitted, while in Russian regressions all regions except listed in the above table.
Log gender regression results (Russia, 2005) POOLED Source SS df MS Number of obs 3767 F( 30, 3736) 33.99 Model 587.671257 30 19.5890419 Prob > F 0.0000 Residual 2152.90386 3736 .576259063 R-squared 0.2144 Adj R-squared 0.2081 Total 2740.57511 3766 .727715113 Root MSE .75912 44 According to ISCO 88.

Marek Góra, Grzegorz Kula, Magdalena Rokicka, Oleksandr Rohozynsky, Anna Ruzik
CASE Network Reports No. 90 96
MEN Source SS df MS Number of obs 1795 F( 30, 1764) 12.39 Model 212.718869 30 7.09062897 Prob > F 0.0000 Residual 1009.69568 1764 .572389844 R-squared 0.1740 Adj R-squared 0.1600 Total 1222.41455 1794 .681390498 Root MSE .75656 FEMALE Source SS df MS Number of obs 1972 F( 30, 1941) 21.97 Model 338.145388 30 11.2715129 Prob > F 0.0000 Residual 995.804287 1941 .513036727 R-squared 0.2535 Adj R-squared 0.2420 Total 1333.94968 1971 .676788267 Root MSE .71627
POOLED MEN FEMALE lny Coef. P>t Coef. P>t Coef. P>t GENSECSCH .088405 0.116 .0970442 0.154 .1515542 0.113 SPECSECSCH .1934967 0.001 .1990884 0.007 .3300111 0.001 COL .5554875 0.000 .4154096 0.000 .690696 0.000 EXPER .0156139 0.000 .0158851 0.009 .0227016 0.000 EXPER2 -.038693 0.001 -.0438464 0.004 -.0465931 0.004 EXTRACTIND .0048626 0.955 .1185415 0.355 .0852711 0.447 AGRIC -.2066214 0.070 -.3256208 0.026 -.077736 0.653 EDUCAT -.3070516 0.000 -.3856776 0.004 -.1909757 0.002 HEALTH -.1424283 0.013 -.247302 0.052 -.0087358 0.889 BUS -.0439105 0.430 .0682072 0.641 .0901809 0.133 FINANCE .1473941 0.040 .1268914 0.275 .0797698 0.361 CONSTR .1068298 0.062 -.0071672 0.909 .1655075 0.239 GOVOWN -.1474403 0.000 -.092707 0.014 -.190544 0.000 PRIVOWN .2377878 0.000 .2172741 0.007 .2344344 0.008 SLFOWN .1487973 0.019 .1637997 0.060 .1181096 0.186 MGR .4418445 0.000 .3884272 0.000 .5039962 0.000 PROF .2583111 0.000 .2628473 0.004 .3703851 0.000 TECH .1481118 0.006 .3938957 0.000 .1650457 0.024 CLER -.0052925 0.933 -.0206834 0.898 .2241349 0.003 SERV .0843129 0.124 .1696929 0.069 .2364116 0.001 CRAFT .399789 0.000 .2832682 0.000 .3900856 0.000 PLANT .4148518 0.000 .2844536 0.000 .322997 0.000 EURRUSURB .1537901 0.000 .2023838 0.000 .1184153 0.020 MOSCOW .6956832 0.000 .6314284 0.000 .7275743 0.000 NORTHREGS .450458 0.000 .573734 0.000 .3491648 0.000 SIBERURB .2694458 0.000 .2543327 0.000 .2929322 0.000 STPETER .6218472 0.000 .6688107 0.000 .5651763 0.000

SOCIAL SECURITY, LABOUR MARKET AND RESTRUCTURING…
CASE Network Reports No. 90 97
POOLED MEN FEMALE lny Coef. P>t Coef. P>t Coef. P>t URALURB .0848427 0.045 .1751297 0.005 .0277886 0.612 VOLGAURB .1382104 0.002 .2669675 0.000 .0182306 0.759 part -.2787654 0.000 -.2078126 0.011 -.2290377 0.000 _cons 7.836748 0.000 8.011462 0.000 7.439344 0.000 Log gender regression results (Ukraine, 2003) POOLED Source SS df MS Number of obs 2856 F( 24, 2831) 38.90 Model 283.706037 24 11.8210849 Prob > F 0.0000 Residual 860.347796 2831 .303902436 R-squared 0.2480 Adj R-squared 0.2416 Total 1144.05383 2855 .400719381 Root MSE .55127 MEN Source SS df MS Number of obs 1379 F( 24, 1354) 18.13 Model 153.085203 24 6.37855014 Prob > F 0.0000 Residual 476.398617 1354 .35184536 R-squared 0.2432 Adj R-squared 0.2298 Total 629.483821 1378 .456809739 Root MSE .59317 FEMALE Source SS df MS Number of obs 1477 F( 24, 1452) 19.51 Model 107.596887 24 4.48320361 Prob > F 0.0000 Residual 333.704162 1452 .229823803 R-squared 0.2438 Adj R-squared 0.2313 Total 441.301049 1476 .29898445 Root MSE .4794
POOLED MEN FEMALE lny Coef. P>t Coef. P>t Coef. P>t GENSEC -.0394671 0.191 -.0561951 0.199 -.0036022 0.928 SPECSEC .0401072 0.176 .0838714 0.074 .0837068 0.023 COL .2037295 0.000 .1933446 0.001 .2230491 0.000 EXPER .0095713 0.007 .0143151 0.006 .0118279 0.013 EXPER2 -.0002692 0.002 -.0004028 0.001 -.0002529 0.037 IND .3513555 0.000 .4414933 0.000 .2209525 0.000 CONSTR .3948337 0.000 .4374543 0.000 .1624337 0.099 TRANSP .3701706 0.000 .431519 0.000 .2640647 0.000 TRADE .2209802 0.000 .2559833 0.000 .178215 0.002 UTIL .0939817 0.050 .0931511 0.221 .0913186 0.122

Marek Góra, Grzegorz Kula, Magdalena Rokicka, Oleksandr Rohozynsky, Anna Ruzik
CASE Network Reports No. 90 98
POOLED MEN FEMALE lny Coef. P>t Coef. P>t Coef. P>t HEALTH_EDU -.1141467 0.002 -.065566 0.363 -.103837 0.023 PUBADM .2980649 0.000 .5171455 0.000 .0624338 0.384 FINANCE .168652 0.040 .3309217 0.019 .054114 0.561 MGR .2805103 0.000 .3871372 0.000 .1582334 0.024 PROF .1590679 0.000 .138337 0.068 .2281204 0.000 CLER -.1095888 0.018 -.0836036 0.377 -.0140547 0.776 SERV -.1323211 0.009 -.0139897 0.889 -.0754604 0.171 CRAFT .0837931 0.026 .031011 0.564 .0330211 0.553 PLANT .1372026 0.007 .0668435 0.325 .148281 0.097 ELEM -.1764631 0.000 -.1903784 0.001 -.133957 0.002 KIEV .3247502 0.000 .3067852 0.000 .3347975 0.000 EAST .0936958 0.000 .1328458 0.000 .050225 0.082 SOUTH .0580707 0.059 -.0081185 0.864 .1162832 0.002 part -.3796919 0.000 -.4180087 0.000 -.3365456 0.000 _cons 5.255031 0.000 5.285307 0.000 5.10719 0.000