INTERNATIONAL OIL & ICE WORKSHOP Anchorage Alaska • October 10

CODES AND STANDARDS ENHANCEMENT INITIATIVE (CASE)
Supermarket Refrigeration
2013 California Building Energy Efficiency Standards
California Utilities Statewide Codes and Standards Team October 2011
This report was prepared by the California Statewide Utility Codes and Standards Program and funded by the California utility customers under the
auspices of the California Public Utilities Commission.
Copyright 2011 Pacific Gas and Electric Company, Southern California Edison, SoCalGas, SDG&E.
All rights reserved, except that this document may be used, copied, and distributed without modification.
Neither PG&E, SCE, SoCalGas, SDG&E, nor any of its employees makes any warranty, express of implied; or assumes any legal liability or
responsibility for the accuracy, completeness or usefulness of any data, information, method, product, policy or process disclosed in this document; or represents that its use will not infringe any privately-owned rights including, but not limited to, patents, trademarks or copyrights

Page 2
2013 California Building Energy Efficiency Standards October 2011
Table of Contents
1. Purpose ........................................................................................................................ 8
2. Overview ..................................................................................................................... 10
3. Methodology............................................................................................................... 20
3.1 Supermarket Prototype Definitions ..........................................................................................20
3.2 Energy Analysis and Cost Effectiveness Methodology ...........................................................21
3.3 Statewide Energy Savings Estimate .........................................................................................22
3.4 Direct Refrigerant Emissions Calculations...............................................................................23
3.4.1 Base case refrigerant charge description ............................................................................23
3.4.2 Direct emissions methodology ...........................................................................................24
3.5 Acceptance Testing ...................................................................................................................25
3.6 Stakeholder Meeting Process....................................................................................................25
4. Analysis and Results ................................................................................................. 26
4.1 Floating Head Pressure .............................................................................................................27
4.1.1 Analysis results by climate zone ........................................................................................28
4.2 Condenser Specific Efficiency .................................................................................................31
4.2.1 Incremental analysis results ...............................................................................................35
4.2.2 Analysis of results by climate zone ...................................................................................35
4.3 Floating Suction Pressure .........................................................................................................37
4.3.1 Analysis results by climate zone ........................................................................................38
4.4 Mechanical Subcooling ............................................................................................................40
4.4.1 Analysis results by climate zone ........................................................................................40
4.5 Display Case Lighting Control .................................................................................................41
4.5.1 Analysis results by climate zone ........................................................................................41
4.6 Prohibit Open Upright Frozen Food Cases...............................................................................42
4.7 Refrigeration Heat Recovery ....................................................................................................43
4.7.1 Energy analysis results .......................................................................................................44
4.7.2 Refrigerant analysis results ................................................................................................45
4.7.3 GHG analysis results..........................................................................................................45
4.8 CO2 Secondary (indirect) or Cascade Cooling .........................................................................48
4.8.1 Analysis Results .................................................................................................................49
4.8.2 Use of Glycol for MT Systems as an Exception to CO2 ....................................................50

Page 3
2013 California Building Energy Efficiency Standards October 2011
4.9 Statewide Energy Savings Estimates ........................................................................................51
4.10 Equipment Rating Accuracy, Standards and Certification....................................................54
5. Recommended Code Language ............................................................................... 56
5.1 Title 24 Draft Code Language ..................................................................................................56
6. Appendix A: Rejected Measures .............................................................................. 61
6.1 Evaporator Coil Specific Efficiency .........................................................................................61
6.2 Display Case LED Lights .........................................................................................................61
6.3 Night Covers on Open Display Cases ......................................................................................62
6.4 Prohibit Gas Defrost .................................................................................................................62
6.5 Walk-in Variable Speed Fan Control .......................................................................................63
6.5.1 Analysis results by climate zone ........................................................................................64
6.5.2 Industry concerns regarding sufficient airflow and product quality ..................................65
6.6 Liquid-Suction Heat Exchangers ..............................................................................................65
6.6.1 Analysis results by climate zone ........................................................................................67
7. Appendix B: System Schematics ............................................................................. 74
8. Appendix C: Base Case Facility Descriptions ......................................................... 88
9. Appendix D: Refrigeration Schedules and Equipment Sizing ............................... 98
9.1 Refrigeration Schedules ............................................................................................................98
9.2 Equipment Sizing per Climate Zone ......................................................................................100
10. Appendix E: Charge Size and Leak Rate Assumptions for Direct Emissions .... 102
10.1 Summary of Information Obtained on Charge Size and Leak Rates ..................................102
10.2 Methodology for Developing Charge Size Assumptions ....................................................106
10.2.1 DX Systems ..................................................................................................................107
10.2.2 Distributed and Secondary Loop Systems ....................................................................107
10.2.3 Impact of the Condenser Type ......................................................................................108
10.3 Methodology for Developing Leak Rate Assumptions .......................................................108
10.4 Limitations and Considerations ...........................................................................................109
11. Appendix F: Wetbulb Sensitivity Study for Floating Head Pressure Measure ... 110
12. Appendix G: Databases from Savings By Design ................................................. 111
12.1 Condenser Specific Efficiency ............................................................................................111
13. Appendix H: Energy Analysis for CO2 Secondary Systems ................................ 116
13.1 Glycol Indirect System Analysis .........................................................................................118
14. Appendix I: Full Cost Results ................................................................................. 121

Page 4
2013 California Building Energy Efficiency Standards October 2011
14.1 Floating Head Pressure........................................................................................................121
14.2 Condenser Specific Efficiency ............................................................................................125
14.3 Floating Suction Pressure ....................................................................................................129
14.4 Mechanical Subcooling .......................................................................................................133
14.5 Display Case Lighting Control ............................................................................................137
14.6 Refrigeration Heat Recovery ...............................................................................................141
15. Appendix J: Acronym List and Glossary ............................................................... 145
16. Appendix K: Nonresidential Construction Forecast ............................................. 150

Page 5
2013 California Building Energy Efficiency Standards October 2011
Table of Figures
Figure 1: Prototype supermarket summary ........................................................................................... 20
Figure 2: Size and system description for analysis prototypes ............................................................. 21
Figure 3: 2014 Supermarket new construction in California climate zones ......................................... 23
Figure 4: Base case charge size and leak rate assumptions .................................................................. 24
Figure 5: Legend for analysis results tables .......................................................................................... 26
Figure 6: Summary of ambient following control TDs for SCT control measure ................................ 28
Figure 7: Energy analysis results for floating head pressure measure .................................................. 29
Figure 8: Refrigerant analysis results for floating head pressure measure ........................................... 29
Figure 9: GHG analysis results for floating head pressure measure ..................................................... 30
Figure 10: Cost savings results for floating head pressure measure ..................................................... 31
Figure 11: Condenser description for specific efficiency measure ....................................................... 31
Figure 12: Example normalized condenser capacity and power versus normalized speed .................. 32
Figure 13: Condenser cost versus MBH capacity at specific-efficiency rating conditions .................. 33
Figure 14 Example of increasing condenser size and resultant specific efficiency .............................. 34
Figure 15: System energy usage and TDV energy cost versus specific efficiency .............................. 34
Figure 16: Preliminary condenser specific efficiency results ............................................................... 35
Figure 17: Energy analysis summary for condenser specific efficiency measure by climate zone ...... 36
Figure 18: Analysis results for prototypes, system configurations, and condenser types with
Benefit/Cost ratios less than 1 ........................................................................................................ 37
Figure 19: Suction group design SST and Base Case SST setpoints .................................................... 38
Figure 20: Savings results for floating suction pressure by climate zone............................................. 39
Figure 21: Statewide savings results for mechanical subcooling measure ........................................... 41
Figure 22: Statewide savings results for display case lighting control measure ................................... 42
Figure 23: Analysis assumptions for both open and reach-in display cases ......................................... 43
Figure 24: Analysis results for reach-in versus open upright frozen food cases .................................. 43
Figure 25: Simulation assumptions for heat reclaim measure .............................................................. 44
Figure 26: Energy savings results for heat recovery measure by climate zone .................................... 45
Figure 27: Refrigerant analysis results for heat recovery measure ....................................................... 45
Figure 28: GHG analysis results for heat recovery measure ................................................................ 46
Figure 29: Cost savings results for heat recovery measure................................................................... 47
Figure 30: Heat recovery cost savings results for CTZ15 – Palm Springs ........................................... 48
Figure 31: Carbon savings results for indirect cooling measure ........................................................... 49

Page 6
2013 California Building Energy Efficiency Standards October 2011
Figure 32: GHG analysis results for indirect cooling measure ............................................................ 49
Figure 33: Cost savings results for indirect cooling measure ............................................................... 50
Figure 34: Cost savings results for indirect measure with glycol ......................................................... 51
Figure 35: Annual Statewide Energy Savings – Small Supermarket Prototype ................................... 52
Figure 36: Annual Statewide Energy Savings – Large Supermarket Store .......................................... 52
Figure 37: Annual Statewide Energy Savings – Big Box Food Store .................................................. 53
Figure 38: Annual Statewide Energy Savings – All Average of Prototypes ........................................ 53
Figure 39: Annual Statewide Energy Savings by Measures ................................................................. 54
Figure 40: Sacramento GHG savings results for no hot gas defrost ..................................................... 62
Figure 41: Sacramento cost savings analysis results for no hot gas defrost ......................................... 63
Figure 42: Statewide savings results for walk-in variable-speed fan control measure ......................... 64
Figure 43: Suction line heat gain assumptions (MT systems) .............................................................. 66
Figure 44: Suction line heat gain assumptions (LT systems) ............................................................... 66
Figure 45: LSHX sizing assumptions for cost and performance .......................................................... 66
Figure 46: Statewide savings analysis for liquid-suction heat exchangers (MT Walk-Ins) ................. 67
Figure 47: Statewide savings analysis for liquid-suction heat exchangers (LT Walk-Ins) .................. 68
Figure 48: Statewide savings analysis for liquid-suction heat exchangers (MT display cases) ........... 69
Figure 49: Statewide savings analysis for liquid-suction heat exchangers (LT display cases) ............ 69
Figure 50: MT walk-in LSHX simulations with BC less than 1.0........................................................ 70
Figure 51: MT LSHX results by walk-in with results and BCR on a per-SF basis .............................. 73
Figure 52: Liquid subcooling for R-404A, R-507, R-407A, and R-410A with equal-sized LSHXs ... 73
Figure 53: Small supermarket with central parallel rack compressor system and air-cooled condensers
(SAC) ............................................................................................................................................. 74
Figure 54: Small supermarket with distributed compressor systems and air-cooled condensers (SAD)
........................................................................................................................................................ 75
Figure 55: Small supermarket with central parallel rack compressor system and evaporative-cooled
condensers (SEC) ........................................................................................................................... 76
Figure 56: Small supermarket with central parallel rack compressor system and water-cooled
condensers served by a central evaporative-cooled fluid cooler (SFC) ......................................... 76
Figure 57: Small supermarket with distributed compressor systems and water-cooled condensers
served by a central evaporative-cooled fluid cooler (SFD) ............................................................ 77
Figure 58: Large supermarket with central parallel rack compressor configuration and air-cooled
condensers (MAC) ......................................................................................................................... 78
Figure 59: Large supermarket with distributed compressor systems and air-cooled condensers (MAD)
........................................................................................................................................................ 79

Page 7
2013 California Building Energy Efficiency Standards October 2011
Figure 60: Large supermarket with central parallel rack compressor system and evaporative-cooled
condensers (MEC) .......................................................................................................................... 80
Figure 61: Large supermarket with central parallel rack compressor system and water-cooled
condensers served by a central evaporative-cooled fluid cooler (MFC) ........................................ 81
Figure 62: Large supermarket with distributed compressor systems and water-cooled condensers
served by a central evaporative-cooled fluid cooler (MFD) .......................................................... 82
Figure 63: Big-box store with central parallel rack compressor system and air-cooled condensers
(LAC) ............................................................................................................................................. 83
Figure 64: Big-box food store with distributed compressor systems and air-cooled condensers (LAD)
........................................................................................................................................................ 84
Figure 65: Big-box store with central parallel compressors and evaporative condenser (LEC) .......... 85
Figure 66: Big-box food store with central parallel rack compressor system and water-cooled
condensers served by a central evaporative-cooled fluid cooler (LFC) ......................................... 86
Figure 67: Large supermarket with distributed compressor systems and water-cooled condensers
served by a central evaporative-cooled fluid cooler (MFD) .......................................................... 87
Figure 68: Small supermarket refrigeration schedule ........................................................................... 98
Figure 69: Large supermarket refrigeration schedule ......................................................................... 100
Figure 70: Big-box store refrigeration schedule ................................................................................. 100
Figure 71: Description of two design climate zones ........................................................................... 101
Figure 72: TD Sensitivity Analysis..................................................................................................... 110
Figure 73: Air-cooled axial-fan halocarbon condenser database ........................................................ 113
Figure 74: Centrifugal fan evaporative-cooled halocarbon condenser database ................................ 115
Figure 75: Indirect system diagram .................................................................................................... 116
Figure 76: Analysis assumptions for CO2 indirect system analysis ................................................... 117
Figure 77: Energy analysis results for CO2 indirect system measure ................................................. 118
Figure 78: Glycol indirect loop assumptions ...................................................................................... 119
Figure 79: Assumed required glycol flowrate for MT indirect system .............................................. 119
Figure 80: Energy analysis results for glycol indirect system measure .............................................. 120

Page 8
2013 California Building Energy Efficiency Standards October 2011
1. Purpose This document is a report of a proposed addition to the energy-efficiency standards outlined in
Section 6 of California‘s Title 24 building code to include supermarket refrigeration systems.
Measures to reduce energy consumption in supermarket refrigeration systems were evaluated. A
concurrent study of refrigerant charge and leak rates was conducted to assess the direct greenhouse
gas (GHG) impacts (i.e., refrigerant emissions) of centralized direct expansion (DX) systems,
distributed systems, and secondary loop systems. To be considered for inclusion in the Title 24
standards, measures must be both cost-effective as well as readily available in the market at the time
that the code becomes effective.
Supermarkets, for the purposes of this report, include retail food stores from 8,000 square feet
(considered the minimum size of a specialty or small neighborhood market) to over 150,000 square
feet for ―big box‖ stores that include a compete food store. Supermarket refrigeration systems serve
refrigerated display case merchandisers, and walk-in coolers and freezers used for storage. Large
―point of sale‖ boxes equipped with reach-in doors, or refrigerated spaces configured to allow
customers to walk through, are also often included in ―big box‖ store designs. Refrigeration systems
for these stores typically consist of several groups of multiple hermetic or semi-hermetic compressors
manifolded together. These compressor systems or ―parallel racks‖ are commonly located indoors
and connected to separate remote condensers, but may also be physically packaged along with a
condenser (called a ―condensing unit‖) for smaller stores, or as distributed units in large stores.
Many of the energy savings measures evaluated in this report have an established history in California
and are employed in the majority of new supermarkets.
The measures analyzed in this report include:
1. Floating head pressure
2. Condenser specific efficiency
3. Floating suction pressure
4. Mechanical subcooling
5. Display case lighting control
6. Refrigeration heat recovery
7. Prohibit open upright frozen food cases
8. CO2 secondary (indirect) or cascade cooling
The study work for this report included: research of supermarket energy efficiency measures, data
mining from Savings By Design (SBD) new construction energy efficiency projects, equipment
research, interviews with equipment manufacturers, contractors, and supermarket operators, and
detailed energy modeling and economic analysis.
Recognizing that some energy efficiency measures may have adverse impacts on refrigerant charge
size and/or leak rates, which may in turn lead to increased emissions of high-global warming potential
(GWP) refrigerants—such as HFC-404A and HFC-507—this analysis considers not just the potential
energy savings associated with each measure, but the net greenhouse gas impacts associated with both
energy consumption and refrigerant emissions. In particular, the net climate impacts are
quantitatively assessed for two measures—heat recovery and floating head pressure—to ensure that
the measures achieve an overall cost savings over the lifetime of the equipment. A methodology for
calculating energy reduction in units of equivalent tons of emitted CO2, as well as equivalent
monetized value per emitted ton of CO2 in present-value dollars, was developed by the California

Page 9
2013 California Building Energy Efficiency Standards October 2011
Energy Commission (CEC) for the purpose of economic analysis of these measures. Moreover, to
promote the reduction of overall GHG emissions, one measure known to reduce annual refrigerant
losses at the expense of higher energy consumption—secondary (indirect) cooling—is also assessed
in this analysis in terms of both direct (energy consumption) and indirect (GHG emission) impacts
using the methodology developed by the CEC.

Page 10
2013 California Building Energy Efficiency Standards October 2011
2. Overview a. Measure Title Supermarket Refrigeration Energy Efficiency CASE Study
b. Description Title 24 Part 6 Measures:
Floating head pressure – require controls to float refrigeration system saturated
condensing temperature (SCT) to 70°F during low-ambient temperature conditions,
with ambient-following control logic and variable speed condenser fans
Condenser specific efficiency – require a maximum fan power per unit of capacity
on air-cooled and evaporative-cooled refrigerant condensers
Floating suction pressure – require controls to reset refrigeration system target
suction temperature based on refrigerated display case or walk-in temperature,
rather than operating at a fixed suction temperature setpoint
Mechanical subcooling – require liquid refrigerant to be subcooled to 50°F or less
for low-temperature loads
Display case lighting control – require automatic controls to turn off display case
lights during non-business hours
Prohibit open upright frozen food cases
Refrigeration heat recovery – require equipment and controls to utilize rejected heat
from refrigeration system(s) for space heating, with a limited increase in refrigerant
charge
Title 24 Part 11 (Reach) Code Measures
CO2 secondary (indirect) or cascade cooling – require that refrigerated display cases
and walk-in coolers and freezers utilize carbon dioxide (CO2) as the heat-transfer
fluid or as the low-side refrigerant in a cascaded system to reduce HFC refrigerant
charge
c. Type of
Change
The proposed code changes are mandatory code requirements in Title 24 Part 6 or
Title 24 Part 11 (Reach) Codes.

Page 11
2013 California Building Energy Efficiency Standards October 2011
d. Energy Benefits
1. Values in the summary table below are weighted for different supermarket building prototypes.
Analysis on these measures‘ incremental savings is presented in Section 4. Note that the CO2
secondary (indirect) or cascade cooling measure is considered to be energy-neutral, based on
DOE2 simulation and industry research, but is being considered for inclusion in the standards
based on the overall GHG reductions that may result from lower HFC refrigerant charge.
Energy Savings Demand Savings Natural Gas Savings TDV Energy Savings
kWh kWh/SF kW W/SF Therms Therms/SF MMBtu MMBtu/SF
CTZ01 - Arcata
Floating Head Pressure 91,871 1.49 8.5 0.537 0 0.00 1,859,180 30.33
Condenser Specific Efficiency 1,507 0.03 0.6 0.011 0 0.00 37,680 0.69
Floating Suction Pressure 28,549 0.44 4.4 0.064 0 0.00 614,500 9.45
Mechanical Subcooling 28,837 0.41 5.4 0.067 0 0.00 614,273 8.67
Display Case Lighting Control 121,760 2.20 0.6 0.011 0 0.00 2,047,613 35.84
Heat Reclaim -53,400 -0.78 -2.0 -0.032 43,977 0.69 8,671,683 99.56
CTZ03 - Oakland
Floating Head Pressure 81,873 1.34 2.7 0.173 0 0.00 1,669,053 27.43
Condenser Specific Efficiency 2,181 0.04 3.7 0.068 0 0.00 62,173 1.15
Floating Suction Pressure 29,510 0.45 4.3 0.066 0 0.00 641,273 9.82
Mechanical Subcooling 29,735 0.42 6.9 0.093 0 0.00 656,960 9.15
Display Case Lighting Control 122,526 2.21 0.7 0.007 0 0.00 2,038,887 35.65
Heat Reclaim -48,367 -0.70 -1.0 -0.011 31,436 0.50 6,130,635 71.37
CTZ05 - Santa Maria
Floating Head Pressure 84,642 1.39 7.2 0.456 0 0.00 1,729,287 28.46
Condenser Specific Efficiency 2,438 0.04 2.0 0.035 0 0.00 54,817 1.00
Floating Suction Pressure 29,299 0.45 4.5 0.067 0 0.00 636,593 9.76
Mechanical Subcooling 29,532 0.42 6.0 0.081 0 0.00 644,013 8.98
Display Case Lighting Control 122,016 2.20 0.8 0.007 0 0.00 2,048,813 35.77
Heat Reclaim -49,166 -0.71 -2.8 -0.024 33,001 0.53 6,385,425 73.99
CTZ07 - San Diego (Lindbergh Field)
Floating Head Pressure 68,631 1.16 1.4 0.087 0 0.00 1,471,913 24.81
Condenser Specific Efficiency 2,937 0.05 4.4 0.073 0 0.00 74,007 1.36
Floating Suction Pressure 29,996 0.46 4.1 0.061 0 0.00 651,853 10.01
Mechanical Subcooling 31,193 0.44 7.8 0.114 0 0.00 698,600 9.74
Display Case Lighting Control 125,402 2.26 0.7 0.007 0 0.00 2,125,340 36.99
Heat Reclaim -41,375 -0.59 -0.3 0.012 17,696 0.31 3,195,500 42.07
2.

Page 12
2013 California Building Energy Efficiency Standards October 2011
Energy Savings Demand Savings Natural Gas Savings TDV Energy Savings
kWh kWh/SF kW W/SF Therms Therms/SF MMBtu MMBtu/SF
CTZ08 - Fullerton
Floating Head Pressure 75,743 1.27 4.5 0.286 0 0.00 1,688,900 35.16
Condenser Specific Efficiency 3,268 0.06 4.8 0.078 0 0.00 117,667 2.08
Floating Suction Pressure 30,339 0.46 5.2 0.086 0 0.00 659,573 9.99
Mechanical Subcooling 32,359 0.46 10.0 0.163 0 0.00 745,553 10.63
Display Case Lighting Control 124,593 2.24 0.8 0.009 0 0.00 2,072,240 36.05
Heat Reclaim -46,948 -0.73 -1.8 -0.038 16,646 0.32 2,884,310 41.91
CTZ10 - Riverside
Floating Head Pressure 79,688 1.31 2.1 0.131 0 0.00 1,481,713 24.33
Condenser Specific Efficiency 5,353 0.09 4.8 0.079 0 0.00 214,727 3.62
Floating Suction Pressure 31,196 0.47 5.6 0.089 0 0.00 688,133 10.41
Mechanical Subcooling 34,136 0.48 13.1 0.191 0 0.00 835,160 11.52
Display Case Lighting Control 124,596 2.24 0.8 0.011 0 0.00 2,047,487 35.67
Heat Reclaim -49,868 -0.75 -1.5 -0.037 16,704 0.28 2,892,648 34.62
CTZ12 – Sacramento (Sacramento Executive Airport)
Floating Head Pressure 83,625 1.37 1.7 0.110 0 0.00 1,572,613 25.78
Condenser Specific Efficiency 4,540 0.08 4.8 0.079 0 0.00 196,560 3.31
Floating Suction Pressure 30,864 0.47 5.8 0.096 0 0.00 690,573 10.47
Mechanical Subcooling 33,135 0.46 11.9 0.182 0 0.00 809,860 11.20
Display Case Lighting Control 123,529 2.22 0.5 0.007 0 0.00 2,068,500 36.07
Heat Reclaim -53,112 -0.80 -4.1 -0.050 23,756 0.39 4,484,329 52.52
CTZ13 - Fresno
Floating Head Pressure 80,300 1.32 1.8 0.111 0 0.00 1,501,767 24.66
Condenser Specific Efficiency 6,692 0.11 4.9 0.080 0 0.00 245,087 4.09
Floating Suction Pressure 31,935 0.49 5.9 0.095 0 0.00 714,173 10.82
Mechanical Subcooling 35,542 0.49 12.5 0.188 0 0.00 876,007 12.09
Display Case Lighting Control 125,199 2.26 0.8 0.009 0 0.00 2,105,827 37.00
Heat Reclaim -50,693 -0.77 -3.2 -0.034 19,960 0.33 3,725,403 43.80

Page 13
2013 California Building Energy Efficiency Standards October 2011
Energy Savings Demand Savings Natural Gas Savings TDV Energy Savings
kWh kWh/SF kW W/SF Therms Therms/SF MMBtu MMBtu/SF
CTZ14 - Palmdale
Floating Head Pressure 90,771 1.47 0.7 0.045 0 0.00 1,648,873 26.77
Condenser Specific Efficiency 6,629 0.11 4.9 0.081 0 0.00 243,767 4.07
Floating Suction Pressure 31,286 0.47 5.9 0.096 0 0.00 695,327 10.47
Mechanical Subcooling 34,923 0.48 11.8 0.176 0 0.00 846,867 11.64
Display Case Lighting Control 124,213 2.24 0.8 0.009 0 0.00 2,049,980 35.90
Heat Reclaim -56,213 -0.86 -3.8 -0.043 21,598 0.35 4,030,393 46.84
CTZ15 - Palm Springs
Floating Head Pressure 69,697 1.13 0.7 0.044 0 0.00 1,277,240 20.77
Condenser Specific Efficiency 13,409 0.23 5.0 0.082 0 0.00 375,240 6.23
Floating Suction Pressure 35,156 0.53 7.4 0.117 0 0.00 786,493 11.86
Mechanical Subcooling 45,087 0.62 17.5 0.265 0 0.00 1,134,920 15.69
Display Case Lighting Control 128,513 2.31 1.1 0.011 0 0.00 2,155,000 37.71
Heat Reclaim -43,199 -0.67 -3.1 -0.040 6,096 0.11 505,212 7.61
The statewide savings for each of the proposed measures and the total annual statewide savings are:
Measure Energy Savings
(GWh)
Gas Savings
(MMT)
Floating Head Pressure 6.50 --
Condenser Specific Efficiency 0.35 --
Floating Suction Pressure 2.30 --
Mechanical Subcooling 2.08 --
Display Case Lighting Control 10.11 --
Refrigeration Heat Recovery -3.32 1.89
Total 18.02 1.89
For description of prototype buildings and weighting refer to Methodology section 3 and Analysis and
Results section 4 below.
e. Non-Energy
Benefits
Non-energy benefits associated with improved supermarket refrigeration system
energy efficiency include increased equipment reliability and stored product security.
The floating head pressure measure reduces the average operating pressures and
temperatures, reducing stress on compressors, condensers, piping, and associated
equipment.
f.
Environmental
Impact
The proposed supermarket refrigeration measures have little statewide change in water
consumption or water quality.
The floating head pressure measure includes variable-speed condenser fan control.

Page 14
2013 California Building Energy Efficiency Standards October 2011
Variable-speed control is achievable by providing a speed-control signal to existing
electronically-commutated (EC, also known as Brushless DC) fan motors, which
would not increase material usage. Variable-speed drives can also be employed,
which would have a consequent increase in materials.
The condenser specific efficiency measure in some instances may be achieved with
larger condenser surface, in others with more efficient motors, or improved
technology. A larger condenser surface potentially results in increased material usage.
However, in the case of air-cooled condensers, a rapidly increasing use of micro-
channel condenser surface provides higher specific efficiency while potentially
reducing materials and weight.
The refrigeration heat reclaim measure will require a heat reclaim coil, increasing
material usage.
In addition to expected material uses, two energy efficiency measures are expected to
impact refrigerant charge size and/or leak rates, thereby impacting the refrigeration
system‘s annual emissions of high-global warming potential (GWP) refrigerants.
Analyses were undertaken to quantify these impacts. The two measures that are
expected to impact refrigerant charge size and/or leak rates are:
Floating head pressure
Refrigeration heat recovery
Expected material increase for each measure is presented below. Units are lbs/SF of
prototype floor area.
Mercury Lead Copper Steel Plastic Aluminum R-404A
Refrigerant
Floating head
pressure NC NC
Small: 0.00020 Large: 0.00003
Big Box: 0.00013
Small: 0.00010 Large: 0.00002
Big Box: 0.00001
NC Small: 0.00010 Large: 0.00002
Big Box: 0.00001
Small: 0.00019 Large: 0.00016
Big Box: 0.00008
Condenser specific
efficiency
NC NC Small: 0.00089 Large: 0.00015
Big Box: 0.00008
Small: 0.00089 Large: 0.00015
Big Box: 0.00008
NC Small: 0.00089 Large: 0.00015
Big Box: 0.00008
Small: 0.00015 Large: 0.00005
Big Box: 0.00003
Floating
suction
pressure
NC NC NC NC NC NC NC
Mechanical subcooling
NC NC NC NC NC NC NC
Display case lighting control
NC NC NC NC NC NC NC
Refrigeration heat recovery
NC NC
Small: 0.00447
Large: 0.00459
Big Box: 0.00394
NC NC
Small: 0.00447
Large: 0.00459
Big Box: 0.00394
Small: 0.00168
Large: 0.00085
Big Box: 0.00057
Prohibit open
upright
frozen food cases
NC NC NC NC NC NC NC
g. Technology Measures Measure Availability:
CO2 Secondary (indirect) or cascade cooling: secondary systems
with CO2 as the secondary medium are already common in Europe
and are gaining popularity in the United States. Manufacturers are

Page 15
2013 California Building Energy Efficiency Standards October 2011
beginning to offer refrigeration equipment that is CO2-compatible.
Other measures have a long history in California supermarkets and are
already available.
Useful Life, Persistence, and Maintenance:
The effective useful life (EUL) of all supermarket refrigeration measures
is 15 years. Supermarkets are frequently remodeled, as often as every 7-
10 years, but the mechanical systems are commonly adapted and re-used
through one or more remodel cycles.
Persistence of savings for control measures, including floating head
pressure, floating suction pressure and display case lighting control can be
as little as a few years. Sensors may drift or service contractors may
bypass efficiency controls or change settings. Persistence can be
improved by initial commissioning, automated setpoint verification and
through routine maintenance and/or periodic re-commissioning. Many
supermarket chains and companies serving this sector now utilize the
computerized supermarket control systems, used in virtually every store,
to effect automated monitoring of setpoints and system operation,
potentially delivery very high certainty of savings over time.
h. Performance Verification
of the Proposed Measure
Mandatory acceptance test procedures for supermarket refrigeration
control-related measures will be developed, including:
Floating head pressure
Floating suction pressure
Mechanical subcooling
Display case lighting control
Refrigeration heat recovery

Page 16
2013 California Building Energy Efficiency Standards October 2011
i. Cost Effectiveness
Life-cycle cost analysis results for the cost-effective measures are presented below. The analysis for the
CO2 secondary (indirect) or cascade cooling measure is presented separately, as the results for that
measure do not vary significantly by climate zone.
Measure Cost Maintenance Cost TDV Cost Savings Refrigerant Cost Life Cycle Cost
($) ($/SF) ($) ($/SF) ($) ($/SF) ($) ($/SF) ($) ($/SF)
CTZ01 – Arcata
Floating Head Pressure $17,002 $0.215 $12,535 $0.158 $165,461 $2.70 $4,917 $0.007 -$131,007 -$2.05
Condenser Specific Efficiency $3,571 $0.045 $0 $0.000 $3,353 $0.06 $0 $0.000 $218 $0.00
Floating Suction Pressure $2,489 $0.031 $5,969 $0.075 $54,689 $0.84 $0 $0.000 -$46,231 -$0.58
Mechanical Subcooling $4,114 $0.052 $4,775 $0.060 $54,668 $0.77 $0 $0.000 -$45,779 -$0.58
Display Case Lighting Control $4,683 $0.059 $5,173 $0.065 $182,231 $3.19 $0 $0.000 -$172,375 -$2.18
Heat Reclaim $40,954 $0.517 $19,101 $0.241 $771,752 $12.35 $37,708 $0.057 -$673,989 -$10.73
CTZ03 – Oakland
Floating Head Pressure $17,002 $0.215 $12,535 $0.158 $148,540 $2.44 $4,917 $0.007 -$114,086 -$1.79
Condenser Specific Efficiency $3,571 $0.045 $0 $0.000 $5,533 $0.10 $0 $0.000 -$1,962 -$0.02
Floating Suction Pressure $2,489 $0.031 $5,969 $0.075 $57,071 $0.87 $0 $0.000 -$48,614 -$0.61
Mechanical Subcooling $4,114 $0.052 $4,775 $0.060 $58,467 $0.81 $0 $0.000 -$49,578 -$0.63
Display Case Lighting Control $4,683 $0.059 $5,173 $0.065 $181,454 $3.17 $0 $0.000 -$171,598 -$2.17
Heat Reclaim $40,954 $0.517 $19,101 $0.241 $545,607 $8.88 $37,708 $0.057 -$447,844 -$7.26
CTZ05 - Santa Maria
Floating Head Pressure $17,002 $0.215 $12,535 $0.158 $153,901 $2.53 $4,917 $0.007 -$119,447 -$1.88
Condenser Specific Efficiency $3,571 $0.045 $0 $0.000 $4,879 $0.09 $0 $0.000 -$1,307 -$0.02
Floating Suction Pressure $2,489 $0.031 $5,969 $0.075 $56,655 $0.87 $0 $0.000 -$48,197 -$0.61
Mechanical Subcooling $4,114 $0.052 $4,775 $0.060 $57,315 $0.80 $0 $0.000 -$48,426 -$0.61
Display Case Lighting Control $4,683 $0.059 $5,173 $0.065 $182,338 $3.18 $0 $0.000 -$172,482 -$2.18
Heat Reclaim $40,954 $0.517 $19,101 $0.241 $568,282 $9.20 $37,708 $0.057 -$470,519 -$7.59
CTZ07 - San Diego (Lindbergh Field)
Floating Head Pressure $17,002 $0.215 $12,535 $0.158 $130,996 $2.21 $4,917 $0.007 -$96,542 -$1.56
Condenser Specific Efficiency $3,571 $0.045 $0 $0.000 $6,586 $0.12 $0 $0.000 -$3,015 -$0.04
Floating Suction Pressure $2,489 $0.031 $5,969 $0.075 $58,013 $0.89 $0 $0.000 -$49,555 -$0.63
Mechanical Subcooling $4,114 $0.052 $4,775 $0.060 $62,173 $0.87 $0 $0.000 -$53,284 -$0.67
Display Case Lighting Control $4,683 $0.059 $5,173 $0.065 $189,148 $3.29 $0 $0.000 -$179,292 -$2.26
Heat Reclaim $40,954 $0.517 $19,101 $0.241 $284,389 $5.27 $37,708 $0.057 -$186,626 -$3.65

Page 17
2013 California Building Energy Efficiency Standards October 2011
Measure Cost Maintenance Cost TDV Cost Savings Refrigerant Cost Life Cycle Cost
($) ($/SF) ($) ($/SF) ($) ($/SF) ($) ($/SF) ($) ($/SF)
CTZ08 – Fullerton
Floating Head Pressure $17,002 $0.215 $12,535 $0.158 $150,307 $3.13 $4,917 $0.007 -$115,853 -$2.48
Condenser Specific Efficiency $3,901 $0.049 $0 $0.000 $10,472 $0.18 $0 $0.000 -$6,571 -$0.08
Floating Suction Pressure $2,489 $0.031 $5,969 $0.075 $58,700 $0.89 $0 $0.000 -$50,242 -$0.63
Mechanical Subcooling $4,114 $0.052 $4,775 $0.060 $66,352 $0.95 $0 $0.000 -$57,462 -$0.73
Display Case Lighting Control $4,683 $0.059 $5,173 $0.065 $184,423 $3.21 $0 $0.000 -$174,567 -$2.20
Heat Reclaim $40,954 $0.517 $19,101 $0.241 $256,694 $5.28 $37,708 $0.057 -$158,931 -$3.66
CTZ10 – Riverside
Floating Head Pressure $17,002 $0.215 $12,535 $0.158 $131,868 $2.16 $4,917 $0.007 -$97,414 -$1.52
Condenser Specific Efficiency $3,901 $0.049 $0 $0.000 $19,110 $0.32 $0 $0.000 -$15,209 -$0.19
Floating Suction Pressure $2,489 $0.031 $5,969 $0.075 $61,242 $0.93 $0 $0.000 -$52,784 -$0.67
Mechanical Subcooling $4,114 $0.052 $4,775 $0.060 $74,327 $1.03 $0 $0.000 -$65,437 -$0.83
Display Case Lighting Control $4,683 $0.059 $5,173 $0.065 $182,220 $3.17 $0 $0.000 -$172,364 -$2.18
Heat Reclaim $40,954 $0.517 $19,101 $0.241 $257,436 $4.39 $37,708 $0.057 -$159,673 -$2.78
CTZ12 – Sacramento (Sacramento Executive Airport)
Floating Head Pressure $17,002 $0.215 $12,535 $0.158 $139,958 $2.29 $4,917 $0.007 -$105,504 -$1.64
Condenser Specific Efficiency $3,901 $0.049 $0 $0.000 $17,493 $0.29 $0 $0.000 -$13,592 -$0.17
Floating Suction Pressure $2,489 $0.031 $5,969 $0.075 $61,459 $0.93 $0 $0.000 -$53,001 -$0.67
Mechanical Subcooling $4,114 $0.052 $4,775 $0.060 $72,075 $1.00 $0 $0.000 -$63,185 -$0.80
Display Case Lighting Control $4,683 $0.059 $5,173 $0.065 $184,090 $3.21 $0 $0.000 -$174,234 -$2.20
Heat Reclaim $40,954 $0.517 $19,101 $0.241 $399,091 $6.60 $37,708 $0.057 -$301,328 -$4.98
CTZ13 – Fresno
Floating Head Pressure $17,002 $0.215 $12,535 $0.158 $133,652 $2.19 $4,917 $0.007 -$99,198 -$1.55
Condenser Specific Efficiency $3,901 $0.049 $0 $0.000 $21,812 $0.36 $0 $0.000 -$17,911 -$0.23
Floating Suction Pressure $2,489 $0.031 $5,969 $0.075 $63,559 $0.96 $0 $0.000 -$55,101 -$0.70
Mechanical Subcooling $4,114 $0.052 $4,775 $0.060 $77,962 $1.08 $0 $0.000 -$69,072 -$0.87
Display Case Lighting Control $4,683 $0.059 $5,173 $0.065 $187,412 $3.29 $0 $0.000 -$177,556 -$2.24
Heat Reclaim $40,954 $0.517 $19,101 $0.241 $331,549 $5.52 $37,708 $0.057 -$233,786 -$3.90

Page 18
2013 California Building Energy Efficiency Standards October 2011
Measure Cost Maintenance Cost TDV Cost Savings Refrigerant Cost Life Cycle Cost
($) ($/SF) ($) ($/SF) ($) ($/SF) ($) ($/SF) ($) ($/SF)
CTZ14 – Palmdale
Floating Head Pressure $17,002 $0.215 $12,535 $0.158 $146,744 $2.38 $4,917 $0.007 -$112,291 -$1.74
Condenser Specific Efficiency $3,901 $0.049 $0 $0.000 $21,694 $0.36 $0 $0.000 -$17,793 -$0.22
Floating Suction Pressure $2,489 $0.031 $5,969 $0.075 $61,882 $0.93 $0 $0.000 -$53,424 -$0.67
Mechanical Subcooling $4,114 $0.052 $4,775 $0.060 $75,368 $1.04 $0 $0.000 -$66,479 -$0.84
Display Case Lighting Control $4,683 $0.059 $5,173 $0.065 $182,442 $3.20 $0 $0.000 -$172,586 -$2.18
Heat Reclaim $40,954 $0.517 $19,101 $0.241 $358,692 $5.91 $37,708 $0.057 -$261,007 -$4.29
CTZ15 - Palm Springs
Floating Head Pressure $17,002 $0.215 $12,535 $0.158 $113,670 $1.85 $4,917 $0.007 -$79,217 -$1.20
Condenser Specific Efficiency $3,901 $0.049 $0 $0.000 $33,395 $0.55 $0 $0.000 -$29,494 -$0.37
Floating Suction Pressure $2,489 $0.031 $5,969 $0.075 $69,995 $1.06 $0 $0.000 -$61,538 -$0.78
Mechanical Subcooling $4,114 $0.052 $4,775 $0.060 $101,004 $1.40 $0 $0.000 -$92,115 -$1.16
Display Case Lighting Control $4,683 $0.059 $5,173 $0.065 $191,788 $3.36 $0 $0.000 -$181,932 -$2.30
Heat Reclaim $40,954 $0.517 $19,101 $0.241 $44,962 $1.07 $37,708 $0.057 $52,653 $0.55
Economic analysis results for the CO2 secondary (indirect) or cascade cooling measure, below:
Measure Cost ($)
Refrigerant Cost Savings Range ($) TDV Cost
Savings ($)
Life-Cycle Cost Range ($)
Low High Low High
Small Supermarket $50,000 $70,643 $95,690 $0 -$20,643 -$45,690
Large Supermarket $120,000 $355,174 $480,615 $0 -$235,174 -$360,615
j. Analysis Tools None. All measures are mandatory measures so no simulation tools are
required for compliance.

Page 19
2013 California Building Energy Efficiency Standards October 2011
k. Relationship to Other
Measures
Many of the subject energy efficiency measures are highly inter-
dependent. The analysis methodology for inter-dependent measures was
designed to ensure that the results would appropriately reflect the
incremental costs and benefits, with the most commonly used and cost-
effective measures being incorporated in the ―baseline‖ for the measures
that were less commonly used or potentially less cost-effective.
Floating head pressure with variable speed condenser fans and
variable-setpoint (ambient following) control strategy was used as the
basis of comparison for the condenser specific efficiency measure.
For the analysis of the mechanical subcooling measure, floating
head pressure to 70°F SCT was assumed as the basis of comparison,
rather than fixed (higher) head pressure to avoid overstating the
benefit of liquid subcooling.
The heat reclaim measure was evaluated with floating head
pressure to 70°F in the baseline case to capture the trade-off in
increased compressor energy associated with the use of a heat
recovery holdback valve—which is necessary to achieve substantial
heat recovery.

Page 20
2013 California Building Energy Efficiency Standards October 2011
3. Methodology This section provides a description of the methodology used to evaluate the various supermarket
refrigeration measures under consideration of the 2013 code change cycle. Topics in this section
include:
Supermarket Prototype Definitions
Simulation and Cost Effectiveness Methodology
Direct Refrigerant Emissions Calculation Methodology
Acceptance Test Methodology
Stakeholder Meeting Process
3.1 Supermarket Prototype Definitions Prototype supermarket models were developed to estimate the cost effectiveness of the proposed Title
24 supermarket standards addressed in this report. Three supermarket prototypes were developed: a
small supermarket, a large supermarket, and a ―big-box‖ food store utilizing large ―point of sale‖
refrigeration boxes with display doors. The prototypes were developed based on over 10 years of
Savings By Design data.
Savings By Design is a design assistance and incentive program offered by utilities in California,
including an initiative specifically focused on supermarkets and refrigerated warehouses since 2001.
Under this program, several hundred supermarkets have been evaluated using whole-building
simulation focused on refrigeration measures, as well as receiving incentives following post-
installation field inspections. Information obtained from this program provided a detailed
understanding of current industry practice.
Refrigeration system types and equipment, design loads, refrigerants, operating schedules, and control
strategies for this analysis were obtained from the Base Case criteria used in the California Savings
By Design program. 2008 Title 24 requirements for envelope, lighting, and HVAC systems, as well
as federal walk-in standards were also used to develop the prototype assumptions.
Several refrigeration system configurations were identified, sufficient to cover most of the designs
used for supermarkets, for analysis of the proposed measures. Appendix B contains schematics of
each system type, while Appendix C describes the refrigeration, HVAC, lighting, and envelope
assumptions for each prototype. Figure 1 lists the three prototype supermarket sizes.
Analysis Prototype Area
(Square Feet)
Prototype 1 Small Supermarket 10,000
Prototype 2 Large Supermarket 60,700
Prototype 3 Big Box Food Store 150,000
Figure 1: Prototype supermarket summary
Each refrigeration measure evaluated in this analysis was applied to all three prototypes (unless
otherwise noted in Section 4). In addition, each prototype was developed with three different
condenser types and two different compressor system configurations. To designate each combination
of prototype supermarket, condenser type and compressor system type, a three-letter designation was
employed throughout this report, as described in Figure 2.

Page 21
2013 California Building Energy Efficiency Standards October 2011
Supermarket
Prototype Condenser Type
Compressor
System Designation
Small Supermarket
Air-cooled Central SAC
Distributed SAD
Evaporative cooled Central SEC
Water-cooled condenser with
water-cooled fluid cooler
Central SFC
Distributed SFD
Large Supermarket
Air-cooled Central MAC
Distributed MAD
Evaporative cooled Central MEC
Water-cooled condenser with
water-cooled fluid cooler
Central MFC
Distributed MFD
Big Box Store
Air-cooled Central LAC
Distributed LAD
Evaporative cooled Central LEC
Water-cooled condenser with
water-cooled fluid cooler
Central LFC
Distributed LFD
Figure 2: Size and system description for analysis prototypes
3.2 Energy Analysis and Cost Effectiveness Methodology The energy usage for each supermarket prototype was evaluated using DOE-2.2R energy simulation
software. The DOE-2.2R version used (2.2R) is a sophisticated component-based energy simulation
program that can accurately model the building envelope, lighting systems, HVAC systems, and
refrigeration systems—including the complex interaction between refrigerated supermarket display
cases and the surrounding indoor environment. The 2.2R version is specifically designed to include
refrigeration systems, using refrigerant properties, mass flow and component models to accurately
describe refrigeration system operation and controls system effects.
Measures under consideration for the 2013 code change cycle were evaluated in ten different climate
zones:
CTZ01 - Arcata
CTZ03 – Oakland
CTZ05 – Santa Maria
CTZ07 – San Diego (Lindbergh Field)
CTZ08 - Fullerton
CTZ10 – Riverside
CTZ12 – Sacramento (Sacramento Executive Airport)
CTZ13 – Fresno
CTZ14 – Palmdale
CTZ15 – Palm Springs

Page 22
2013 California Building Energy Efficiency Standards October 2011
Climate zones were selected to cover a sufficient diversity of California climates to represent the
sensitivity of supermarket refrigeration measures to climatic differences. Not all measures were
simulated in all climate zones, where the rigor of performing individual climate zone analysis was not
necessary. The subject climate zones for each measure are described in Section 4.
The cost-effectiveness of the proposed measures was calculated using the Life Cycle Costing (LCC)
Methodology prepared by the California Energy Commission. According to the LCC methodology, a
measure is considered cost-effective if the net present value of energy savings exceeds the
implementation cost of the measure (if the Benefit/Cost (BC) ratio is greater than one). The net
present value of the energy savings was quantified using the Time Dependent Valuation (TDV)
methodology, which assigns an energy cost to each hour of the year in order to capture the actual cost
of energy to users, to the utility systems, and to society—which is different depending on the time of
the day, week, and year that the energy is consumed. TDV multipliers are statistically correlated to
the weather files used in the simulation, the energy market, estimated escalation rates, and other
factors. A unique set of TDV energy values was used for each weather file. Measure costs are equal
to the material costs, freight cost, sales taxes, labor costs, and tool rental costs associated with
installing and commissioning the equipment or material embodied by the measure, minus the same
costs associated with the equipment or material embodied by the Base Case.
The Base Case assumptions concerning load, facility operations and other factors are held constant,
with the only changes being those specific equipment changes or control strategies associated with
each measure. Some measures involve adjustments to the Base Case in order to properly evaluate the
energy savings. These ―Baseline‖ adjustments are described in Section 4, as applicable.
3.3 Statewide Energy Savings Estimate The statewide energy savings estimates for the proposed measures are calculated by multiplying the
savings per square foot for each measure with the forecasted 2014 supermarket new construction
square footage provided by the CEC (shown in Figure 3). Details associated with the nonresidential
construction forecast data are included in Appendix K.
In the forecasted new construction data, supermarkets fall into the ―food‖ building category.
However, according to the CEC, the ―food‖ category includes ―Food and Beverage Stores,‖ and
―Gasoline Stations,‖ respectively. 2007 US Census data was used to estimate the portion of
forecasted new construction floor space that will be supermarket space subject to the proposed
standards.. The census data showed that 58% of total sales from the ―food‖ category were from
supermarkets (excluding convenience stores and gasoline stations). Therefore, it was assumed that
supermarkets account for 58% of the total 2014 new construction square footage.
CZ
“Food” Category
New Construction SF
Assumed Supermarket
New Construction SF
1 25,423 14,745
2 164,614 95,476
3 512,331 297,152
4 408,136 236,719
5 79,245 45,962
6 685,183 397,406
7 949,209 550,541

Page 23
2013 California Building Energy Efficiency Standards October 2011
8 838,656 486,421
9 1,804,297 1,046,493
10 524,087 303,970
11 310,350 180,003
12 1,213,309 703,719
13 672,035 389,781
14 127,392 73,888
15 45,319 26,285
16 149,574 86,753
Total 8,509,163 4,935,315
Figure 3: 2014 Supermarket new construction in California climate zones
Statewide energy savings are computed for each of the three supermarket prototypes (Figure 1), and
overall statewide savings are calculated by summing up measure level savings from all three
prototypes. History data from SCE‘s Savings by Design utility incentive program from 2002 to 2010
was utilized to estimate the expected percentage of supermarket new construction that is comprised of
supermarkets that are similar to each of the three prototypes. The data suggests that small
supermarkets, large supermarkets, and big box food stores respectively account for approximately
11%, 53% and 36% of the supermarket population. The forecasted new construction population was
assumed to match this trend. For each prototype supermarket, the statewide energy savings are
calculated for each measure.
3.4 Direct Refrigerant Emissions Calculations In cases where energy efficiency measures are expected to impact refrigerant charge size and/or leak
rates, thereby impacting the refrigeration system‘s annual emissions of high-global warming potential
(GWP) refrigerants, analyses were undertaken to quantify these impacts and assess the measure based
on net cost and greenhouse gas (GHG) benefit. This was performed by (1) quantifying the direct
(refrigerant) and indirect (energy) emission impact associated with the measures on a carbon-
equivalent basis, and (2) quantifying the dollar savings of the measures based on measure cost,
refrigerant cost, and TDV energy cost. Note that the energy costs and refrigerant costs also account
for the monetized GHG impacts associated with energy consumption and refrigerant emissions. 1
3.4.1 Base case refrigerant charge description
Charge size and leak rate assumptions were developed for each base case store, as summarized in
Figure 4. For leak rates, a reasonable range was identified for each store type, due to the high
variability. Leak rates assumptions also reflect the anticipated average leak rate of supermarkets in
California following the implementation of ARB‘s recently adopted Refrigerant Management
1 Carbon costs associated with refrigerant emissions were incorporated into the cost analysis using CEC price forecasts for annual carbon costs ($/ton) in
2014 ($19.87) through 2029 ($79.00), based on an assumed 15-year lifetime of equipment. Environmental externalities (i.e., carbon
costs) associated with energy consumption were incorporated into the cost analysis per the methodology described in CEC‘s Life-Cycle Cost
Methodology (2011), available at: www.energy.ca.gov/title24/2013standards/prerulemaking/documents/general _cec_documents/2011-01-14_LCC_Methodology_2013.pdf

Page 24
2013 California Building Energy Efficiency Standards October 2011
Program.2 Average GWP values of 3,922 and 3,985 were assumed for R-404A and R-507
respectively in all base case system configurations, based on the IPCC Fourth Assessment Report
(2008). Appendix E: Charge Size and Leak Rate Assumptions for Direct Emissions provides a
thorough description of the methodology used to develop these assumptions.
Base Case Store Charge Size (kg) Leak Rate
Lower Bound Upper Bound
SAC 330 10% 15%
SAD 165 5% 10%
SEC 360 10% 15%
SFC 200 10% 15%
SFD 100 5% 10%
MAC 1,660 10% 15%
MAD 830 5% 10%
MEC 1,825 10% 15%
MFC 995 10% 15%
MFD 500 5% 10%
LAC 2,000 10% 15%
LAD 1,000 5% 10%
LEC 2,200 10% 15%
LFC 1,200 10% 15%
LFD 600 5% 10%
Figure 4: Base case charge size and leak rate assumptions
3.4.2 Direct emissions methodology
The following energy efficiency measures have direct emissions impacts.
Floating head pressure
With regard to direct (refrigerant) emissions, the analysis allowed for an increase in refrigerant charge
of 5% for systems with air-cooled condensers,3 due to seasonal change in ambient temperature and the
need for sufficient charge on cold days when floating head pressure on certain systems may result in
greater system charge, most commonly due to higher evaporator operating charge due to lower mass
2 The ARB Initial Statement of Reasons (ISOR) for Proposed Regulation for the Management of High Global Warming Potential
Refrigerants for Stationary Sources (2009) states that existing facilities, which use ―business as usual‖ equipment design and
installation practices can be expected to lower the annual refrigerant leak rate from the current 18% - 20% for supermarkets (state
average) to 10% based on more stringent inspection and maintenance practices.
3 According to some industry experts, floating head pressure may actually lead to a decrease in charge size and/or leak rate, depending on system design and climate. The assumptions used in this analysis are conservative, intended to represent a worst-case yet realistic scenario.

Page 25
2013 California Building Energy Efficiency Standards October 2011
flow and lower entering liquid temperature. Although this increase may only be observed in colder
climates, to be conservative, the assumption of a 5% increase in charge size was applied to all climate
zones.
Refrigeration heat recovery
Per the definition of the measure, refrigerant heat recovery was assumed to increase charge size by up
to 0.35 lbs/MBH of heating capacity. Additionally, refrigerant heat recovery is assumed to increase a
supermarket‘s annual refrigerant leak rate by 5% as a result of the additional equipment and piping
required to implement this measure.
CO2 secondary (indirect) or cascade cooling
Of all the proposed measures, secondary cooling systems have the most significant impact on the
charge size and annual refrigerant leak rate of a supermarket refrigeration system. This is due to the
avoided need to circulate the primary refrigerant throughout the store. For this analysis, it is assumed
that a secondary cooling system has a charge size equal to 0.81 x 10⁻³
lbs/Btu/h of the system‘s
cooling capacity and an annual leak rate of 2% - 8%. The methodology used to develop these
assumptions is provided in Appendix E: Charge Size and Leak Rate Assumptions for Direct
Emissions.
3.5 Acceptance Testing The costs for each measure include additional incremental fine-tuning and commissioning labor
during construction and start-up to achieve proper operation, as well as the additional time required
for acceptance testing of measures, which would typically be done concurrently.
Acceptance testing protocols will be developed and refined through field tests in new stores.
3.6 Stakeholder Meeting Process As part of the CASE study development process, a series of meetings with stakeholder were
conducted to present CASE Studies findings to, and solicit comments from, industry stakeholder
affected by the potential additions to the Title 24 code for supermarkets. A stakeholder list was
compiled of equipment manufacturers and distribution representatives, supermarket refrigeration
system designers and contractors, control system manufacturers, supermarket owners and operators,
utility representatives, code officials, and staff from California Energy Commission (CEC) and
California Air Resources Board (CARB).
Three stakeholder meetings were held. The first two meetings gave outlines of the proposed analysis
methodology and proposed measures. One of these was held concurrently with the 2010 Food
Marketing Institute Energy and Store Development Conference to gain broader industry involvement.
The third meeting gave cost effectiveness of proposed measures and proposed requirements. All three
gave background on current code requirements and the code revision process.
In addition, stakeholders were contacted at ASHRAE meetings and by phone.
The stakeholder meeting minutes are posted at
http://www.h-m-g.com/T24/supermarket%20refrig/supermarketrefrig.htm

Page 26
2013 California Building Energy Efficiency Standards October 2011
4. Analysis and Results Section 4 presents the measure descriptions and incremental analysis results. The objective of the
analysis is to determine requirements which are cost effective over the life of the facility and which
can be achieved with currently available technology or that which can reasonably be expected to be
available in the marketplace by the time the 2013 standard takes effect, in January 2014.
Energy savings and cost effectiveness results for the following measures are captured in this section:
Floating head pressure
Condenser specific efficiency
Floating suction pressure
Mechanical subcooling
Display case lighting control
Refrigeration heat recovery
Prohibit open upright frozen food cases
CO2 secondary (indirect) or cascade cooling
Where applicable, measure costs include the present value of maintenance costs for the analysis
period (assumed to be 15 years, based on Life Cycle Costing methodology).
Full results for each measure are presented in Appendix J. Results presented in this section are
abbreviated averages, which are presented in three parts. The first part includes averages across all
climate zones and are averaged based on prototype supermarket size and condenser type. Figure 5
shows a key for the three-letter designations used in the first part of the results tables in this section.
Three-Letter
Designation Description
SXX Average
Average of results for all small supermarket prototypes, including
air-cooled, evaporative, and fluid cooled condensers, and central
and distributed system types (SAC, SAD, SEC, SFC, and SFD)
MXX Average
Average of results for all large supermarket prototypes, including
air-cooled, evaporative, and fluid cooled condensers, and central
and distributed system types (MAC, MAD, MEC, MFC, and
MFD)
LXX Average
Average of results for all big-box food store prototypes, including
air-cooled, evaporative, and fluid cooled condensers, and central
and distributed system types (LAC, LAD, LEC, LFC, and LFD)
XAX Average
Average of all results with air-cooled condensers, including small,
large, and big-box food stores, and both central and distributed
systems (SAC, SAD, MAC, MAD, LAC, LAD)
XEX Average
Average of all results with evaporative-cooled condensers,
including small, large, and big-box food stores, and both central
and distributed systems (SEC, MEC, LEC)
XFX Average
Average of all results with water-cooled condensers, including
small, large, and big-box food stores, and both central and
distributed systems (SFC, SFD, MFC, MFD, LFC, LFD)
Figure 5: Legend for analysis results tables

Page 27
2013 California Building Energy Efficiency Standards October 2011
The second part of the results table in each section shows average results across all prototype sizes,
condenser types, and system configurations for each climate zone, and the third part shows the
absolute maximum and minimum values across all climate zones, prototype sizes, condenser types,
and system configurations.
4.1 Floating Head Pressure This measure evaluates the feasibility and cost-effectiveness of floating head pressure to 70°F with
ambient following control logic and condenser fan variable speed control. All condenser fans on all
condensers serving a common high-side were assumed to be controlled in unison (at the same speed).
The ambient following control logic sets the target SCT by adding a fixed control temperature
difference (TD) to the ambient temperature (wet bulb for evaporative-cooled and fluid cooled
condensers, or dry bulb for air-cooled condensers). The condenser fan speeds are continuously
adjusted to maintain the target SCT, with an override minimum SCT of 70°F, and an override
maximum SCT of 95°F in hot climates and 90°F for mild climates. As explained in Appendix D, two
simulation models were constructed, with the simulated equipment sized based on design criteria from
two different climate zones—a representative hot climate zone (CTZ12 – Sacramento), and a
representative mild climate zone (CTZ05 – Santa Maria). For statewide analysis, either the
representative hot-climate model or mild-climate model was simulated in each of the ten selected
climate zones.
For this measure, the ambient-following control TDs were initially simulated at the design TDs and
then checked to determine if a lower TD would increase savings. If so, the optimum TD was
determined iteratively and then increased by two degrees to avoid over-optimization of simulation
results. In actual practice, the TD is often adjusted to achieve an average condenser fan speed of 60%
to 80% when the system is operating in the control range (i.e. between the 70°F minimum and the
minimum maximum SCT) – which in most instances is close to the optimum TD, and effectively
overcomes sensor errors. Figure 6 shows the control TDs used for analysis of each of the
refrigeration system configurations and for each climate-specific prototype
Supermarket
Prototype Condenser Type System Type
Control TD
Hot-Climate
Prototypes
Cool-Climate
Prototypes
Small Supermarket
Air-cooled Central 10°F LT, 13°F MT 10°F LT, 15°F MT
Distributed 9°F LT, 12°F MT 10°F LT, 15°F MT
Evaporative Central 18°F 22°F
Fluid Cooler Central 32°F 32°F
Distributed 32°F 32°F
Large Supermarket
Air-cooled Central 10°F LT, 13°F MT 10°F LT, 15°F MT
Distributed 10°F LT, 15°F MT 10°F LT, 15°F MT
Evaporative Central 22°F 24°F
Fluid Cooler Central 32°F 33°F
Distributed 32°F 33°F
Big Box Store Air-cooled Central 10°F LT, 13°F MT 10°F LT, 15°F MT

Page 28
2013 California Building Energy Efficiency Standards October 2011
Distributed 8°F LT, 10°F MT 10°F LT, 15°F MT
Evaporative Central 16°F 22°F
Fluid Cooler Central 32°F 32°F
Distributed 32°F 32°F
Figure 6: Summary of ambient following control TDs for SCT control measure
The Base Case operation assumes a fixed 85°F saturated condensing temperature (SCT) setpoint for
small supermarket prototypes, and a fixed 80°F SCT setpoint for Large Supermarkets and Big Box
Food store prototypes, based on observations that smaller systems are more likely to operate at higher
head pressures and are less likely to be subject to chain specifications and automated setpoint
monitoring.
4.1.1 Analysis results by climate zone
Energy analysis results
Figure 6 below summarizes the energy results for the floating head pressure measure simulated in all
ten climate zones:
Energy
Savings
(kWh)
Energy
Savings/ SF
(kWh)
TDV Cost
Savings ($)
TDV Cost
Savings /SF
($)
Measure
Cost plus
Maintenance
Cost ($)
SXX Average 25,989 1.64 $49,532 $3.13 $13,923
MXX Average 94,194 1.58 $162,842 $2.73 $35,251
LXX Average 121,870 0.75 $212,155 $1.31 $39,436
XAX Average 124,636 2.08 $222,211 $3.80 $33,055
XEX Average 50,565 0.76 $97,711 $1.60 $27,191
XFX Average 51,792 0.85 $82,707 $1.38 $27,191
All Averages
CTZ01 - Arcata 91,871 1.49 $165,461 $2.700 $29,537
CTZ03 – Oakland 81,873 1.34 $148,540 $2.441 $29,537
CTZ05 – Santa Maria 84,642 1.39 $153,901 $2.532 $29,537
CTZ07 – San Diego 68,631 1.16 $130,996 $2.208 $29,537
CTZ08 - Fullerton 75,743 1.27 $150,307 $3.129 $29,537
CTZ10 – Riverside 79,688 1.31 $131,868 $2.165 $29,537
CTZ12 – Sacramento 83,625 1.37 $139,958 $2.294 $29,537
CTZ13 – Fresno 80,300 1.32 $133,652 $2.194 $29,537
CTZ14 – Palmdale 90,771 1.47 $146,744 $2.382 $29,537
CTZ15 – Palm Springs 69,697 1.13 $113,670 $1.848 $29,537

Page 29
2013 California Building Energy Efficiency Standards October 2011
Maximum 204,068 2.91 $392,707 $9.979 $44,484
Minimum 6,039 0.18 $14,257 $0.267 $13,040
Figure 7: Energy analysis results for floating head pressure measure
Refrigerant analysis results
Impacts on the R-404A/R-507 refrigerant charge size and leak rate were also analyzed for this
measure. Figure 8 summarizes the results of this analysis in terms of refrigerant emissions in pounds.
Note that refrigerant emissions are assumed to be independent of the design climate zone.
Annual Refrigerant Savings (Range)
Pounds
Low High
SXX Average -1 -1
MXX Average -7 -5
LXX Average -9 -6
XAX Average -15 -9
XEX Average 0 0
XFX Average 0 0
All Average -6 -4
Figure 8: Refrigerant analysis results for floating head pressure measure
GHG analysis results
Figure 9 summarizes the impact of GHG emissions associated with both direct (refrigerant) and
indirect (energy) emissions (shown in metric tons of carbon dioxide equivalent [MTCO2eq]).
Annual Refrigerant Savings
(Range)
Annual Energy
Savings Net Annual Savings (Range)
MTCO2eq MTCO2eq
MTCO2eq
Low High Low High
SXX Average -3 -2 11 8 9
MXX Average -13 -8 38 25 30
LXX Average -16 -10 50 34 40
XAX Average -26 -16 51 25 34
XEX Average 0 0 21 21 21
XFX Average 0 0 21 21 21

Page 30
2013 California Building Energy Efficiency Standards October 2011
All Average
CTZ01 - Arcata -11 -7 37 27 31
CTZ03 – Oakland -11 -7 33 23 27
CTZ05 – Santa Maria -11 -7 35 24 28
CTZ07 – San Diego -11 -7 28 17 21
CTZ08 - Fullerton -11 -7 31 20 24
CTZ10 – Riverside -11 -7 32 22 26
CTZ12 – Sacramento -11 -7 34 24 28
CTZ13 – Fresno -11 -7 33 22 26
CTZ14 – Palmdale -11 -7 37 26 30
CTZ15 – Palm Springs -11 -7 28 18 22
Maximum Net Savings Across All Store Simulations 63 73
Minimum Net Savings Across All Store Simulations -2 2
Figure 9: GHG analysis results for floating head pressure measure
Savings analysis results
Figure 10 summarizes the net impacts of this measure on lifetime costs. Note that the energy cost
savings and refrigerant cost savings account for the monetized GHG impacts associated with energy
consumption and refrigerant emissions, based on the CEC price forecasts for annual carbon costs.
Measure
Cost ($)
Refrigerant Cost
Savings Range ($) TDV Cost
Savings ($)
Net Lifetime Savings
Range ($)
Benefit/Cost Ratio
Range ($)
Low High Low High Low High
SXX Average $13,923 -$1,495 -$934 $49,532 $34,114 $34,675 3.21 3.33
MXX Average $35,251 -$7,521 -$4,617 $162,842 $120,070 $122,973 3.81 4.08
LXX Average $39,436 -$9,190 -$5,744 $212,155 $163,529 $166,976 4.36 4.70
XAX Average $33,055 -$15,171 -$9,413 $222,211 $173,985 $179,744 4.61 5.23
XEX Average $27,191 $0 $0 $97,711 $70,520 $70,520 3.59 3.59
XFX Average $27,191 $0 $0 $82,707 $55,516 $55,516 3.04 3.04
All Average
CTZ01 - Arcata $29,537 -$6,068 -$3,765 $165,461 $129,856 $132,159 4.65 4.97
CTZ03 – Oakland $29,537 -$6,068 -$3,765 $148,540 $112,935 $115,239 4.17 4.46
CTZ05 – Santa Maria $29,537 -$6,068 -$3,765 $153,901 $118,296 $120,599 4.32 4.62
CTZ07 – San Diego $29,537 -$6,068 -$3,765 $130,996 $95,390 $97,694 3.68 3.93
CTZ08 - Fullerton $29,537 -$6,068 -$3,765 $150,307 $114,701 $117,005 4.22 4.51

Page 31
2013 California Building Energy Efficiency Standards October 2011
CTZ10 – Riverside $29,537 -$6,068 -$3,765 $131,868 $96,263 $98,566 3.70 3.96
CTZ12 – Sacramento $29,537 -$6,068 -$3,765 $139,958 $104,352 $106,656 3.93 4.20
CTZ13 – Fresno $29,537 -$6,068 -$3,765 $133,652 $98,047 $100,351 3.75 4.01
CTZ14 – Palmdale $29,537 -$6,068 -$3,765 $146,744 $111,139 $113,443 4.12 4.41
CTZ15 – Palm Springs $29,537 -$6,068 -$3,765 $113,670 $78,065 $80,368 3.19 3.41
Maximum Net Savings Across All Store Simulations $336,736 $342,480 7.02 7.82
Minimum Net Savings Across All Store Simulations $1,217 $1,217 1.09 1.09
Figure 10: Cost savings results for floating head pressure measure
The results indicate that the measure is cost-effective for all system configurations and all climate
zones even though the direct GHG impacts associated with increased refrigerant emissions slightly
reduce the net climate benefits and cost savings of this measure. The code recommendation is a
mandatory minimum head pressure of 70°F with variable-speed condenser fan control with ambient-
following setpoint control.
Wetbulb sensor reliability is a concern for ambient-following control of evaporative condensers.
Wetbulb sensors (in practice normally a drybulb sensor and humidity sensor are used to derive WBT)
generally lose drift or lose calibration over time. Figure 72 in Appendix F explores the cost savings
with varying control TDs for evaporative condensers, to analyze the sensitivity of savings and
economics vs. sensor calibration. The analysis determined that ambient-following control remains
cost-effective even with significant sensor error.
4.2 Condenser Specific Efficiency The cost-effectiveness of implementing a minimum condenser specific efficiency requirement was
evaluated for both air-cooled and evaporative-cooled condensers. Condenser specific efficiency is the
condenser Total Heat of Rejection (THR) capacity divided by the input electric power at 100 percent
fan speed (including spray pump electric input power for evaporative condensers) at standard
conditions. Figure 11 describes the two condenser types used for in the analysis.
Condenser Category Condenser Type for Analysis
Evaporative-Cooled Centrifugal-fan halocarbon condenser, for location indoors or
outdoors, with integral spray pump.
Air-Cooled Axial-fan halocarbon condenser for outdoor location.
Figure 11: Condenser description for specific efficiency measure
A direct correlation between cost and specific efficiency could not be directly determined from
manufacturer‘s catalog information, as manufacturing cost is not proportionately reflected in model-
by-model sell price for these units. An alternative method was employed to establish the minimum
cost-effective condenser specific efficiency, which is more consistent with how manufacturers could
comply with an efficiency standard, with the least difficulty, in terms of product redesign. In general,
specific efficiency is improved by reducing the fan power for a given condenser.
Condenser fan power reduces by approximately the ―third-power‖ of fan speed reduction whereas
condenser capacity is roughly linear (or better than linear) with reduction in fan speed. Manufacturers

Page 32
2013 California Building Energy Efficiency Standards October 2011
stated that both air-cooled and evaporative-cooled condensers generally have flexibility in fan design
and speed and thus motor power. In particular, the maximum speed for air-cooled condensers using
variable speed EC (electronically commutated; also called brushless DC or BLDC) motors can easily
be reprogrammed at the factory, making specific efficiency essentially a ‗settable‘ parameter.
The air-cooled condenser data provided by one manufacturer, shown in Figure 12, showing
normalized values for heat rejection capacity, fan power, and resultant specific efficiency as a
function of fan speed, illustrates the sensitivity of specific efficiency to fan speed, with everything
else held constant. Plots of capacity and power increase reference the left scale, while the plot of
specific efficiency increase references the right scale.
Condenser Capacity and Power Versus Fan Speed
Power
y = 2.3168x3 - 2.5429x
2 + 1.4568x - 0.2377
R2 = 0.9993
Capacity
y = 0.196x3 - 0.7293x
2 + 1.5329x - 0.0002
R2 = 1
0%
10%
20%
30%
40%
50%
60%
70%
80%
90%
100%
30.0% 40.0% 50.0% 60.0% 70.0% 80.0% 90.0% 100.0%
Speed (%)
Ca
pa
cit
y a
nd
Po
we
r (%
)
0%
200%
400%
600%
800%
1000%
1200%
Sp
ec
ific
Eff
icie
nc
y (
%)
Capacity Power Specific Efficiency
Normalized Speed: 100% 90% 80% 70% 60% 50% 40% 30%
Normalized Capacity: 100% 93% 86% 78% 70% 61% 51% 40%
Normalized Power: 100% 69% 49% 34% 23% 14% 8% 4%
Normalized Specific Efficiency: 100% 135% 177% 231% 308% 434% 655% 1,044%
Figure 12: Example normalized condenser capacity and power versus normalized speed
Figure 12 shows that the relationship between % fan speed and % condenser capacity is nearly linear
while fan power is subject to the fan affinity laws, which state that % fan power exhibits a ―third
power‖ relationship with % fan speed. Consequently, specific efficiency increases exponentially at
reduced fan speed. Without substantial product line changes manufacturers could utilize this
relationship by reducing or limiting the full-load fan speed and motor power of any non-compliant
condensers to a speed which achieves the required efficiency, thus still being able to market the
condenser, with a revised capacity listing.
In many instances improvements could also be made with higher efficiency motors, fan blades, or fan
venturis. This appears to be the most likely path for certain air-cooled halocarbon condensers which
utilize inefficient motors. The methodology described above is considered the most conservative with

Page 33
2013 California Building Energy Efficiency Standards October 2011
respect to measure cost, and also an approach that could be adopted without major product line
changes or ―tooling‖ difficulty for smaller manufacturers.
A comparable method was employed to calculate measure cost for this analysis. A correlation was
performed between end-user cost and full-speed condenser Total Heat of Rejection (THR) capacity
for various condenser types, as shown in Figure 13, for axial-fan air-cooled halocarbon condensers of
two types; those with standard induction motors and those using EC motors. The correlation was
used to calculate the cost of incrementally over-sizing the condenser, and then limiting the maximum
condenser fan speed to match the capacity of the original-size condenser—to achieve the desired
increase in condenser specific efficiency.
Cost vs. Capacity
(Air-Cooled Halocarbon)
y = 40.461x + 841.6
R2 = 0.7633
y = 63.721x + 486.45
R2 = 0.8417
$0
$10,000
$20,000
$30,000
$40,000
$50,000
$60,000
$70,000
$80,000
$90,000
$100,000
0 200 400 600 800 1,000 1,200 1,400
Capacity (MBH)
Co
st (
$)
Units with Non-EC Motors Units with EC Motors
Figure 13: Condenser cost versus MBH capacity at specific-efficiency rating conditions
The table in Figure 14 demonstrates the preceding analytical approach for air-cooled axial-fan
halocarbon condensers—with a beginning full-speed capacity of 564 thousand Btus per hour (MBH)
and a beginning specific efficiency of 53 (Btu/h)/W. A 5% increase in condenser size changes
specific efficiency from 53 to 65 (Btu/h)/W—a 23% increase.
%
incremental
increase in
condenser
size
Capacity of
larger
condenser at
100% speed
(MBH)
Power of larger
condenser at
100% speed at
original specific
efficiency (kW)
Required %
capacity of
oversized
condenser to match
original capacity
Maximum speed of
new condenser to
match original
capacity
Power at
reduced
maximum
speed (kW)
New
Specific
Efficiency
((Btu/h)/W)
0% 564 10.6 100% 100% 10.6 53
1% 570 10.8 99% 99% 10.2 55

Page 34
2013 California Building Energy Efficiency Standards October 2011
2% 575 10.9 98% 97% 9.8 58
3% 581 11.0 97% 96% 9.4 60
4% 587 11.1 96% 94% 9.1 62
5% 592 11.2 95% 93% 8.7 65
Figure 14 Example of increasing condenser size and resultant specific efficiency
A DOE2.2R simulation was used to calculate prototype building energy usage and TDV energy cost
with varying condenser specific efficiency (condenser fan power was adjusted, with all other
parameters held constant). Figure 15 shows the simulation results for the large supermarket prototype
with air-cooled condensers in the CTZ12-Sacramento climate zone.
Figure 15: System energy usage and TDV energy cost versus specific efficiency
The simulation results, condenser costs, and incremental-oversize analysis were combined to
determine the most cost-effective condenser specific efficiency—defined as the efficiency at which
further incrementally increasing the condenser size is no longer cost-effective.
For this measure, the prototype supermarkets were simulated with a 70°F minimum condensing
temperature with an ambient-following control strategy and variable speed control of all condenser
fans. DOE-2.2R simulation keywords explicitly apply the subject control strategy.
The assumed specific-efficiency rating basis is 95°F ambient drybulb temperature and 105 °F
saturated condensing temperature for air-cooled condensers, and 70°F ambient wetbulb temperature
and 100°F saturated condensing temperature for evaporative condensers.

Page 35
2013 California Building Energy Efficiency Standards October 2011
4.2.1 Incremental analysis results
For each evaluated condenser type, the condenser specific efficiency was incrementally increased
until the cost-effectiveness of subsequent incremental improvements was no longer justified (based on
Life-Cycle Costing methodology). The final specific efficiency increment became the proposed
specific efficiency. The preliminary analysis was evaluated in climate zones CTZ05 (Santa Maria),
and CTZ12 (Sacramento). Figure 16 summarizes the results from the preliminary analysis.
Condenser Type
Cost-effective minimum
specific efficiency
((Btu/h)/W)
Basis of comparison for
incremental analysis
((Btu/h)/W)
Base Case specific efficiency for
statewide analysis
((Btu/h)/W)
Air-Cooled 65 (Btu/h)/W 55 (Btu/h)/W 53 (Btu/h)/W
Evaporative-Cooled 160 (Btu/h)/W 140 (Btu/h)/W 155 (Btu/h)/W
Figure 16: Preliminary condenser specific efficiency results
The base case specific efficiency for statewide savings analysis listed in Figure 16 is the average of
condensers installed on new supermarket projects in California between 2006 and 2010 (those which
were below the cost-effective specific efficiency), obtained from Savings By Design new construction
projects. The data for the statewide analysis base case is included in Appendix G.
4.2.2 Analysis of results by climate zone
Figure 17 below summarizes the simulation results for the condenser specific efficiency measure
simulated in all ten climate zones:
Energy
Savings
(kWh)
Energy
Savings/
SF
(kWh)
TDV Cost
Savings ($)
TDV Cost
Savings /SF
($)
Measure
Cost plus
Maintenance
Cost ($)
Benefit/
Cost
Ratio
SXX Average 2,282 0.13 $14,214 $0.87 $1,656 26.54
MXX Average 7,483 0.12 $20,161 $0.33 $3,599 13.45
LXX Average 8,728 0.06 $27,115 $0.18 $5,696 9.35
XAX Average 7,069 0.12 $23,949 $0.53 $5,526 6.54
XEX Average 3,529 0.05 $9,055 $0.22 $795 50.13
XFX Average 2,282 0.13 $14,214 $0.87 $1,656 26.54
All Averages
CTZ01 - Arcata 1,507 0.028 $3,353 $0.06 $3,571 3.72
CTZ03 – Oakland 2,181 0.040 $5,533 $0.10 $3,571 4.29
CTZ05 – Santa Maria 2,438 0.040 $4,569 $0.08 $3,571 4.01
CTZ07 – San Diego 2,937 0.054 $6,586 $0.12 $3,571 4.65
CTZ08 - Fullerton 3,268 0.058 $10,472 $0.18 $3,901 5.21
CTZ10 – Riverside 5,353 0.093 $19,110 $0.32 $3,901 6.94
CTZ12 – Sacramento 4,540 0.079 $17,493 $0.29 $3,901 6.55

Page 36
2013 California Building Energy Efficiency Standards October 2011
CTZ13 – Fresno 6,692 0.114 $21,812 $0.36 $3,901 7.47
CTZ14 – Palmdale 6,629 0.113 $21,694 $0.36 $3,901 7.15
CTZ15 – Palm Springs 13,409 0.225 $33,395 $0.55 $3,901 10.32
Maximum 26,006 0.35 $ 66,062 $ 0.86 $ 9,862 24.70
Minimum 386 0.01 $ 756 $ 0.02 $ 79 0.32
Figure 17: Energy analysis summary for condenser specific efficiency measure by climate zone
The specific efficiency requirements are generally cost-effective in warmer climate zones: CTZ08 -
Fullerton, CTZ10 - Riverside, CTZ12 - Sacramento, CTZ13 - Fresno, CTZ14 - Palmdale, and CTZ15
- Palm Springs. Note that outdoor halocarbon air-cooled condensers equipped with brushless DC
(BLDC) motors were considered as well as condensers with ―standard‖ induction motors. Nearly all
air-cooled halocarbon condenser manufacturers offer condensers with BLDC fan motors, which are
more expensive but have the advantage of inherently variable-speed with the application of a control
signal, eliminating the need for a variable speed drive. As noted previously, for these condensers the
maximum speed (and therefore the specific efficiency) is effectively a factory-settable parameter.
Four climate zones have a Benefit/Cost (BC) ratio less than 1.0 for air-cooled BLDC condensers in
some store sizes (see Appendix J for full cost results). In one climate zone, Arcata, BLDC equipped
air-cooled condensers are not cost-effective for any prototype or configuration.
Because condensers can be purchased with standard fan motors (i.e. using BLDC motors is an
elective design choice) and be cost effective at the proposed specific efficiency level in all climate
zones, the examples below BC=1.0 does not justify establishing climate-specific exceptions to the
standard.
An important observation is that several manufacturers have recently introduced new air-cooled
condensers using ―micro-channel‖ heat exchanger surface. This is a major technology change which
is currently evolving. Initial information indicates these condensers will have markedly higher
specific efficiencies than the current condenser designs; particularly better than the condensers using
EC motors with standard condenser surface, which generally were found to have the lowest specific
efficiency of all air-cooled condensers. Assuming the micro-channel condensers become dominant in
the market, the proposed condenser efficiency will potentially be met quite easily and at lower cost
than the assumptions in this study.
Some configurations and condensing types were shown to be not cost-effective in cooler climate
zones. Figure 18 shows the analysis results for prototypes, system configurations, and condenser
types that had Benefit/Cost ratios less than one. The results in Figure 18 exclude air-cooled
condensers with BLDC motors, for reasons previously mentioned.
Energy
Savings
(kWh)
Energy
Savings/
SF (kWh)
TDV Cost
Savings ($)
TDV Cost
Savings /SF ($)
Measure
Cost ($)
Benefit/
Cost Ratio
CTZ01 – Arcata
SAD-Non-EC 431 0.03 $979 $0.06 $1,103 0.89

Page 37
2013 California Building Energy Efficiency Standards October 2011
LAC-Non-EC 1,897 0.01 $4,414 $0.03 $5,540 0.80
LAD-Non-EC 1,334 0.01 $2,857 $0.02 $5,636 0.51
CTZ03 – Oakland
LAD-Non-EC 1,828 0.01 $4,993 $0.03 $5,636 0.89
CTZ05 – Santa Maria
LAD-Non-EC 4,759 0.03 $3,943 $0.02 $5,636 0.70
Figure 18: Analysis results for prototypes, system configurations, and condenser types with
Benefit/Cost ratios less than 1
The coldest climate zone shown in Figure 18, Arcata, has the most configurations with benefit/cost
ratios less than one. The weather in this climate zone is cool enough on average that the saturated
condensing temperature is rarely above the minimum setting for any prototype, condensing type, or
system configuration—mitigating the positive effects of increased condenser efficiency. In the
remaining two climate zones from Figure 18, the big-box store prototype with distributed compressor
suction groups and air-cooled condensers (designated LAD in the results table) is the only
configuration shown to have benefit/cost ratios less than one. Based on the example store designs
chosen as base case references, the condensers sizing for distributed systems was generally somewhat
larger (smaller TD) than central system condensers, and are therefore more lightly-loaded for most of
the year. For all prototypes and all climate zones, with all other parameters held constant, the
benefit/cost ratio for the distributed configurations are always slightly less than the central-system
counterparts. This difference is more likely artifact of the available examples than a consistent
difference in design practice for the respective condensers and systems, and thus the low benefit/cost
ratio for the single configuration in CTZ03 and CTZ05 would likely be resolved through more precise
condenser selections. On the other hand, the low cost effectiveness is seen for multiple configurations
in CTZ01.
The proposed code requirement includes minimum specific efficiencies for air-cooled and evaporative
condensers except for climate zone CTZ01. A minimum size for this requirement was considered
since fewer options are available for small condensers and the cost to manufacturers and owners to
comply with the requirements may be high compared with the small savings and small sales volume.
Condensers with a design Heat of Rejection capacity less than 150 MBH will be exempt. Very few
supermarkets would use a condenser below this size limit. In addition, a limit on condenser fin
density will be included in the proposed code language. Too-close fin spacing makes the condenser
susceptible to rapid fouling with airborne debris, sometimes irreversibly, resulting in capacity
deterioration. The fin density limitation is consistent with most chain specifications and simply
avoids the possibility of using close fin spacing as a means to meet the code requirement. Condensers
with a microchannel heat exchange surface are exempted from the fin density requirement, due to the
construction of these condensers which do not have the same fouling characteristics and/or are easier
to clean.
4.3 Floating Suction Pressure
This measure evaluates the cost-effectiveness of floating suction pressure automation for parallel
compressor groups. With fixed suction control, the suction group setpoint is maintained constantly at

Page 38
2013 California Building Energy Efficiency Standards October 2011
the lowest pressure required to meet maximum fixture cooling loads (during peak temperature,
humidity and shopper traffic) or to meet the peak walk-in loads, which are generally infrequent. With
floating suction pressure, the setpoint is automatically adjusted based on walk-in or case temperature
requirements, such that the pressure is no lower than necessary to meet the most demanding fixture or
walk-in load. Energy savings result from operating at higher saturated suction temperatures on
average, reducing lift and compressor power.
The Base Case control strategy for this measure is fixed setpoint with electronic sequencing of
compressors. The Base Case SST setpoint was assumed to be the design SST for each suction group,
minus two degrees for LT systems and four degrees for MT systems, to account for typical line losses
and the effect of normal compressor cycling; since compressor systems have finite steps of capacity,
whether they employ uneven compressors, cylinder unloaders, etc.
Figure 19 describes the design compressor groups, the design suction temperatures and the simulation
setpoints for each suction group in the refrigeration simulation study.
Supermarket Prototype Suction Group Design SST (°F) SST Setpoint (°F) for Simulation
Small Supermarket ALT -25°F -27°F
BMT 21°F 17°F
Large Supermarket
AMT 18°F 14°F
BMT 16°F 12°F
CLT -22°F -24°F
Big-Box Food Store
AMT -29°F -31°F
BLT 18°F 14°F
CMT -29°F -31°F
DLT 18°F 14°F
Figure 19: Suction group design SST and Base Case SST setpoints
To simulate the measure, the suction temperature setpoint was allowed to float high enough to meet
the most demanding load on the suction group. The suction temperature is also restricted to a
specified range. The minimum allowed suction temperature was assumed to be the Base Case suction
temperature setpoint, with a maximum float of five degrees assumed in the simulation analysis.
4.3.1 Analysis results by climate zone
The suction temperature control measure was evaluated for all system types and in all climate zones.
Figure 20 below summarizes the simulation results for the floating suction pressure measure:
Energy
Savings
(kWh)
Energy
Savings/
SF (kWh)
TDV Cost
Savings ($)
TDV Cost
Savings /SF
($)
Measure
Cost plus
Maintenance
Cost ($)
Benefit/
Cost Ratio
SXX Average 8,428 0.53 $16,508 $1.04 $5,075 3.25
MXX Average 33,799 0.57 $65,475 $1.10 $10,149 6.45
LXX Average 50,213 0.31 $98,996 $0.61 $10,149 9.75

Page 39
2013 California Building Energy Efficiency Standards October 2011
XAX Average 30,047 0.46 $60,311 $0.93 $8,458 7.13
XEX Average 26,407 0.39 $50,531 $0.75 $8,458 5.97
XFX Average 33,782 0.51 $65,240 $0.99 $8,458 7.71
All Average
CTZ01 - Arcata 28,549 0.44 $54,689 $0.841 $8,458 6.47
CTZ03 – Oakland 29,510 0.45 $57,071 $0.874 $8,458 6.75
CTZ05 – Santa Maria 29,299 0.45 $56,655 $0.868 $8,458 6.70
CTZ07 – San Diego 29,996 0.46 $58,013 $0.891 $8,458 6.86
CTZ08 - Fullerton 30,339 0.46 $58,700 $0.889 $8,458 6.94
CTZ10 – Riverside 31,196 0.47 $61,242 $0.926 $8,458 7.24
CTZ12 – Sacramento 30,864 0.47 $61,459 $0.932 $8,458 7.27
CTZ13 – Fresno 31,935 0.49 $63,559 $0.963 $8,458 7.51
CTZ14 – Palmdale 31,286 0.47 $61,882 $0.932 $8,458 7.32
CTZ15 – Palm Springs 35,156 0.53 $69,995 $1.055 $8,458 8.28
Maximum 65,726 0.74 $ 129,036 $ 1.59 $ 10,149 12.71
Minimum 6,458 0.24 $ 12,317 $ 0.47 $ 5,075 2.43
Figure 20: Savings results for floating suction pressure by climate zone
The results table shows that the minimum benefit/cost ratio for any prototype, system configuration,
or condenser type is 2.4—floating suction pressure is therefore considered cost-effective for all
system configurations and in all climate zones. This measure is minimally sensitive to climate
conditions.
The control logic for floating suction pressure is already included in nearly all supermarket rack
controllers. Furthermore, computer control of temperatures in the display cases and walk-ins is also a
standard feature. Typically, no additional hardware is required to achieve floating suction pressure
control (minimal wiring and temperature sensor costs were included in the overall measure cost to
evaluate the most expensive case). The cost for this measure primarily consists of labor costs to
commission and fine-tune the controls, plus the 15-year present value of maintenance, ongoing fine-
tuning, and setpoint verification.
The proposed code requirement consists of mandatory floating suction pressure control automation on
all systems with multiple compressors, or single compressor systems with variable capacity
capability. Since floating suction pressure can conflict with maintaining humidity in preparation
areas, and because the systems which serve preparation areas are often also used primarily for
mechanical subcooling (which is generally not compatible with floating suction pressure), the
requirement will be limited to systems with a design SST below 30°F. Exceptions will apply to
compressor groups attached primarily to secondary-loop chillers or that serve the high stage of
cascaded refrigeration system.

Page 40
2013 California Building Energy Efficiency Standards October 2011
Naturally, floating suction requires that the suction pressure control logic acts to increase the suction
pressure before the cooling effect is otherwise reduced, by operation of a liquid solenoid or the
setpoint of a suction regulator. This sort of control integration has been accomplished by most control
vendors, and is generally understood and addressed during the commissioning of floating suction
pressure control. In addition, for suction groups serving walk-in boxes with evaporator fan speed
control, the control automation would need to prioritize fan speed reduction before allowing suction
temperature to float.
4.4 Mechanical Subcooling This measure evaluates the cost-effectiveness of mechanical subcooling for the low temperature
parallel compressor systems. Mechanical subcooling involves cooling the liquid refrigerant after it
has been condensed, using capacity from a higher-temperature compressor group or by using a built-
in economizer port, which are common on low temperature scroll and screw compressors in the size
ranges typically employed in supermarkets.
For each of the refrigeration system configurations, mechanical subcooling of the low-temperature
suction group(s) was assumed to be accomplished by a medium-temperature group, with the
exception of distributed systems, which were assumed to employ scroll compressor economizer ports.
A two psi liquid pressure drop was assumed in the subcooler, and 5°F of heat gain was assumed in the
subcooled liquid line between the compressor system and the cases or walk-ins. Both the Baseline
case and the measure simulation assumed floating head pressure control of the condenser fans, with a
70°F minimum condensing temperature, ambient-following SCT control logic, and variable-speed
condenser fans.
4.4.1 Analysis results by climate zone
The mechanical subcooling measure was evaluated for all system types and in all climate zones.
Figure 21 below summarizes the simulation results for the mechanical subcooling measure:
Energy
Savings
(kWh)
Energy
Savings/
SF
(kWh)
TDV Cost
Savings ($)
TDV Cost
Savings /SF
($)
Measure
Cost plus
Maintenance
Cost ($)
Benefit/
Cost Ratio
SXX Average 9,012 0.57 $18,543 $1.17 $4,475 4.14
MXX Average 25,483 0.43 $53,461 $0.90 $7,973 6.71
LXX Average 65,849 0.41 $137,909 $0.85 $14,221 9.70
XAX Average 26,748 0.37 $64,115 $0.87 $8,694 7.37
XEX Average 26,739 0.37 $51,989 $0.71 $9,673 5.37
XFX Average 43,502 0.62 $84,818 $1.20 $8,694 9.76
All Average
CTZ01 - Arcata 28,837 0.41 $54,668 $0.772 $8,890 6.15
CTZ03 – Oakland 29,735 0.42 $58,467 $0.815 $8,890 6.58
CTZ05 – Santa Maria 29,532 0.42 $57,315 $0.800 $8,890 6.45
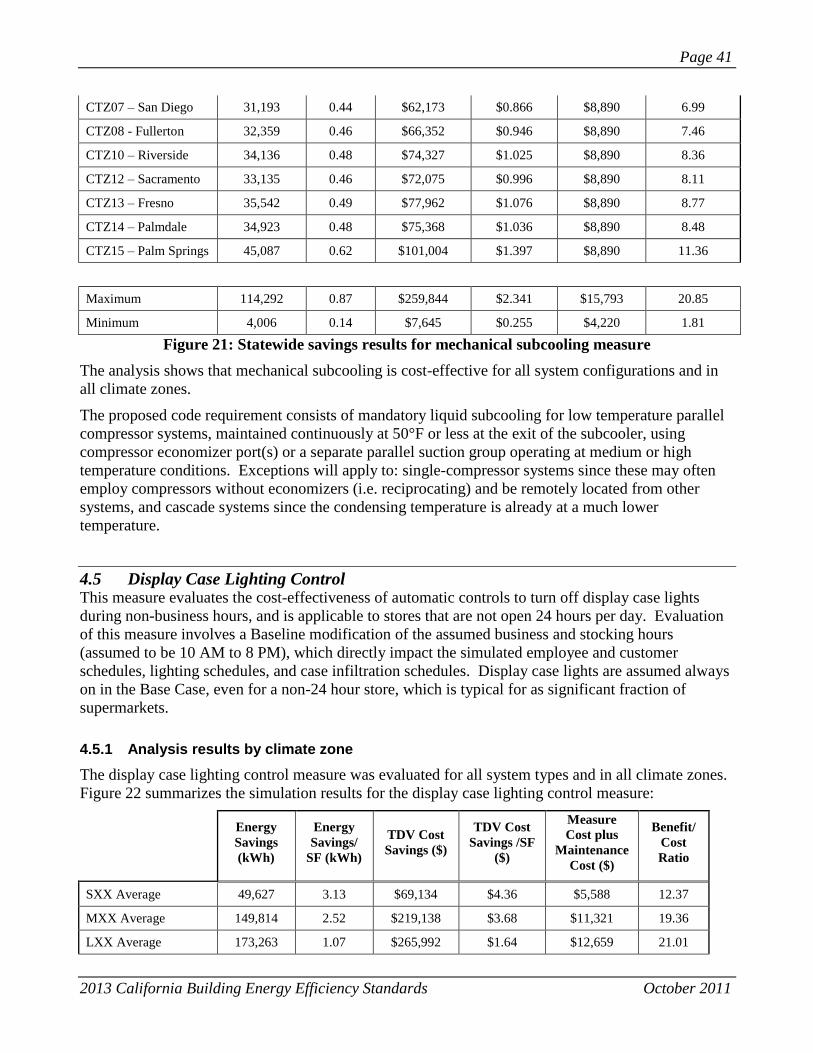
Page 41
2013 California Building Energy Efficiency Standards October 2011
CTZ07 – San Diego 31,193 0.44 $62,173 $0.866 $8,890 6.99
CTZ08 - Fullerton 32,359 0.46 $66,352 $0.946 $8,890 7.46
CTZ10 – Riverside 34,136 0.48 $74,327 $1.025 $8,890 8.36
CTZ12 – Sacramento 33,135 0.46 $72,075 $0.996 $8,890 8.11
CTZ13 – Fresno 35,542 0.49 $77,962 $1.076 $8,890 8.77
CTZ14 – Palmdale 34,923 0.48 $75,368 $1.036 $8,890 8.48
CTZ15 – Palm Springs 45,087 0.62 $101,004 $1.397 $8,890 11.36
Maximum 114,292 0.87 $259,844 $2.341 $15,793 20.85
Minimum 4,006 0.14 $7,645 $0.255 $4,220 1.81
Figure 21: Statewide savings results for mechanical subcooling measure
The analysis shows that mechanical subcooling is cost-effective for all system configurations and in
all climate zones.
The proposed code requirement consists of mandatory liquid subcooling for low temperature parallel
compressor systems, maintained continuously at 50°F or less at the exit of the subcooler, using
compressor economizer port(s) or a separate parallel suction group operating at medium or high
temperature conditions. Exceptions will apply to: single-compressor systems since these may often
employ compressors without economizers (i.e. reciprocating) and be remotely located from other
systems, and cascade systems since the condensing temperature is already at a much lower
temperature.
4.5 Display Case Lighting Control This measure evaluates the cost-effectiveness of automatic controls to turn off display case lights
during non-business hours, and is applicable to stores that are not open 24 hours per day. Evaluation
of this measure involves a Baseline modification of the assumed business and stocking hours
(assumed to be 10 AM to 8 PM), which directly impact the simulated employee and customer
schedules, lighting schedules, and case infiltration schedules. Display case lights are assumed always
on in the Base Case, even for a non-24 hour store, which is typical for as significant fraction of
supermarkets.
4.5.1 Analysis results by climate zone
The display case lighting control measure was evaluated for all system types and in all climate zones.
Figure 22 summarizes the simulation results for the display case lighting control measure:
Energy
Savings
(kWh)
Energy
Savings/
SF (kWh)
TDV Cost
Savings ($)
TDV Cost
Savings /SF
($)
Measure
Cost plus
Maintenance
Cost ($)
Benefit/
Cost
Ratio
SXX Average 49,627 3.13 $69,134 $4.36 $5,588 12.37
MXX Average 149,814 2.52 $219,138 $3.68 $11,321 19.36
LXX Average 173,263 1.07 $265,992 $1.64 $12,659 21.01

Page 42
2013 California Building Energy Efficiency Standards October 2011
XAX Average 122,362 2.21 $181,772 $3.18 $9,856 18.44
XEX Average 121,355 2.19 $180,092 $3.15 $9,856 18.27
XFX Average 127,547 2.29 $190,068 $3.31 $9,856 19.28
All Average
CTZ01 - Arcata 121,760 2.20 $182,231 $3.189 $9,856 18.49
CTZ03 – Oakland 122,526 2.21 $181,454 $3.173 $9,856 18.41
CTZ05 – Santa Maria 122,016 2.20 $182,338 $3.183 $9,856 18.50
CTZ07 – San Diego 125,402 2.26 $189,148 $3.292 $9,856 19.19
CTZ08 - Fullerton 124,593 2.24 $184,423 $3.209 $9,856 18.71
CTZ10 – Riverside 124,596 2.24 $182,220 $3.174 $9,856 18.49
CTZ12 – Sacramento 123,529 2.22 $184,090 $3.210 $9,856 18.68
CTZ13 – Fresno 125,199 2.26 $187,412 $3.293 $9,856 19.01
CTZ14 – Palmdale 124,213 2.24 $182,442 $3.195 $9,856 18.51
CTZ15 – Palm Springs 128,513 2.31 $191,788 $3.356 $9,856 19.46
Maximum 185,047 3.29 $285,101 $4.623 $12,659 22.52
Minimum 47,749 1.02 $66,267 $1.552 $5,588 11.86
Figure 22: Statewide savings results for display case lighting control measure
The analysis shows that display case lighting control is cost-effective for all system configurations
and in all climate zones.
The proposed code requirement consists of mandatory control for lighting in refrigeration display
cases and lights in point-of-sale box doors in supermarkets, to automatically turn off lighting during
non-business hours. Since display cases are often stocked at night or before store hours, the controls
may include automatic or manual-enabled override intervals to allow for stocking. An exception is
included for stores that are normally open for business 140 hours or more per week.
4.6 Prohibit Open Upright Frozen Food Cases Low-temperature open upright display cases were compared with low temperature reach-in door
doors to evaluate the savings associated with prohibiting the use of open upright low temperature
cases. An equal length of open upright and reach-in display cases was compared; although this was a
difference noted several years ago, no stakeholders commented that a greater length of glass doors
was required to display or ―face‖ the same amount of product.
Figure 23 shows the assumptions for line-up length (or number of doors), fan energy, lighting energy,
infiltration assumptions, and anti-sweat heater wattage and controls (for the reach-in case) evaluated
in this analysis.
Open Upright Frozen Food
Case
Low-Temperature Reach-In
Display Case with Doors

Page 43
2013 California Building Energy Efficiency Standards October 2011
Line-Up Length (or Number of Doors) 12 ft 13 ft (5 doors)
Cooling Capacity 17.8 MBH 6.85 MBH
Design Discharge Air Temperature -5°F -5°F
Design Saturated Suction Temperature -22°F -22°F
Lighting Total shelf and canopy lights:
173 W
Total vertical door lighting:
369 W
Defrost Assumptions Hot Gas Defrost,
2x22 minutes/day
Hot Gas Defrost,
1x20 minutes/day
Anti-Sweat Heater Assumptions 288 W
Always on
269 W
Always on
Figure 23: Analysis assumptions for both open and reach-in display cases
The energy savings was evaluated in CTZ12-Sacramento and only for the large supermarket
prototype because the measure is not significant affected by climate zone or store size. Figure 24
shows the analysis results for this measure.
Energy
Savings
(kWh)
Energy
Savings/
SF (kWh)
TDV Cost
Savings ($)
TDV Cost
Savings
/SF ($)
MAC 7,767 0.13 $19,481 $0.33
MAD 9,526 0.16 $22,311 $0.37
MEC 9,990 0.17 $22,116 $0.37
MFC 11,094 0.19 $25,017 $0.42
MFD 11,218 0.19 $25,017 $0.42
ALL Average 9,919 0.17 $22,789 $0.38
Figure 24: Analysis results for reach-in versus open upright frozen food cases
The incremental cost was assumed to be zero, since the two types of display cases have similar costs
and the savings in compressor cost and refrigeration piping is easily greater than increased 120 V
wiring costs (if any). With no associated incremental costs there is no calculation of benefit/cost
ratio.
Stakeholder feedback for this measure was positive, with no situations identified that required the use
of open upright low temperature cases in new store construction. Generally, these are rare in current
design practice in California other than occasional small (12 to 20 ft.) line-ups of frozen meat,
although at least one chain still used a 60-72 ft. line-up of open upright freezers as recently as three
years ago.
The proposed code requirement consists of prohibiting open upright low temperature display cases.
4.7 Refrigeration Heat Recovery This measure consists of using heat recovery from the refrigeration system for space heating.

Page 44
2013 California Building Energy Efficiency Standards October 2011
Heat recovery from the refrigeration systems in supermarkets has been employed using many
different methods over the past 50 years. Prior to the CFC phase-out, heat recovery provided the
majority of heating requirements in most supermarkets. Many configurations can significantly
increase refrigerant charge and winter-summer charge variation, generally resulting in greater annual
refrigerant losses and associated costs—resulting in a decline in use of heat recovery to the point only
a small amount of annual heating needs being met with heat recovery.
The configuration employed to evaluate this measure includes an indirect heat exchange loop, with
water-cooled heat-recovery condensers (piped in series with the main condensers) and using a water
loop to convey the heat to the air handler(s), rooftop units or unit heaters used to heat the store. A
saturated condensing temperature holdback valve with a design holdback SCT of 95°F was assumed
on the refrigerant-side of the water-cooled heat recovery condenser(s). Reclaim coils for each system
type were sized to recover 65% of the available refrigeration system heat of rejection, with a design
temperature difference of 30°F between the reclaim condensing temperature and the design return air
temperature.
The baseline of comparison included floating head pressure to 70°F with variable-setpoint (ambient
following) control logic and variable speed condenser fan control. The baseline assumes all space
heating in the main sales area is accomplished with natural gas furnaces. Figure 25 describes the heat
reclaim assumptions utilized in the evaluation of this measure:
Small Supermarket Large Supermarket Big-Box Food Store
Sales area HVAC system
description
Packaged rooftop AC unit
with EER per 2008 Title 24
Main air handling unit Several packaged rooftop
AC units with EERs per
2008 Title 24
Circulation pump power 1.5 HP 3 HP 10 HP
Figure 25: Simulation assumptions for heat reclaim measure
4.7.1 Energy analysis results
The refrigeration heat recovery measure for space heating was evaluated for all system types and in
all climate zones. Figure 26 below summarizes the simulation results for the heat recovery measure:
Energy
Savings
(kWh)
Energy
Savings/
SF
(kWh)
Natural
Gas
Savings
(Therms)
Natural
Gas
Savings
/SF
(Therms)
TDV Cost
Savings
($)
TDV Cost
Savings /SF
($)
Measure
Cost plus
Maintenance
Cost ($)
SXX Average -15,885 -1.00 7,573 0.48 $126,510 $7.98 $21,396
MXX Average -37,045 -0.62 26,572 0.45 $478,112 $8.03 $69,949
LXX Average -94,772 -0.58 35,118 0.22 $540,915 $3.34 $88,378
XAX Average -70,370 -1.10 23,006 0.38 $336,229 $5.68 $60,813
XEX Average -53,986 -0.80 23,061 0.38 $371,734 $6.31 $57,021
XFX Average -25,722 -0.34 23,183 0.38 $432,518 $7.29 $60,446
All Average

Page 45
2013 California Building Energy Efficiency Standards October 2011
CTZ01 - Arcata -53,400 -0.78 43,977 0.69 $771,752 $12.35 $59,908
CTZ03 – Oakland -48,367 -0.70 31,436 0.50 $545,607 $8.88 $59,908
CTZ05 – Santa Maria -49,166 -0.71 33,001 0.53 $568,282 $9.20 $59,908
CTZ07 – San Diego -41,375 -0.59 17,696 0.31 $284,389 $5.27 $59,908
CTZ08 - Fullerton -46,948 -0.73 16,646 0.32 $256,694 $5.28 $59,908
CTZ10 – Riverside -49,868 -0.75 16,704 0.28 $257,436 $4.39 $59,908
CTZ12 – Sacramento -53,112 -0.80 23,756 0.39 $399,091 $6.60 $59,908
CTZ13 – Fresno -50,693 -0.77 19,960 0.33 $331,549 $5.52 $59,908
CTZ14 – Palmdale -56,213 -0.86 21,598 0.35 $358,692 $5.91 $59,908
CTZ15 – Palm Springs -43,199 -0.67 6,096 0.11 $44,962 $1.07 $59,908
Maximum 84,118 1.41 72,907 0.86 $1,329,152 $18.95 $95,545
Minimum -150,070 -1.93 2,250 0.05 -$8,260 $(0.05) $20,926
Figure 26: Energy savings results for heat recovery measure by climate zone
4.7.2 Refrigerant analysis results
The proposed reach-code requirement for this measure is at least 25% of the design refrigeration heat
of rejection utilized for space heating, while increasing the refrigerant charge by no greater than 0.35
lbs per 1,000 BTU/Hr of heating capacity, whichever is less. Assuming the worst case impact on R-
404A/R-507 refrigerant charge, Figure 27 summarizes the results of this analysis in terms of
refrigerant emissions in pounds. Note that refrigerant emissions are assumed to be independent of the
design climate zone.
Annual Refrigerant Savings (Range)
Pounds
Low High
SXX Average -14 -9
MXX Average -46 -29
LXX Average -74 -46
XAX Average -44 -27
XEX Average -60 -40
XFX Average -38 -23
All Average -45 -28
Figure 27: Refrigerant analysis results for heat recovery measure
4.7.3 GHG analysis results
Figure 28 below summarizes the net impact of this measure on GHG emissions. As shown, when
accounting for worst case impacts on a system‘s refrigerant charge, this measure has inconsistent
overall benefits to the environment in terms of GHG emissions. In some climate zones (i.e., CTZ01,

Page 46
2013 California Building Energy Efficiency Standards October 2011
CTZ03, and CTZ05) where natural gas savings are greatest, the overall impact on GHG emissions is
more favorable, while in other climate zones (i.e., CTZ15), the overall impact on GHG emissions is
on average negative.
Annual Refrigerant Savings
(Range)
Annual Energy
Savings Net Annual Savings (Range)
MTCO2eq MTCO2eq
MTCO2eq
Low High Low High
SXX Average -25 -16 35 10 19
MXX Average -83 -52 131 48 79
LXX Average -134 -83 154 20 71
XAX Average -79 -48 97 18 49
XEX Average -107 -71 104 -2 33
XFX Average -69 -42 117 48 75
All Average
CTZ01 - Arcata -81 -50 219 139 169
CTZ03 – Oakland -81 -50 153 72 102
CTZ05 – Santa Maria -81 -50 161 80 111
CTZ07 – San Diego -81 -50 80 0 30
CTZ08 - Fullerton -81 -50 72 -8 22
CTZ10 – Riverside -81 -50 71 -9 21
CTZ12 – Sacramento -81 -50 109 28 58
CTZ13 – Fresno -81 -50 89 8 39
CTZ14 – Palmdale -81 -50 95 15 45
CTZ15 – Palm Springs -81 -50 16 -65 -34
Maximum Net Savings Across All Store Simulations 284 326
Minimum Net Savings Across All Store Simulations -167 -109
Figure 28: GHG analysis results for heat recovery measure
Savings analysis results
Figure 29 summarizes the net impacts of this measure on lifetime costs. Note that the energy cost
savings and refrigerant cost savings account for the monetized GHG impacts associated with energy
consumption and refrigerant emissions, based on the CEC price forecasts for annual carbon costs.
Measure/
Maintenance
Cost ($)
Refrigerant Cost
Savings Range ($) TDV Energy
Cost
Savings ($)
Net Lifetime Savings
Range ($)
Benefit/Cost
Ratio Range ($)
Low High Low High Low High

Page 47
2013 California Building Energy Efficiency Standards October 2011
SXX Average $21,396 -$14,669 -$9,113 $126,510 $90,445 $96,001 3.51 4.15
MXX Average $69,949 -$47,689 -$29,780 $478,112 $360,475 $378,383 4.06 4.79
LXX Average $88,378 -$77,049 -$47,945 $540,915 $375,488 $404,592 3.27 3.97
XAX Average $60,813 -$45,704 -$27,802 $336,229 $229,712 $247,614 3.16 3.79
XEX Average $57,021 -$61,649 -$41,099 $371,734 $253,064 $273,613 3.13 3.79
XFX Average $60,446 -$39,644 -$24,014 $432,518 $332,428 $348,059 4.32 5.12
All Average
CTZ01 - Arcata $59,908 -$46,469 -$28,946 $771,752 $665,375 $682,898 7.25 8.69
CTZ03 – Oakland $59,908 -$46,469 -$28,946 $545,607 $439,230 $456,753 5.13 6.14
CTZ05 – Santa Maria $59,908 -$46,469 -$28,946 $568,282 $461,906 $479,429 5.34 6.40
CTZ07 – San Diego $59,908 -$46,469 -$28,946 $284,389 $178,013 $195,536 2.67 3.20
CTZ08 - Fullerton $59,908 -$46,469 -$28,946 $256,694 $150,318 $167,841 2.41 2.89
CTZ10 – Riverside $59,908 -$46,469 -$28,946 $257,436 $151,060 $168,583 2.42 2.90
CTZ12 – Sacramento $59,908 -$46,469 -$28,946 $399,091 $292,714 $310,237 3.75 4.49
CTZ13 – Fresno $59,908 -$46,469 -$28,946 $331,549 $225,172 $242,695 3.12 3.73
CTZ14 – Palmdale $59,908 -$46,469 -$28,946 $358,692 $252,315 $269,838 3.37 4.04
CTZ15 – Palm Springs $59,908 -$46,469 -$28,946 $44,962 -$61,414 -$43,891 0.42 0.51
Maximum Net Savings Across All Store Simulations $1,170,124 $1,194,633 9.09 10.95
Minimum Net Savings Across All Store Simulations -$189,511 -$156,960 - -
Figure 29: Cost savings results for heat recovery measure
The analysis shows that, on average, heat recovery is cost-effective for all system configurations
across all climate zones. However, in Palm Springs, the hottest climate zone, it is not cost-effective
for all store types and system configurations. Figure 30 provides a summary of analysis results for
Palm Springs.
Energy
Savings
(kWh)
Natural
Gas
Savings
(Therms)
Average
Refrigerant
Savings
(pounds)
TDV
Electric
Cost
Savings ($)
TDV Gas
Cost
Savings
($)
TDV Total
Cost
Savings
($)
Average
Refrigerant
Cost Savings
($)
Measure
Cost plus
Maintenance
Cost ($)
SAC -14,987 2,250 -15 -$32,539 $51,689 $19,150 -$15,292 $20,926
SAD -15,793 2,250 -8 -$33,933 $51,689 $17,756 -$7,774 $23,202
SEC -15,409 2,250 -15 -$33,220 $51,677 $18,457 -$15,717 $20,926
SFC -10,655 2,251 -13 -$24,154 $51,726 $27,572 -$13,452 $20,926
SFD -10,901 2,251 -7 -$24,265 $51,726 $27,461 -$7,222 $21,000
MAC -48,067 8,532 -50 -$105,335 $194,802 $89,467 -$51,823 $66,536
MAD -51,536 8,532 -23 -$110,844 $194,802 $83,958 -$24,043 $75,068

Page 48
2013 California Building Energy Efficiency Standards October 2011
MEC -47,445 8,529 -53 -$102,926 $194,728 $91,802 -$54,159 $66,536
MFC -25,995 8,538 -41 -$61,800 $194,949 $133,148 -$42,408 $66,536
MFD -26,917 8,538 -21 -$61,455 $194,949 $133,494 -$21,240 $75,068
LAC -83,699 7,502 -78 -$181,108 $172,848 -$8,260 -$81,376 $83,600
LAD -81,478 7,499 -39 -$176,625 $172,775 -$3,850 -$40,210 $95,545
LEC -81,558 7,502 -81 -$177,216 $172,848 -$4,368 -$84,247 $83,600
LFC -67,603 7,507 -67 -$151,067 $172,983 $21,916 -$69,889 $83,600
LFD -65,948 7,506 -35 -$146,216 $172,946 $26,731 -$36,764 $95,545
SXX Average -13,549 2,250 -12 -$29,622 $51,702 $22,079 -$11,891 $21,396
MXX Average -39,992 8,534 -38 -$88,472 $194,846 $106,374 -$38,734 $69,949
LXX Average -76,057 7,503 -60 -$166,447 $172,880 $6,434 -$62,497 $88,378
XAX Average -49,260 6,094 -35 -$106,731 $139,768 $33,037 -$36,753 $60,813
XEX Average -48,137 6,094 -50 -$104,454 $139,751 $35,297 -$51,374 $57,021
XFX Average -34,670 6,099 -31 -$78,159 $139,880 $61,720 -$31,829 $60,446
ALL Average -43,199 6,096 -36 -$94,847 $139,809 $44,962 -$37,708 $59,908
Figure 30: Heat recovery cost savings results for CTZ15 – Palm Springs
The proposed code requirement consists of mandatory heat recovery from refrigeration system(s) for
space heating.
There are a multitude of combinations between refrigeration systems types, HVAC system types and
configurations, store sizes and new construction project types. To allow sufficient flexibility that heat
recovery can be accomplished as a mandatory measure, the code will only require a minimum 25% of
the design refrigeration heat of rejection to be utilized for space heating. Since refrigerant leakage
and cost is also an important concern (the sole reason for a dramatic reduction in the use of heat
recovery over the two decades), a restriction on refrigerant charge is also included, specifically
limiting the refrigerant charge increase to no greater than 0.35 lbs per 1,000 BTU/Hr of heating
capacity, whichever is less. The cost assumptions for this measure allowed for construction methods
(e.g. indirect water loop) that would readily meet the charge limitation.
Based on the analysis results, it is also recommended that climate zone 15 be excluded from this
requirement.
4.8 CO2 Secondary (indirect) or Cascade Cooling Reduction of HFC refrigerant charge, leakage rates, and the attendant high direct greenhouse gas
emissions are very important topics to the supermarket industry as well as a primary objective in
California, resulting from legislation that directs the California Air Resources Board to take ―early
action‖ to reduce hydrofluorocarbon (HFC) emissions. A clear and immediate option, although still
somewhat nascent in the US compared with other countries, is the use of carbon dioxide (CO2) as the
cooling fluid in the display cases and walk-in evaporator coils. In this configuration, there is no HFC
refrigerant in the store; HFCs are limited to the compressor package (essentially a CO2 chiller) and the
condenser. Systems may or may not use CO2 compressors. A system that simply circulates phase-
change CO2 and uses HFC compressors for cooling is termed a secondary or indirect system. A

Page 49
2013 California Building Energy Efficiency Standards October 2011
system that uses CO2 compressors for low temperature loads is termed a cascade system. Either
system accomplishes similar results in terms of GHG reduction with generally similar efficiencies.
4.8.1 Analysis Results
The large and small supermarket prototypes were utilized to evaluate this measure.
Energy Analysis Results
The energy impact from using CO2 as the cooling fluid in both pump-recirculated indirect and
cascade condensing configurations was determined to be negligible (See Appendix H for energy
analysis results).
Refrigerant Analysis Results
When savings associated with reduced R-404A/R-507 refrigerant leakage are accounted for,
significant environmental benefits are observed in secondary (indirect) cooling systems. Figure 31
shows the refrigerant emissions in terms of both pounds of refrigerant as well as equivalent metric
tons of CO2 emissions.
Annual Refrigerant Savings (Range)
Pounds MTCO2eq
Low High Low High
Small Supermarket 69 93 122 166
Large Supermarket 346 468 615 832
Average 207 280 369 499
Figure 31: Carbon savings results for indirect cooling measure
GHG analysis results
Figure 32 summarizes the net impact of this measure on GHG emissions. Since the measure has no
impact on energy consumption, only the reduction of refrigerant emissions in terms of metric tons
CO2 equivalent is shown below.
Annual Refrigerant Savings (Range)
MTCO2eq
Low High
Small Supermarket 122 166
Large Supermarket 615 832
Average 369 499
Figure 32: GHG analysis results for indirect cooling measure
Figure 33 summarizes the net impact of this measure on lifetime costs. Note that the energy cost
savings and refrigerant cost savings account for the monetized GHG impacts associated with energy
consumption and refrigerant emissions, based on the CEC price forecasts for annual carbon costs.
Since this measure has no impact on energy consumption, energy cost savings is assumed to be zero.

Page 50
2013 California Building Energy Efficiency Standards October 2011
Note that refrigerant charge and leak rate reductions are assumed to be independent of the design
climate zone.
Measure/
Maintenance
Cost ($)
Refrigerant Cost
Savings Range ($) TDV Energy
Cost
Savings ($)
Net Lifetime
Savings Range ($)
Benefit/Cost
Ratio Range ($)
Low High Low High Low High
Small Supermarket $50,000 $70,643 $95,690 $0 $20,643 $45,690 1.41 1.91
Large Supermarket $120,000 $355,174 $480,615 $0 $235,174 $360,615 2.96 4.01
Figure 33: Cost savings results for indirect cooling measure
This measure results in significant GHG emissions savings for both prototypes, and economic
analysis shows that this measure is cost-effective.
The proposed Reach code requirement consists of using CO2 for cooling of display cases and walk-
ins. Secondary (indirect) cooling and/or cascade cooling would meet this requirement.
4.8.2 Use of Glycol for MT Systems as an Exception to CO2
Stakeholders responded that they would like an option to use glycol as the heat transfer fluid for
medium-temperature loads. However, analysis indicated that glycol indirect systems were not cost-
effective compared to direct-expansion systems; equipment costs and the cost from increased energy
consumption outweighed the economic benefits of reducing refrigerant charge and leak rates.
Additional analysis was performed to determine if the increased energy consumption could be offset
with variable-speed glycol pump control and variable-speed walk-in cooling coil fan control. A full
description of the analysis methodology is presented in Appendix H.
Figure 34 summarizes the net impact on lifetime costs for glycol indirect systems with variable speed
enhancements versus direct expansion for medium-temperature loads. Note that the energy cost
savings and refrigerant cost savings account for the monetized GHG impacts associated with energy
consumption and refrigerant emissions, based on the CEC price forecasts for annual carbon costs.
Measure
Cost ($)
Refrigerant Cost
Savings Range ($) TDV Cost
Savings ($)
Net Lifetime Savings
Range ($)
Benefit/Cost Ratio
Range ($)
Low High Low High Low High
CTZ01 - Arcata $120,000 $355,174 $480,615 -$102,827 $132,347 $257,788 1.59 2.16
CTZ03 – Oakland $120,000 $355,174 $480,615 -$96,722 $138,452 $263,893 1.64 2.22
CTZ05 – Santa Maria $120,000 $355,174 $480,615 -$98,217 $136,957 $262,398 1.63 2.20
CTZ07 – San Diego $120,000 $355,174 $480,615 -$88,409 $146,764 $272,205 1.70 2.31
CTZ08 - Fullerton $120,000 $355,174 $480,615 -$135,916 $99,258 $224,699 1.39 1.88
CTZ10 – Riverside $120,000 $355,174 $480,615 -$148,847 $86,327 $211,768 1.32 1.79
CTZ12 – Sacramento $120,000 $355,174 $480,615 -$148,242 $86,932 $212,373 1.32 1.79
CTZ13 – Fresno $120,000 $355,174 $480,615 -$154,027 $81,147 $206,588 1.30 1.75
CTZ14 – Palmdale $120,000 $355,174 $480,615 -$155,780 $79,394 $204,835 1.29 1.74
CTZ15 – Palm Springs $120,000 $355,174 $480,615 -$171,586 $63,588 $189,029 1.22 1.65

Page 51
2013 California Building Energy Efficiency Standards October 2011
All Average $120,000 $355,174 $480,615 -$130,057 $105,115 $230,557 1.42 1.92
Figure 34: Cost savings results for indirect measure with glycol
The use of glycol as a secondary cooling fluid for MT loads is assumed to result in the same reduction
in refrigerant emissions as CO2, and the variable-speed glycol pump and cooling coil fan control
enhancements mitigate the resultant increase in energy consumption, sufficient to result in a
benefit/cost ratio greater than 1 for all climate zones.
The proposed Reach code requirement of using CO2 secondary (indirect) cooling for display cases
and walk-ins includes an exception that allows glycol to be used for medium-temperature loads, so
long as the following requirements are met:
a. Glycol supply pump(s) are required to be equipped with variable speed drives controlled
based on glycol loop pressure differential
b. Two-way (no bypass) type control valves are installed at the walk-in cooling coils and
display cases
c. Variable speed control is utilized on walk-in cooling coil fans, utilizing speed control as
primary temperature control before cycling glycol supply valves, with a minimum fan
speed no greater than 70%
4.9 Statewide Energy Savings Estimates The total statewide energy savings for the following base code measures are provided in this section:
Floating head pressure
Condenser specific efficiency
Floating suction pressure
Mechanical subcooling
Display case lighting control
Refrigeration heat recovery
As described in Section 3.3, the energy savings by prototype are calculated by multiplying the per SF
energy savings with the appropriate 2014 supermarket new construction SF. Results are presented in
Figure 35, Figure 36, and Figure 37, below.
Small Supermarkets Energy Savings
(kWh)
Gas Savings
(Therms)
CZ
Supermarket
new
construction
SF
Floating
Head
Pressure
Condenser
Specific
Efficiency
Floating
Suction
Pressure
Mechanical
Subcooling
Display
Case
Lighting
Control
Refrigeration
Heat
Recovery
Refrigeration
Heat
Recovery
1 1,680 2,889 75 864 871 5,170 -1,755 1,072
2 10,876 18,705 484 5,592 5,637 33,474 -11,361 6,942

Page 52
2013 California Building Energy Efficiency Standards October 2011
3 33,848 58,216 1,507 17,403 17,544 104,180 -35,360 21,606
4 26,964 46,377 1,200 13,864 13,976 82,993 -28,168 17,212
5 5,236 9,005 233 2,692 2,714 16,114 -5,469 3,342
6 45,268 77,858 2,015 23,275 23,463 139,329 -47,289 28,895
7 62,712 107,859 2,791 32,243 32,504 193,018 -65,512 40,030
8 55,408 89,431 6,295 29,812 31,610 173,798 -54,156 18,685
9 119,205 192,402 13,543 64,137 68,006 373,912 -116,512 40,198
10 34,625 55,886 3,934 18,630 19,753 108,609 -33,843 11,676
11 20,504 34,543 1,980 10,791 11,459 63,703 -21,180 9,763
12 80,160 135,044 7,741 42,187 44,798 249,046 -82,804 38,169
13 44,400 74,799 4,288 23,367 24,813 137,943 -45,864 21,141
14 8,416 14,179 813 4,429 4,704 26,149 -8,694 4,008
15 2,994 5,044 289 1,576 1,673 9,302 -3,093 1,426
16 9,882 16,648 954 5,201 5,523 30,702 -10,208 4,705
Total 562,177 938,883 48,141 296,060 309,049 1,747,442 -571,269 268,869
Figure 35: Annual Statewide Energy Savings – Small Supermarket Prototype
Large Supermarkets Energy Savings
(kWh)
Gas Savings
(Therms)
CZ
Supermarket
new
construction
SF
Floating
Head
Pressure
Condenser
Specific
Efficiency
Floating
Suction
Pressure
Mechanical
Subcooling
Display
Case
Lighting
Control
Refrigeration
Heat
Recovery
Refrigeration
Heat
Recovery
1 7,740 12,704 419 4,229 2,848 19,141 -3,537 4,764
2 50,113 82,259 2,716 27,381 18,440 123,936 -22,902 30,846
3 155,969 256,015 8,452 85,218 57,390 385,727 -71,277 96,004
4 124,249 203,949 6,733 67,887 45,718 307,281 -56,781 76,479
5 24,125 39,599 1,307 13,181 8,877 59,663 -11,025 14,849
6 208,590 342,391 11,304 113,969 76,752 515,866 -95,325 128,394
7 288,967 474,327 15,660 157,885 106,328 714,647 -132,057 177,868
8 255,312 403,161 31,450 144,724 112,578 642,129 -184,415 87,340
9 549,281 867,366 67,663 311,361 242,201 1,381,485 -396,754 187,905
10 159,547 251,940 19,654 90,440 70,351 401,274 -115,243 54,580
11 94,480 155,067 9,929 54,174 40,244 235,959 -72,340 42,943
12 369,367 606,232 38,816 211,793 157,334 922,477 -282,811 167,887
13 204,587 335,784 21,500 117,309 87,145 510,948 -156,645 92,990
14 38,782 63,652 4,075 22,237 16,519 96,856 -29,694 17,627
15 13,797 22,644 1,450 7,911 5,877 34,456 -10,564 6,271
16 45,535 74,735 4,785 26,109 19,396 113,721 -34,864 20,697
Total 2,590,440 4,191,826 245,913 1,455,809 1,067,996 6,465,565 -1,676,234 1,207,445
Figure 36: Annual Statewide Energy Savings – Large Supermarket Store
Big Box Food Store Energy Savings
(kWh)
Gas Savings
(Therms)
CZ
Supermarket
new
construction
SF
Floating
Head
Pressure
Condenser
Specific
Efficiency
Floating
Suction
Pressure
Mechanical
Subcooling
Display
Case
Lighting
Control
Refrigeration
Heat
Recovery
Refrigeration
Heat
Recovery

Page 53
2013 California Building Energy Efficiency Standards October 2011
1 5,326 4,235 111 1,551 1,921 5,584 -3,408 1,716
2 34,487 27,422 719 10,043 12,438 36,159 -22,065 11,111
3 107,335 85,347 2,238 31,256 38,710 112,538 -68,674 34,580
4 85,506 67,990 1,783 24,899 30,837 89,650 -54,707 27,548
5 16,602 13,201 346 4,835 5,987 17,407 -10,622 5,349
6 143,548 114,141 2,993 41,801 51,770 150,506 -91,843 46,247
7 198,862 158,124 4,146 57,909 71,719 208,501 -127,234 64,068
8 175,701 129,445 7,502 55,598 72,728 188,886 -98,726 26,437
9 378,006 278,489 16,141 119,615 156,468 406,372 -212,400 56,877
10 109,798 80,892 4,688 34,744 45,449 118,037 -61,695 16,521
11 65,019 50,705 2,338 20,094 26,141 69,226 -39,049 14,701
12 254,192 198,229 9,141 78,558 102,199 270,638 -152,662 57,474
13 140,794 109,796 5,063 43,512 56,607 149,903 -84,558 31,834
14 26,689 20,813 960 8,248 10,730 28,416 -16,029 6,035
15 9,495 7,404 341 2,934 3,817 10,109 -5,702 2,147
16 31,336 24,437 1,127 9,684 12,599 33,364 -18,820 7,085
Total 1,782,698 1,370,670 59,638 545,282 700,120 1,895,296 -1,068,195 409,730
Figure 37: Annual Statewide Energy Savings – Big Box Food Store
The total annual statewide energy savings for all prototypes are shown in Figure 38:
Sum of
all building sizes
Energy Savings
(kWh)
Gas Savings
(Therms)
CZ
Supermarket
New
construction
SF
Floating
Head
Pressure
Condenser
Specific
Efficiency
Floating
Suction
Pressure
Mechanical
Subcooling
Display
Case
Lighting
Control
Refrigeration
Heat
Recovery
Refrigeration
Heat
Recovery
1 14,745 19,828 605 6,643 5,639 29,895 -8,699 7,552
2 95,476 128,386 3,919 43,015 36,514 193,568 -56,328 48,899
3 297,152 399,579 12,197 133,877 113,644 602,445 -175,310 152,190
4 236,719 318,315 9,716 106,650 90,532 479,924 -139,657 121,238
5 45,962 61,805 1,887 20,707 17,578 93,183 -27,116 23,540
6 397,406 534,390 16,312 179,045 151,985 805,701 -234,457 203,536
7 550,541 740,310 22,597 248,037 210,551 1,116,166 -324,802 281,966
8 486,421 622,036 45,247 230,134 216,916 1,004,813 -337,297 132,462
9 1,046,493 1,338,257 97,346 495,113 466,675 2,161,770 -725,666 284,981
10 303,970 388,718 28,276 143,814 135,553 627,920 -210,781 82,777
11 180,003 240,314 14,247 85,059 77,844 368,888 -132,569 67,408
12 703,719 939,505 55,698 332,538 304,331 1,442,161 -518,278 263,529
13 389,781 520,379 30,851 184,188 168,565 798,793 -287,067 145,965
14 73,888 98,644 5,848 34,915 31,953 151,421 -54,417 27,669
15 26,285 35,092 2,080 12,421 11,367 53,867 -19,359 9,843
16 86,753 115,820 6,866 40,995 37,517 177,787 -63,892 32,487
Total 4,935,315 6,501,379 353,693 2,297,151 2,077,165 10,108,302 -3,315,697 1,886,044
Figure 38: Annual Statewide Energy Savings – All Average of Prototypes
The resulting total annual statewide energy savings by measure are presented in Figure 39:
Measure Energy Savings
(GWh)
Gas Savings
(MMT)

Page 54
2013 California Building Energy Efficiency Standards October 2011
Floating Head Pressure 6.50 --
Condenser Specific Efficiency 0.35 --
Floating Suction Pressure 2.30 --
Mechanical Subcooling 2.08 --
Display Case Lighting Control 10.11 --
Refrigeration Heat Recovery -3.32 1.89
Total 18.02 1.89
Figure 39: Annual Statewide Energy Savings by Measures
4.10 Equipment Rating Accuracy, Standards and Certification
Currently, the equipment performance requirements in this standard are defined without the
benefit or use of rating standards (e.g. AHRI, ASHRAE) or certification of manufacturers‘ data.
Whereas today most air conditioning equipment is rated to common standards and independently
certified, this is generally not the case for refrigeration condensers, evaporators and some
compressors. The data provided in manufacturers‘ catalogs was relied upon in the development
of this CASE report. Of course manufacturers‘ information will be used by owners and engineers
to determine compliance with code requirements. As a result, the minimum performance
requirements derived herein are necessarily somewhat conservative, as well as reflecting rather
general assumptions regarding the facts and characteristics of how actual equipment operates
compared to catalog values.
Requiring equipment ratings to be published in accordance with common standards and requiring
certification of these ratings was considered by the CASE authors and discussed in detail with
stakeholders. Existing test and rating standards that might be used were considered, along with
the real-world application considerations that would affect standards and application of
equipment. The conclusion was that considerable work was required to develop appropriate
standards and that equipment data would likely change substantially (to a greater extent for
smaller equipment). These facts, along with the costs of labs, testing and product line changes
would impose a large cost on industry. Considering these facts, it was determined that the
proposed code requirements could be reasonably undertaken with the existing ―state of the art‖
concerning performance data, as long as the level of stringency was carefully moderated.
Throughout the development of this CASE report, stakeholders often noted support for
prospective test standards and certification for the subject equipment. Equipment designed and
rated to common standards would be beneficial to manufacturers and end-users of the equipment
by creating a ―level playing field‖, allowing better system design and ultimately leading to greater
system efficiency and greater trust in performance values, ultimately reduced first costs through
system right sizing. Future code minimum performance requirements and cost-effectiveness
could certainly be more refined and exacting. Perhaps most importantly, standard ratings would
be a first step towards performance definitions sufficient for a Performance Compliance Option,
which industry stakeholders have noted should be available for supermarket refrigeration.

Page 55
2013 California Building Energy Efficiency Standards October 2011
Continued work is recommended to support development of the relevant equipment standards and
methods to allow consideration in the next code cycle.

Page 56
2013 California Building Energy Efficiency Standards October 2011
5. Recommended Code Language Section 5 presents the proposed code language additions to Title 24, Section 127 for Supermarket
Refrigeration, and Supermarket Refrigeration Acceptance Testing to Non-residential Appendix NA-
127, plus amendments to Section 101-Definitions, and Title 24 Part 11- California Green Building
Standards Code.
New proposed language is underlined.
5.1 Title 24 Draft Code Language
SECTION 101 – DEFINITIONS
BUBBLE POINT is the refrigerant liquid saturation temperature at a specified pressure.
COOLER is a space greater than or equal to 28°F but less than 55°F.
DEW POINT is the refrigerant vapor saturation temperature at a specified pressure.
CONDENSER SPECIFIC EFFICIENCY is the condenser Total Heat of Rejection (THR) capacity
divided by the input electric power at 100 percent fan speed (including spray pump electric input
power for evaporative condensers) at standard conditions.
FREEZER is a space designed to maintain less than 28°F and space designed to be convertible
between cooler and freezer operation.
GLOBAL WARMING POTENTIAL or ―GWP‖ means the radiative forcing impact of one mass-
based unit of a given greenhouse gas relative to an equivalent unit of carbon dioxide over a given
period of time.
GLOBAL WARMING POTENTIAL VALUE or ―GWP Value‖ means the 100-yr GWP value first
published by the Intergovernmental Panel on Climate Change (IPCC) in its Second Assessment
Report (SAR) (IPCC, 1995; or if a 100-yr GWP value was not specified in the IPCC SAR, it means
the GWP value published by the IPCC in its Fourth Assessment A-3 Report (AR4) (IPCC, 2007); or if
a 100-yr GWP value was not specified in the IPCC AR4, then the GWP value will be determined by
the Commission based on data, studies and/or good engineering or scientific judgment. Both the 1995
IPCC SAR values and the 2007 IPCC AR4 values are published in table 2.14 of the 2007 IPCC AR4.
The SAR GWP values are found in column ―SAR (100-yr)‖ of Table 2.14.; the AR4 GWP values are
found in column ―100 yr‖ of Table 2.14.‖
LOW-GWP REFRIGERANT means a compound used as a heat transfer fluid or gas that is: (A) any
compound or blend of compounds, with a GWP Value less than 150; and (B) U.S. EPA Significant
New Alternatives Policy (SNAP)-approved; and (C) not an ozone depleting substance as defined in
Title 40 of the Code of Federal Regulations, Part 82, §82.3 (as amended March 10, 2009).
MICRO-CHANNEL CONDENSER is an air-cooled condenser for refrigeration systems which
utilizes multiple small parallel gas flow passages in a flat configuration with unitized fin surface
between the gas passages, rather than round tubes arranged at a right angle to separate plate fins.

Page 57
2013 California Building Energy Efficiency Standards October 2011
SATURATED CONDENSING TEMPERATURE (CONDENSING TEMPERATURE) is the
saturation temperature corresponding to the refrigerant pressure at the condenser entrance for single
component and azeotropic refrigerants. For zeotropic refrigerants, the arithmetic average of the Dew
Point and Bubble Point temperatures corresponding to the refrigerant pressure at the condenser
entrance.
TOTAL HEAT OF REJECTION (THR) is the heat rejected by refrigeration system compressors at
design conditions, consisting of the design cooling capacity plus the heat of compression added by the
compressors.
SECTION 127 – MANDATORY REQUIREMENTS FOR SUPERMARKET
REFRIGERATION
Retail food stores with 8,000 square feet or more of conditioned area or more, and that utilize either
refrigerated display cases, or walk-in coolers or freezers connected to remote compressor units or
condensing units, shall meet the requirements of this section.
(a) Condensers. Fan-powered condensers shall conform to the following requirements.
1. All condenser fans for air-cooled condensers, evaporative-cooled condensers, air- or water-cooled
fluid coolers or cooling towers shall be continuously variable speed, with the speed of all fans
serving a common condenser high side controlled in unison.
2. The refrigeration system condenser controls for systems with air-cooled condensers shall use
variable-setpoint control logic to reset the condensing temperature setpoint in response to ambient
drybulb temperature.
3. The refrigeration system condenser controls for systems with evaporative-cooled condensers shall
use variable-setpoint control logic to reset the condensing temperature setpoint in response to
ambient wetbulb temperature.
EXCEPTION to Section 127 (a) 2 and 3: Condensing temperature control strategies approved by
the Executive Director that have been demonstrated to provide equal energy savings
4. The minimum condensing temperature setpoint shall be less than or equal to 70°F.
5. Fan-powered condensers shall meet the specific efficiency requirements listed in Table 127-A:
TABLE 127-A - FAN-POWERED CONDENSERS –SPECIFIC EFFICIENCY REQUIREMENTS
Condenser Type Minimum Specific Efficiency a
Rating Condition
Evaporative-Cooled 160 (Btu/h)/W
100°F Saturated Condensing
Temperature (SCT), 70°F
Entering Wetbulb Temperature

Page 58
2013 California Building Energy Efficiency Standards October 2011
Air-Cooled 65 (Btu/h)/W
105°F Saturated Condensing
Temperature (SCT), 95°F
Entering Drybulb Temperature
a See section 101 for definition of condenser specific efficiency
EXCEPTION 1 to Section 127 (a) 5: Condensers with a THR capacity of less than 150 MBH at the
specific efficiency rating condition.
EXCEPTION 2 to Section 127 (a) 5: Stores located in Climate Zone CTZ01.
EXCEPTION 3 to Section 127 (a) 5: Existing condensers that are reused for an expansion or
remodel.
6. Air-cooled condensers shall have a fin density no greater than 10 fins per inch.
3. EXCEPTION 1 to Section 127 (a) 6: Micro-channel condensers.
4. EXCEPTION 2 to Section 127 (a) 6: Existing condensers that are reused for an expansion or
remodel.
(b) Compressor Systems. Refrigeration compressor systems and condensing units shall conform
to the following requirements.
1. Compressors and multiple-compressor suction groups shall include control systems that use
floating suction pressure logic to reset the target saturated suction temperature based on the
temperature requirements of the attached refrigeration display cases or walk-ins.
EXCEPTION 1 to Section 127 (b) 1: Single compressor systems that do not have continuously
variable capacity capability.
EXCEPTION 2 to Section 127 (b) 1: Suction groups that have a design saturated suction
temperature of 30°F or higher, or suction groups that comprise the high stage of a two-stage or
cascade system or that primarily serve chillers for secondary cooling fluids.
2. Liquid subcooling shall be provided for all low temperature parallel compressor systems with a
design saturated suction temperature of -10°F or lower, with the subcooled liquid temperature
maintained continuously at 50°F or less at the exit of the subcooler, using compressor economizer
port(s) or a separate parallel medium or high temperature suction group operating at a saturated
suction temperature of 18°F or higher.
EXCEPTION 1 to Section 127 (b) 2: Single compressor systems.
EXCEPTION 2 to Section 127 (b) 2: Low temperature cascade systems that condense into another
refrigeration system rather than condensing to ambient temperature.

Page 59
2013 California Building Energy Efficiency Standards October 2011
EXCEPTION 3 to Section 127 (b) 2: Existing compressors that are reused for an expansion or
remodel,
(c) Display Cases.
2. Lighting in refrigeration display cases, and lights on glass doors installed on walk-in coolers and
freezers shall be controlled by either A or B:
a. Automatic time switch controls to turn off lights during non-business hours. Use of timed
overrides to turn the lights for stocking shall not exceed one hour for any case line-up or
walk-in and if manually imitated shall time-out automatically.
b. Motion sensor controls on each case that reduce display case lighting power by at least
50% within 30 minutes after the area near the case is vacated.
EXCEPTION 1 to Section 127 (c) 1: Stores which are normally open for business 140 hours or more
per week.
3. Upright low temperature display cases that are designed for a supply air temperature of 5°F or
lower shall utilize reach-in glass doors.
(d) Refrigeration Heat Recovery
1. HVAC systems shall utilize heat recovery from refrigeration system(s) for space heating, using no
less than 25% of the sum of the design Total Heat of Rejection of all refrigeration systems that
have individual Total Heat of Rejection values of 150,000 BTU/Hr or greater at design conditions.
EXCEPTION 1 to Section 127 (d) 1: Stores located in Climate Zone CTZ15.
5. EXCEPTION 2 to Section 127 (d) 1: HVAC systems that are reused for an expansion or
remodel.
2. The increase in HFC refrigerant charge associated with refrigeration heat recovery equipment and
piping shall be no greater than 0.35 lbs per 1,000 BTU/Hr of heat recovery heating capacity.
TITLE 24 PART 11 - CALIFORNIA GREEN BUILDING STANDARDS CODE
REQUIREMENTS FOR SUPERMARKET REFRIGERATION
(a) CO2 Indirect or Cascade Cooling Systems
1. Cooling for all refrigerated display cases and walk-in coolers and freezers shall be provided using
carbon dioxide (CO2), connected to compressors as a direct expansion refrigerant, or as a phase-
change indirect cooling fluid.
EXCEPTION 1 to Section (a) 1: Stores with less than 20,000 square feet of sales area.

Page 60
2013 California Building Energy Efficiency Standards October 2011
EXCEPTION 2 to Section (a) 1: Existing compressor systems that are reused for an expansion or
remodel
EXCEPTION 3 to Section (a) 1: For the medium temperature display cases and coolers use of
indirect glycol cooling including the following:
a. Stores with a total medium temperature fixtures and walk-in cooling load of 360,000
BTU/Hr or greater shall have at least one glycol chiller designed with a glycol supply
temperature no lower than 25°F.
b. Glycol supply pump(s) equipped with variable speed drives controlled based on glycol
loop pressure differential and with two-way (no bypass) type control valves at cooling
coils and display cases.
c. Variable speed control on walk-in cooling coil fans, utilizing speed control as primary
temperature control before cycling glycol supply valves, with minimum fan speed no
greater than 70%.
EXCEPTION 4 to Section (a) 1: Direct expansion systems using a Low-GWP Refrigerant.
EXCEPTION 5 to Section (a) 1: Self-contained refrigerated display cases.

Page 61
2013 California Building Energy Efficiency Standards October 2011
6. Appendix A: Rejected Measures This appendix summarizes the measures that were considered for inclusion in the 2013 standards, but
were later dropped from consideration after initial research. These include:
Evaporator Coil Specific Efficiency
Display Case LED Lights
Night Covers on Open Display Cases
Prohibit Hot Gas Defrost
Liquid-Suction Heat Exchangers
Walk-in Variable Speed Fan Control
6.1 Evaporator Coil Specific Efficiency Evaporator coil specific efficiency (Btu/hr/Watt at a standard condition) was considered for inclusion
in the Title 24 standard. Research was to be conducted for as many as five or more families of
evaporator coils, including consideration of coil sizes, refrigerant feed type (direct expansion vs.
flooded/recirculated), considerations for long-throw and penthouse (ducted) configurations, freezer
and cooler coils, fans required for air mixing (throw length), with potential to research other variants.
Existing work has already been completed for smaller evaporators as part of the 2008 Title 20
appliance efficiency standards, where an initial study of a large portion of the available evaporator
coils showed a very wide range in evaporator fan power per unit of capacity (specific efficiency).
Initial research into the feasibility of this measure revealed several challenges:
Evaporator coils are not rated to any performance standard. Capacity is not published per
AHRI standards. Power is often not published at all, and when available is almost always the
nominal motor power, not the applied power. Furthermore, for smaller units, the nominal motor
power is typically regarded as a generalization, with actual shaft power often differing from
nominal power by as much as 100%. Until evaporators are rated and published according to a
standard, the actual performance will remain largely unknown, and it is very likely that
evaporators will increase in size if they are rated, tested and certified to a standard.
Requiring ratings to AHRI conditions (and certified ratings) would very likely cause extensive
changes to evaporator coil ratings since the catalog values now are ―commercialized‖ by most
accounts, at least on smaller models.
While mandating an efficiency requirement to prohibit the worst-performing models would yield
significant savings, it is recommended that this measure be deferred until certification and testing is
widely implemented for this equipment.
6.2 Display Case LED Lights The feasibility and cost-effectiveness of implementing LED lights in reach-in glass door cases and
open display cases was evaluated. The savings and cost-effectiveness of this measure were very
attractive. However, several issues were discovered during preliminary analysis of this measure:

Page 62
2013 California Building Energy Efficiency Standards October 2011
For medium-temperature open display cases, stakeholders responded that extensive study was
conducted to gauge the economics of LED lights, which revealed that products sold in less volume
under LED lighting than under conventional lighting. LED lights do not illuminate the product as
effectively as conventional fluorescent lighting.
For the low-temperature reach-in display cases with doors, door lighting requirements are pre-
empted by federal display case standards.
6.3 Night Covers on Open Display Cases The feasibility and cost-effectiveness of requiring night covers on all open display cases was
evaluated. Air curtains were assumed to reduce infiltration into open upright medium-temperature
display cases during non-business and non-stocking hours.
Analysis showed that the measure was not cost-effective, based on poor TDV economics, particularly
when labor to put up and take down the night covers on a daily basis is considered.
6.4 Prohibit Gas Defrost The analysis evaluated the cost-effectiveness of prohibiting hot gas defrost for walk-in evaporator
coils and refrigerated display cases. Acceptable methods of defrost would be electric resistance, or
off-cycle.
Although gas defrost uses less energy than electric defrost, gas defrost requires valving that increases
head pressure and consequently requires a higher refrigerant charge. Therefore, by prohibiting gas
defrost, this measure is assumed to reduce charge size by up to 10%. Gas defrost is also expected to
increase the potential for leaks due to the need for additional piping and valves. Thus, prohibiting hot
gas defrost is also assumed to reduce refrigerant leak rates by 5%.
Figure 40 summarizes the preliminary results from the direct and indirect emissions analysis of this
measure based on only one climate zone (Sacramento [CTZ12]).
Annual Refrigerant
Savings Range
Annual Refrigerant
Savings Range
Annual Energy
Savings
Net Annual Savings
Range
Pounds MTCO2eq MTCO2eq
MTCO2eq
Low High Low High Low High
SXX Average 25 42 45 74 -3 42 71
MXX Average 34 50 60 89 -15 45 75
LXX Average 140 212 253 384 -17 236 367
XAX Average 21 35 38 63 -11 27 52
XEX Average 20 33 36 60 -12 25 48
XFX Average 134 201 242 363 -11 230 352
All Average 66 101 119 182 -11 108 171
Figure 40: Sacramento GHG savings results for no hot gas defrost

Page 63
2013 California Building Energy Efficiency Standards October 2011
Figure 41 summarizes the net impacts of this measure on lifetime costs, including the monetized
benefit of avoided GHG emissions in the same climate zone.
Measure/
Maintenance
Cost ($)
Refrigerant Cost
Savings Range ($) TDV Energy
Cost
Savings ($)
Net Lifetime Savings
Range ($)
Benefit/Cost Ratio
Range ($)
Low High Low High Low High
SXX Average $0 $6,717 $10,511 -$18,138 -$11,421 -$7,627 0.37 0.58
MXX Average $0 $33,482 $52,882 -$102,124 -$68,642 -$49,241 0.33 0.52
LXX Average $0 $41,307 $64,626 -$116,046 -$74,739 -$51,420 0.36 0.56
XAX Average $0 $27,234 $43,996 -$78,747 -$51,514 -$34,751 0.35 0.56
XEX Average $0 $48,352 $72,528 -$78,979 -$30,627 -$6,451 0.61 0.92
XFX Average $0 $16,512 $26,422 -$78,687 -$62,174 -$52,264 0.21 0.34
All Average $0 $27,169 $42,673 -$78,769 -$51,600 -$36,096 0.34 0.54
Figure 41: Sacramento cost savings analysis results for no hot gas defrost
As shown, when GHG emission reductions associated with reduced R-404A/507 refrigerant leakage
are accounted for, significant net GHG benefits can be realized. However, this measure is not cost-
effective based on TDV energy costs, and the refrigerant and carbon cost savings associated with
reduce refrigerant emissions are not sufficient to render the measure cost-effective. As a result, this
measure was removed from consideration.
6.5 Walk-in Variable Speed Fan Control
The CASE team has received strong industry concern about this requirement. The measure has very
attractive economics for owners, but because of these concerns, which will initially require special
attention and engineering, we recommend this measure not be considered for this round of the
standards update. We will continue to dialogue with industry to determine a long term solution to
improve energy efficiency while maintaining product quality. Presented below is the walk-in variable
speed fan control measure analysis, in its entirety.
The feasibility and cost-effectiveness of variable-speed control of evaporator fans in walk-in was
evaluated. The measure analysis assumes modulation of the speed of all walk-in air unit fans in
unison (at the same speed) as the primary means of space temperature control.
For the Base Case, no fan speed control is assumed; walk-in air unit fans are assumed to run at full-
speed at all hours. To simulate variable-speed fan control, a part-load performance curve representing
an approximate ―third-power‖ relationship between % fan speed and % fan power was utilized.
The minimum fan speed was assumed to be 70%, and to account for realistic variations in control
response and setpoints than are not readily captured in an hourly simulation, the fans were scheduled
to run at 90% speed for four full, non-consecutive hours per day, regardless of the actual cooling
demand. In normal operation the fan speed would be a function of cooling demand only; it would not
be expected to or required to have these mandatory minimum speeds. However, in order to account
for the many different walk-in/coil configurations and periodic variations in stocking levels (i.e.
occasional severe overstocking) mentioned by shareholders, a minimum duty cycle at full speed is
anticipated to provide greater air circulation, if necessary.

Page 64
2013 California Building Energy Efficiency Standards October 2011
6.5.1 Analysis results by climate zone
The walk-in variable speed fan control measure was evaluated for all system types and in all climate
zones. Figure 42 below summarizes the simulation results for the walk-in variable speed control
measure:
Energy
Savings
(kWh)
Energy
Savings/
SF
(kWh)
TDV Cost
Savings ($)
TDV Cost
Savings /SF
($)
Measure
Cost ($)
Benefit/
Cost Ratio
SXX Average 3,971 0.25 $9,499 $0.60 $5,377 1.77
MXX Average 26,677 0.45 $63,330 $1.06 $15,529 4.08
LXX Average 143,019 0.88 $343,523 $2.12 $23,667 14.51
XAX Average 57,077 0.52 $137,278 $1.24 $14,858 9.24
XEX Average 56,224 0.51 $134,362 $1.22 $14,858 9.04
XFX Average 59,533 0.54 $142,502 $1.30 $14,858 9.59
All Average
CTZ01 - Arcata 56,615 0.52 $134,578 $1.229 $14,858 9.06
CTZ03 – Oakland 57,182 0.52 $136,760 $1.245 $14,858 9.20
CTZ05 – Santa Maria 57,072 0.52 $136,590 $1.245 $14,858 9.19
CTZ07 – San Diego 58,138 0.53 $140,719 $1.283 $14,858 9.47
CTZ08 - Fullerton 58,095 0.53 $138,707 $1.260 $14,858 9.34
CTZ10 – Riverside 58,172 0.53 $139,038 $1.262 $14,858 9.36
CTZ12 – Sacramento 57,886 0.53 $139,601 $1.266 $14,858 9.40
CTZ13 – Fresno 58,275 0.53 $140,384 $1.271 $14,858 9.45
CTZ14 – Palmdale 57,930 0.53 $138,453 $1.253 $14,858 9.32
CTZ15 – Palm
Springs 59,525 0.54 $143,012 $1.292 $14,858 9.63
Maximum 153,159 0.94 $369,171 $2.277 $23,667 15.60
Minimum 3,763 0.24 $8,917 $0.563 $5,377 1.66
Figure 42: Statewide savings results for walk-in variable-speed fan control measure
The analysis shows that walk-in variable speed control is cost-effective for all system configurations
and in all climate zones.
The proposed code requirement consists of mandatory control of fan-powered direct-expansion (DX)
evaporators or secondary cooling coils in walk-in freezers and coolers, utilizing variable speed fan
control as the primary means of space temperature control.
Control integration requirements

Page 65
2013 California Building Energy Efficiency Standards October 2011
For DX evaporators, speed control must be the primary means of temperature control, before
other temperature control means, including cycling of liquid line solenoids, throttling of suction
regulators (electronic or manual) or floating suction pressure on the associated suction group, if
the walk-in is used for floating suction pressure control. Fan speed must reduce to minimum
speed before other means of temperature control are applied.
For secondary cooling coils (e.g. glycol or CO2) speed control must be the primary means of
temperature control before other flow controls are applied.
6.5.2 Industry concerns regarding sufficient airflow and product quality
Numerous concerns were raised by stakeholders. The two primary concerns are 1) the concern for air
circulation since boxes have varied configurations and can be overstocked periodically, to the point
that air doesn‘t circulate properly even at full speed operation and 2) the lack of industry experience
with this measure which limits the ability to comment one way or the other. .
Improved air circulation
Two options have been discussed in stakeholder meetings to address the need for improved air
circulation at certain times. One method would force full speed operation on a duty-cycle basis, such
as 25% of every hour, regardless of temperature. Another method would allow forced full speed run
time for a longer period, such as 8 hours to address a heavy product stock level, where the airflow
may be blocked such that full speed would not be achieved simply based on space temperature.
Lack of industry experience
Additional discussion and stakeholder input is needed to fully develop this proposed code language.
While there are very few examples of speed controlled evaporator fans in supermarkets, there are
many examples in other industrial and commercial applications, and vendors of evaporators for
supermarkets have been very active and innovative in recent months. One coil manufacturer currently
has the motor technology to accept a fan speed control signal, while another can implement the motor
technology at a cost premium. One air unit manufacturer has stated that they do not have fan motors
that are variable-speed capable, and they are not currently pursuing the technology. One controls
manufacturer stated that air unit variable speed can be implemented today, but it is considered a
special request. Were demand for the technology to increase, the logic algorithm could be integrated
into the manufacturer‘s standard offering which would eliminate the ―special request‖ cost premium.
6.6 Liquid-Suction Heat Exchangers The CASE team has received strong industry concern about leakage problems with liquid-suction
heat exchangers. Therefore, despite the potential energy savings and high benefit/cost ratios, we will
not propose a mandatory requirement for liquid suction heat exchangers on all display cases and
walk-ins. We will continue to dialogue with industry to determine a long term solution to both the
energy and the leakage issues. Presented below is the full analysis of liquid-suction heat exchangers,
in its entirety.

Page 66
2013 California Building Energy Efficiency Standards October 2011
This measure evaluates the feasibility and cost-effectiveness of high-performance liquid-suction heat
exchangers (LSHXs) on display cases and walk-ins. A LSHX subcools the liquid refrigerant entering
a refrigeration circuit load (either a walk-in evaporator coil or display case lineup) using the relatively
cold suction gas exiting the case or walk-in, increasing the capacity of the liquid refrigerant to
perform useful refrigeration. Since most systems have a substantial amount of non-productive
parasitic heat gain (i.e. superheat) between the load and the compressor, the LSHX essentially
recovers capacity that would otherwise be lost. The subcooling provided by the LSHXs also helps
maintain system stability by minimizing flash gas at the expansion valve.
A number of Baseline adjustments were made to achieve an accurate performance evaluation for this
measure. The basis of comparison for liquid-suction heat exchangers was a system with floating head
pressure to a 70°F minimum SCT with variable-speed condenser fan control with variable-setpoint
(ambient-following) control logic, as well as mechanical subcooling of the low-temperature systems
as described previously.
Liquid-suction heat exchangers were simulated as having both a subcooling effect on liquid
refrigerant temperatures, as well as a superheating effect on the suction vapor returning to the
compressor—with the associated impacts on mass-flow pumping efficiency. Figure 43 and Figure 44
illustrate the suction vapor superheat assumptions for both the Base Case and the LSHX for MT and
LT systems, respectively, while Figure 45 describes the assumed LSHX sizing for this analysis.
Sizing is based on R-404A refrigerant.
Base Case LSHX Case
Saturated Evaporating Temperature (SET) 17°F Same as Base Case
Productive Superheat in Evaporator Coil
and Case/Walk-In 8°F Same as Base Case
Leaving Evaporator Coil Gas Temperature 25°F Same as Base Case
Return Gas Temperature at Compressor
Inlet
40°F (central systems),
35°F (distributed systems)
48°F (15°F superheat in LSHX,
8°F non-productive superheat after LSHX)
Figure 43: Suction line heat gain assumptions (MT systems)
Base Case LSHX Case
Saturated Evaporating Temperature (SET) -22°F Same as Base Case
Productive Superheat in Evaporator Coil
and Case/Walk-In 10°F Same as Base Case
Leaving Evaporator Coil Gas Temperature -12°F Same as Base Case
Return Gas Temperature at Compressor
Inlet
23°F (central systems),
18°F (distributed systems)
35°F (35°F superheat in LSHX,
12°F non-productive superheat after LSHX)
Figure 44: Suction line heat gain assumptions (LT systems)
Suction Group Liquid Subcooling Suction Gas Superheat
Low-Temperature (LT) 17°F 35°F
Medium-Temperature (MT) 7°F 15°F
Figure 45: LSHX sizing assumptions for cost and performance

Page 67
2013 California Building Energy Efficiency Standards October 2011
6.6.1 Analysis results by climate zone
The liquid-suction heat exchanger (LSHX) measure was evaluated separately for medium temperature
walk-ins, low temperature walk-ins, medium temperature display cases, and low-temperature display
cases for all system types and in all climate zones. Figure 46 through Figure 49 below summarize the
simulation results for the LSHX measures:
Energy
Savings
(kWh)
Energy
Savings/ SF
(kWh)
TDV Cost
Savings ($)
TDV Cost
Savings /SF ($)
Measure
Cost ($)
Benefit/
Cost Ratio
SXX Average 251 0.02 $ 439 $ 0.03 $ 282 1.56
MXX Average 1,686 0.03 $ 3,618 $ 0.06 $ 1,801 2.01
LXX Average 8,352 0.05 $ 18,254 $ 0.11 $ 3,401 5.37
XAX Average 3,100 0.03 $ 7,073 $ 0.06 $ 1,828 3.87
XEX Average 3,137 0.03 $ 6,550 $ 0.06 $ 1,828 3.58
XFX Average 3,905 0.04 $ 8,245 $ 0.08 $ 1,828 4.51
All Average
CTZ01 - Arcata 2,480 0.02 $ 5,067 $ 0.05 $ 1,828 2.77
CTZ03 – Oakland 2,888 0.03 $ 6,102 $ 0.05 $ 1,828 3.34
CTZ05 – Santa Maria 2,823 0.03 $ 5,887 $ 0.05 $ 1,828 3.22
CTZ07 – San Diego 3,445 0.03 $ 7,262 $ 0.06 $ 1,828 3.97
CTZ08 - Fullerton 3,602 0.03 $ 7,660 $ 0.07 $ 1,828 4.19
CTZ10 – Riverside 3,651 0.03 $ 8,044 $ 0.07 $ 1,828 4.40
CTZ12 – Sacramento 3,366 0.03 $ 7,460 $ 0.07 $ 1,828 4.08
CTZ13 – Fresno 3,670 0.03 $ 8,157 $ 0.07 $ 1,828 4.46
CTZ14 – Palmdale 3,422 0.03 $ 7,589 $ 0.07 $ 1,828 4.15
CTZ15 – Palm Springs 4,948 0.05 $ 11,144 $ 0.10 $ 1,828 6.10
Maximum 13,990 0.09 $ 32,137 $ 0.20 $ 3,401 9.45
Minimum -193 -0.01 $ (756) $ (0.05) $ 282 -2.68
Figure 46: Statewide savings analysis for liquid-suction heat exchangers (MT Walk-Ins)
Energy
Savings
(kWh)
Energy
Savings/
SF (kWh)
TDV Cost
Savings ($)
TDV Cost
Savings /SF ($)
Measure
Cost ($)
Benefit/
Cost Ratio
SXX Average 607 0.04 $1,252 $0.08 $452 2.77
MXX Average 4,491 0.08 $8,943 $0.15 $718 12.46
LXX Average 46,961 0.29 $93,788 $0.58 $5,263 17.82

Page 68
2013 California Building Energy Efficiency Standards October 2011
XAX Average 16,119 0.12 $33,067 $0.25 $2,144 15.42
XEX Average 16,878 0.13 $33,190 $0.26 $2,144 15.48
XFX Average 18,825 0.15 $36,990 $0.29 $2,144 17.25
All Average
CTZ01 - Arcata 15,192 0.12 $29,343 $0.227 $2,144 13.69
CTZ03 – Oakland 16,157 0.13 $31,666 $0.246 $2,144 14.77
CTZ05 – Santa Maria 15,957 0.12 $31,218 $0.242 $2,144 14.56
CTZ07 – San Diego 17,518 0.14 $34,723 $0.272 $2,144 16.19
CTZ08 - Fullerton 17,726 0.14 $35,071 $0.274 $2,144 16.36
CTZ10 – Riverside 17,826 0.14 $35,934 $0.280 $2,144 16.76
CTZ12 – Sacramento 17,148 0.13 $34,877 $0.272 $2,144 16.27
CTZ13 – Fresno 17,970 0.14 $36,521 $0.284 $2,144 17.03
CTZ14 – Palmdale 17,333 0.13 $35,070 $0.272 $2,144 16.36
CTZ15 – Palm Springs 20,703 0.16 $42,187 $0.325 $2,144 19.67
Maximum 64,175 0.40 $138,790 $0.856 $5,263 26.37
Minimum 446 0.03 $863 $0.054 $452 1.91
Figure 47: Statewide savings analysis for liquid-suction heat exchangers (LT Walk-Ins)
Energy
Savings
(kWh)
Energy
Savings/
SF (kWh)
TDV Cost
Savings ($)
TDV Cost
Savings /SF
($)
Measure
Cost ($)
Benefit/
Cost Ratio
SXX Average 3,536 0.22 $7,507 $0.47 $1,577 4.76
MXX Average 15,663 0.26 $33,934 $0.57 $6,710 5.06
LXX Average 2,329 0.01 $5,052 $0.03 $840 6.02
XAX Average 5,962 0.14 $13,710 $0.32 $3,042 4.51
XEX Average 6,761 0.16 $13,843 $0.32 $3,042 4.55
XFX Average 8,597 0.20 $18,113 $0.42 $3,042 5.95
All Average
CTZ01 - Arcata 5,680 0.13 $11,327 $0.267 $3,042 3.72
CTZ03 – Oakland 6,339 0.15 $13,073 $0.307 $3,042 4.30
CTZ05 – Santa Maria 6,155 0.14 $12,527 $0.294 $3,042 4.12
CTZ07 – San Diego 7,766 0.18 $16,232 $0.378 $3,042 5.34
CTZ08 - Fullerton 7,607 0.17 $16,138 $0.370 $3,042 5.30

Page 69
2013 California Building Energy Efficiency Standards October 2011
CTZ10 – Riverside 7,562 0.18 $16,720 $0.387 $3,042 5.50
CTZ12 – Sacramento 7,022 0.16 $15,660 $0.362 $3,042 5.15
CTZ13 – Fresno 7,559 0.17 $16,911 $0.387 $3,042 5.56
CTZ14 – Palmdale 6,600 0.15 $14,719 $0.338 $3,042 4.84
CTZ15 – Palm
Springs 9,466 0.22 $21,671 $0.492 $3,042 7.12
Maximum 24,007 0.40 $52,944 $0.889 $6,710 11.88
Minimum 1,307 0.01 $2,385 $0.015 $840 2.26
Figure 48: Statewide savings analysis for liquid-suction heat exchangers (MT display cases)
Energy
Savings
(kWh)
Energy
Savings/
SF
(kWh)
TDV Cost
Savings ($)
TDV Cost
Savings /SF
($)
Measure
Cost ($)
Benefit/
Cost Ratio
SXX Average 7,344 0.46 $14,339 $0.90 $1,095 13.10
MXX Average 23,222 0.39 $46,457 $0.78 $2,592 17.92
LXX Average 10,781 0.07 $21,543 $0.13 $2,953 7.30
XAX Average 12,269 0.28 $25,085 $0.56 $2,213 11.33
XEX Average 13,261 0.29 $25,839 $0.57 $2,213 11.67
XFX Average 15,557 0.34 $30,611 $0.67 $2,213 13.83
All Average
CTZ01 - Arcata 12,345 0.28 $23,747 $0.532 $2,213 10.73
CTZ03 – Oakland 13,066 0.29 $25,528 $0.569 $2,213 11.53
CTZ05 – Santa Maria 12,890 0.29 $25,050 $0.560 $2,213 11.32
CTZ07 – San Diego 14,394 0.32 $28,375 $0.624 $2,213 12.82
CTZ08 - Fullerton 14,047 0.31 $27,867 $0.610 $2,213 12.59
CTZ10 – Riverside 14,045 0.31 $28,418 $0.625 $2,213 12.84
CTZ12 – Sacramento 13,482 0.30 $27,503 $0.606 $2,213 12.43
CTZ13 – Fresno 14,143 0.31 $28,741 $0.631 $2,213 12.98
CTZ14 – Palmdale 13,396 0.30 $27,140 $0.600 $2,213 12.26
CTZ15 – Palm Springs 16,018 0.35 $32,093 $0.701 $2,213 14.50
Maximum 30,598 0.57 $60,349 $1.179 $2,953 23.28
Minimum 5,896 0.05 $11,018 $0.096 $1,095 5.26
Figure 49: Statewide savings analysis for liquid-suction heat exchangers (LT display cases)

Page 70
2013 California Building Energy Efficiency Standards October 2011
The results tables show that the benefit/cost ratio for all system configurations and in all climate zones
for all LSHX types is greater than 1—with the exception of certain MT walk-in LSHXs in small
stores. Medium-temperature walk-in LSHX simulations with benefit/cost ratios less than 1 are shown
in Figure 50.
Configuration
Energy
Savings
(kWh)
Energy
Savings/ SF
(kWh)
TDV Cost
Savings ($)
TDV Cost
Savings /SF
($)
Measure
Cost ($)
Benefit/
Cost
Ratio
CTZ01 - Arcata
SAC 158 0.01 $214 $0.013 $282 0.76
SAD 129 0.01 $267 $0.017 $282 0.95
CTZ03 – Oakland SAC 195 0.00 -$409 -$0.026 $282 -1.45
CTZ05 – Santa Maria SAC 16 0.00 -$436 -$0.028 $282 -1.55
CTZ07 – San Diego SAC -193 -0.01 -$756 -$0.048 $282 -2.68
CTZ08 - Fullerton SAC 245 0.02 -$214 -$0.013 $282 -0.76
CTZ10 – Riverside SAC 278 0.02 -$18 -$0.001 $282 -0.06
CTZ12 – Sacramento SAC 245 0.02 -$214 -$0.013 $282 -0.76
CTZ13 – Fresno SAC 18 0.00 -$667 -$0.042 $282 -2.36
CTZ14 – Palmdale SAC 95 0.01 -$445 -$0.028 $282 -1.58
CTZ15 – Palm Springs SAC 65 0.00 -$36 -$0.002 $282 -0.13
Figure 50: MT walk-in LSHX simulations with BC less than 1.0
Figure 50 shows the small supermarket prototype with air-cooled central systems not cost-effective in
any simulated climate zone. The small supermarket medium-temperature walk-in boxes are all small,
compared to the large supermarket and big-box store which both have a variety of small and large MT
walk-ins. LSHX purchase price is non-linear with relation to capacity, and there is a size threshold
for walk-in boxes where the savings benefit does not justify the cost.
To further investigate this point, Figure 51 shows a breakdown of LSHX results for individual MT
walk-ins. The results are for the large supermarket prototype, since the large supermarket has the
most variety of MT walk-in sizes.
Walk-In
Area
(SF)
Savings
(kWh/SF)
TDV Savings
($TDV)
LSHX Cost
($)
B/C
Ratio
CTZ01 - Arcata
Deli Cooler 64 28.6 $66 $149 0.44
Bakery Retarder 70 31.3 $72 $151 0.48
Meat Holding 91 40.7 $93 $155 0.60
Wine Cooler 121 54.1 $124 $160 0.78
Produce Cooler 400 179.0 $411 $199 2.07
Meat Cooler 540 241.6 $554 $224 2.47
Dairy Cooler 656 293.5 $673 $241 2.79
All WI 1942 869.0 $1,994 $1,801 1.11

Page 71
2013 California Building Energy Efficiency Standards October 2011
CTZ03 - Oakland
Deli Cooler 64 40.9 $101 $149 0.67
Bakery Retarder 70 44.7 $110 $151 0.73
Meat Holding 91 58.2 $143 $155 0.93
Wine Cooler 121 77.3 $190 $160 1.19
Produce Cooler 400 255.6 $629 $199 3.17
Meat Cooler 540 345.1 $849 $224 3.78
Dairy Cooler 656 419.2 $1,031 $241 4.28
All WI 1942 1241.0 $3,053 $1,801 1.69
CTZ05 - Santa Maria
Deli Cooler 64 39.0 $94 $149 0.63
Bakery Retarder 70 42.7 $103 $151 0.69
Meat Holding 91 55.5 $134 $155 0.87
Wine Cooler 121 73.8 $179 $160 1.12
Produce Cooler 400 243.9 $590 $199 2.97
Meat Cooler 540 329.2 $797 $224 3.55
Dairy Cooler 656 400.0 $968 $241 4.02
All WI 1942 1184.0 $2,866 $1,801 1.59
CTZ07 - San Diego/Lindbergh
Deli Cooler 64 63.7 $143 $149 0.96
Bakery Retarder 70 69.6 $156 $151 1.04
Meat Holding 91 90.5 $203 $155 1.31
Wine Cooler 121 120.4 $270 $160 1.69
Produce Cooler 400 397.9 $893 $199 4.50
Meat Cooler 540 537.2 $1,205 $224 5.37
Dairy Cooler 656 652.6 $1,464 $241 6.07
All WI 1942 1932.0 $4,334 $1,801 2.41
CTZ08 - Fullerton
Deli Cooler 64 65.5 $142 $149 0.95
Bakery Retarder 70 71.6 $156 $151 1.03
Meat Holding 91 93.1 $202 $155 1.31
Wine Cooler 121 123.8 $269 $160 1.68
Produce Cooler 400 409.3 $889 $199 4.48
Meat Cooler 540 552.5 $1,200 $224 5.35
Dairy Cooler 656 671.2 $1,458 $241 6.05
All WI 1942 1987.0 $4,316 $1,801 2.40

Page 72
2013 California Building Energy Efficiency Standards October 2011
CTZ10 - Riverside
Deli Cooler 64 62.2 $132 $149 0.88
Bakery Retarder 70 68.1 $144 $151 0.96
Meat Holding 91 88.5 $187 $155 1.21
Wine Cooler 121 117.6 $249 $160 1.56
Produce Cooler 400 388.9 $823 $199 4.14
Meat Cooler 540 525.0 $1,111 $224 4.95
Dairy Cooler 656 637.8 $1,350 $241 5.60
All WI 1942 1888.0 $3,996 $1,801 2.22
CTZ12 - Sacramento
Deli Cooler 64 52.5 $111 $149 0.74
Bakery Retarder 70 57.4 $121 $151 0.80
Meat Holding 91 74.6 $157 $155 1.02
Wine Cooler 121 99.3 $209 $160 1.31
Produce Cooler 400 328.1 $691 $199 3.48
Meat Cooler 540 443.0 $933 $224 4.16
Dairy Cooler 656 538.1 $1,133 $241 4.70
All WI 1942 1593.0 $3,355 $1,801 1.86
CTZ13 - Fresno
Deli Cooler 64 61.3 $132 $149 0.88
Bakery Retarder 70 67.0 $144 $151 0.96
Meat Holding 91 87.1 $188 $155 1.21
Wine Cooler 121 115.8 $250 $160 1.56
Produce Cooler 400 382.9 $825 $199 4.15
Meat Cooler 540 516.9 $1,114 $224 4.96
Dairy Cooler 656 628.0 $1,353 $241 5.61
All WI 1942 1859.0 $4,005 $1,801 2.22
CTZ14 - Palmdale
Deli Cooler 64 52.8 $110 $149 0.73
Bakery Retarder 70 57.7 $120 $151 0.80
Meat Holding 91 75.0 $156 $155 1.01
Wine Cooler 121 99.8 $207 $160 1.30
Produce Cooler 400 329.8 $686 $199 3.45
Meat Cooler 540 445.2 $926 $224 4.13
Dairy Cooler 656 540.8 $1,124 $241 4.66

Page 73
2013 California Building Energy Efficiency Standards October 2011
All WI 1942 1601.0 $3,328 $1,801 1.85
CTZ15 - Palm Springs
Deli Cooler 64 85.9 $194 $149 1.30
Bakery Retarder 70 94.0 $212 $151 1.41
Meat Holding 91 122.2 $276 $155 1.79
Wine Cooler 121 162.5 $367 $160 2.30
Produce Cooler 400 537.2 $1,214 $199 6.11
Meat Cooler 540 725.2 $1,638 $224 7.30
Dairy Cooler 656 881.0 $1,990 $241 8.26
All WI 1942 2608.0 $5,892 $1,801 3.27
Figure 51: MT LSHX results by walk-in with results and BCR on a per-SF basis
Figure 51 shows that, for walk-in boxes less than approximately 150 square feet, liquid suction heat
exchangers are generally not cost-effective for MT walk-ins.
Stakeholders noted that with certain refrigerants (notably R-407x) compressors were sensitive to
return gas temperatures (RGT) and that an increase in RGT as a result of adding LSHXs could
potentially cause excessively high compressor temperatures and premature compressor failure for
low-temperature suction groups. In order to address this concern, the measure costs in the results
tables for LT walk-ins and LT display cases include an additional ¼‖ of suction line insulation
thickness. The additional suction line insulation would reduce non-productive suction line heat gain
between the load and the compressor, and offset the effect of the LSHX.
The simulation analysis for the LSHX measure was conducted with the Base Case refrigerant for each
of the prototype supermarkets (R-404A and R-507). Figure 52 shows the calculated liquid subcooling
and concurrent suction vapor superheat for equal-sized LSHXs for other refrigerants, which are also
in use or being considered.
Liquid Subcooling with
Concurrent 15°F of
Superheat (MT Systems)
Liquid Subcooling with
Concurrent 35°F of
Superheat (LT Systems)
R-404A/507 7°F 17°F
R-407A 9°F 19°F
R-410A 9°F 19°F
Figure 52: Liquid subcooling for R-404A, R-507, R-407A, and R-410A with equal-sized LSHXs
Figure 52 shows that the magnitude of subcooling for R-407A and R-410A is slightly greater for the
same degree of superheat as R-404A and R-507. Conversely, suction vapor superheat would be
slightly less for R-407A and R-410A than R-404A and R-507 for an equal amount of subcooling,
indicating savings and system impacts will be similar with these refrigerants.

Page 74
2013 California Building Energy Efficiency Standards October 2011
7. Appendix B: System Schematics
Figure 53: Small supermarket with central parallel rack compressor system and air-cooled
condensers (SAC)

Page 75
2013 California Building Energy Efficiency Standards October 2011
Figure 54: Small supermarket with distributed compressor systems and air-cooled condensers
(SAD)

Page 76
2013 California Building Energy Efficiency Standards October 2011
Figure 55: Small supermarket with central parallel rack compressor system and evaporative-
cooled condensers (SEC)
Figure 56: Small supermarket with central parallel rack compressor system and water-cooled
condensers served by a central evaporative-cooled fluid cooler (SFC)

Page 77
2013 California Building Energy Efficiency Standards October 2011
Figure 57: Small supermarket with distributed compressor systems and water-cooled
condensers served by a central evaporative-cooled fluid cooler (SFD)

Page 78
2013 California Building Energy Efficiency Standards October 2011
Figure 58: Large supermarket with central parallel rack compressor configuration and air-
cooled condensers (MAC)

Page 79
2013 California Building Energy Efficiency Standards October 2011
Figure 59: Large supermarket with distributed compressor systems and air-cooled condensers
(MAD)

Page 80
2013 California Building Energy Efficiency Standards October 2011
Figure 60: Large supermarket with central parallel rack compressor system and evaporative-
cooled condensers (MEC)

Page 81
2013 California Building Energy Efficiency Standards October 2011
Figure 61: Large supermarket with central parallel rack compressor system and water-cooled
condensers served by a central evaporative-cooled fluid cooler (MFC)

Page 82
2013 California Building Energy Efficiency Standards October 2011
Figure 62: Large supermarket with distributed compressor systems and water-cooled
condensers served by a central evaporative-cooled fluid cooler (MFD)

Page 83
2013 California Building Energy Efficiency Standards October 2011
Figure 63: Big-box store with central parallel rack compressor system and air-cooled
condensers (LAC)

Page 84
2013 California Building Energy Efficiency Standards October 2011
Figure 64: Big-box food store with distributed compressor systems and air-cooled condensers
(LAD)

Page 85
2013 California Building Energy Efficiency Standards October 2011
Figure 65: Big-box store with central parallel compressors and evaporative condenser (LEC)

Page 86
2013 California Building Energy Efficiency Standards October 2011
Figure 66: Big-box food store with central parallel rack compressor system and water-cooled
condensers served by a central evaporative-cooled fluid cooler (LFC)

Page 87
2013 California Building Energy Efficiency Standards October 2011
Figure 67: Large supermarket with distributed compressor systems and water-cooled
condensers served by a central evaporative-cooled fluid cooler (MFD)

Page 88
2013 California Building Energy Efficiency Standards October 2011
8. Appendix C: Base Case Facility Descriptions The Base Case design is the starting point from which energy efficient design alternatives were
considered. Typically, the Base Case would be defined as the current code requirements. However,
there are no existing Title 24 requirements for supermarket refrigeration systems. Consequently, the
Base Case for this analysis is based primarily on current industry-standard practice. Industry-standard
practice is typified by the Base Case used and perfected in the California Savings By Design (SBD)
program, a 10 year old, statewide effort to encourage energy efficiency. The SBD Base Case
characteristics are rooted in extensive consultant experience with historical and recent supermarket
industry standard practice. In addition, Title 20 appliance standards and federal walk-in requirements
also dictate certain Base Case parameters. The Base Case design is comprised of the following
assumptions:

Item Small Supermarket Large Supermarket Big Box Food Store
System Information
Refrigerant R-404A R-404A R-507
System Type Central or Distributed Central or Distributed Central or Distributed
Indirect System None None None
Compressor Information
Compressor Type Semi-hermetic reciprocating
compressors or Scroll compressors
Semi-hermetic reciprocating
compressors or Scroll compressors
Semi-hermetic reciprocating
compressors or Scroll compressors
Compressor Selection for Simulation LT Semi-hermetic: 06DR316
MT Semi-hermetic: 06DR725
LT Scroll: ZF18K4E
MT Scroll: ZB45KCE
LT Semi-hermetic: 06DR316
MT Semi-hermetic: 06DR725
LT Scroll: ZF18K4E
MT Scroll: ZB45KCE
LT Semi-hermetic: 06DR316
MT Semi-hermetic: 06DR725
LT Scroll: ZF18K4E
MT Scroll: ZB45KCE
Number of Suction Groups (2) Two SST Levels:
(1) LT Suction Group
(1) MT Suction Group
No AC Rack
(3) Three SST Levels:
(1) LT Suction Group
(2) MT Suction Groups
No AC Rack
(6) Six SST Levels:
(4) LT Suction Groups
(2) MT Suction Groups
No AC Rack
Means of compressor control Fixed setpoint electronic sequencing
control with on/off cycling
Fixed setpoint electronic sequencing
control with on/off cycling
Fixed setpoint electronic sequencing
control with on/off cycling
Subcooling None None None
Condenser Information
Condenser Type Air cooled, evaporative cooled or
fluid cooler
Air cooled, evaporative cooled or
fluid cooler
Air cooled, evaporative cooled or
fluid cooler
Ambient Temperature Title 24 Joint Appendix JA2
0.1% for design Wet Bulb
Temperature
0.1% for design Dry Bulb
Temperature
Title 24 Joint Appendix JA2
0.1% for design Wet Bulb
Temperature
0.1% for design Dry Bulb
Temperature
Title 24 Joint Appendix JA2
0.1% for design Wet Bulb
Temperature
0.1% for design Dry Bulb
Temperature
Condenser Selection TD (Air cooled condenser) LT: 10°F TD
MT: 15°F TD
LT: 10°F TD
MT: 15°F TD
LT: 10°F TD
MT: 15°F TD

Page 90
2013 California Building Energy Efficiency Standards October 2011
Condenser Selection TD (Evaporative cooled
condenser)
Between 20°F and 25°F TD, based
on WBT:
78°F WBT: 20°F TD
72°F WBT: 23°F TD
68°F WBT: 25°F SCT
Picked the closest TD for the
ambient temperature
Between 20°F and 25°F TD, based
on WBT:
78°F WBT: 20°F TD
72°F WBT: 23°F TD
68°F WBT: 25°F SCT
Picked the closest TD for the
ambient temperature
Between 20°F and 25°F TD, based
on WBT:
78°F WBT: 20°F TD
72°F WBT: 23°F TD
68°F WBT: 25°F SCT
Picked the closest TD for the
ambient temperature
Water-cooled condensers and Fluid Cooler
Selection TD (Water cooled condenser)
Water-cooled condenser approach:
20 F
Fluid cooler approach:
78°F WBT: 15°F TD
72°F WBT: 17°F TD
68°F WBT: 20°F SCT
Picked the closest TD for the
ambient temperature
Water-cooled condenser approach:
20 F
Fluid cooler approach:
78°F WBT: 15°F TD
72°F WBT: 17°F TD
68°F WBT: 20°F SCT
Picked the closest TD for the
ambient temperature
Water-cooled condenser approach:
20 F
Fluid cooler approach:
78°F WBT: 15°F TD
72°F WBT: 17°F TD
68°F WBT: 20°F SCT
Picked the closest TD for the
ambient temperature
Condenser Specific Efficiency (Air cooled
condenser & Evaporative cooled condenser)
140 BTU/W for evaporative @
100ºF SCT & 70ºF WBT
53 BTU/W for air-cooled @ 10ºF
TD
140 BTU/W for evaporative @
100ºF SCT & 70ºF WBT
53 BTU/W for air-cooled @ 10ºF
TD
140 BTU/W for evaporative @
100ºF SCT & 70ºF WBT
53 BTU/W for air-cooled @ 10ºF
TD
Condenser Specific Efficiency (Water cooled
condensers & Fluid cooler)
Fluid cooler specific efficiency: 105
Btu/W
Fluid cooler pump is controlled at a
fixed speed.
Fluid cooler specific efficiency: 105
Btu/W
Fluid cooler pump is controlled at a
fixed speed.
Fluid cooler specific efficiency: 105
Btu/W
Fluid cooler pump is controlled at a
fixed speed.
Condenser Fan Motor Power and Efficiency Motor power is inherent in the Base
Case specific efficiency calculation.
Motor power is inherent in the Base
Case specific efficiency calculation.
Motor power is inherent in the Base
Case specific efficiency calculation.
Means of condenser control Fixed setpoint strategy
Air cooled: fan cycling based on
pressure
Evaporative cooled: two-speed fan
control
Fixed setpoint strategy
Air cooled: fan cycling based on
pressure
Evaporative cooled: two-speed fan
control
Fixed setpoint strategy
Air cooled: fan cycling based on
pressure
Evaporative cooled: two-speed fan
control
Minimum condensing temperature setpoint 85°F SCT 80°F SCT 80°F SCT

Page 91
2013 California Building Energy Efficiency Standards October 2011
Pressure drop at SDT and SCT 2°F 2°F 2°F
Heat recovery (air) None None None
Heat recovery (domestic hot water heating) None None None
Walk-ins and Unit coolers Information
Fan Motor Type Electronically commutated motors
(ECM) in walk-in evaporator coils
for all fan motors < 460V and < 1
hp. Otherwise, PSC fan motors.
Electronically commutated motors
(ECM) in walk-in evaporator coils
for all fan motors < 460V and < 1
hp. Otherwise, PSC fan motors.
Electronically commutated motors
(ECM) in walk-in evaporator coils
for all fan motors < 460V and < 1
hp. Otherwise, PSC fan motors.
Walk-in insulation level R-25 for cooler walls, ceiling and
doors
R-32 for freezer walls, ceiling and
doors
R-28 for freezer floors
R-25 for cooler walls, ceiling and
doors
R-32 for freezer walls, ceiling and
doors
R-28 for freezer floors
R-25 for cooler walls, ceiling and
doors
R-32 for freezer walls, ceiling and
doors
R-28 for freezer floors
Walk-ins served by System A LT Suction Group:
(1) Freezer, (18 x 8 x 9) ft3
MT Suction Group:
(1) Dairy Cooler, (43 x 8 x 9) ft3
(1) Produce Cooler, (11 x 8 x 9) ft3
MT Suction Group:
(1) Deli Cooler, (8 x 8 x 10) ft3
(1) Wine Cooler, (11 x 11 x 10) ft3
(1) Produce Cooler, (20 x 20 x 10)
ft3
LT Suction Group:
(1) ½ POS Freezer #1 (19 x 80 x 22)
ft3
(1) ½ POS Freezer #2 (19 x 80 x 22)
ft3
(1) Bakery Freezer, (19 x 33 x 20)
ft3
Walk-ins served by System B
None MT Suction Group:
(1) Bakery Retarder, (10 x 7 x 10)
ft3
(1) Dairy Cooler, (41 x 16 x 10) ft3
(1) Meat Cooler, (15 x 36 x 10) ft3
(1) Meat Holding, (13 x 7 x 10) ft3
MT Suction Group:
(1) Meat Cooler, 1,504 ft2, Height:
20 ft, odd-shaped
(1) Produce Cooler, (36 x 44 x 22)
ft3
(1) Meat Prep, 1,162 ft2, Height: 10
ft , odd-shaped
(1) Dairy Cooler, (12 x 32 x 10) ft3
(1) Bakery Cooler, (11 x 28 x 10) ft3
(1) ½ POS Cooler (19 x 80 x 22) ft3
Walk-ins served by System C None LT Suction Group: LT Suction Group:

Page 92
2013 California Building Energy Efficiency Standards October 2011
(1) Bakery Freezer, (18 x 18 x 10)
ft3
(1) Grocery Freezer, (36 x 15 x 10)
ft3
(1) ½ POS Freezer #1 (19 x 80 x 22)
ft3
(1) ½ POS Freezer #2, (19 x 80 x
22) ft3
(1) Bakery Freezer, (11 x 28 x 10)
ft3
Walk-ins served by System D
None None MT Suction Group:
(1) Meat Cooler, 1,504 ft2, Height:
20 ft, odd-shaped
(1) Produce Cooler, (36 x 44 x 22)
ft3
(1) Deli Prep, 400 ft2, Height: 10 ft,
odd-shaped
(1) Rotisserie Prep, 188 ft2, Height:
10 ft, odd-shaped
(1) Bakery Cooler, (11 x 28 x 10) ft3
(1) ½ POS Cooler (19 x 80 x 22) ft3
Fan Motor Power Fan motor input wattage Fan motor input wattage Fan motor input wattage
Fan Control Continuous operation with no VFD Continuous operation with no VFD Continuous operation with no VFD
Liquid-suction heat exchangers (direct refrigerant) None None None
Leaving Gas Temperature LT: 30°F
MT: 20°F
LT: 30°F
MT: 20°F
LT: 30°F
MT: 20°F
Defrost Assumptions Defrost Load: 70% of design load
Defrost Effectiveness: 15%
Quantity of Defrosts per Day: 4
Defrost Duration: 15 minutes
Defrost Load: 70% of design load
Defrost Effectiveness: 15%
Quantity of Defrosts per Day: 4
Defrost Duration: 15 minutes
Defrost Load: 70% of design load
Defrost Effectiveness: 15%
Quantity of Defrosts per Day: 4
Defrost Duration: 15 minutes
Display Case Information
Case light wattage Fixture efficiency – standard offer
published by manufacturer.
Fixture efficiency – standard offer
published by manufacturer.
Fixture efficiency – standard offer
published by manufacturer.
Case lighting configuration assumptions For multi-deck meat and deli cases:
2 row canopy lights + all shelves
For multi-deck meat and deli cases:
2 row canopy lights + all shelves
For multi-deck meat and deli cases:
2 row canopy lights + all shelves

Page 93
2013 California Building Energy Efficiency Standards October 2011
lighted (if available)
For multi-deck dairy, beverage and
produce cases: 2 row canopy lights
+ no lighted shelves
lighted (if available)
For multi-deck dairy, beverage and
produce cases: 2 row canopy lights
+ no lighted shelves
lighted (if available)
For multi-deck dairy, beverage and
produce cases: 2 row canopy lights
+ no lighted shelves
Display Case Reach-in Glass Door anti-sweat
heater type & wattage
Low wattage doors Low wattage doors Low wattage doors
Display Case Reach-in Glass Door anti-sweat
heater control on glass door cases
None None None
Night curtains/covers None None None
Indirect Cooling for Display Cases None None None
Defrost Type Electric, Off Cycle or Hot Gas Electric, Off Cycle or Hot Gas Electric, Off Cycle or Hot Gas
Defrost Control Time initiated, per manufacturers
frequency.
Temperature terminated on LT
electric defrost only
Time initiated, per manufacturers
frequency.
Temperature terminated on LT
electric defrost only
Time initiated, per manufacturers
frequency.
Temperature terminated on LT
electric defrost only
Liquid-suction heat exchangers (direct refrigerant) None None None
Electronic expansion valves/case controllers None None None
Leaving Gas Temperature LT: 30°F
MT: 20°F
LT: 30°F
MT: 20°F
LT: 30°F
MT: 20°F
Display Case served by System A MT Suction Group:
(1) Kysor Warren HQD6L, MD
Produce, Case Length: 16 ft
(1) Kysor Warren QD6L, MD Meat,
Case Length: 24 ft
(1) Kysor Warren QD6NL, MD
Deli, Case Length: 24 ft
(1) Kysor Warren HQD6L, MD
Deli, Case Length: 8 ft
(1) Kysor Warren HQD6L, MD
Deli, Case Length: 24 ft
(1) Kysor Warren HQD6L, MD
MT Suction Group:
(1) Sushi Bar, MD Case, Case
Length: 3 ft
(1) Sushi, MD Case, Case Length: 8
ft
(1) Sandwich Prep, MD Case,
Case Length: 10 ft
(1) Hussmann RGPSM, Pizza, Case
Length: 8 ft
(1) Hussmann ESBDVS, Service
Deli, Case Length: 28 ft
(1) Hussmann RBB, Cheese Back
LT Suction Group:
(1) Hill Phoenix ONZ, Dual Temp
Island
Case Length: 160 ft
Evaporator Temperature: -22°F
Discharge Temperature: -13°F
Fan Power: 11 W/ft
No. Fans per 12 ft: 4
Canopy Light W: None
Shelf Light W: None

Page 94
2013 California Building Energy Efficiency Standards October 2011
Beverage, Case Length: 8 ft
(1) Kysor Warren B33, MD Cake,
Case Length: 8 ft
(1) Kysor Warren HQD6L, MD
Package, Case Length: 12 ft
(1) Kysor Warren QDV5V, RI
Dairy, Number of Doors: 7
Bar, Case Length: 12 ft
(1) Hussmann Q1+Wedges, SS
Cheese, Case Length: 26 ft
(1) Hussmann RI4, Cheese Table,
Case Length: 12 ft
(1) Hussmann D5XLEP, SS Deli,
Case Length: 32 ft
(1) Hussmann D5XLEP, Beverage,
Case Length: 56 ft
(1) Hussmann E3, Grab-N-Go, Case
Length: 16 ft
No. Canopy Lights: None
No. Shelves w/ Lights: None
Defrost Type: Hot Gas
Defrost Freq x Duration: 2 x 20
minutes
Display Case served by System B None (1) Structural Concepts, HVOU,
Bakery Service, Case Length: 16 ft
(1) Beverage Air Corp, CDR3950,
Service/Cookie, Case Length: 5 ft
(1) Beverage Air Corp, CDR3968,
Refrigerated Cash Stand, Case
Length: 5 ft
(1) Hussmann RI3, Bakery, Case
Length: 10 ft
(1) Hussmann D5XLEP, Egg, Case
Length: 12 ft
(1) Hussmann D5XLEP, Dairy,
Case Length: 70 ft
(1) Hussmann D5XLEP, Pizza, Case
Length: 6 ft
(1) Hussmann E2V, Fish, Case
Length: 8 ft
(1) Hussmann DSF, Service Fish,
Case Length: 12 ft
(1) Hussmann ESGMVS, Service
Meat, Case Length: 12 ft
MT Suction Group:
(1) Hill Phoenix OMZ, Single-deck
Deli, Case Length: 80 ft
(1) Hill Phoenix O3.75UM, Deli
Island, Case Length: 120 ft

Page 95
2013 California Building Energy Efficiency Standards October 2011
Display Case served by System C None LT Suction Group:
(1) Hussmann RL, Reach-in Ice
Cream, Case Length: 58 doors
(1) Hussmann RL, Reach-in Frozen
Food, Case Length: 59 doors
LT Suction Group:
(1) Hill Phoenix ONZ, Dual Temp
Island, Case Length: 80 ft
(1) Hussmann RID, Roll-in Bakery,
Case Length: 12 ft
Display Case served by System D None None MT Suction Group:
(1) Hill Phoenix OMZ, Single-deck
Deli, Case Length: 56 ft
(1) Hill Phoenix OMZ, Single-deck
Deli, Case Length: 36 ft
Point of Sale (POS) Boxes with Reach-in (RI)
Glass Doors
None None (2) POS Freezer with RI Glass
Doors, Number of Doors: 54 ea.
Freezer
(1) POS Cooler with RI Glass
Doors, Number of Doors: 59
POS Box Reach-in Glass Door anti-sweat heater
type & wattage
Low wattage doors Low wattage doors Low wattage doors
Operation, Occupancy & Schedules Information
Facility size 10,000 ft2
(gross area) 60,700 ft2 (gross area)
57,200 ft2 (conditioned area)
150,000 ft2 (gross area)
Main Sales Interior Spaces Height 15 ft 28 ft 28 ft
Building HVAC Information
Packaged rooftop units (RTU) Packaged Rooftop Units with EER
per Title 24 standards
No. of Packaged Rooftop Units: 3
Packaged Rooftop Units with EER
per Title 24 standards
No. of Packaged Rooftop Units: 8
Packaged Rooftop Units with EER
per Title 24 standards
No. of Packaged Rooftop Units: 18
Main Air Handling Unit None (1) Main Air Handler Unit for Main
Sales area with supply fan motor
efficiency per Title 24.
None
Fan Operation Always On Always On Always on if 24 hour store, follow
store hours if non-24 hours, with
pre-opening allowance and ambient

Page 96
2013 California Building Energy Efficiency Standards October 2011
override allowed.
Temperature Control Two fixed setpoints
No night setpoint adjustment
Two fixed setpoints
No night setpoint adjustment
Two fixed setpoints
No night setpoint adjustment
Main Sales HVAC Cooling Setpoint 74°F 74°F 74°F
Main Sales HVAC Heating Setpoint 70°F 70°F 70°F
Ventilation Control Always On Always On Always On
Envelope & Lighting
Exterior Roof Construction U-factor based on Title 24 – Table
143-A Prescriptive Envelope
Criteria for Roofs
U-factor based on Title 24 – Table
143-A Prescriptive Envelope
Criteria for Roofs
U-factor based on Title 24 – Table
143-A Prescriptive Envelope
Criteria for Roofs
Exterior Wall Construction U-factor based on Title 24 – Table
143-A Prescriptive Envelope
Criteria for Walls
U-factor based on Title 24 – Table
143-A Prescriptive Envelope
Criteria for Walls
U-factor based on Title 24 – Table
143-A Prescriptive Envelope
Criteria for Walls
Roof Absorptivity AGED Reflectance = 0.55 (Title 24
– Table 143-A)
AGED Reflectance = 0.55 (Title 24
– Table 143-A)
AGED Reflectance = 0.55 (Title 24
– Table 143-A)
Skylights No Skylights. Skylights are not
required for enclosed spaces with
ceiling heights equal to or less than
15 feet.
Approximately 1.65% (3.3%
minimum skylight area to skylit
ratio * 50% of floor area) of sales
area is covered by skylights.
Approximately 1.65% (3.3%
minimum skylight area to skylit
ratio * 50% of floor area) of sales
area is covered by skylights.
Skylight Characteristics No Skylights Skylight Type: Glass, curb
U-factor: 1.11
SHGC: 0.46
Visible Transmittance: 0.552
Light setpoint: 75 foot-candles
Skylight Type: Glass, curb
U-factor: 1.11
SHGC: 0.46
Visible Transmittance: 0.552
Light setpoint: 55 footcandles
Daylighting Controls None Power consumption reduction of
lighting by at least 2/3 in response
to available daylight.
(Three step control: 100%, 67%,
33% & 0%)
Power consumption reduction of
lighting by at least 2/3 in response
to available daylight.
(Three step control: 100%, 67%,
33% & 0%)
Lighting Power Density (except for Walk-in
Coolers & Freezers)
1.5 W/ ft2 (Complete Building
Method)
1.5 W/ ft2 (Complete Building
Method)
1.5 W/ ft2 (Complete Building
Method)

Page 97
2013 California Building Energy Efficiency Standards October 2011
Lighting Power Density (Walk-in Coolers &
Freezers)
0.7 W/ ft2 0.7 W/ ft
2 0.7 W/ ft
2
Lighting Control (Main Sales) Non-24 hours stores: 50% reduction
during non-operating hours
24 hr stores: Always ON 100% Non-24 hours stores: 50% reduction
during non-operating hours

9. Appendix D: Refrigeration Schedules and Equipment
Sizing
9.1 Refrigeration Schedules Figure 68, Figure 69, and Figure 70 summarize the refrigeration load schedules employed for this
analysis
Suction
Group ID -
Central
Suction
Group ID -
Distributed
Load ID
Size
lxwxh
#drs or ft
LoadEvap
Temp
Disc Air
TempDef Type
ALT ALT ALT-1 18x8x9 12,100 -20 -10 ElectricALT ALT ALT-2 8 11,160 -23 -16 ElectricALT ALT ALT-3 8 10,680 -23 -16 ElectricALT ALT ALT-4 8 10,680 -18 -9 ElectricALT ALT ALT-5 8 10,680 -18 -9 ElectricALT ALT ALT-6 8 10,680 -18 -9 ElectricALT ALT ALT-7 8 10,680 -18 -9 Electric
76,660 -25°F Design SSTBMT BMT_1 BMT-1 43x8x9 21,400 +24 +34 Off CycleBMT BMT_2 BMT-2 11x8x9 5,600 +50 +60 Off CycleBMT BMT_2 BMT-3 32 43,808 +30 +35 Off CycleBMT BMT_1 BMT-4 40 55,400 +23 +33 Off CycleBMT BMT_2 BMT-5 32 42,208 +23 +33 Off CycleBMT BMT_2 BMT-6 32 43,808 +23 +33 Off CycleBMT BMT_2 BMT-7 24 32,856 +30 +35 Off CycleBMT BMT_1 BMT-8 20 27,380 +30 +35 Off CycleBMT BMT_1 BMT-9 8 8,000 +30 +35 Off CycleBMT BMT_1 BMT-10 24 32,856 +23 +33 Off CycleBMT BMT_1 BMT-11 11 8,250 +30 +35 Off Cycle
321,566 21°F Design SST
Reach-in Dairy Display CaseMD Package Display Case
MD Cake Display CaseMD Beverage Display Case
MD Deli - 3 Display CaseMD Deli - 2 Display CaseMD Deli - 1 Display CaseMD Meat Display Case
MD Produce Display CaseProduce Cooler Walk-in Cooler
Dairy Cooler Walk-in Cooler
RI Frozen Food 5 Display CaseRI Frozen Food 4 Display CaseRI Frozen Food 3 Display CaseRI Frozen Food 2 Display CaseRI Frozen Food 1 Display Case
RI Icecream Display CaseFreezer Walk-in Freezer
Description Type
Figure 68: Small supermarket refrigeration schedule

Measure Information Template Page 99
2013 California Building Energy Efficiency Standards September 2011
Suction
Group ID -
Central
Suction
Group ID -
Distributed
Load ID
Size
lxwxh
#drs or ft
LoadEvap
Temp
Disc Air
TempDef Type
AMT AMT_1 AMT-1 8x8x10 5,900 +26 +36 Off CycleAMT AMT_1 AMT-2 11x11x10 9,260 +26 +36 Off CycleAMT AMT_2 AMT-3 20x20x10 21,800 +26 +36 Off CycleAMT AMT_1 AMT-4 780 78,400 +36 +50 Off CycleAMT AMT_2 AMT-5 3 3,600 +20 +28 Off CycleAMT AMT_2 AMT-6 8 9,400 +20 +24 Off CycleAMT AMT_2 AMT-7 10 6,750 +20 +30 Off CycleAMT AMT_2 AMT-8 8 8,200 +20 +30 Off CycleAMT AMT_1 AMT-9 20 6,400 +20 +25 Off CycleAMT AMT_1 AMT-10 12 18,600 +20 +30 Off CycleAMT AMT_1 AMT-11 26 17,160 +20 +27 Off CycleAMT AMT_1 AMT-12 12 27,500 +20 +27 Off CycleAMT AMT_1 AMT-13 32 48,320 +26 +30 Off CycleAMT AMT_2 AMT-14 48 72,480 +26 +30 Off CycleAMT AMT_2 AMT-15 16 18,880 +21 +29 Off CycleAMT AMT_1 AMT-16 20 29,800 +26 +30 Off CycleAMT AMT_1 AMT-17 20 29,800 +26 +30 Off CycleAMT AMT_2 AMT-18 24 36,240 +26 +30 Off CycleAMT AMT_2 AMT-19 28 42,280 +26 +30 Off Cycle
287 490,770 18°F Design SSTBMT BMT_1 BMT-1 10x7x10 6,250 +26 +36 Off CycleBMT BMT_2 BMT-2 41x16x10 35,550 +26 +36 Off CycleBMT BMT_2 BMT-3 15x36x10 30,150 +26 +36 Off CycleBMT BMT_1 BMT-4 13x7x10 7,550 +26 +36 Off CycleBMT BMT_1 BMT-5 10x7x10 5,800 +32 +38 Off CycleBMT BMT_1 BMT-6 16 17,520 +20 +25 Off CycleBMT BMT_1 BMT-7 5 1,490 +30 +35 Off CycleBMT BMT_1 BMT-8 5 1,650 +30 +35 Off CycleBMT BMT_1 BMT-9 10 18,200 +20 +27 Off CycleBMT BMT_1 BMT-10 12 18,120 +26 +30 Off CycleBMT BMT_2 BMT-11 64 96,640 +26 +30 Off CycleBMT BMT_1 BMT-12 6 9,060 +26 +30 Off CycleBMT BMT_1 BMT-13 8 7,560 +18 +25 Off CycleBMT BMT_1 BMT-14 12 4,800 +20 +28 Off CycleBMT BMT_2 BMT-15 12 3,840 +22 +27 Off CycleBMT BMT_2 BMT-16 28 29,400 +24 +33 Off CycleBMT BMT_2 BMT-17 32 33,600 +24 +33 Off CycleBMT BMT_2 BMT-18 16 10,880 +26 +31 Off CycleBMT BMT_2 BMT-19 6 10,710 +24 +32 Off CycleBMT BMT_1 BMT-20 20 35,700 +24 +32 Off CycleBMT BMT_1 BMT-21 24 42,840 +24 +32 Off CycleBMT BMT_1 BMT-22 20 27,800 +28 +31 Off CycleBMT BMT_1 BMT-23 6 10,710 +24 +32 Off CycleBMT BMT_1 BMT-24 8 12,240 +26 +30 Off CycleBMT BMT_1 BMT-25 12 14,160 +21 +29 Off Cycle
322 492,220 16°F Design SSTCLT CLT CLT-1 18x18x10 20,300 -15 -5 Hot GasCLT CLT CLT-2 12x8x10 8,600 -15 -5 Hot GasCLT CLT CLT-3 36x15x10 30,250 -15 -5 Hot GasCLT CLT CLT-4 62 84,940 -17 -12 Hot GasCLT CLT CLT-5 62 80,600 -9 -5 Hot GasCLT CLT CLT-6 (1/2) 12 + (1) END 6,570 -20 -12 Hot GasCLT CLT CLT-7 (1/2) 12 + (1) END 6,570 -20 -12 Hot GasCLT CLT CLT-8 (1/2) 16 + (1) END 7,870 -20 -12 Hot GasCLT CLT CLT-9 (1/2) 16 + (1) END 7,870 -20 -12 Hot GasCLT CLT CLT-10 (1/2) 12 + (1) END 6,570 -20 -12 Hot GasCLT CLT CLT-11 (1/2) 12 + (1) END 6,570 -20 -12 Hot GasCLT CLT CLT-12 6 8,220 -9 -5 Hot Gas
274,930 -22°F Design SST
NATURAL FOODS Display CaseDUAL TEMP - 6 Display CaseDUAL TEMP - 5 Display CaseDUAL TEMP - 4 Display CaseDUAL TEMP - 3 Display CaseDUAL TEMP - 2 Display Case
Reach-in Frozen Food Display CaseDUAL TEMP - 1 Display Case
Reach-in Ice Cream Display CaseGrocery Freezer Walk-in Freezer
Deli Freezer Walk-in FreezerBakery Freezer Walk-in Freezer
ProducePromo_2 Display CaseNatural Foods Display Case
JuiceEnd Display CaseProduce 5 Display CaseProduce 4 Display CaseProduce 3 Display Case
Produce End Display CaseProducePromo Display Case
Produce 2 Display CaseProduce 1 Display Case
Service Meat Display CaseService Fish Display Case
MD Fish Display CaseMD Pizza Display CaseMD Dairy Display CaseMD Egg Display CaseBakery Display Case
Refrigerated Stand Display CaseService Cookie Display CaseBakery Service Display CaseFloral_Cooler Walk-in CoolerMeat Holding Walk-in CoolerMeat Cooler Walk-in CoolerDairy Cooler Walk-in Cooler
Bakery Retarder Walk-in Cooler
Lunch Meat 2 Display CaseLunch Meat 1 Display Case
Meat 2 Display CaseMeat 1 Display Case
Grab-N-Go Display CaseMD Beverage Display Case
MD Self-serve Deli Display CaseCheese Table Display Case
Self-serve Cheese Display CaseCheese Back Bar Display Case
Service Deli Display CaseMD Pizza, Front Display CaseSandwich Prep Display Case
Sushi Display CaseSushi Bar Display Case
Meat_Prep Walk-in CoolerProduce Cooler Walk-in Cooler
Wine Cooler Walk-in CoolerDeli Cooler Walk-in Cooler
Description Type

Measure Information Template Page 100
2013 California Building Energy Efficiency Standards September 2011
Figure 69: Large supermarket refrigeration schedule
Suction
Group ID -
Central
Suction
Group ID -
Distributed
Load ID
Size
lxwxh or sf
#drs or ft
LoadEvap
Temp
Disc
Air
Temp
Def Type
ALT ALT ALT-1 19x80x22 136,000 -27 -22 ElectricALT ALT ALT-2 19x80x22 118,000 -16 -11 ElectricALT ALT ALT1-3 160 68,000 -25 -10 ElectricALT ALT ALT1-4 19x33x20 32,000 -15 -10 Electric
354,000 -29°F Design SSTBMT BMT_1 BMT-1 1504 sf 63,000 +20 +24 Off CycleBMT BMT_2 BMT-2 36x44x22 97,000 +31 +32 Off CycleBMT BMT_2 BMT-3 1162 sf 70,000 +35 +39 Off CycleBMT BMT_2 BMT-4 12x32x10 47,600 +26 +29 Off CycleBMT BMT_2 BMT-5 11x28x10 12,250 +26 +29 Off CycleBMT BMT_1 BMT-6 19x80x22 94,000 +24 +28 Off CycleBMT BMT_1 BMT-7 60 25,500 +24 +28 Off CycleBMT BMT_1 BMT-8 32 13,600 +24 +28 Off Cycle
422,950 18°F Design SSTCLT CLT1 CLT1-1 19x80x22 136,000 -27 -22 ElectricCLT CLT1 CLT1-2 80 34,000 -25 -10 ElectricCLT CLT1 CLT1-3 19x80x22 120,650 -15 -11 ElectricCLT CLT1 CLT1-4 19x33x20 32,000 -15 -10 ElectricCLT CLT1 CLT1-5 12 32,400 +12 +28 Electric
355,050 -29°F Design SSTDMT DMT_1 DMT-1 1504 sf 63,000 +20 +24 Off CycleDMT DMT_1 DMT-2 36x44x22 97,000 +31 +32 Off CycleDMT DMT_2 DMT-3 400 sf 32,890 +35 +37 Off CycleDMT DMT_2 DMT-4 188 sf 11,500 +35 +40 Off CycleDMT DMT_2 DMT-5 11x28x10 12,250 +26 +29 Off CycleDMT DMT_2 DMT-6 19x80x22 94,000 +24 +28 Off CycleDMT DMT_1 DMT-7 32 35,200 +28 +32 Off CycleDMT DMT_2 DMT-8 36 39,600 +21 +32 Off Cycle
385,440 18°F Design SST
Dairy Display CaseProduce 1 Display Case
1/2 POS Cooler Walk-in CoolerBakery Cooler Walk-in CoolerRotisserie Prep Walk-in Cooler
Deli Prep Walk-in CoolerProduce Cooler Walk-in Cooler
Meat Cooler Walk-in Cooler
Roll-in Bakery Display CaseBakery Freezer Walk-in Freezer
1/2 POS Freezer #2 Walk-in FreezerDual Temp Island Display Case
1/2 POS Freezer #1 Walk-in Freezer
Deli Display CaseMeat Display Case
1/2 POS Cooler Walk-in CoolerBakery Cooler Walk-in CoolerDairy Cooler Walk-in CoolerMeat Prep Walk-in Cooler
Produce Cooler Walk-in CoolerMeat Cooler Walk-in Cooler
Bakery Freezer Walk-in FreezerDual Temp Island Display Case
1/2 POS Freezer #2 Walk-in Freezer1/2 POS Freezer #1 Walk-in Freezer
Description Type
Figure 70: Big-box store refrigeration schedule
9.2 Equipment Sizing per Climate Zone Equipment sizing was established based on typical loads developed for representative new store
designs for the three supermarket prototypes. The design loads for the representative stores were
informed by actual supermarket projects completed in California. Loads that were accounted for in
the equipment sizing include walk-in refrigerated boxes and refrigerated display cases. Large point-
of-sale boxes with reach-in glass doors were included only in the equipment sizing for the Big Box
Food Store. In the equipment selection process, a 1.10 safety factor was used for low temperature
suction groups and a 1.20 safety factor was used for medium temperature suction groups. The
refrigeration systems for each of the prototype supermarkets were sized using design climate data
from the 2008 Joint Appendices. For calculating statewide savings, two system sizes were developed
to typify standard design practice in the California climate zones that have the majority of
supermarkets in the state. Figure 71 describes the three designs, and lists the climate zones where the
designs were simulated.

Measure Information Template Page 101
2013 California Building Energy Efficiency Standards September 2011
Design Climate Type Design City
Design
(0.1%)
DBT/WBT
Simulated in Climate Zones
1 Mild Temperature Santa Maria 90°F/67°F
CTZ01 - Arcata
CTZ03 – Oakland
CTZ05 – Santa Maria
CTZ07 – San Diego (Lindbergh)
2 Medium/Hot-
Temperature Sacramento 104°F/74°F
CTZ08 – Fullerton
CTZ10 – Riverside
CTZ12 – Sacramento Executive Airport
CTZ13 – Fresno
CTZ14 – Palmdale
CTZ15 – Palm Springs
Figure 71: Description of two design climate zones

Measure Information Template Page 102
2013 California Building Energy Efficiency Standards September 2011
10. Appendix E: Charge Size and Leak Rate Assumptions for
Direct Emissions To assess the direct greenhouse gas impacts (i.e., refrigerant emissions) of centralized direct
expansion (DX) systems, distributed systems, and secondary loop systems, assumptions on system
charge size and leak rates were developed, as presented in Table 1 and Table 2. Assumptions
regarding store size and cooling capacity are consistent with those defined under the base case.
Table 1: Assumptions on Charge Size
System
Configuration
Cooling
Capacity
(BTU/hr)
Store Size
(sq ft)
Condenser
Type
Centralized
DX (lbs) Distributed
(lbs) Secondary
Loop (lbs)
Small Supermarket 249,353 10,000
Air 725 360 200
Evaporative 800 400 220
Fluid 435 215 120
Large Supermarket 1,257,920 60,000
Air 3,655 1,830 1,015
Evaporative 4,020 2,015 1,115
Fluid 2,195 1,100 610
Big Box Food Store 1,517,440 150,000
Air 4,410 2,205 1,225
Evaporative 4,850 2,425 1,350
Fluid 2,645 1,325 735
Table 2: Assumptions on Leak Rates
Leak Rate (percent of charge per year) Centralized DX Distributed Secondary Loop
Average 12% 8% 5%
Range (of averages) 10% - 15% 5% - 10% 2% - 8%
The above assumptions were developed based on an in-depth review of available literature on system
charge sizes and leak rates, as well as through consultation with equipment manufacturers and other
industry experts. The remainder of this appendix outlines the specific sources and methodologies used
in developing these assumptions, as well as the limitations that should be considered.
10.1 Summary of Information Obtained on Charge Size and Leak Rates ICF reviewed the following sources to compile estimates on charge size and leak rates for DX
systems, distributed systems, and secondary loop systems:
Armines. 2009. Inventory of Direct and Indirect GHG Emissions from Stationary Air
Conditioning and Refrigeration Sources, with Special Emphasis on Retail Food Refrigeration

Measure Information Template Page 103
2013 California Building Energy Efficiency Standards September 2011
and Unitary Air Conditioning. Prepared for State of California Air Resources Board. March
2009.
Baxter, Van D. 2003. IEA Annex 26: Advanced Supermarket Refrigeration/Heat
Recovery Systems. Oak Ridge National Laboratory. Available online at,
http://www.ornl.gov/~webworks/cppr/y2003/rpt/117000.pdf.
California Air Resource Board (CARB). 2009. Initial Statement of Reasons for
Proposed Rulemaking. Prepared by C. Seidler, B Baythavong, G Gallagher, and K Bowers of
the California Air Resource Board, Research Division. October 23, 2009. Available online at,
http://www.arb.ca.gov/cc/reftrack/reftrackrefs.htm
Heschong Mahone Group, Inc. and CTG Energetics, Inc. 2008. White Paper on
Approaches to Reducing Leakage and Improving the Performance of Supermarket
Refrigeration Systems. Prepared for the Southern California Edison.
Intergovernmental Panel on Climate Change/Technical and Economic Assessment
Panel (IPCC/TEAP). 2006. 2006 Report of the Refrigeration, Air Conditioning and Heat
Pumps Technical Options Committee.
Minea, Vasile. 2007. Supermarket Refrigeration System with Completely Secondary
Loops. ASHRAE Journal. September 2007.
Sand, James R, Steven K. Fischer, Van D. Baxter. 1997. Energy and Global Warming
Impacts of HFC Refrigerants and Emerging Technologies. Oak Ridge National Laboratory,
sponsored by Alternative Fluorocarbons Environmental Acceptability Study (AFEAS), U.S.
Department of Energy. Available online at
http://www.ornl.gov/sci/engineering_science_technology/eere_research_reports/electrically_d
riven_heat_pumps/fluids_development/cfc_and_hcfc_replacements/tewi_3/tewi_3.pdf
Southern California Edison (SCE) and Foster-Miller Inc. 2004. Investigation of
Secondary Loop Supermarket Refrigeration Systems. Prepared by Faramarzi, R. and D Walker
for the California Energy Commission. March 2004.
U.S. Environmental Protection Agency. 2010. GreenChill‘s November Webinar:
Condenser Innovations for Commercial Refrigeration. Presented by Keilly Witman, U.S.
EPA; Dustan Atkinson, Heatcraft Refrigerant Products; Harrison Horning, Hannaford Bros.
Co; Jeff Waller, Hussmann; Paul Noreen, Muller Industries; Steve Hagen, Fresh & Easy.
Available online at,
https://meetingvisuals.webex.com/meetingvisuals/ldr.php?AT=pb&SP=MC&rID=59191997&
rKey=adf5ccb68958e17d
In addition to the above sources, the following equipment manufacturers and sustainability resource
planning firms were contacted: Hill Phoenix, Hussmann, Kysor/Warren, and Verisae.
Table 3 through Table 8 summarize the information compiled from industry contacts and published
sources. It should be noted that data were often converted and manipulated to provide comparable
units and figures. In addition, the context in which estimates were identified, as well as their

Measure Information Template Page 104
2013 California Building Energy Efficiency Standards September 2011
relevance to the systems being modeled in this analysis vary significantly across sources, as explained
by the notes provided in the tables.
Table 3: Sales Area and Cooling Capacity of a Typical Supermarket
Source Sales area
(sq ft)
Cooling Capacity (BTU/hr)a Cooling
Capacity/ Sales
Area Medium
Temp (MT)
Low Temp
(LT) Total
Armines (2009) 47,000 764,000 573,000 1,338,000b 28
HMG and CTG (2008) 40,000 – 60,000 901,000 300,000 1,201,000 24 a Rounded to the nearest thousand.
b Includes cooling capacity from condensing units and stand-alone equipment, which total 160,000 BTU/hr (47 kW).
Table 4: Relationship between Sales Area and Refrigerant Charge
Source Charge/Sales Area
(lb/sq ft) Notes
Armines (2009) 0.074 Estimate for 2004. Noted that this ratio increased by 50% between 1960
and 1990, likely due to the changing trend in store size.
Sand et al. (1997) 0.08-0.12 Noted as a general rule of thumb.

Measure Information Template Page 105
2013 California Building Energy Efficiency Standards September 2011
Table 5: Relationship between Refrigerant Charge and Cooling Capacity
Source System Type Charge/Cooling Capacity (lb/BTU/hr)
Armines (2009) Centralized DX 1.81 x 10⁻³
(MT) 2.56 x 10
-3 a
Armines (2009) Centralized DX 3.55 x 10⁻³
(LT)
Armines (2009) Secondary Loop 0.52 x 10⁻³
(MT) 0.63 x 10
-3 a
Armines (2009) Secondary Loop 0.78 x 10⁻³
(LT)
Baxter (2003) Centralized DX 2.58 x 10⁻³
- 3.23 x 10⁻³
HMG and CTG (2008) Centralized DX 2.58 x 10⁻³
- 3.23 x 10⁻³
Minea (2007) Centralized DX 2.68 x 10⁻³
Minea (2007) Secondary Loop 1.05 x 10⁻³
a Assumes that supermarkets contain 57% MT and 43% LT refrigeration, as detailed in Table 3.
Table 6: Charge Size and Leak Rate Estimates for Average-Sizeda Supermarkets with Centralized DX
Systems
Source Charge (lbs) Leak Rate Notes
Armines (2009) 3,030 18-30% Based on 2004 CA field survey. Does not include charge
associated with condensing units and stand-alone equipment
(~120 lbs). Leak rate uncertainties are high for centralized
systems.
Baxter (2003) 3,000 10-30% Charge size estimate for refrigerant load of 1,120,000
BTU/hr assuming 2.68 x 10³ lbs/BTU/hr
CARB (2009) 3,500 – 5,000 15-21% Facility charge size is calculated based on assumptions on
charge size per system and number of systems per store,
based on SCAQMD Rule 1415 data.
Hill PHOENIX (2009) 2,000-3,000 20% Estimate for new construction of a 45,000 ft2 store.
HMG and CTG (2008) 2,800 15-30% Charge is assumed to be the California average (based on
CARB ―Draft Concept Paper: Specifications for
Commercial Refrigeration‖).b
Source of leak rate estimate
is not specified.
Hussmann (2009) 2,700-3,750 15% Estimate for new construction of a 45,000 ft2 store.
Kysor/Warren (2009) 2,500-3,000 25% Estimate for new construction of a 45,000 ft2 store.
Minea (2007) 2,200 – 5,500 15-30% Source of charge size and leak rate estimates are unclear.
SCE & Foster-Miller
(2004)
3,000 – 5,000 30-50% Citation for leak rate estimate is Sand et al. (1997), which
reports a historic average leak rate of 30% with an
achievable leak rate of 10% through aggressive maintenance
practices. Source of 50% leak rate is unclear. Source of
charge size estimate is also unclear.
Verisae (2009) 2,500-3,000 20% Estimate for new construction of a 45,000 ft2 store
a An average-sized supermarket is assumed to be roughly 45,000-60,000 ft
2. Not all sources identified a corresponding
store size in conjunction with charge size estimates.

Measure Information Template Page 106
2013 California Building Energy Efficiency Standards September 2011
b Report available at
http://www.arb.ca.gov/cc/hgwpss/meetings/021508/RWC_Commercial_Refrig_Draft_Concept_Paper.pdf
Table 7: Equipment Manufacturer Estimates for Charge Size and Leak Rates for New 45,000 ft2
Supermarkets with Distributed Systems
Source Charge (lbs) Leak Rate Notes
Baxter (2003) 900-1,800 5% Charge calculated by assuming charge is 30-60% of
comparable DX system; dependent on the condenser type.
Hill PHOENIX
(2009) 1,600 20%
Charge assumed to be 75% of comparable DX system
Hussmann (2009) 500-1,000 2-8% Manufacturer specializes in and promotes this technology.
Kysor/Warren (2009) 1,500-1,800 10-15%
Table 8: Charge Size and Leak Rate Estimates for Supermarkets with Secondary Loop Systems
Source Charge (lbs) Leak
Rate Notes
Armines (2009) 800 NA Calculated based on average cooling capacity for
supermarkets with an average sales area of 47,000 ft2 and
charge/cooling capacity ratio.
Baxter (2003) 150-450 2-10% Charge calculated by assuming charge is 5-15% of
comparable DX system; dependent on the condenser type.
Hill PHOENIX
(2009)
1,200 5-10% Estimate for new construction of a 45,000 ft2 store.
Manufacturer specializes in this technology.
Minea (2007) 1,000 5-10% Based on a case study store with sales area of 74,842 ft2
SCE & Foster-Miller
(2004)
300-500 14.8% Charge estimate based on‖ typical supermarket.‖ Charge
can be as high as 1,400 lbs if heat reclaim is used. Leak
rate based on a case study.
Based on the information presented above, charge size and leak rate assumptions were developed for
the baseline store types—i.e., small supermarkets,4 large supermarkets,
5 and big box food stores.
6
10.2 Methodology for Developing Charge Size Assumptions While both refrigerant cooling capacity and store size (among other characteristics) impact charge
size, cooling capacity was identified as a more significant variable in estimating charge. Some
4 Defined as having a cooling capacity of 249,353 BTU/hr, a size of 10,000 square feet, and a cooling capacity/sales area ratio of 25.
5 Defined as having a cooling capacity of 1,257,920 BTU/hr, a size of 60,000 square feet, and a cooling capacity/sales area ratio of 21.
6 Defined as having a cooling capacity of 1,517,440 BTU/hr, a size of 150,000 square feet, and a cooling capacity/sales area ratio of 10.

Measure Information Template Page 107
2013 California Building Energy Efficiency Standards September 2011
sources did identify ratios between charge size and store size, but such assumptions were deemed
unreliable due to the changing trends in average store size and design/layout.7 For example, Armines
(2009) reported that the relationship between charge size and refrigerated sales area is constantly
changing in California, having increased by 50% between 1960 and 1990. As a result, cooling
capacity was selected as the primary consideration in developing charge size assumptions.
10.2.1 DX Systems
Based on the ratios identified in Table 5, centralized DX systems were estimated to have a charge size
ranging from 2.58 x 10⁻³
– 3.23 x 10⁻³
lbs/BTU/hr. Accordingly, an average ratio of 2.9 x 10⁻³
lbs/BTU/hr was used to estimate charge sizes for each baseline store, as shown in Table 9.
Table 9: Charge Size Estimates for Base Case Stores with a Centralized DX System
Store lb
Small Supermarket 725
Large Supermarket 3,655
Big Box Food Store 4,410
To vet these estimates, the values in Table 9 were compared to the values listed in Table 6. Most
literature indicates that charge sizes for large supermarkets fall between 3,000 – 5,000 pounds of
refrigerant. This is consistent with the estimated charge sizes of 3,655 and 4,410 pounds used in large
supermarkets and big box stores, respectively. Furthermore, all major U.S. equipment manufacturers
consulted for this study, which are intimately familiar with the design of new supermarket
refrigeration systems in California, estimated that 45,000 ft2 stores with newly installed systems
would have a charge of close to 3,000 pounds. Since the assumed store size of the base case large
supermarket is 60,000 ft2, it is reasonable that the estimated charge size for this base case design
would be slightly higher than the estimates provided by industry contacts. In addition, the information
cited in CARB (2009) is based on a robust dataset collected on refrigeration/AC equipment in
California by the South Coast Air Quality Management District (SCAQMD) under Rule 1415
(Reduction of Refrigerant Emissions from Stationary Refrigeration and Air Conditioning Systems).8
The report indicates that 90% of centralized systems in California fall in the medium category and
contain an average charge size of 3,500 pounds per store. These estimates are in line with those
calculated using the methodology described above.
10.2.2 Distributed and Secondary Loop Systems
For stores with distributed and secondary loop systems, ratios of 1.45 x 10⁻³
lbs/BTU/hr and 0.81 x 10-
3 lbs/BTU/hr were used, respectively. The ratio for distributed systems was estimated based on the
7 Calculated charge estimates based on refrigerant charge per sales area ratio were found to be excessively high. In contrast, literature
and base case store data suggest that the correlation between cooling capacity and charge size is fairly strong.
8 The Rule 1415 data used for the CARB report were available for six years (reporting years 2000 through 2005) and consisted of
approximately 16,000 records. Data reported include equipment type, charge size, leak rate, store size, and energy consumption. No
data on cooling capacity are reported.

Measure Information Template Page 108
2013 California Building Energy Efficiency Standards September 2011
assumption that a distributed system has a charge size that ranges between 25-75% of the charge size
of a corresponding centralized DX system (Hill PHOENIX 2009; Sand et al. 1997; IPCC/TEAP 2006;
Baxter 2003). As a result, it was assumed for this analysis that a distributed system has a charge size
that is 50% of the charge size of a corresponding centralized DX system. Secondary loop systems
have a charge size 28% the charge size of a corresponding DX system; the ratio was identified based
on Armines (2009) and Minea (2007).
Table 10: Charge Size (lbs) Estimates for Distributed and Secondary Loop Systems
Store Distributed Secondary Loop
Small Supermarket 360 200
Large Supermarket 1,830 1,015
Big Box Food Store 2,205 1,225
The calculated estimates shown in Table 10 were compared with estimates presented in Table 7 and
Table 8 to confirm that they are reasonable assumptions.
10.2.3 Impact of the Condenser Type
Research indicates that air-cooled condensers are the most commonly used condensers in supermarket
refrigeration systems. As a result, the estimates presented in the previous sections assume the use of
an air-cooled condenser. However, the use of an evaporative-cooled condenser or a fluid-cooled
condenser will impact the charge size of a system. Based on conversations with industry contacts
(Kysor/Warren and Hussmann), as well as U.S. EPA (2010) and Baxter (2003), it is assumed that
evaporative-cooled condenser require a greater charge, while fluid-cooled condensers require less
charge. Specifically, evaporative-cooled condensers are assumed to have a charge size that is
approximately 110% of that required for an air-cooled condenser, and fluid-cooled condensers are
assumed to have a charge size that is about 60% of that required for an air-cooled condenser.
10.3 Methodology for Developing Leak Rate Assumptions Leak rate estimates were determined based on information summarized in Table 6, Table 7, and Table
8. In particular, information cited by CARB (2009) was used as the main source for determining the
leak rate of centralized DX systems, since the Rule 1415 dataset is the most robust leak rate
information available at this time. System manufacturers and case studies were relied on as the main
source for leak rate information associated with distributed and secondary loop systems, as these
systems are less commonly used and still relatively new to the market. Table 11 summarizes the leak
rate assumptions derived from the sources reviewed.
Table 11: Assumptions on Leak Rates
Leak Rate (percent of charge per year) Centralized DX Distributed Secondary Loop
Average 18% 15% 10%
Range (of averages) 15% - 25% 10% - 15% 5% - 15%
Although the leak rates in Table 11 are assumed to represent current practices, the ARB Initial
Statement of Reasons (ISOR) for Proposed Regulation for the Management of High Global Warming
Potential Refrigerants for Stationary Sources states that existing facilities, which use ―business as

Measure Information Template Page 109
2013 California Building Energy Efficiency Standards September 2011
usual‖ equipment design and installation practices can be expected to lower the annual refrigerant
leak rate from the current 18% - 20% for supermarkets (state average) to a 10% annual leak rate,
based on more stringent inspection and maintenance practices (repair all leaks within 14 days and
other practices). Since the refrigerant management regulations are now being implemented in
California, the leak rates used in this analysis were scaled down to reflect the anticipated reduction in
refrigerant leaks. Accordingly, Table 12 summarizes the final leak rate assumptions used in this
analysis.
Table 12: Revised Leak Rate Assumptions
Leak Rate (percent of charge per year) Centralized DX Distributed Secondary Loop
Average 12% 8% 5%
Range (of averages) 10% - 15% 5% - 10% 2% - 8%
10.4 Limitations and Considerations The supermarket industry recognizes that refrigerant charge size varies significantly from
manufacturer to manufacturer and store to store, and cannot be easily generalized based on one
variable. Even manufacturers of the equipment cannot accurately predict the charge size of any
given system and can only provide a best estimate based on the system characteristics and design.
Given the complexity and uncertainty associated with estimating charge size, this methodology is
intended only to provide indicative charge estimates that are reasonable for use in the study at hand.
Similarly, refrigerant leak rates vary significantly over time, and by store and system type.
Generalizing an average leak rate of a system or store does not accurately represent an observed leak
rate at a given point in time; however, observed and documented trends are useful for comparing
technologies and estimating the impact of a system over its lifetime. The estimated average leak rates
are believed to be reasonable for use in this analysis, and have been reviewed and accepted by leading
industry stakeholders—including leading manufacturers and users of supermarket refrigeration
systems.
It is important to note that the average CA store size and the average amount of cooling capacity per
store in CA are constantly changing. Likewise, practices and standards associated with leak
prevention and repair are not stagnant. However, the assumptions developed for this analysis are
intended to be representative of the most recent documented trends in newly installed stores.

Measure Information Template Page 110
2013 California Building Energy Efficiency Standards September 2011
11. Appendix F: Wetbulb Sensitivity Study for Floating Head
Pressure Measure Wetbulb sensor robustness is a concern for ambient-following control for evaporative condensers.
Wetbulb sensors (actually a combination of drybulb sensor and humidity sensor) generally lose
calibration accuracy over time, which may lead to negative savings from ambient-following versus a
fixed SCT setpoint control strategy. A supporting analysis was performed to evaluate the incremental
savings from using a wetbulb-following control strategy at varying control TDs. The analysis
assumes a minimum SCT of 70°F with variable speed condenser fan control. The Base Case for this
analysis was a fixed SCT setpoint of 70°F with variable-speed condenser fan control. The large
supermarket with central compressor configuration and evaporative condenser were used for this
analysis.
The results of this analysis are presented in Figure 72:
Figure 72: TD Sensitivity Analysis
Figure 72 shows that ambient-following control is still cost-effective, even if the sensor were to be out
of calibration.

Measure Information Template Page 111
2013 California Building Energy Efficiency Standards September 2011
12. Appendix G: Databases from Savings By Design
12.1 Condenser Specific Efficiency Figure 73 through Figure 74 show a database of condenser specific efficiencies utilized to calculate
Base Case specific efficiency for the condenser efficiency measure. The condenser efficiencies come
from new-construction projects that participated in the Savings By Design new construction incentive
program. Both warehouses and supermarkets are included in the database; there is some equipment
overlap between supermarkets and small refrigerated warehouses, and a concurrent Title 24 CASE
study is striving to mandate condenser efficiencies. Both the supermarket and refrigerated warehouse
efficiency mandates utilize the database depicted here.
Year Utility
Project
Type Location Configuration
Specific
Efficiency
(Btu/h/Watt)
2008 PG&E Grocery Orcutt Air-Cooled 150
2008 PG&E Grocery Lompoc Air-Cooled 150
2008 SCE Grocery Oxnard Air-Cooled 150
2008 PG&E Grocery Santa Cruz Air-Cooled 139
2007 SCE Grocery Marina Del Rey Air-Cooled 139
2007 PG&E Grocery Novato Air-Cooled 139
2007 PG&E Grocery Milpitas Air-Cooled 134
2007 PG&E Grocery Novato Air-Cooled 134
2007 SCE Grocery Marina Del Rey Air-Cooled 130
2007 SCE Grocery La Verne Air-Cooled 130
2007 PG&E Grocery San Jose Air-Cooled 82
2007 PG&E Grocery Redwood City Air-Cooled 82
2008 PG&E Grocery Santa Cruz Air-Cooled 78
2008 PG&E Grocery Santa Cruz Air-Cooled 78
2007 PG&E Grocery San Jose Air-Cooled 77
2007 PG&E Grocery Redwood City Air-Cooled 77
2008 PG&E Grocery Novato Air-Cooled 77
2007 PG&E Grocery Antioch Air-Cooled 77
2010 SDG&E Warehouse San Diego Air-Cooled 76
2007 SCE Grocery Irvine Air-Cooled 75
2008 SCE Grocery Lakewood Air-Cooled 74
2008 SCE Grocery Hawthorne Air-Cooled 74

Measure Information Template Page 112
2013 California Building Energy Efficiency Standards September 2011
2008 PG&E Grocery Pittsburg Air-Cooled 74
2008 PG&E Grocery Pittsburg Air-Cooled 74
2008 PG&E Grocery Pittsburg Air-Cooled 74
2008 PG&E Grocery Pittsburg Air-Cooled 74
2008 SCE Grocery Apple Valley Air-Cooled 74
2008 SCE Grocery Apple Valley Air-Cooled 74
2008 SCE Grocery Apple Valley Air-Cooled 74
2008 SCE Grocery Apple Valley Air-Cooled 74
2008 SCE Grocery Apple Valley Air-Cooled 74
2008 PG&E Grocery Pittsburg Air-Cooled 74
2007 SCE Grocery Irvine Air-Cooled 71
2008 SCE Grocery Seal Beach Air-Cooled 71
2008 SCE Grocery Tustin Air-Cooled 71
2008 PG&E Grocery Santa Cruz Air-Cooled 71
2007 SCE Grocery Claremont Air-Cooled 62
2008 PG&E Grocery Santa Cruz Air-Cooled 62
2008 PG&E Grocery Santa Cruz Air-Cooled 62
2007 SCE Grocery Torrance Air-Cooled 61
2008 PG&E Grocery Santa Cruz Air-Cooled 60
2007 SCE Grocery Marina Del Rey Air-Cooled 60
2007 SCE Grocery Marina Del Rey Air-Cooled 60
2007 SCE Grocery La Verne Air-Cooled 60
2007 PG&E Grocery Novato Air-Cooled 60
2007 SCE Grocery La Verne Air-Cooled 60
2008 PG&E Grocery Santa Cruz Air-Cooled 57
2008 PG&E Grocery Santa Cruz Air-Cooled 57
2007 SCE Grocery Norwalk Air-Cooled 55
2008 PG&E Grocery Santa Cruz Air-Cooled 54
2008 PG&E Grocery Santa Cruz Air-Cooled 54
2007 SCE Grocery Norwalk Air-Cooled 51
2010 SCE Warehouse Buena Park Air-Cooled 49.6
2007 SCE Grocery Claremont Air-Cooled 48
2008 SCE Grocery Long Beach Air-Cooled 48
2008 PG&E Grocery Santa Cruz Air-Cooled 48
2007 SCE Grocery Malibu Air-Cooled 46

Measure Information Template Page 113
2013 California Building Energy Efficiency Standards September 2011
2008 SCE Grocery Rancho Temecula Air-Cooled 46
2010 SCE Warehouse Buena Park Air-Cooled 41.3
2007 SCE Warehouse Santa Barbara Air-Cooled 41.1
2007 SCE Grocery Torrance Air-Cooled 40
2007 SCE Grocery Malibu Air-Cooled 40
Figure 73: Air-cooled axial-fan halocarbon condenser database
Year Utility
Project
Type Location Configuration
Specific
Efficiency
2007 SCE Grocery South El Monte Centrifugal-Fan Evap 278
2008 SCE Grocery Buena Park Centrifugal-Fan Evap 261
2008 SCE Grocery Pomona Centrifugal-Fan Evap 240
2007 PG&E Warehouse Petaluma Centrifugal-Fan Evap 234
2007 SCE Warehouse Ontario Centrifugal-Fan Evap 226
2007 PG&E Grocery Paso Robles Centrifugal-Fan Evap 214
2008 SCE Grocery Chino Centrifugal-Fan Evap 193
2010 PG&E Warehouse Gonzales Centrifugal-Fan Evap 192
2010 PG&E Warehouse Gonzales Centrifugal-Fan Evap 192
2008 SCE Grocery Corona Centrifugal-Fan Evap 191
2008 SCE Grocery Moreno Valley Frederick Centrifugal-Fan Evap 191
2008 SCE Grocery Moreno Valley Heacock Centrifugal-Fan Evap 191
2008 SCE Grocery Palm Springs Centrifugal-Fan Evap 191
2008 SCE Grocery Pedley Centrifugal-Fan Evap 191
2008 PG&E Grocery Bakersfield-Brimhall Centrifugal-Fan Evap 191
2008 PG&E Grocery Bakersfield-Hageman Centrifugal-Fan Evap 191
2008 PG&E Grocery Bakersfield-Olive Centrifugal-Fan Evap 191
2008 PG&E Grocery Bakersfield-Planz Centrifugal-Fan Evap 191
2008 PG&E Grocery Bakersfield-Stine Centrifugal-Fan Evap 191
2008 PG&E Grocery Bakersfield-Stockdale Centrifugal-Fan Evap 191
2008 PG&E Grocery Fresno-Tulare Centrifugal-Fan Evap 191
2008 PG&E Grocery Lemoore Centrifugal-Fan Evap 191
2008 PG&E Grocery Wasco Centrifugal-Fan Evap 191
2008 SCE Grocery Alhambra Centrifugal-Fan Evap 191
2008 SCE Grocery Baldwin Park Centrifugal-Fan Evap 191

Measure Information Template Page 114
2013 California Building Energy Efficiency Standards September 2011
2008 SCE Grocery Loma Linda Centrifugal-Fan Evap 191
2008 SCE Grocery Ontario-Euclid Centrifugal-Fan Evap 191
2007 SCE Grocery Upland Centrifugal-Fan Evap 191
2008 SCE Grocery Temecula Centrifugal-Fan Evap 191
2008 SCE Grocery West Covina Centrifugal-Fan Evap 191
2008 SCE Grocery Chino Hills Centrifugal-Fan Evap 191
2008 SCE Grocery Covina Centrifugal-Fan Evap 191
2008 SCE Grocery Fontana Centrifugal-Fan Evap 191
2008 SCE Grocery Fountain Valley Harbor Centrifugal-Fan Evap 191
2008 PG&E Grocery Fresno-1st St Centrifugal-Fan Evap 191
2008 PG&E Grocery Fresno-Cedar Centrifugal-Fan Evap 191
2008 SCE Grocery Compton Centrifugal-Fan Evap 191
2008 SCE Grocery Delano Centrifugal-Fan Evap 191
2008 SCE Grocery Fountain Valley 1082 Centrifugal-Fan Evap 191
2008 SCE Grocery Glendora Centrifugal-Fan Evap 191
2008 SCE Grocery Hesperia Centrifugal-Fan Evap 191
2008 SCE Grocery Long Beach Centrifugal-Fan Evap 191
2008 SCE Grocery Moreno Valley Perris Centrifugal-Fan Evap 191
2008 SCE Grocery Newbury Park Centrifugal-Fan Evap 191
2008 SCE Grocery Norwalk Centrifugal-Fan Evap 191
2008 SCE Grocery Oak Park Centrifugal-Fan Evap 191
2008 SCE Grocery Palmdale Centrifugal-Fan Evap 191
2008 SCE Grocery Paramount Centrifugal-Fan Evap 191
2008 SCE Grocery Pico Rivera Centrifugal-Fan Evap 191
2008 SCE Grocery Rialto Centrifugal-Fan Evap 191
2008 SCE Grocery San Jacinto Centrifugal-Fan Evap 191
2008 SCE Grocery Simi Valley Centrifugal-Fan Evap 191
2008 SCE Grocery Upland Centrifugal-Fan Evap 191
2008 SCE Grocery Yucaipa Centrifugal-Fan Evap 191
2007 SCE Grocery Arcadia Centrifugal-Fan Evap 191
2007 SCE Grocery Buena Park Centrifugal-Fan Evap 191
2007 SCE Grocery Eagle Rock Centrifugal-Fan Evap 191
2007 SCE Grocery Hemet Centrifugal-Fan Evap 191
2007 SCE Grocery Huntington Beach Centrifugal-Fan Evap 191
2007 SCE Grocery La Mirada Centrifugal-Fan Evap 191

Measure Information Template Page 115
2013 California Building Energy Efficiency Standards September 2011
2007 SCE Grocery Laguna Hills Centrifugal-Fan Evap 191
2007 SCE Grocery West Covina Centrifugal-Fan Evap 191
2007 SCE Grocery Moreno Valley Centrifugal-Fan Evap 189
2008 SCE Grocery Victorville Centrifugal-Fan Evap 188
2007 SCE Grocery Visalia Centrifugal-Fan Evap 188
2007 SCE Grocery Irvine Centrifugal-Fan Evap 187
2007 SCE Grocery Victorville Centrifugal-Fan Evap 186
2007 SCE Grocery Moreno Valley Centrifugal-Fan Evap 186
2007 SCE Grocery Lake Forest Centrifugal-Fan Evap 186
2008 SCE Grocery Anaheim Hills Centrifugal-Fan Evap 175
2008 SCE Grocery Lakewood Centrifugal-Fan Evap 175
2008 SCE Grocery City of Industry Centrifugal-Fan Evap 175
2008 SCE Grocery La Habra Centrifugal-Fan Evap 175
2008 SCE Grocery Moorpark Centrifugal-Fan Evap 175
2008 SCE Grocery Moreno Valley Alessandro Centrifugal-Fan Evap 175
2007 PG&E Warehouse Chico Centrifugal-Fan Evap 175
2008 PG&E Grocery Manteca Centrifugal-Fan Evap 173
2007 PG&E Grocery Woodland Centrifugal-Fan Evap 173
2008 PG&E Grocery Madera Centrifugal-Fan Evap 173
2008 SCE Grocery Duarte Centrifugal-Fan Evap 172
2008 SCE Grocery Manhattan Beach Centrifugal-Fan Evap 172
2008 SCE Grocery Palm Desert Centrifugal-Fan Evap 172
2007 PG&E Grocery Martell Centrifugal-Fan Evap 170
2007 PG&E Grocery Fresno Centrifugal-Fan Evap 168
2007 PG&E Grocery San Francisco Centrifugal-Fan Evap 168
2007 SCE Grocery Oxnard Centrifugal-Fan Evap 155
2008 SCE Grocery Victorville Centrifugal-Fan Evap 155
Figure 74: Centrifugal fan evaporative-cooled halocarbon condenser database

Measure Information Template Page 116
2013 California Building Energy Efficiency Standards September 2011
13. Appendix H: Energy Analysis for CO2 Secondary Systems Appendix H describes the energy impact analysis performed for the CO2 secondary (indirect) cooling
measure. Indirect (pump-recirculated) systems were evaluated for both small and large supermarkets,
consistent with stakeholder comments about the predominance of this configuration versus cascade
cooling systems. The indirect system configuration for both the small and large supermarket
prototypes consist of phase-change CO2 pump-recirculated loops serving both the low- and medium-
temperature loads—both served by dedicated LT and MT R-404A suction groups, respectively. The
baselines of comparison are central rack systems with air-cooled condensers. The Baselines include
floating head pressure to 70°F SCT with ambient-following control logic and variable-speed
condenser fans, as well as floating suction pressure control. Figure 75 shows the general system
configuration:
Figure 75: Indirect system diagram
The analysis took into account the lower return gas temperature at the compressors (increased
pumping efficiency) and the circulation loop heat gains, which constitute a pure heat load on the
system in contrast to suction line heat gain on direct expansion (DX) systems, which only act to
increase superheat and decrease pumping efficiency. Operating suction temperatures for the CO2
indirect system were assumed to be similar to the baseline design, with a slight increase for CO2—
consistent with stakeholder feedback that the comparatively better refrigeration efficiency of CO2

Measure Information Template Page 117
2013 California Building Energy Efficiency Standards September 2011
outweighs the penalty of requiring a TD in the CO2/refrigerant heat exchanger. Figure 76 shows the
analysis assumptions for this measure.
Large Supermarket Small Supermarket
Design climate CTZ12 – Sacramento Executive CTZ12 – Sacramento Executive
Design temperatures LT System: -20°F SST, 117°F SCT
MT System: 18°F SST, 122°F SCT
LT System: -25°F SST, 117°F SCT
MT System: 21°F SST, 122°F SCT
Condenser Air-cooled Air-cooled
Condenser design TD LT: 10°F
MT: 15°F
LT: 10°F
MT: 15°F
Condenser specific efficiency 50 (Btu/h)/W 50 (Btu/h)/W
Condenser capacity at design
conditions
LT: 673 MBH
MT: 1,710 MBH
LT: 92 MBH
MT: 354 MBH
Condenser control Floating head pressure, drybulb-following
control logic with variable-speed fans
Floating head pressure, drybulb-
following control logic with variable-
speed fans
Minimum condensing
temperature 70 F 70 F
Compressors (3) uneven reciprocating semi-hermetic
compressors per suction group
Performance at design conditions:
MT Compressor 1: 4,493 lb/hr, 27.2 kW
MT Compressor 2: 10,483 lb/hr, 63.5 kW
MT Compressor 3: 14,976 lb/hr, 90.6 kW
LT Compressor 1: 1,422 lb/hr, 14.7 kW
LT Compressor 2: 3,318 lb/hr, 34.4 kW
LT Compressor 3: 4,740 lb/hr, 49.2 kW
(3) uneven reciprocating semi-hermetic
compressors per suction group
Performance at design conditions:
MT Compressor 1: 1,364 lb/hr, 7.6 kW
MT Compressor 2: 3,183 lb/hr, 17.6 kW
MT Compressor 3: 4,546 lb/hr, 25.2 kW
LT Compressor 1: 402 lb/hr, 4.5 kW
LT Compressor 2: 939 lb/hr, 10.4 kW
LT Compressor 3: 1,341 lb/hr, 14.8 kW
Compressor control Electronic sequencing with floating suction
pressure
Electronic sequencing with floating
suction pressure
Assumed compressor return
gas temperature LT: -5 F
MT: 28 F
LT: -5 F
MT: 28 F
Pump power LT: 1.0 HP
MT: 4.0 HP
LT: 0.33 HP
MT: 1.25 HP
Assumed piping heat gain LT: 40.0 MBH
MT: 22.8 MBH
LT: 11.1 MBH
MT: 7.4 MBH
Figure 76: Analysis assumptions for CO2 indirect system analysis
Figure 77 below shows the analysis results for this measure.
Baseline Energy Proposed Energy Difference (kWh)

Measure Information Template Page 118
2013 California Building Energy Efficiency Standards September 2011
Usage (kWh) Usage (kWh)
LT MT LT MT LT MT
Large Supermarket
Compressors 247,579 421,483 239,471 411,448 -8,108 -10,035
Condenser 11,846 32,841 11,784 32,643 -62 -198
Pumps 0 36,266 36,266
Total (Whole Building) 2,221,967 2,203,564 -18,403
Small Supermarket
Compressors 70,304 88,164 83,124 87,973 12,820 -191
Condenser 3,187 7,122 3,955 7,680 768 558
Pumps 0 11,472 11,472
Total (Whole Building) 626,019 654,898 28,879
Figure 77: Energy analysis results for CO2 indirect system measure
The overall difference in energy consumption ranges from approximately -1% to +5%. As stated
before, the analysis includes assumptions for SST impact, compressor return gas temperature changes,
and piping heat gain, all of which can vary widely from store to store. Due to these considerations,
the energy impact for indirect systems is assumed to be negligible.
13.1 Glycol Indirect System Analysis Glycol was evaluated as a secondary cooling fluid for medium-temperature loads as part of the
indirect system measure, after stakeholders indicated that they would prefer that the code included an
optional alternative to CO2. Preliminary analysis showed that glycol systems were not a cost-
effective alternative to direct expansion systems or CO2 indirect systems, because the cost of
installation for a glycol system combined with the net increase in energy consumption outweighed the
monetized savings from reduced refrigerant charge and leak rates. Analysis was performed to
determine if the energy increase from glycol could be offset with variable-speed control of the glycol
circulation pump and walk-in unit cooler fans. Analysis was performed using the large supermarket
prototype with air-cooled condensers (MAC). Figure 78 below shows the assumptions to evaluate
this configuration.
Glycol Pump 15 HP pump, assumed 91.7% efficient motor (NEMA Premium)
Design Flow/Head Design flow assumed to be 400 GPM at 80 ft. head pressure
Pump Control Variable-speed pump control, based on maintaining constant differential pressure (pressure
assumed to be measured at the loads, not at the pump)
Control Valves Glycol control valves at the loads (walk-in coolers and display case line-ups) are assumed to
be 2-way (on/off style), not 3-way (bypass-style) to facilitate pump speed control based on
differential pressure
MT System Design SST 15°F SST

Measure Information Template Page 119
2013 California Building Energy Efficiency Standards September 2011
Compressor Performance
at Design Conditions
Compressor 1: 5,150 lb/hr, 36.8 kW
Compressor 2: 12,020 lb/hr, 85.9 kW
Compressor 3: 17,180 lb/hr, 122.7 kW
Assumed Compressor
Return Gas Temperature
22°F
Assumed Piping Heat
Gain
29.3 MBH (3% of MT system design load, based on analysis of typical glycol pipe sizes and
run lengths for large supermarket)
Unit Cooler Fan Power Calculated for each walk-in based on a unit cooler efficiency of 47 Btuh/Watt at a TD of 10°F
between entering glycol temperature and entering air temperature (compared to 97 Btuh/Watt
at 10°F between evaporating temperature and entering air temperature for DX evaporator
coils). Glycol is less efficient as a heat transfer fluid than refrigerant, and glycol cooling coils
must be larger, with more fan power, than their DX evaporator counterparts for the same
installed cooling capacity.
Unit Cooler Fan Control Variable speed fan control based on space temperature. Assumed a minimum fan speed of
70%
Figure 78: Glycol indirect loop assumptions
Simulating the glycol pump required an assumption for required flowrate over the course of one year.
Figure 79 below shows the assumed yearly required glycol flowrate. The profile is based on the
simulated medium-temperature suction group load.
0
50
100
150
200
250
300
350
400
Re
qu
ire
d F
low
rate
(G
PM
)
Figure 79: Assumed required glycol flowrate for MT indirect system
Figure 80 below shows the energy analysis results for this measure.

Measure Information Template Page 120
2013 California Building Energy Efficiency Standards September 2011
Energy
Savings
(kWh)
Energy
Savings/
SF
(kWh)
Demand
Savings
(kW)
Demand
Savings/
SF
(Watts)
CTZ01 - Arcata -55,039 -0.92 -2.9 -0.05
CTZ03 - Oakland -53,062 -0.89 -7.3 -0.12
CTZ05 - Santa Maria -53,437 -0.90 -5.2 -0.09
CTZ07 - San Diego-Lindbergh -48,459 -0.81 -6.3 -0.11
CTZ08 - Fullerton -70,805 -1.19 -14.8 -0.25
CTZ10 - Riverside -73,947 -1.24 -11.2 -0.19
CTZ12 - Sacramento -72,570 -1.22 -16.5 -0.28
CTZ13 - Fresno -76,085 -1.28 -12.4 -0.21
CTZ14 - Palmdale -77,063 -1.29 -17.0 -0.29
CTZ15 - Palm Springs -86,779 -1.46 -12.3 -0.21
Figure 80: Energy analysis results for glycol indirect system measure
Full analysis results, including economic analysis with monetized costs for refrigerant charge
reduction and leak rates, are presented in Section 4.

Measure Information Template Page 121
2013 California Building Energy Efficiency Standards September 2011
14. Appendix I: Full Cost Results
14.1 Floating Head Pressure CTZ01 Arcata - Floating Head Pressure
Energy Savings
(kWh) Energy Savings/ SF (kWh)
TDV Cost
Savings ($)
TDV Cost
Savings /SF ($)
Measure
Cost ($)
Refrigerant Cost
Savings Range ($) Net Savings Range ($)
SAC 39,781 2.51 $ 75,523 $ 4.77 $ 15,248 -$3,738 -$5,607 $56,537 $54,668
SAD 42,136 2.66 $ 80,551 $ 5.08 $ 15,248 -$934 -$1,869 $64,369 $63,434
SEC 15,661 0.99 $ 26,299 $ 1.66 $ 13,040 $0 $0 $13,259 $13,259
SFC 22,345 1.41 $ 37,646 $ 2.38 $ 13,040 $0 $0 $24,606 $24,606
SFD 26,678 1.68 $ 44,854 $ 2.83 $ 13,040 $0 $0 $31,814 $31,814
MAC 151,127 2.54 $ 283,312 $ 4.76 $ 39,433 -$18,802 -$28,202 $225,078 $215,677
MAD 160,345 2.69 $ 302,224 $ 5.07 $ 39,433 -$4,285 -$9,401 $258,506 $253,390
MEC 49,416 0.83 $ 87,626 $ 1.47 $ 32,463 $0 $0 $55,163 $55,163
MFC 72,745 1.22 $ 124,373 $ 2.09 $ 32,463 $0 $0 $91,910 $91,910
MFD 90,908 1.53 $ 153,964 $ 2.59 $ 32,463 $0 $0 $121,501 $121,501
LAC 183,796 1.13 $ 350,950 $ 2.16 $ 44,484 -$22,974 -$34,461 $283,492 $272,005
LAD 170,940 1.05 $ 330,374 $ 2.04 $ 44,484 -$5,744 -$11,487 $280,146 $274,403
LEC 101,828 0.63 $ 173,642 $ 1.07 $ 36,071 $0 $0 $137,571 $137,571
LFC 117,735 0.73 $ 193,052 $ 1.19 $ 36,071 $0 $0 $156,981 $156,981
LFD 132,623 0.82 $ 217,526 $ 1.34 $ 36,071 $0 $0 $181,455 $181,455
SXX Average 29,320 1.85 $ 52,974 $ 3.34 $ 13,923
MXX Average 104,908 1.76 $ 190,300 $ 3.20 $ 35,251
LXX Average 141,384 0.87 $ 253,109 $ 1.56 $ 39,436
XAX Average 124,688 2.10 $ 237,156 $ 3.98 $ 33,055
XEX Average 55,635 0.82 $ 95,855 $ 1.40 $ 27,191
XFX Average 77,172 1.23 $ 128,569 $ 2.07 $ 27,191
ALL Average 91,871 1.49 $ 165,461 $ 2.70 $ 29,537
CTZ03 Oakland - Floating Head Pressure
Energy Savings
(kWh) Energy Savings/ SF (kWh)
TDV Cost
Savings ($)
TDV Cost
Savings /SF ($)
Measure
Cost ($)
Refrigerant Cost
Savings Range ($) Net Savings Range ($)
SAC 40,637 2.56 $ 78,193 $ 4.93 $ 15,248 -$3,738 -$5,607 $59,207 $57,338
SAD 43,911 2.77 $ 84,218 $ 5.31 $ 15,248 -$934 -$1,869 $68,035 $67,101
SEC 12,751 0.80 $ 23,940 $ 1.51 $ 13,040 $0 $0 $10,900 $10,900
SFC 15,780 1.00 $ 25,595 $ 1.61 $ 13,040 $0 $0 $12,555 $12,555
SFD 18,644 1.18 $ 29,618 $ 1.87 $ 13,040 $0 $0 $16,578 $16,578
MAC 150,533 2.53 $ 279,833 $ 4.70 $ 39,433 -$18,802 -$28,202 $221,598 $212,197
MAD 161,340 2.71 $ 298,664 $ 5.01 $ 39,433 -$4,285 -$9,401 $254,946 $249,831
MEC 42,004 0.71 $ 84,360 $ 1.42 $ 32,463 $0 $0 $51,897 $51,897
MFC 54,231 0.91 $ 90,973 $ 1.53 $ 32,463 $0 $0 $58,510 $58,510
MFD 65,078 1.09 $ 104,838 $ 1.76 $ 32,463 $0 $0 $72,375 $72,375
LAC 188,761 1.16 $ 369,888 $ 2.28 $ 44,484 -$22,974 -$34,461 $302,430 $290,943
LAD 180,791 1.12 $ 355,329 $ 2.19 $ 44,484 -$5,744 -$11,487 $305,101 $299,358
LEC 84,424 0.52 $ 146,017 $ 0.90 $ 36,071 $0 $0 $109,946 $109,946
LFC 79,441 0.49 $ 121,748 $ 0.75 $ 36,071 $0 $0 $85,677 $85,677
LFD 89,767 0.55 $ 134,892 $ 0.83 $ 36,071 $0 $0 $98,821 $98,821
SXX Average 26,345 1.66 $ 48,313 $ 3.05 $ 13,923
MXX Average 94,637 1.59 $ 171,734 $ 2.88 $ 35,251
LXX Average 124,637 0.77 $ 225,575 $ 1.39 $ 39,436
XAX Average 127,662 2.14 $ 244,354 $ 4.07 $ 33,055
XEX Average 46,393 0.68 $ 84,772 $ 1.28 $ 27,191
XFX Average 53,824 0.87 $ 84,611 $ 1.39 $ 27,191
ALL Average 81,873 1.34 $ 148,540 $ 2.44 $ 29,537
CTZ05 Santa Maria - Floating Head Pressure
Energy Savings
(kWh) Energy Savings/ SF (kWh)
TDV Cost
Savings ($)
TDV Cost
Savings /SF ($)
Measure
Cost ($)
Refrigerant Cost
Savings Range ($) Net Savings Range ($)
SAC 40,394 2.55 $ 78,976 $ 4.98 $ 15,248 -$3,738 -$5,607 $59,990 $58,121
SAD 43,382 2.74 $ 85,054 $ 5.37 $ 15,248 -$934 -$1,869 $68,872 $67,937
SEC 13,577 0.86 $ 24,341 $ 1.54 $ 13,040 $0 $0 $11,301 $11,301
SFC 17,854 1.13 $ 28,790 $ 1.82 $ 13,040 $0 $0 $15,750 $15,750
SFD 21,088 1.33 $ 33,489 $ 2.11 $ 13,040 $0 $0 $20,449 $20,449
MAC 149,843 2.52 $ 283,846 $ 4.77 $ 39,433 -$18,802 -$28,202 $225,612 $216,211
MAD 159,853 2.68 $ 302,082 $ 5.07 $ 39,433 -$4,285 -$9,401 $258,364 $253,248
MEC 45,094 0.76 $ 86,772 $ 1.46 $ 32,463 $0 $0 $54,309 $54,309
MFC 60,606 1.02 $ 101,145 $ 1.70 $ 32,463 $0 $0 $68,682 $68,682
MFD 73,413 1.23 $ 118,446 $ 1.99 $ 32,463 $0 $0 $85,983 $85,983
LAC 186,891 1.15 $ 369,274 $ 2.28 $ 44,484 -$22,974 -$34,461 $301,816 $290,329
LAD 177,073 1.09 $ 352,409 $ 2.17 $ 44,484 -$5,744 -$11,487 $302,182 $296,438
LEC 87,840 0.54 $ 148,206 $ 0.91 $ 36,071 $0 $0 $112,135 $112,135
LFC 90,733 0.56 $ 140,036 $ 0.86 $ 36,071 $0 $0 $103,965 $103,965
LFD 101,991 0.63 $ 155,646 $ 0.96 $ 36,071 $0 $0 $119,575 $119,575
SXX Average 27,259 1.72 $ 50,130 $ 3.16 $ 13,923
MXX Average 97,762 1.64 $ 178,458 $ 3.00 $ 35,251
LXX Average 128,906 0.80 $ 233,115 $ 1.44 $ 39,436
XAX Average 126,239 2.12 $ 245,274 $ 4.11 $ 33,055
XEX Average 48,837 0.72 $ 86,440 $ 1.30 $ 27,191

Measure Information Template Page 122
2013 California Building Energy Efficiency Standards September 2011
XFX Average 60,948 0.98 $ 96,259 $ 1.57 $ 27,191
ALL Average 84,642 1.39 $ 153,901 $ 2.53 $ 29,537
CTZ07 San Diego-Lindbergh - Floating Head Pressure
Energy Savings
(kWh) Energy Savings/ SF (kWh)
TDV Cost
Savings ($)
TDV Cost
Savings /SF ($)
Measure
Cost ($)
Refrigerant Cost
Savings Range ($) Net Savings Range ($)
SAC 41,339 2.61 $ 81,521 $ 5.14 $ 15,248 -$3,738 -$5,607 $62,535 $60,667
SAD 45,200 2.85 $ 88,454 $ 5.58 $ 15,248 -$934 -$1,869 $72,271 $71,337
SEC 11,692 0.74 $ 24,732 $ 1.56 $ 13,040 $0 $0 $11,692 $11,692
SFC 8,302 0.52 $ 14,257 $ 0.90 $ 13,040 $0 $0 $1,217 $1,217
SFD 8,739 0.55 $ 14,266 $ 0.90 $ 13,040 $0 $0 $1,226 $1,226
MAC 146,560 2.46 $ 279,379 $ 4.69 $ 39,433 -$18,802 -$28,202 $221,144 $211,743
MAD 158,757 2.67 $ 300,079 $ 5.04 $ 39,433 -$4,285 -$9,401 $256,361 $251,246
MEC 43,208 0.73 $ 88,347 $ 1.48 $ 32,463 $0 $0 $55,884 $55,884
MFC 33,276 0.56 $ 56,362 $ 0.95 $ 32,463 $0 $0 $23,899 $23,899
MFD 33,911 0.57 $ 55,837 $ 0.94 $ 32,463 $0 $0 $23,374 $23,374
LAC 189,170 1.17 $ 378,441 $ 2.33 $ 44,484 -$22,974 -$34,461 $310,983 $299,496
LAD 186,284 1.15 $ 369,719 $ 2.28 $ 44,484 -$5,744 -$11,487 $319,492 $313,748
LEC 62,714 0.39 $ 123,474 $ 0.76 $ 36,071 $0 $0 $87,403 $87,403
LFC 29,578 0.18 $ 46,759 $ 0.29 $ 36,071 $0 $0 $10,688 $10,688
LFD 30,742 0.19 $ 43,306 $ 0.27 $ 36,071 $0 $0 $7,235 $7,235
SXX Average 23,054 1.45 $ 44,646 $ 2.82 $ 13,923
MXX Average 83,142 1.40 $ 156,001 $ 2.62 $ 35,251
LXX Average 99,698 0.61 $ 192,340 $ 1.19 $ 39,436
XAX Average 127,885 2.15 $ 249,599 $ 4.18 $ 33,055
XEX Average 39,205 0.62 $ 78,851 $ 1.27 $ 27,191
XFX Average 24,091 0.43 $ 38,464 $ 0.71 $ 27,191
ALL Average 68,631 1.16 $ 130,996 $ 2.21 $ 29,537
CTZ08 Fullerton - Floating Head Pressure
Energy Savings
(kWh) Energy Savings/ SF (kWh)
TDV Cost
Savings ($)
TDV Cost
Savings /SF ($)
Measure
Cost ($)
Refrigerant Cost
Savings Range ($) Net Savings Range ($)
SAC 38,527 2.43 $ 140,286 $ 8.85 $ 15,248 -$3,738 -$5,607 $121,300 $119,431
SAD 46,054 2.91 $ 158,156 $ 9.98 $ 15,248 -$934 -$1,869 $141,974 $141,039
SEC 6,039 0.38 $ 74,214 $ 4.68 $ 13,040 $0 $0 $61,174 $61,174
SFC 16,053 1.01 $ 26,503 $ 1.67 $ 13,040 $0 $0 $13,463 $13,463
SFD 18,268 1.15 $ 29,494 $ 1.86 $ 13,040 $0 $0 $16,454 $16,454
MAC 155,455 2.61 $ 271,600 $ 4.56 $ 39,433 -$18,802 -$28,202 $213,366 $203,965
MAD 169,481 2.85 $ 301,138 $ 5.06 $ 39,433 -$4,285 -$9,401 $257,420 $252,305
MEC 50,026 0.84 $ 100,086 $ 1.68 $ 32,463 $0 $0 $67,623 $67,623
MFC 40,973 0.69 $ 66,756 $ 1.12 $ 32,463 $0 $0 $34,293 $34,293
MFD 44,953 0.75 $ 72,443 $ 1.22 $ 32,463 $0 $0 $39,980 $39,980
LAC 191,996 1.18 $ 357,687 $ 2.21 $ 44,484 -$22,974 -$34,461 $290,229 $278,742
LAD 204,068 1.26 $ 392,707 $ 2.42 $ 44,484 -$5,744 -$11,487 $342,480 $336,736
LEC 72,521 0.45 $ 139,627 $ 0.86 $ 36,071 $0 $0 $103,556 $103,556
LFC 39,502 0.24 $ 61,915 $ 0.38 $ 36,071 $0 $0 $25,844 $25,844
LFD 42,232 0.26 $ 61,986 $ 0.38 $ 36,071 $0 $0 $25,915 $25,915
SXX Average 24,988 1.58 $ 85,731 $ 5.41 $ 13,923
MXX Average 92,178 1.55 $ 162,405 $ 2.73 $ 35,251
LXX Average 110,064 0.68 $ 202,785 $ 1.25 $ 39,436
XAX Average 134,264 2.21 $ 270,262 $ 5.51 $ 33,055
XEX Average 42,862 0.56 $ 104,642 $ 2.41 $ 27,191
XFX Average 33,664 0.69 $ 53,183 $ 1.11 $ 27,191
ALL Average 75,743 1.27 $ 150,307 $ 3.13 $ 29,537
CTZ10 Riverside - Floating Head Pressure
Energy Savings
(kWh) Energy Savings/ SF (kWh)
TDV Cost
Savings ($)
TDV Cost
Savings /SF ($)
Measure
Cost ($)
Refrigerant Cost
Savings Range ($) Net Savings Range ($)
SAC 39,532 2.49 $ 63,926 $ 4.03 $ 15,248 -$3,738 -$5,607 $44,941 $43,072
SAD 44,875 2.83 $ 72,728 $ 4.59 $ 15,248 -$934 -$1,869 $56,546 $55,611
SEC 14,918 0.94 $ 30,223 $ 1.91 $ 13,040 $0 $0 $17,183 $17,183
SFC 13,572 0.86 $ 21,991 $ 1.39 $ 13,040 $0 $0 $8,951 $8,951
SFD 15,008 0.95 $ 23,584 $ 1.49 $ 13,040 $0 $0 $10,544 $10,544
MAC 144,706 2.43 $ 230,795 $ 3.88 $ 39,433 -$18,802 -$28,202 $172,561 $163,160
MAD 158,128 2.66 $ 253,561 $ 4.26 $ 39,433 -$4,285 -$9,401 $209,843 $204,727
MEC 54,139 0.91 $ 107,615 $ 1.81 $ 32,463 $0 $0 $75,152 $75,152
MFC 52,888 0.89 $ 83,532 $ 1.40 $ 32,463 $0 $0 $51,069 $51,069
MFD 60,377 1.01 $ 94,363 $ 1.58 $ 32,463 $0 $0 $61,900 $61,900
LAC 183,117 1.13 $ 298,940 $ 1.84 $ 44,484 -$22,974 -$34,461 $231,482 $219,995
LAD 195,975 1.21 $ 325,799 $ 2.01 $ 44,484 -$5,744 -$11,487 $275,572 $269,828
LEC 83,758 0.52 $ 161,102 $ 0.99 $ 36,071 $0 $0 $125,031 $125,031
LFC 64,454 0.40 $ 102,791 $ 0.63 $ 36,071 $0 $0 $66,720 $66,720
LFD 69,876 0.43 $ 107,063 $ 0.66 $ 36,071 $0 $0 $70,992 $70,992
SXX Average 25,581 1.61 $ 42,491 $ 2.68 $ 13,923
MXX Average 94,048 1.58 $ 153,973 $ 2.59 $ 35,251
LXX Average 119,436 0.74 $ 199,139 $ 1.23 $ 39,436
XAX Average 127,722 2.12 $ 207,625 $ 3.43 $ 33,055
XEX Average 50,938 0.79 $ 99,647 $ 1.57 $ 27,191
XFX Average 46,029 0.76 $ 72,221 $ 1.19 $ 27,191
ALL Average 79,688 1.31 $ 131,868 $ 2.16 $ 29,537
CTZ12 Sacramento - Floating Head Pressure

Measure Information Template Page 123
2013 California Building Energy Efficiency Standards September 2011
Energy Savings
(kWh) Energy Savings/ SF (kWh)
TDV Cost
Savings ($)
TDV Cost
Savings /SF ($)
Measure
Cost ($)
Refrigerant Cost
Savings Range ($) Net Savings Range ($)
SAC 39,315 2.48 $ 64,514 $ 4.07 $ 15,248 -$3,738 -$5,607 $45,528 $43,659
SAD 44,092 2.78 $ 72,657 $ 4.58 $ 15,248 -$934 -$1,869 $56,475 $55,540
SEC 15,774 1.00 $ 31,665 $ 2.00 $ 13,040 $0 $0 $18,625 $18,625
SFC 16,053 1.01 $ 26,503 $ 1.67 $ 13,040 $0 $0 $13,463 $13,463
SFD 18,268 1.15 $ 29,494 $ 1.86 $ 13,040 $0 $0 $16,454 $16,454
MAC 146,124 2.45 $ 237,461 $ 3.99 $ 39,433 -$18,802 -$28,202 $179,227 $169,826
MAD 158,145 2.66 $ 258,073 $ 4.33 $ 39,433 -$4,285 -$9,401 $214,355 $209,239
MEC 54,644 0.92 $ 110,454 $ 1.85 $ 32,463 $0 $0 $77,991 $77,991
MFC 59,837 1.00 $ 97,327 $ 1.63 $ 32,463 $0 $0 $64,864 $64,864
MFD 70,005 1.18 $ 112,421 $ 1.89 $ 32,463 $0 $0 $79,958 $79,958
LAC 183,217 1.13 $ 303,354 $ 1.87 $ 44,484 -$22,974 -$34,461 $235,896 $224,409
LAD 190,289 1.17 $ 319,819 $ 1.97 $ 44,484 -$5,744 -$11,487 $269,591 $263,848
LEC 91,373 0.56 $ 173,748 $ 1.07 $ 36,071 $0 $0 $137,677 $137,677
LFC 79,733 0.49 $ 126,963 $ 0.78 $ 36,071 $0 $0 $90,892 $90,892
LFD 87,509 0.54 $ 134,910 $ 0.83 $ 36,071 $0 $0 $98,839 $98,839
SXX Average 26,700 1.68 $ 44,967 $ 2.84 $ 13,923
MXX Average 97,751 1.64 $ 163,147 $ 2.74 $ 35,251
LXX Average 126,424 0.78 $ 211,759 $ 1.31 $ 39,436
XAX Average 126,864 2.11 $ 209,313 $ 3.47 $ 33,055
XEX Average 53,930 0.83 $ 105,289 $ 1.64 $ 27,191
XFX Average 55,234 0.90 $ 87,936 $ 1.45 $ 27,191
ALL Average 83,625 1.37 $ 139,958 $ 2.29 $ 29,537
CTZ13 Fresno - Floating Head Pressure
Energy Savings
(kWh) Energy Savings/ SF (kWh)
TDV Cost
Savings ($)
TDV Cost
Savings /SF ($)
Measure
Cost ($)
Refrigerant Cost
Savings Range ($) Net Savings Range ($)
SAC 38,192 2.41 $ 61,452 $ 3.88 $ 15,248 -$3,738 -$5,607 $42,467 $40,598
SAD 43,127 2.72 $ 69,391 $ 4.38 $ 15,248 -$934 -$1,869 $53,208 $52,274
SEC 15,979 1.01 $ 32,439 $ 2.05 $ 13,040 $0 $0 $19,399 $19,399
SFC 14,963 0.94 $ 25,159 $ 1.59 $ 13,040 $0 $0 $12,119 $12,119
SFD 16,630 1.05 $ 27,358 $ 1.73 $ 13,040 $0 $0 $14,318 $14,318
MAC 139,461 2.34 $ 223,418 $ 3.75 $ 39,433 -$18,802 -$28,202 $165,183 $155,782
MAD 151,764 2.55 $ 243,335 $ 4.09 $ 39,433 -$4,285 -$9,401 $199,617 $194,501
MEC 58,396 0.98 $ 115,482 $ 1.94 $ 32,463 $0 $0 $83,019 $83,019
MFC 56,223 0.94 $ 91,151 $ 1.53 $ 32,463 $0 $0 $58,688 $58,688
MFD 64,878 1.09 $ 104,696 $ 1.76 $ 32,463 $0 $0 $72,233 $72,233
LAC 175,986 1.09 $ 285,164 $ 1.76 $ 44,484 -$22,974 -$34,461 $217,705 $206,218
LAD 189,627 1.17 $ 307,911 $ 1.90 $ 44,484 -$5,744 -$11,487 $257,684 $251,940
LEC 88,153 0.54 $ 171,871 $ 1.06 $ 36,071 $0 $0 $135,800 $135,800
LFC 72,617 0.45 $ 120,333 $ 0.74 $ 36,071 $0 $0 $84,262 $84,262
LFD 78,505 0.48 $ 125,628 $ 0.77 $ 36,071 $0 $0 $89,557 $89,557
SXX Average 25,778 1.63 $ 43,160 $ 2.72 $ 13,923
MXX Average 94,144 1.58 $ 155,616 $ 2.61 $ 35,251
LXX Average 120,978 0.75 $ 202,181 $ 1.25 $ 39,436
XAX Average 123,026 2.05 $ 198,445 $ 3.29 $ 33,055
XEX Average 54,176 0.84 $ 106,597 $ 1.68 $ 27,191
XFX Average 50,636 0.83 $ 82,387 $ 1.35 $ 27,191
ALL Average 80,300 1.32 $ 133,652 $ 2.19 $ 29,537
CTZ14 Palmdale - Floating Head Pressure
Energy Savings
(kWh) Energy Savings/ SF (kWh)
TDV Cost
Savings ($)
TDV Cost
Savings /SF ($)
Measure
Cost ($)
Refrigerant Cost
Savings Range ($) Net Savings Range ($)
SAC 36,364 2.29 $ 57,955 $ 3.66 $ 15,248 -$3,738 -$5,607 $38,969 $37,100
SAD 41,444 2.61 $ 66,160 $ 4.17 $ 15,248 -$934 -$1,869 $49,978 $49,043
SEC 17,764 1.12 $ 33,276 $ 2.10 $ 13,040 $0 $0 $20,236 $20,236
SFC 22,121 1.40 $ 35,011 $ 2.21 $ 13,040 $0 $0 $21,971 $21,971
SFD 25,252 1.59 $ 39,265 $ 2.48 $ 13,040 $0 $0 $26,225 $26,225
MAC 134,446 2.26 $ 212,596 $ 3.57 $ 39,433 -$18,802 -$28,202 $154,361 $144,960
MAD 147,212 2.47 $ 233,430 $ 3.92 $ 39,433 -$4,285 -$9,401 $189,712 $184,596
MEC 63,563 1.07 $ 122,184 $ 2.05 $ 32,463 $0 $0 $89,721 $89,721
MFC 80,608 1.35 $ 128,672 $ 2.16 $ 32,463 $0 $0 $96,209 $96,209
MFD 94,174 1.58 $ 147,557 $ 2.48 $ 32,463 $0 $0 $115,094 $115,094
LAC 171,801 1.06 $ 275,765 $ 1.70 $ 44,484 -$22,974 -$34,461 $208,307 $196,820
LAD 186,133 1.15 $ 302,171 $ 1.86 $ 44,484 -$5,744 -$11,487 $251,943 $246,200
LEC 99,380 0.61 $ 178,510 $ 1.10 $ 36,071 $0 $0 $142,439 $142,439
LFC 115,817 0.71 $ 179,044 $ 1.10 $ 36,071 $0 $0 $142,973 $142,973
LFD 125,481 0.77 $ 189,572 $ 1.17 $ 36,071 $0 $0 $153,501 $153,501
SXX Average 28,589 1.80 $ 46,334 $ 2.92 $ 13,923
MXX Average 104,001 1.75 $ 168,887 $ 2.84 $ 35,251
LXX Average 139,722 0.86 $ 225,012 $ 1.39 $ 39,436
XAX Average 119,567 1.97 $ 191,346 $ 3.15 $ 33,055
XEX Average 60,236 0.93 $ 111,323 $ 1.75 $ 27,191
XFX Average 77,242 1.24 $ 119,853 $ 1.93 $ 27,191
ALL Average 90,771 1.47 $ 146,744 $ 2.38 $ 29,537
CTZ15 Palm Springs - Floating Head Pressure
Energy Savings Energy Savings/ SF (kWh) TDV Cost TDV Cost Measure Refrigerant Cost Net Savings Range ($)

Measure Information Template Page 124
2013 California Building Energy Efficiency Standards September 2011
(kWh) Savings ($) Savings /SF ($) Cost ($) Savings Range ($)
SAC 32,567 2.05 $ 50,604 $ 3.19 $ 15,248 -$3,738 -$5,607 $31,618 $29,749
SAD 38,403 2.42 $ 59,628 $ 3.76 $ 15,248 -$934 -$1,869 $43,445 $42,511
SEC 16,456 1.04 $ 33,045 $ 2.08 $ 13,040 $0 $0 $20,005 $20,005
SFC 11,572 0.73 $ 19,303 $ 1.22 $ 13,040 $0 $0 $6,263 $6,263
SFD 12,384 0.78 $ 20,318 $ 1.28 $ 13,040 $0 $0 $7,278 $7,278
MAC 114,327 1.92 $ 177,700 $ 2.98 $ 39,433 -$18,802 -$28,202 $119,465 $110,064
MAD 130,137 2.19 $ 201,987 $ 3.39 $ 39,433 -$4,285 -$9,401 $158,269 $153,153
MEC 57,367 0.96 $ 109,377 $ 1.84 $ 32,463 $0 $0 $76,914 $76,914
MFC 44,760 0.75 $ 70,833 $ 1.19 $ 32,463 $0 $0 $38,370 $38,370
MFD 50,255 0.84 $ 79,581 $ 1.34 $ 32,463 $0 $0 $47,118 $47,118
LAC 153,344 0.95 $ 239,633 $ 1.48 $ 44,484 -$22,974 -$34,461 $172,175 $160,688
LAD 181,873 1.12 $ 282,885 $ 1.74 $ 44,484 -$5,744 -$11,487 $232,658 $226,914
LEC 86,487 0.53 $ 168,658 $ 1.04 $ 36,071 $0 $0 $132,587 $132,587
LFC 56,150 0.35 $ 93,758 $ 0.58 $ 36,071 $0 $0 $57,687 $57,687
LFD 59,380 0.37 $ 97,745 $ 0.60 $ 36,071 $0 $0 $61,674 $61,674
SXX Average 22,276 1.41 $ 36,579 $ 2.31 $ 13,923
MXX Average 79,369 1.33 $ 127,896 $ 2.15 $ 35,251
LXX Average 107,447 0.66 $ 176,536 $ 1.09 $ 39,436
XAX Average 108,442 1.78 $ 168,739 $ 2.76 $ 33,055
XEX Average 53,437 0.84 $ 103,693 $ 1.65 $ 27,191
XFX Average 39,084 0.64 $ 63,590 $ 1.03 $ 27,191
ALL Average 69,697 1.13 $ 113,670 $ 1.85 $ 29,537

Measure Information Template Page 125
2013 California Building Energy Efficiency Standards September 2011
14.2 Condenser Specific Efficiency CTZ01 Arcata - Condenser Specific Efficiency
Energy Savings
(kWh)
Energy Savings/ SF
(kWh)
TDV Cost
Savings ($)
TDV Cost
Savings /SF ($)
Measure
Cost ($)
Benefit/
Cost Ratio
SAC-EC 579 0.04 $1,299 $0.08 $1,731 0.75
SAC-Non-EC 579 0.04 $1,299 $0.08 $1,099 1.18
SAD-EC 431 0.03 $979 $0.06 $1,738 0.56
SAD-Non-EC 431 0.03 $979 $0.06 $1,103 0.89
SEC 633 0.04 $1,255 $0.08 $81 15.43
MAC-EC 2,467 0.04 $5,829 $0.10 $5,597 1.04
MAC-Non-EC 2,467 0.04 $5,829 $0.10 $3,554 1.64
MAD-EC 2,083 0.03 $4,779 $0.08 $5,668 0.84
MAD-Non-EC 2,083 0.03 $4,779 $0.08 $3,599 1.33
MEC 2,781 0.05 $5,491 $0.09 $261 21.04
LAC-EC 1,897 0.01 $4,414 $0.03 $8,724 0.51
LAC-Non-EC 1,897 0.01 $4,414 $0.03 $5,540 0.80
LAD-EC 1,334 0.01 $2,857 $0.02 $8,876 0.32
LAD-Non-EC 1,334 0.01 $2,857 $0.02 $5,636 0.51
LEC 1,603 0.01 $3,239 $0.02 $362 8.94
SXX Average 531 0.03 $1,162 $0.07 $1,150 3.76
MXX Average 2,376 0.04 $5,342 $0.09 $3,736 5.18
LXX Average 1,613 0.01 $3,556 $0.02 $5,828 2.22
XAX Average 1,465 0.03 $3,360 $0.06 $5,389 0.67
XEX Average 1,672 0.03 $3,328 $0.06 $235 15.14
ALL Average 1,507 0.03 $3,353 $0.06 $3,571 3.72
CTZ03 Oakland - Condenser Specific Efficiency
Energy Savings
(kWh)
Energy Savings/ SF
(kWh)
TDV Cost
Savings ($)
TDV Cost
Savings /SF ($)
Measure
Cost ($)
Benefit/
Cost Ratio
SAC-EC 906 0.06 $2,332 $0.15 $1,731 1.35
SAC-Non-EC 906 0.06 $2,332 $0.15 $1,099 2.12
SAD-EC 667 0.04 $1,887 $0.12 $1,738 1.09
SAD-Non-EC 667 0.04 $1,887 $0.12 $1,103 1.71
SEC 646 0.04 $1,237 $0.08 $81 15.21
MAC-EC 4,015 0.07 $10,386 $0.17 $5,597 1.86
MAC-Non-EC 4,015 0.07 $10,386 $0.17 $3,554 2.92
MAD-EC 3,241 0.05 $8,891 $0.15 $5,668 1.57
MAD-Non-EC 3,241 0.05 $8,891 $0.15 $3,599 2.47
MEC 2,856 0.05 $5,482 $0.09 $261 21.00
LAC-EC 3,092 0.02 $7,965 $0.05 $8,724 0.91
LAC-Non-EC 3,092 0.02 $7,965 $0.05 $5,540 1.44
LAD-EC 1,828 0.01 $4,993 $0.03 $8,876 0.56
LAD-Non-EC 1,828 0.01 $4,993 $0.03 $5,636 0.89
LEC 1,718 0.01 $3,373 $0.02 $362 9.31
SXX Average 758 0.05 $1,935 $0.12 $1,150 4.30
MXX Average 3,474 0.06 $8,807 $0.15 $3,736 5.96
LXX Average 2,312 0.01 $5,858 $0.04 $5,828 2.62
XAX Average 2,292 0.04 $6,076 $0.11 $5,389 1.22
XEX Average 1,740 0.03 $3,364 $0.06 $235 15.18
ALL Average 2,181 0.04 $5,533 $0.10 $3,571 4.29
CTZ05 Santa Maria - Condenser Specific Efficiency
Energy Savings
(kWh)
Energy Savings/ SF
(kWh)
TDV Cost
Savings ($)
TDV Cost
Savings /SF ($)
Measure
Cost ($)
Benefit/
Cost Ratio
SAC-EC 828 0.05 $1,851 $0.12 $1,731 1.07
SAC-Non-EC 828 0.05 $1,851 $0.12 $1,099 1.68
SAD-EC 618 0.04 $1,433 $0.09 $1,738 0.82
SAD-Non-EC 618 0.04 $1,433 $0.09 $1,103 1.30
SEC 635 0.04 $1,228 $0.08 $81 15.10
MAC-EC 3,671 0.06 $8,561 $0.14 $5,597 1.53
MAC-Non-EC 3,671 0.06 $8,561 $0.14 $3,554 2.41
MAD-EC 2,996 0.05 $7,129 $0.12 $5,668 1.26
MAD-Non-EC 2,996 0.05 $7,129 $0.12 $3,599 1.98
MEC 2,804 0.05 $5,420 $0.09 $261 20.77
LAC-EC 2,848 0.02 $6,354 $0.04 $8,724 0.73
LAC-Non-EC 2,848 0.02 $6,354 $0.04 $5,540 1.15
LAD-EC 4,759 0.03 $3,943 $0.02 $8,876 0.44
LAD-Non-EC 4,759 0.03 $3,943 $0.02 $5,636 0.70
LEC 1,686 0.01 $3,346 $0.02 $362 9.24
SXX Average 705 0.04 $1,559 $0.10 $1,150 4.00
MXX Average 3,228 0.05 $7,360 $0.12 $3,736 5.59
LXX Average 3,380 0.02 $4,788 $0.03 $5,828 2.45
XAX Average 2,620 0.04 $4,879 $0.09 $5,389 0.98
XEX Average 1,708 0.03 $3,331 $0.06 $235 15.04
ALL Average 2,438 0.04 $4,569 $0.08 $3,571 4.01
CTZ07 San Diego-Lindbergh - Condenser Specific Efficiency
Energy Savings
(kWh)
Energy Savings/ SF
(kWh)
TDV Cost
Savings ($)
TDV Cost
Savings /SF ($)
Measure
Cost ($)
Benefit/
Cost Ratio

Measure Information Template Page 126
2013 California Building Energy Efficiency Standards September 2011
SAC-EC 1,250 0.08 $2,759 $0.17 $1,731 1.59
SAC-Non-EC 1,250 0.08 $2,759 $0.17 $1,099 2.51
SAD-EC 939 0.06 $2,180 $0.14 $1,738 1.25
SAD-Non-EC 939 0.06 $2,180 $0.14 $1,103 1.98
SEC 647 0.04 $1,264 $0.08 $81 15.54
MAC-EC 5,859 0.10 $13,109 $0.22 $5,597 2.34
MAC-Non-EC 5,859 0.10 $13,109 $0.22 $3,554 3.69
MAD-EC 4,616 0.08 $10,813 $0.18 $5,668 1.91
MAD-Non-EC 4,616 0.08 $10,813 $0.18 $3,599 3.00
MEC 2,892 0.05 $5,678 $0.10 $261 21.75
LAC-EC 4,385 0.03 $9,692 $0.06 $8,724 1.11
LAC-Non-EC 4,385 0.03 $9,692 $0.06 $5,540 1.75
LAD-EC 2,329 0.01 $5,616 $0.03 $8,876 0.63
LAD-Non-EC 2,329 0.01 $5,616 $0.03 $5,636 1.00
LEC 1,767 0.01 $3,515 $0.02 $362 9.71
SXX Average 1,005 0.06 $2,228 $0.14 $1,150 4.58
MXX Average 4,768 0.08 $10,705 $0.18 $3,736 6.54
LXX Average 3,039 0.02 $6,826 $0.04 $5,828 2.84
XAX Average 3,230 0.06 $7,362 $0.13 $5,389 1.47
XEX Average 1,769 0.03 $3,486 $0.07 $235 15.67
ALL Average 2,937 0.05 $6,586 $0.12 $3,571 4.65
CTZ08 Fullerton - Condenser Specific Efficiency
Energy Savings
(kWh)
Energy Savings/ SF
(kWh)
TDV Cost
Savings ($)
TDV Cost
Savings /SF ($)
Measure
Cost ($)
Benefit/
Cost Ratio
SAC-EC 1,428 0.09 $4,548 $0.29 $1,853 2.45
SAC-Non-EC 1,428 0.09 $4,548 $0.29 $1,177 3.87
SAD-EC 1,034 0.07 $3,827 $0.24 $1,906 2.01
SAD-Non-EC 1,034 0.07 $3,827 $0.24 $1,210 3.16
SEC 504 0.03 $961 $0.06 $79 12.19
MAC-EC 5,962 0.10 $18,253 $0.31 $6,050 3.02
MAC-Non-EC 5,962 0.10 $18,253 $0.31 $3,841 4.75
MAD-EC 4,691 0.08 $15,966 $0.27 $6,228 2.56
MAD-Non-EC 4,691 0.08 $15,966 $0.27 $3,955 4.04
MEC 3,453 0.06 $6,621 $0.11 $277 23.90
LAC-EC 5,876 0.04 $18,734 $0.12 $9,459 1.98
LAC-Non-EC 5,876 0.04 $18,734 $0.12 $6,006 3.12
LAD-EC 2,815 0.02 $12,006 $0.07 $9,862 1.22
LAD-Non-EC 2,815 0.02 $12,006 $0.07 $6,262 1.92
LEC 1,457 0.01 $2,830 $0.02 $352 8.03
SXX Average 1,086 0.07 $3,542 $0.22 $1,245 4.74
MXX Average 4,952 0.08 $15,012 $0.25 $4,070 7.65
LXX Average 3,768 0.02 $12,862 $0.08 $6,388 3.25
XAX Average 3,634 0.06 $12,222 $0.22 $5,893 2.21
XEX Average 1,805 0.03 $3,471 $0.06 $236 14.71
ALL Average 3,268 0.06 $10,472 $0.18 $3,901 5.21
CTZ10 Riverside - Condenser Specific Efficiency
Energy Savings
(kWh)
Energy Savings/ SF
(kWh)
TDV Cost
Savings ($)
TDV Cost
Savings /SF ($)
Measure
Cost ($)
Benefit/
Cost Ratio
SAC-EC 2,252 0.14 $7,752 $0.49 $1,853 4.18
SAC-Non-EC 2,252 0.14 $7,752 $0.49 $1,177 6.59
SAD-EC 2,014 0.13 $7,716 $0.49 $1,906 4.05
SAD-Non-EC 2,014 0.13 $7,716 $0.49 $1,210 6.38
SEC 471 0.03 $881 $0.06 $79 11.17
MAC-EC 8,795 0.15 $28,461 $0.48 $6,050 4.70
MAC-Non-EC 8,795 0.15 $28,461 $0.48 $3,841 7.41
MAD-EC 7,913 0.13 $27,696 $0.47 $6,228 4.45
MAD-Non-EC 7,913 0.13 $27,696 $0.47 $3,955 7.00
MEC 3,267 0.05 $6,230 $0.10 $277 22.49
LAC-EC 9,877 0.06 $36,889 $0.23 $9,459 3.90
LAC-Non-EC 9,877 0.06 $36,889 $0.23 $6,006 6.14
LAD-EC 6,715 0.04 $29,885 $0.18 $9,862 3.03
LAD-Non-EC 6,715 0.04 $29,885 $0.18 $6,262 4.77
LEC 1,427 0.01 $2,741 $0.02 $352 7.78
SXX Average 1,801 0.11 $6,363 $0.40 $1,245 6.47
MXX Average 7,337 0.12 $23,709 $0.40 $4,070 9.21
LXX Average 6,922 0.04 $27,258 $0.17 $6,388 5.12
XAX Average 6,261 0.11 $23,066 $0.39 $5,893 4.05
XEX Average 1,722 0.03 $3,284 $0.06 $236 13.81
CTZ12 Sacramento - Condenser Specific Efficiency
Energy Savings
(kWh)
Energy Savings/ SF
(kWh)
TDV Cost
Savings ($)
TDV Cost
Savings /SF ($)
Measure
Cost ($)
Benefit/
Cost Ratio
SAC-EC 1,906 0.12 $7,066 $0.45 $1,853 3.81
SAC-Non-EC 1,906 0.12 $7,066 $0.45 $1,177 6.01
SAD-EC 1,687 0.11 $7,040 $0.44 $1,906 3.69
SAD-Non-EC 1,687 0.11 $7,040 $0.44 $1,210 5.82
SEC 467 0.03 $890 $0.06 $79 11.29
MAC-EC 7,417 0.12 $25,773 $0.43 $6,050 4.26
MAC-Non-EC 7,417 0.12 $25,773 $0.43 $3,841 6.71
MAD-EC 6,639 0.11 $25,195 $0.42 $6,228 4.05

Measure Information Template Page 127
2013 California Building Energy Efficiency Standards September 2011
MAD-Non-EC 6,639 0.11 $25,195 $0.42 $3,955 6.37
MEC 3,182 0.05 $6,141 $0.10 $277 22.17
LAC-EC 8,183 0.05 $33,356 $0.21 $9,459 3.53
LAC-Non-EC 8,183 0.05 $33,356 $0.21 $6,006 5.55
LAD-EC 5,700 0.04 $27,900 $0.17 $9,862 2.83
LAD-Non-EC 5,700 0.04 $27,900 $0.17 $6,262 4.46
LEC 1,384 0.01 $2,706 $0.02 $352 7.68
SXX Average 1,531 0.10 $5,820 $0.37 $1,245 6.12
MXX Average 6,259 0.11 $21,616 $0.36 $4,070 8.71
LXX Average 5,830 0.04 $25,044 $0.15 $6,388 4.81
XAX Average 5,255 0.09 $21,055 $0.35 $5,893 3.69
XEX Average 1,678 0.03 $3,245 $0.06 $236 13.71
ALL Average 4,540 0.08 $17,493 $0.29 $3,901 6.55
CTZ13 Fresno - Condenser Specific Efficiency
Energy Savings
(kWh)
Energy Savings/ SF
(kWh)
TDV Cost
Savings ($)
TDV Cost
Savings /SF ($)
Measure
Cost ($)
Benefit/
Cost Ratio
SAC-EC 2,723 0.17 $8,633 $0.54 $1,853 4.66
SAC-Non-EC 2,723 0.17 $8,633 $0.54 $1,177 7.34
SAD-EC 2,605 0.16 $8,837 $0.56 $1,906 4.64
SAD-Non-EC 2,605 0.16 $8,837 $0.56 $1,210 7.30
SEC 453 0.03 $872 $0.06 $79 11.06
MAC-EC 10,449 0.18 $31,487 $0.53 $6,050 5.20
MAC-Non-EC 10,449 0.18 $31,487 $0.53 $3,841 8.20
MAD-EC 9,849 0.17 $31,220 $0.52 $6,228 5.01
MAD-Non-EC 9,849 0.17 $31,220 $0.52 $3,955 7.89
MEC 3,151 0.05 $6,114 $0.10 $277 22.07
LAC-EC 12,446 0.08 $42,273 $0.26 $9,459 4.47
LAC-Non-EC 12,446 0.08 $42,273 $0.26 $6,006 7.04
LAD-EC 9,615 0.06 $36,284 $0.22 $9,862 3.68
LAD-Non-EC 9,615 0.06 $36,284 $0.22 $6,262 5.79
LEC 1,401 0.01 $2,723 $0.02 $352 7.73
SXX Average 2,222 0.14 $7,162 $0.45 $1,245 7.00
MXX Average 8,749 0.15 $26,306 $0.44 $4,070 9.68
LXX Average 9,105 0.06 $31,968 $0.20 $6,388 5.74
XAX Average 7,948 0.14 $26,456 $0.44 $5,893 4.61
XEX Average 1,668 0.03 $3,237 $0.06 $236 13.62
ALL Average 6,692 0.11 $21,812 $0.36 $3,901 7.47
CTZ14 Palmdale - Condenser Specific Efficiency
Energy Savings
(kWh)
Energy Savings/ SF
(kWh)
TDV Cost
Savings ($)
TDV Cost
Savings /SF ($)
Measure
Cost ($)
Benefit/
Cost Ratio
SAC-EC 2,725 0.17 $8,677 $0.55 $1,853 4.68
SAC-Non-EC 2,725 0.17 $8,677 $0.55 $1,177 7.37
SAD-EC 2,617 0.17 $8,882 $0.56 $1,906 4.66
SAD-Non-EC 2,617 0.17 $8,882 $0.56 $1,210 7.34
SEC 386 0.02 $756 $0.05 $79 9.59
MAC-EC 10,195 0.17 $31,122 $0.52 $6,050 5.14
MAC-Non-EC 10,195 0.17 $31,122 $0.52 $3,841 8.10
MAD-EC 9,715 0.16 $31,149 $0.52 $6,228 5.00
MAD-Non-EC 9,715 0.16 $31,149 $0.52 $3,955 7.88
MEC 2,669 0.04 $5,340 $0.09 $277 19.27
LAC-EC 12,556 0.08 $42,300 $0.26 $9,459 4.47
LAC-Non-EC 12,556 0.08 $42,300 $0.26 $6,006 7.04
LAD-EC 9,744 0.06 $36,257 $0.22 $9,862 3.68
LAD-Non-EC 9,744 0.06 $36,257 $0.22 $6,262 5.79
LEC 1,280 0.01 $2,545 $0.02 $352 7.22
SXX Average 2,214 0.14 $7,175 $0.45 $1,245 6.73
MXX Average 8,498 0.14 $25,976 $0.44 $4,070 9.08
LXX Average 9,176 0.06 $31,932 $0.20 $6,388 5.64
XAX Average 7,925 0.13 $26,398 $0.44 $5,893 4.61
XEX Average 1,445 0.03 $2,881 $0.05 $236 12.03
ALL Average 6,629 0.11 $21,694 $0.36 $3,901 7.15
CTZ15 Palm Springs - Condenser Specific Efficiency
Energy Savings
(kWh)
Energy Savings/ SF
(kWh)
TDV Cost
Savings ($)
TDV Cost
Savings /SF ($)
Measure
Cost ($)
Benefit/
Cost Ratio
SAC-EC 5,478 0.35 $13,492 $0.85 $1,853 7.28
SAC-Non-EC 5,478 0.35 $13,492 $0.85 $1,177 11.47
SAD-EC 5,453 0.34 $13,688 $0.86 $1,906 7.18
SAD-Non-EC 5,453 0.34 $13,688 $0.86 $1,210 11.31
SEC 450 0.03 $890 $0.06 $79 11.29
MAC-EC 19,835 0.33 $47,239 $0.79 $6,050 7.81
MAC-Non-EC 19,835 0.33 $47,239 $0.79 $3,841 12.30
MAD-EC 19,474 0.33 $47,364 $0.80 $6,228 7.60
MAD-Non-EC 19,474 0.33 $47,364 $0.80 $3,955 11.98
MEC 3,349 0.06 $6,844 $0.11 $277 24.70
LAC-EC 26,006 0.16 $66,062 $0.41 $9,459 6.98
LAC-Non-EC 26,006 0.16 $66,062 $0.41 $6,006 11.00
LAD-EC 21,639 0.13 $57,172 $0.35 $9,862 5.80
LAD-Non-EC 21,639 0.13 $57,172 $0.35 $6,262 9.13
LEC 1,570 0.01 $3,159 $0.02 $352 8.96

Measure Information Template Page 128
2013 California Building Energy Efficiency Standards September 2011
SXX Average 4,462 0.28 $11,050 $0.70 $1,245 9.71
MXX Average 16,393 0.28 $39,210 $0.66 $4,070 12.88
LXX Average 19,372 0.12 $49,925 $0.31 $6,388 8.37
XAX Average 16,314 0.27 $40,836 $0.68 $5,893 7.11
XEX Average 1,790 0.03 $3,631 $0.06 $236 14.99
ALL Average 13,409 0.23 $33,395 $0.55 $3,901 10.32

Measure Information Template Page 129
2013 California Building Energy Efficiency Standards September 2011
14.3 Floating Suction Pressure CTZ01 Arcata - Floating Suction Pressure
Energy Savings
(kWh)
Energy Savings/
SF (kWh)
TDV Cost
Savings ($)
TDV Cost
Savings /SF ($)
Measure
Cost ($)
Benefit/
Cost Ratio
SAC 6,517 0.41 $ 12,442 $ 0.79 $ 5,075 2.45
SAD 8,917 0.56 $ 17,141 $ 1.08 $ 5,075 3.38
SEC 6,534 0.41 $ 12,424 $ 0.78 $ 5,075 2.45
SFC 7,263 0.46 $ 13,964 $ 0.88 $ 5,075 2.75
SFD 10,557 0.67 $ 20,460 $ 1.29 $ 5,075 4.03
MAC 28,350 0.48 $ 53,015 $ 0.89 $ 10,149 5.22
MAD 31,368 0.53 $ 60,002 $ 1.01 $ 10,149 5.91
MEC 28,097 0.47 $ 53,567 $ 0.90 $ 10,149 5.28
MFC 32,856 0.55 $ 62,333 $ 1.05 $ 10,149 6.14
MFD 38,106 0.64 $ 73,049 $ 1.23 $ 10,149 7.20
LAC 39,151 0.24 $ 75,621 $ 0.47 $ 10,149 7.45
LAD 46,401 0.29 $ 89,086 $ 0.55 $ 10,149 8.78
LEC 40,389 0.25 $ 77,970 $ 0.48 $ 10,149 7.68
LFC 46,092 0.28 $ 88,899 $ 0.55 $ 10,149 8.76
LFD 57,632 0.36 $ 110,356 $ 0.68 $ 10,149 10.87
SXX Average 7,958 0.50 $ 15,286 $ 0.96 $ 5,075 3.01
MXX Average 31,755 0.53 $ 60,393 $ 1.01 $ 10,149 5.95
LXX Average 45,933 0.28 $ 88,386 $ 0.55 $ 10,149 8.71
XAX Average 26,784 0.42 $ 51,218 $ 0.80 $ 8,458 6.06
XEX Average 25,007 0.38 $ 47,987 $ 0.72 $ 8,458 5.67
XFX Average 32,084 0.49 $ 61,510 $ 0.95 $ 8,458 7.27
ALL Average 28,549 0.44 $ 54,689 $ 0.84 $ 8,458 6.47
CTZ03 Oakland - Floating Suction Pressure
Energy Savings
(kWh)
Energy Savings/
SF (kWh)
TDV Cost
Savings ($)
TDV Cost
Savings /SF ($)
Measure
Cost ($)
Benefit/
Cost Ratio
SAC 6,734 0.42 $ 13,154 $ 0.83 $ 5,075 2.59
SAD 9,196 0.58 $ 17,826 $ 1.12 $ 5,075 3.51
SEC 6,691 0.42 $ 12,646 $ 0.80 $ 5,075 2.49
SFC 7,484 0.47 $ 14,382 $ 0.91 $ 5,075 2.83
SFD 10,885 0.69 $ 20,968 $ 1.32 $ 5,075 4.13
MAC 29,064 0.49 $ 55,810 $ 0.94 $ 10,149 5.50
MAD 32,332 0.54 $ 62,769 $ 1.05 $ 10,149 6.18
MEC 29,173 0.49 $ 55,231 $ 0.93 $ 10,149 5.44
MFC 33,727 0.57 $ 63,748 $ 1.07 $ 10,149 6.28
MFD 39,844 0.67 $ 76,653 $ 1.29 $ 10,149 7.55
LAC 40,939 0.25 $ 82,625 $ 0.51 $ 10,149 8.14
LAD 47,450 0.29 $ 91,044 $ 0.56 $ 10,149 8.97
LEC 41,988 0.26 $ 81,948 $ 0.51 $ 10,149 8.07
LFC 47,934 0.30 $ 93,411 $ 0.58 $ 10,149 9.20
LFD 59,211 0.37 $ 113,854 $ 0.70 $ 10,149 11.22
SXX Average 8,198 0.52 $ 15,795 $ 1.00 $ 5,075 3.11
MXX Average 32,828 0.55 $ 62,842 $ 1.06 $ 10,149 6.19
LXX Average 47,504 0.29 $ 92,576 $ 0.57 $ 10,149 9.12
XAX Average 27,619 0.43 $ 53,871 $ 0.84 $ 8,458 6.37
XEX Average 25,951 0.39 $ 49,942 $ 0.74 $ 8,458 5.90
XFX Average 33,181 0.51 $ 63,836 $ 0.98 $ 8,458 7.55
ALL Average 29,510 0.45 $ 57,071 $ 0.87 $ 8,458 6.75
CTZ05 Santa Maria - Floating Suction Pressure
Energy Savings
(kWh)
Energy Savings/
SF (kWh)
TDV Cost
Savings ($)
TDV Cost
Savings /SF ($)
Measure
Cost ($)
Benefit/
Cost Ratio
SAC 6,726 0.42 $ 13,056 $ 0.82 $ 5,075 2.57
SAD 9,159 0.58 $ 17,701 $ 1.12 $ 5,075 3.49
SEC 6,662 0.42 $ 12,691 $ 0.80 $ 5,075 2.50
SFC 7,418 0.47 $ 14,293 $ 0.90 $ 5,075 2.82
SFD 10,779 0.68 $ 20,834 $ 1.31 $ 5,075 4.11
MAC 28,905 0.49 $ 55,329 $ 0.93 $ 10,149 5.45
MAD 32,203 0.54 $ 62,146 $ 1.04 $ 10,149 6.12
MEC 28,872 0.48 $ 54,956 $ 0.92 $ 10,149 5.41
MFC 33,430 0.56 $ 63,375 $ 1.06 $ 10,149 6.24
MFD 39,296 0.66 $ 75,567 $ 1.27 $ 10,149 7.45
LAC 40,736 0.25 $ 81,930 $ 0.51 $ 10,149 8.07
LAD 47,067 0.29 $ 90,047 $ 0.56 $ 10,149 8.87
LEC 41,572 0.26 $ 81,227 $ 0.50 $ 10,149 8.00
LFC 47,701 0.29 $ 92,824 $ 0.57 $ 10,149 9.15
LFD 58,964 0.36 $ 113,845 $ 0.70 $ 10,149 11.22
SXX Average 8,149 0.51 $ 15,715 $ 0.99 $ 5,075 3.10
MXX Average 32,541 0.55 $ 62,275 $ 1.05 $ 10,149 6.14
LXX Average 47,208 0.29 $ 91,975 $ 0.57 $ 10,149 9.06
XAX Average 27,466 0.43 $ 53,368 $ 0.83 $ 8,458 6.31
XEX Average 25,702 0.39 $ 49,625 $ 0.74 $ 8,458 5.87
XFX Average 32,931 0.50 $ 63,456 $ 0.97 $ 8,458 7.50
ALL Average 29,299 0.45 $ 56,655 $ 0.87 $ 8,458 6.70

Measure Information Template Page 130
2013 California Building Energy Efficiency Standards September 2011
CTZ07 San Diego-Lindbergh - Floating Suction Pressure
Energy Savings
(kWh)
Energy Savings/
SF (kWh)
TDV Cost
Savings ($)
TDV Cost
Savings /SF ($)
Measure
Cost ($)
Benefit/
Cost Ratio
SAC 7,079 0.45 $ 13,919 $ 0.88 $ 5,075 2.74
SAD 9,639 0.61 $ 18,805 $ 1.19 $ 5,075 3.71
SEC 7,006 0.44 $ 13,385 $ 0.84 $ 5,075 2.64
SFC 7,922 0.50 $ 15,450 $ 0.97 $ 5,075 3.04
SFD 11,562 0.73 $ 22,409 $ 1.41 $ 5,075 4.42
MAC 27,095 0.45 $ 50,773 $ 0.85 $ 10,149 5.00
MAD 31,510 0.53 $ 60,011 $ 1.01 $ 10,149 5.91
MEC 28,377 0.48 $ 52,286 $ 0.88 $ 10,149 5.15
MFC 33,087 0.56 $ 62,129 $ 1.04 $ 10,149 6.12
MFD 40,580 0.68 $ 77,961 $ 1.31 $ 10,149 7.68
LAC 42,336 0.26 $ 85,855 $ 0.53 $ 10,149 8.46
LAD 47,543 0.29 $ 91,391 $ 0.56 $ 10,149 9.00
LEC 44,164 0.27 $ 86,362 $ 0.53 $ 10,149 8.51
LFC 50,824 0.31 $ 100,282 $ 0.62 $ 10,149 9.88
LFD 61,220 0.38 $ 119,176 $ 0.74 $ 10,149 11.74
SXX Average 8,642 0.55 $ 16,794 $ 1.06 $ 5,075 3.31
MXX Average 32,130 0.54 $ 60,632 $ 1.02 $ 10,149 5.97
LXX Average 49,217 0.30 $ 96,613 $ 0.60 $ 10,149 9.52
XAX Average 27,534 0.43 $ 53,459 $ 0.84 $ 8,458 6.32
XEX Average 26,516 0.40 $ 50,678 $ 0.75 $ 8,458 5.99
XFX Average 34,199 0.53 $ 66,234 $ 1.02 $ 8,458 7.83
ALL Average 29,996 0.46 $ 58,013 $ 0.89 $ 8,458 6.86
CTZ08 Fullerton - Floating Suction Pressure
Energy Savings
(kWh)
Energy Savings/
SF (kWh)
TDV Cost
Savings ($)
TDV Cost
Savings /SF ($)
Measure
Cost ($)
Benefit/
Cost Ratio
SAC 7,244 0.46 $ 14,587 $ 0.92 $ 5,075 2.87
SAD 9,582 0.60 $ 19,731 $ 1.24 $ 5,075 3.89
SEC 6,620 0.42 $ 12,620 $ 0.80 $ 5,075 2.49
SFC 7,465 0.47 $ 14,471 $ 0.91 $ 5,075 2.85
SFD 10,794 0.68 $ 21,066 $ 1.33 $ 5,075 4.15
MAC 30,022 0.50 $ 56,068 $ 0.94 $ 10,149 5.52
MAD 31,712 0.53 $ 61,461 $ 1.03 $ 10,149 6.06
MEC 27,915 0.47 $ 50,986 $ 0.86 $ 10,149 5.02
MFC 32,636 0.55 $ 60,669 $ 1.02 $ 10,149 5.98
MFD 38,290 0.64 $ 72,897 $ 1.22 $ 10,149 7.18
LAC 46,292 0.29 $ 95,298 $ 0.59 $ 10,149 9.39
LAD 49,172 0.30 $ 97,113 $ 0.60 $ 10,149 9.57
LEC 44,216 0.27 $ 85,392 $ 0.53 $ 10,149 8.41
LFC 50,509 0.31 $ 97,914 $ 0.60 $ 10,149 9.65
LFD 62,622 0.39 $ 120,226 $ 0.74 $ 10,149 11.85
SXX Average 8,341 0.53 $ 16,495 $ 1.04 $ 5,075 3.25
MXX Average 32,115 0.54 $ 60,416 $ 1.01 $ 10,149 5.95
LXX Average 50,562 0.31 $ 99,189 $ 0.61 $ 10,149 9.77
XAX Average 29,004 0.45 $ 57,376 $ 0.89 $ 8,458 6.78
XEX Average 26,250 0.39 $ 49,666 $ 0.73 $ 8,458 5.87
XFX Average 33,719 0.51 $ 64,540 $ 0.97 $ 8,458 7.63
ALL Average 30,339 0.46 $ 58,700 $ 0.89 $ 8,458 6.94
CTZ10 Riverside - Floating Suction Pressure
Energy Savings
(kWh)
Energy Savings/
SF (kWh)
TDV Cost
Savings ($)
TDV Cost
Savings /SF ($)
Measure
Cost ($)
Benefit/
Cost Ratio
SAC 7,509 0.47 $ 15,094 $ 0.95 $ 5,075 2.97
SAD 9,812 0.62 $ 20,131 $ 1.27 $ 5,075 3.97
SEC 6,721 0.42 $ 12,664 $ 0.80 $ 5,075 2.50
SFC 7,594 0.48 $ 14,640 $ 0.92 $ 5,075 2.88
SFD 11,001 0.69 $ 21,137 $ 1.33 $ 5,075 4.16
MAC 32,565 0.55 $ 63,989 $ 1.07 $ 10,149 6.30
MAD 34,383 0.58 $ 70,735 $ 1.19 $ 10,149 6.97
MEC 28,811 0.48 $ 52,517 $ 0.88 $ 10,149 5.17
MFC 33,897 0.57 $ 63,526 $ 1.07 $ 10,149 6.26
MFD 39,147 0.66 $ 75,407 $ 1.27 $ 10,149 7.43
LAC 49,034 0.30 $ 102,782 $ 0.63 $ 10,149 10.13
LAD 50,786 0.31 $ 103,850 $ 0.64 $ 10,149 10.23
LEC 44,043 0.27 $ 84,939 $ 0.52 $ 10,149 8.37
LFC 50,234 0.31 $ 97,612 $ 0.60 $ 10,149 9.62
LFD 62,400 0.38 $ 119,603 $ 0.74 $ 10,149 11.78
SXX Average 8,527 0.54 $ 16,733 $ 1.06 $ 5,075 3.30
MXX Average 33,761 0.57 $ 65,235 $ 1.10 $ 10,149 6.43
LXX Average 51,299 0.32 $ 101,757 $ 0.63 $ 10,149 10.03
XAX Average 30,682 0.47 $ 62,764 $ 0.96 $ 8,458 7.42
XEX Average 26,525 0.39 $ 50,040 $ 0.73 $ 8,458 5.92
XFX Average 34,046 0.52 $ 65,321 $ 0.99 $ 8,458 7.72
ALL Average 31,196 0.47 $ 61,242 $ 0.93 $ 8,458 7.24
CTZ12 Sacramento - Floating Suction Pressure
Energy Savings
(kWh)
Energy Savings/
SF (kWh)
TDV Cost
Savings ($)
TDV Cost
Savings /SF ($)
Measure
Cost ($)
Benefit/
Cost Ratio
SAC 7,244 0.46 $ 14,587 $ 0.92 $ 5,075 2.87

Measure Information Template Page 131
2013 California Building Energy Efficiency Standards September 2011
SAD 9,582 0.60 $ 19,731 $ 1.24 $ 5,075 3.89
SEC 6,620 0.42 $ 12,620 $ 0.80 $ 5,075 2.49
SFC 7,465 0.47 $ 14,471 $ 0.91 $ 5,075 2.85
SFD 10,794 0.68 $ 21,066 $ 1.33 $ 5,075 4.15
MAC 33,136 0.56 $ 66,979 $ 1.12 $ 10,149 6.60
MAD 34,564 0.58 $ 72,452 $ 1.22 $ 10,149 7.14
MEC 29,506 0.50 $ 56,095 $ 0.94 $ 10,149 5.53
MFC 34,372 0.58 $ 66,036 $ 1.11 $ 10,149 6.51
MFD 39,173 0.66 $ 77,196 $ 1.30 $ 10,149 7.61
LAC 47,095 0.29 $ 99,445 $ 0.61 $ 10,149 9.80
LAD 49,764 0.31 $ 102,186 $ 0.63 $ 10,149 10.07
LEC 43,290 0.27 $ 84,476 $ 0.52 $ 10,149 8.32
LFC 49,101 0.30 $ 96,072 $ 0.59 $ 10,149 9.47
LFD 61,260 0.38 $ 118,473 $ 0.73 $ 10,149 11.67
SXX Average 8,341 0.53 $ 16,495 $ 1.04 $ 5,075 3.25
MXX Average 34,150 0.57 $ 67,751 $ 1.14 $ 10,149 6.68
LXX Average 50,102 0.31 $ 100,130 $ 0.62 $ 10,149 9.87
XAX Average 30,231 0.47 $ 62,563 $ 0.96 $ 8,458 7.40
XEX Average 26,472 0.39 $ 51,063 $ 0.75 $ 8,458 6.04
XFX Average 33,694 0.51 $ 65,552 $ 1.00 $ 8,458 7.75
ALL Average 30,864 0.47 $ 61,459 $ 0.93 $ 8,458 7.27
CTZ13 Fresno - Floating Suction Pressure
Energy Savings
(kWh)
Energy Savings/
SF (kWh)
TDV Cost
Savings ($)
TDV Cost
Savings /SF ($)
Measure
Cost ($)
Benefit/
Cost Ratio
SAC 7,695 0.49 $ 15,503 $ 0.98 $ 5,075 3.05
SAD 10,030 0.63 $ 20,816 $ 1.31 $ 5,075 4.10
SEC 6,701 0.42 $ 12,709 $ 0.80 $ 5,075 2.50
SFC 7,564 0.48 $ 14,676 $ 0.93 $ 5,075 2.89
SFD 10,934 0.69 $ 21,199 $ 1.34 $ 5,075 4.18
MAC 34,787 0.58 $ 69,791 $ 1.17 $ 10,149 6.88
MAD 36,698 0.62 $ 77,160 $ 1.30 $ 10,149 7.60
MEC 30,171 0.51 $ 56,780 $ 0.95 $ 10,149 5.59
MFC 35,121 0.59 $ 67,744 $ 1.14 $ 10,149 6.67
MFD 40,050 0.67 $ 79,287 $ 1.33 $ 10,149 7.81
LAC 50,609 0.31 $ 105,799 $ 0.65 $ 10,149 10.42
LAD 52,149 0.32 $ 107,597 $ 0.66 $ 10,149 10.60
LEC 44,138 0.27 $ 85,740 $ 0.53 $ 10,149 8.45
LFC 50,116 0.31 $ 98,235 $ 0.61 $ 10,149 9.68
LFD 62,267 0.38 $ 120,350 $ 0.74 $ 10,149 11.86
SXX Average 8,585 0.54 $ 16,981 $ 1.07 $ 5,075 3.35
MXX Average 35,365 0.59 $ 70,153 $ 1.18 $ 10,149 6.91
LXX Average 51,856 0.32 $ 103,544 $ 0.64 $ 10,149 10.20
XAX Average 31,995 0.49 $ 66,111 $ 1.01 $ 8,458 7.82
XEX Average 27,003 0.40 $ 51,743 $ 0.76 $ 8,458 6.12
XFX Average 34,342 0.52 $ 66,915 $ 1.01 $ 8,458 7.91
ALL Average 31,935 0.49 $ 63,559 $ 0.96 $ 8,458 7.51
CTZ14 Palmdale - Floating Suction Pressure
Energy Savings
(kWh)
Energy Savings/
SF (kWh)
TDV Cost
Savings ($)
TDV Cost
Savings /SF ($)
Measure
Cost ($)
Benefit/
Cost Ratio
SAC 7,448 0.47 $ 14,782 $ 0.93 $ 5,075 2.91
SAD 9,854 0.62 $ 20,149 $ 1.27 $ 5,075 3.97
SEC 6,458 0.41 $ 12,317 $ 0.78 $ 5,075 2.43
SFC 7,179 0.45 $ 13,839 $ 0.87 $ 5,075 2.73
SFD 10,410 0.66 $ 20,229 $ 1.28 $ 5,075 3.99
MAC 35,043 0.59 $ 70,049 $ 1.18 $ 10,149 6.90
MAD 35,878 0.60 $ 74,535 $ 1.25 $ 10,149 7.34
MEC 29,774 0.50 $ 56,557 $ 0.95 $ 10,149 5.57
MFC 34,398 0.58 $ 65,635 $ 1.10 $ 10,149 6.47
MFD 38,051 0.64 $ 74,366 $ 1.25 $ 10,149 7.33
LAC 50,225 0.31 $ 104,180 $ 0.64 $ 10,149 10.27
LAD 51,550 0.32 $ 105,381 $ 0.65 $ 10,149 10.38
LEC 43,079 0.27 $ 83,790 $ 0.52 $ 10,149 8.26
LFC 48,925 0.30 $ 95,182 $ 0.59 $ 10,149 9.38
LFD 61,025 0.38 $ 117,235 $ 0.72 $ 10,149 11.55
SXX Average 8,270 0.52 $ 16,263 $ 1.03 $ 5,075 3.20
MXX Average 34,629 0.58 $ 68,228 $ 1.15 $ 10,149 6.72
LXX Average 50,961 0.31 $ 101,154 $ 0.62 $ 10,149 9.97
XAX Average 31,666 0.49 $ 64,846 $ 0.99 $ 8,458 7.67
XEX Average 26,437 0.39 $ 50,888 $ 0.75 $ 8,458 6.02
XFX Average 33,331 0.50 $ 64,414 $ 0.97 $ 8,458 7.62
ALL Average 31,286 0.47 $ 61,882 $ 0.93 $ 8,458 7.32
CTZ15 Palm Springs - Floating Suction Pressure
Energy Savings
(kWh)
Energy Savings/
SF (kWh)
TDV Cost
Savings ($)
TDV Cost
Savings /SF ($)
Measure
Cost ($)
Benefit/
Cost Ratio
SAC 8,711 0.55 $ 17,657 $ 1.11 $ 5,075 3.48
SAD 11,721 0.74 $ 24,697 $ 1.56 $ 5,075 4.87
SEC 6,863 0.43 $ 13,118 $ 0.83 $ 5,075 2.58
SFC 7,786 0.49 $ 15,192 $ 0.96 $ 5,075 2.99
SFD 11,259 0.71 $ 21,938 $ 1.38 $ 5,075 4.32

Measure Information Template Page 132
2013 California Building Energy Efficiency Standards September 2011
MAC 39,089 0.66 $ 77,943 $ 1.31 $ 10,149 7.68
MAD 43,925 0.74 $ 94,541 $ 1.59 $ 10,149 9.32
MEC 31,226 0.52 $ 57,946 $ 0.97 $ 10,149 5.71
MFC 36,768 0.62 $ 69,969 $ 1.17 $ 10,149 6.89
MFD 42,564 0.71 $ 83,746 $ 1.41 $ 10,149 8.25
LAC 60,618 0.37 $ 121,312 $ 0.75 $ 10,149 11.95
LAD 60,881 0.38 $ 129,036 $ 0.80 $ 10,149 12.71
LEC 46,544 0.29 $ 89,958 $ 0.55 $ 10,149 8.86
LFC 53,662 0.33 $ 105,150 $ 0.65 $ 10,149 10.36
LFD 65,726 0.41 $ 127,728 $ 0.79 $ 10,149 12.59
SXX Average 9,268 0.58 $ 18,520 $ 1.17 $ 5,075 3.65
MXX Average 38,714 0.65 $ 76,829 $ 1.29 $ 10,149 7.57
LXX Average 57,486 0.35 $ 114,637 $ 0.71 $ 10,149 11.30
XAX Average 37,491 0.57 $ 77,531 $ 1.19 $ 8,458 9.17
XEX Average 28,211 0.41 $ 53,674 $ 0.79 $ 8,458 6.35
XFX Average 36,294 0.55 $ 70,620 $ 1.06 $ 8,458 8.35
ALL Average 35,156 0.53 $ 69,995 $ 1.06 $ 8,458 8.28

Measure Information Template Page 133
2013 California Building Energy Efficiency Standards September 2011
14.4 Mechanical Subcooling CTZ01 Arcata - Mechanical Subcooling
Energy Savings
(kWh)
Energy Savings/
SF (kWh)
TDV Cost
Savings ($)
TDV Cost
Savings /SF ($)
Measure
Cost ($)
Benefit/
Cost Ratio
SAC 6,566 0.41 $ 12,397 $ 0.78 $ 4,645 2.67
SAD 4,207 0.27 $ 7,645 $ 0.48 $ 4,220 1.81
SEC 6,985 0.44 $ 13,127 $ 0.83 $ 4,645 2.83
SFC 10,793 0.68 $ 20,460 $ 1.29 $ 4,645 4.40
SFD 12,126 0.77 $ 23,148 $ 1.46 $ 4,220 5.49
MAC 14,708 0.25 $ 26,984 $ 0.45 $ 8,582 3.14
MAD 11,593 0.19 $ 21,680 $ 0.36 $ 7,059 3.07
MEC 16,719 0.28 $ 31,718 $ 0.53 $ 8,582 3.70
MFC 29,680 0.50 $ 55,952 $ 0.94 $ 8,582 6.52
MFD 34,527 0.58 $ 65,653 $ 1.10 $ 7,059 9.30
LAC 52,771 0.33 $ 100,994 $ 0.62 $ 15,793 6.39
LAD 22,368 0.14 $ 41,357 $ 0.26 $ 11,863 3.49
LEC 51,627 0.32 $ 98,466 $ 0.61 $ 15,793 6.23
LFC 86,561 0.53 $ 165,401 $ 1.02 $ 15,793 10.47
LFD 71,323 0.44 $ 135,044 $ 0.83 $ 11,863 11.38
SXX Average 8,135 0.51 $ 15,356 $ 0.97 $ 4,475 3.43
MXX Average 21,445 0.36 $ 40,397 $ 0.68 $ 7,973 5.07
LXX Average 56,930 0.35 $ 108,252 $ 0.67 $ 14,221 7.61
XAX Average 18,702 0.26 $ 35,176 $ 0.49 $ 8,694 4.05
XEX Average 25,110 0.35 $ 47,771 $ 0.66 $ 9,673 4.94
XFX Average 40,835 0.58 $ 77,610 $ 1.11 $ 8,694 8.93
ALL Average 28,837 0.41 $ 54,668 $ 0.77 $ 8,890 6.15
CTZ03 Oakland - Mechanical Subcooling
Energy Savings
(kWh)
Energy Savings/
SF (kWh)
TDV Cost
Savings ($)
TDV Cost
Savings /SF ($)
Measure
Cost ($)
Benefit/
Cost Ratio
SAC 6,523 0.41 $ 12,727 $ 0.80 $ 4,645 2.74
SAD 4,199 0.26 $ 8,837 $ 0.56 $ 4,220 2.09
SEC 7,098 0.45 $ 13,314 $ 0.84 $ 4,645 2.87
SFC 10,958 0.69 $ 20,825 $ 1.31 $ 4,645 4.48
SFD 12,413 0.78 $ 23,638 $ 1.49 $ 4,220 5.60
MAC 14,559 0.24 $ 28,337 $ 0.48 $ 8,582 3.30
MAD 12,104 0.20 $ 26,441 $ 0.44 $ 7,059 3.75
MEC 17,456 0.29 $ 33,748 $ 0.57 $ 8,582 3.93
MFC 30,339 0.51 $ 57,358 $ 0.96 $ 8,582 6.68
MFD 36,299 0.61 $ 69,862 $ 1.17 $ 7,059 9.90
LAC 55,131 0.34 $ 115,589 $ 0.71 $ 15,793 7.32
LAD 22,838 0.14 $ 49,998 $ 0.31 $ 11,863 4.21
LEC 53,160 0.33 $ 102,257 $ 0.63 $ 15,793 6.47
LFC 89,317 0.55 $ 172,387 $ 1.06 $ 15,793 10.92
LFD 73,635 0.45 $ 141,692 $ 0.87 $ 11,863 11.94
SXX Average 8,238 0.52 $ 15,868 $ 1.00 $ 4,475 3.55
MXX Average 22,151 0.37 $ 43,149 $ 0.72 $ 7,973 5.41
LXX Average 58,816 0.36 $ 116,385 $ 0.72 $ 14,221 8.18
XAX Average 19,226 0.27 $ 40,321 $ 0.55 $ 8,694 4.64
XEX Average 25,905 0.36 $ 49,773 $ 0.68 $ 9,673 5.15
XFX Average 42,160 0.60 $ 80,960 $ 1.15 $ 8,694 9.31
ALL Average 29,735 0.42 $ 58,467 $ 0.81 $ 8,890 6.58
CTZ05 Santa Maria - Mechanical Subcooling
Energy Savings
(kWh)
Energy Savings/
SF (kWh)
TDV Cost
Savings ($)
TDV Cost
Savings /SF ($)
Measure
Cost ($)
Benefit/
Cost Ratio
SAC 6,554 0.41 $ 12,540 $ 0.79 $ 4,645 2.70
SAD 4,198 0.26 $ 8,312 $ 0.52 $ 4,220 1.97
SEC 7,084 0.45 $ 13,376 $ 0.84 $ 4,645 2.88
SFC 10,899 0.69 $ 20,674 $ 1.30 $ 4,645 4.45
SFD 12,339 0.78 $ 23,513 $ 1.48 $ 4,220 5.57
MAC 14,448 0.24 $ 26,806 $ 0.45 $ 8,582 3.12
MAD 12,002 0.20 $ 24,519 $ 0.41 $ 7,059 3.47
MEC 17,255 0.29 $ 33,071 $ 0.56 $ 8,582 3.85
MFC 30,152 0.51 $ 56,878 $ 0.95 $ 8,582 6.63
MFD 35,717 0.60 $ 68,314 $ 1.15 $ 7,059 9.68
LAC 54,855 0.34 $ 111,789 $ 0.69 $ 15,793 7.08
LAD 22,693 0.14 $ 45,691 $ 0.28 $ 11,863 3.85
LEC 52,757 0.33 $ 101,750 $ 0.63 $ 15,793 6.44
LFC 88,876 0.55 $ 171,719 $ 1.06 $ 15,793 10.87
LFD 73,150 0.45 $ 140,775 $ 0.87 $ 11,863 11.87
SXX Average 8,215 0.52 $ 15,683 $ 0.99 $ 4,475 3.50
MXX Average 21,915 0.37 $ 41,917 $ 0.70 $ 7,973 5.26
LXX Average 58,466 0.36 $ 114,345 $ 0.71 $ 14,221 8.04
XAX Average 19,125 0.27 $ 38,276 $ 0.52 $ 8,694 4.40
XEX Average 25,699 0.35 $ 49,399 $ 0.68 $ 9,673 5.11
XFX Average 41,856 0.60 $ 80,312 $ 1.14 $ 8,694 9.24
ALL Average 29,532 0.42 $ 57,315 $ 0.80 $ 8,890 6.45

Measure Information Template Page 134
2013 California Building Energy Efficiency Standards September 2011
CTZ07 San Diego-Lindbergh - Mechanical Subcooling
Energy Savings
(kWh)
Energy Savings/
SF (kWh)
TDV Cost
Savings ($)
TDV Cost
Savings /SF ($)
Measure
Cost ($)
Benefit/
Cost Ratio
SAC 6,509 0.41 $ 12,762 $ 0.81 $ 4,645 2.75
SAD 4,006 0.25 $ 8,330 $ 0.53 $ 4,220 1.97
SEC 7,395 0.47 $ 14,124 $ 0.89 $ 4,645 3.04
SFC 11,362 0.72 $ 21,973 $ 1.39 $ 4,645 4.73
SFD 13,094 0.83 $ 25,409 $ 1.60 $ 4,220 6.02
MAC 14,783 0.25 $ 29,049 $ 0.49 $ 8,582 3.38
MAD 12,211 0.21 $ 25,978 $ 0.44 $ 7,059 3.68
MEC 19,416 0.33 $ 37,984 $ 0.64 $ 8,582 4.43
MFC 32,131 0.54 $ 63,517 $ 1.07 $ 8,582 7.40
MFD 40,752 0.68 $ 82,731 $ 1.39 $ 7,059 11.72
LAC 56,998 0.35 $ 119,256 $ 0.74 $ 15,793 7.55
LAD 22,716 0.14 $ 48,966 $ 0.30 $ 11,863 4.13
LEC 55,564 0.34 $ 108,523 $ 0.67 $ 15,793 6.87
LFC 93,715 0.58 $ 183,298 $ 1.13 $ 15,793 11.61
LFD 77,240 0.48 $ 150,698 $ 0.93 $ 11,863 12.70
SXX Average 8,473 0.53 $ 16,520 $ 1.04 $ 4,475 3.69
MXX Average 23,859 0.40 $ 47,852 $ 0.80 $ 7,973 6.00
LXX Average 61,247 0.38 $ 122,148 $ 0.75 $ 14,221 8.59
XAX Average 19,537 0.27 $ 40,723 $ 0.55 $ 8,694 4.68
XEX Average 27,458 0.38 $ 53,543 $ 0.73 $ 9,673 5.54
XFX Average 44,716 0.64 $ 87,938 $ 1.25 $ 8,694 10.12
ALL Average 31,193 0.44 $ 62,173 $ 0.87 $ 8,890 6.99
CTZ08 Fullerton - Mechanical Subcooling
Energy Savings
(kWh)
Energy Savings/
SF (kWh)
TDV Cost
Savings ($)
TDV Cost
Savings /SF ($)
Measure
Cost ($)
Benefit/
Cost Ratio
SAC 7,575 0.48 $ 16,892 $ 1.07 $ 4,645 3.64
SAD 6,002 0.38 $ 17,888 $ 1.13 $ 4,220 4.24
SEC 7,111 0.45 $ 13,652 $ 0.86 $ 4,645 2.94
SFC 11,049 0.70 $ 21,066 $ 1.33 $ 4,645 4.54
SFD 12,550 0.79 $ 24,296 $ 1.53 $ 4,220 5.76
MAC 20,276 0.34 $ 38,812 $ 0.65 $ 8,582 4.52
MAD 14,557 0.24 $ 37,103 $ 0.62 $ 7,059 5.26
MEC 18,899 0.32 $ 36,987 $ 0.62 $ 8,582 4.31
MFC 31,822 0.53 $ 61,986 $ 1.04 $ 8,582 7.22
MFD 39,686 0.67 $ 79,910 $ 1.34 $ 7,059 11.32
LAC 64,368 0.40 $ 144,219 $ 0.89 $ 15,793 9.13
LAD 26,880 0.17 $ 70,583 $ 0.44 $ 11,863 5.95
LEC 55,074 0.34 $ 106,307 $ 0.66 $ 15,793 6.73
LFC 92,879 0.57 $ 178,403 $ 1.10 $ 15,793 11.30
LFD 76,655 0.47 $ 147,174 $ 0.91 $ 11,863 12.41
SXX Average 8,857 0.56 $ 18,759 $ 1.18 $ 4,475 4.19
MXX Average 25,048 0.42 $ 50,960 $ 0.86 $ 7,973 6.39
LXX Average 63,171 0.39 $ 129,337 $ 0.80 $ 14,221 9.09
XAX Average 23,276 0.33 $ 54,249 $ 0.80 $ 8,694 6.24
XEX Average 27,028 0.37 $ 52,315 $ 0.71 $ 9,673 5.41
XFX Average 44,107 0.62 $ 85,473 $ 1.21 $ 8,694 9.83
ALL Average 32,359 0.46 $ 66,352 $ 0.95 $ 8,890 7.46
CTZ10 Riverside - Mechanical Subcooling
Energy Savings
(kWh)
Energy Savings/
SF (kWh)
TDV Cost
Savings ($)
TDV Cost
Savings /SF ($)
Measure
Cost ($)
Benefit/
Cost Ratio
SAC 7,724 0.49 $ 17,078 $ 1.08 $ 4,645 3.68
SAD 6,304 0.40 $ 18,885 $ 1.19 $ 4,220 4.48
SEC 7,194 0.45 $ 13,706 $ 0.86 $ 4,645 2.95
SFC 11,185 0.71 $ 21,306 $ 1.34 $ 4,645 4.59
SFD 12,802 0.81 $ 24,759 $ 1.56 $ 4,220 5.87
MAC 21,442 0.36 $ 46,180 $ 0.78 $ 8,582 5.38
MAD 19,840 0.33 $ 59,841 $ 1.00 $ 7,059 8.48
MEC 18,785 0.32 $ 37,058 $ 0.62 $ 8,582 4.32
MFC 31,824 0.53 $ 62,778 $ 1.05 $ 8,582 7.32
MFD 39,417 0.66 $ 81,227 $ 1.36 $ 7,059 11.51
LAC 74,176 0.46 $ 181,153 $ 1.12 $ 15,793 11.47
LAD 37,523 0.23 $ 118,846 $ 0.73 $ 11,863 10.02
LEC 55,066 0.34 $ 107,117 $ 0.66 $ 15,793 6.78
LFC 92,379 0.57 $ 178,020 $ 1.10 $ 15,793 11.27
LFD 76,380 0.47 $ 146,943 $ 0.91 $ 11,863 12.39
SXX Average 9,042 0.57 $ 19,147 $ 1.21 $ 4,475 4.28
MXX Average 26,262 0.44 $ 57,417 $ 0.96 $ 7,973 7.20
LXX Average 67,105 0.41 $ 146,416 $ 0.90 $ 14,221 10.30
XAX Average 27,835 0.38 $ 73,664 $ 0.98 $ 8,694 8.47
XEX Average 27,015 0.37 $ 52,627 $ 0.72 $ 9,673 5.44
XFX Average 43,998 0.63 $ 85,839 $ 1.22 $ 8,694 9.87
ALL Average 34,136 0.48 $ 74,327 $ 1.03 $ 8,890 8.36
CTZ12 Sacramento - Mechanical Subcooling
Energy Savings
(kWh)
Energy Savings/
SF (kWh)
TDV Cost
Savings ($)
TDV Cost
Savings /SF ($)
Measure
Cost ($)
Benefit/
Cost Ratio
SAC 7,575 0.48 $ 16,892 $ 1.07 $ 4,645 3.64

Measure Information Template Page 135
2013 California Building Energy Efficiency Standards September 2011
SAD 6,002 0.38 $ 17,888 $ 1.13 $ 4,220 4.24
SEC 7,111 0.45 $ 13,652 $ 0.86 $ 4,645 2.94
SFC 11,049 0.70 $ 21,066 $ 1.33 $ 4,645 4.54
SFD 12,550 0.79 $ 24,296 $ 1.53 $ 4,220 5.76
MAC 21,266 0.36 $ 45,922 $ 0.77 $ 8,582 5.35
MAD 18,534 0.31 $ 56,121 $ 0.94 $ 7,059 7.95
MEC 18,145 0.30 $ 36,079 $ 0.61 $ 8,582 4.20
MFC 31,189 0.52 $ 61,417 $ 1.03 $ 8,582 7.16
MFD 37,711 0.63 $ 77,116 $ 1.29 $ 7,059 10.92
LAC 70,764 0.44 $ 173,250 $ 1.07 $ 15,793 10.97
LAD 35,105 0.22 $ 110,712 $ 0.68 $ 11,863 9.33
LEC 54,164 0.33 $ 105,532 $ 0.65 $ 15,793 6.68
LFC 90,663 0.56 $ 175,582 $ 1.08 $ 15,793 11.12
LFD 75,201 0.46 $ 145,599 $ 0.90 $ 11,863 12.27
SXX Average 8,857 0.56 $ 18,759 $ 1.18 $ 4,475 4.19
MXX Average 25,369 0.43 $ 55,331 $ 0.93 $ 7,973 6.94
LXX Average 65,179 0.40 $ 142,135 $ 0.88 $ 14,221 9.99
XAX Average 26,541 0.36 $ 70,131 $ 0.94 $ 8,694 8.07
XEX Average 26,473 0.36 $ 51,755 $ 0.71 $ 9,673 5.35
XFX Average 43,061 0.61 $ 84,179 $ 1.19 $ 8,694 9.68
ALL Average 33,135 0.46 $ 72,075 $ 1.00 $ 8,890 8.11
CTZ13 Fresno - Mechanical Subcooling
Energy Savings
(kWh)
Energy Savings/
SF (kWh)
TDV Cost
Savings ($)
TDV Cost
Savings /SF ($)
Measure
Cost ($)
Benefit/
Cost Ratio
SAC 8,311 0.52 $ 18,627 $ 1.18 $ 4,645 4.01
SAD 7,562 0.48 $ 21,706 $ 1.37 $ 4,220 5.14
SEC 7,222 0.46 $ 13,901 $ 0.88 $ 4,645 2.99
SFC 11,149 0.70 $ 21,430 $ 1.35 $ 4,645 4.61
SFD 12,752 0.80 $ 24,875 $ 1.57 $ 4,220 5.89
MAC 22,839 0.38 $ 49,589 $ 0.83 $ 8,582 5.78
MAD 23,817 0.40 $ 68,964 $ 1.16 $ 7,059 9.77
MEC 18,827 0.32 $ 37,441 $ 0.63 $ 8,582 4.36
MFC 31,682 0.53 $ 63,259 $ 1.06 $ 8,582 7.37
MFD 39,135 0.66 $ 81,681 $ 1.37 $ 7,059 11.57
LAC 80,713 0.50 $ 194,956 $ 1.20 $ 15,793 12.34
LAD 45,479 0.28 $ 137,411 $ 0.85 $ 11,863 11.58
LEC 55,170 0.34 $ 108,087 $ 0.67 $ 15,793 6.84
LFC 92,151 0.57 $ 179,337 $ 1.11 $ 15,793 11.36
LFD 76,322 0.47 $ 148,162 $ 0.91 $ 11,863 12.49
SXX Average 9,399 0.59 $ 20,108 $ 1.27 $ 4,475 4.49
MXX Average 27,260 0.46 $ 60,187 $ 1.01 $ 7,973 7.55
LXX Average 69,967 0.43 $ 153,591 $ 0.95 $ 14,221 10.80
XAX Average 31,454 0.43 $ 81,876 $ 1.10 $ 8,694 9.42
XEX Average 27,073 0.37 $ 53,143 $ 0.72 $ 9,673 5.49
XFX Average 43,865 0.62 $ 86,457 $ 1.23 $ 8,694 9.94
ALL Average 35,542 0.49 $ 77,962 $ 1.08 $ 8,890 8.77
CTZ14 Palmdale - Mechanical Subcooling
Energy Savings
(kWh)
Energy Savings/
SF (kWh)
TDV Cost
Savings ($)
TDV Cost
Savings /SF ($)
Measure
Cost ($)
Benefit/
Cost Ratio
SAC 8,239 0.52 $ 18,253 $ 1.15 $ 4,645 3.93
SAD 7,700 0.49 $ 21,422 $ 1.35 $ 4,220 5.08
SEC 7,050 0.44 $ 13,412 $ 0.85 $ 4,645 2.89
SFC 10,975 0.69 $ 20,710 $ 1.31 $ 4,645 4.46
SFD 12,378 0.78 $ 23,718 $ 1.50 $ 4,220 5.62
MAC 22,421 0.38 $ 47,907 $ 0.80 $ 8,582 5.58
MAD 23,996 0.40 $ 67,682 $ 1.14 $ 7,059 9.59
MEC 17,982 0.30 $ 35,278 $ 0.59 $ 8,582 4.11
MFC 30,875 0.52 $ 59,761 $ 1.00 $ 8,582 6.96
MFD 36,629 0.62 $ 73,538 $ 1.23 $ 7,059 10.42
LAC 80,738 0.50 $ 192,571 $ 1.19 $ 15,793 12.19
LAD 45,738 0.28 $ 133,718 $ 0.82 $ 11,863 11.27
LEC 53,985 0.33 $ 104,500 $ 0.64 $ 15,793 6.62
LFC 90,286 0.56 $ 173,998 $ 1.07 $ 15,793 11.02
LFD 74,860 0.46 $ 144,059 $ 0.89 $ 11,863 12.14
SXX Average 9,268 0.58 $ 19,503 $ 1.23 $ 4,475 4.36
MXX Average 26,381 0.44 $ 56,833 $ 0.95 $ 7,973 7.13
LXX Average 69,121 0.43 $ 149,769 $ 0.92 $ 14,221 10.53
XAX Average 31,472 0.43 $ 80,259 $ 1.08 $ 8,694 9.23
XEX Average 26,339 0.36 $ 51,063 $ 0.69 $ 9,673 5.28
XFX Average 42,667 0.60 $ 82,631 $ 1.17 $ 8,694 9.50
ALL Average 34,923 0.48 $ 75,368 $ 1.04 $ 8,890 8.48
CTZ15 Palm Springs - Mechanical Subcooling
Energy Savings
(kWh)
Energy Savings/
SF (kWh)
TDV Cost
Savings ($)
TDV Cost
Savings /SF ($)
Measure
Cost ($)
Benefit/
Cost Ratio
SAC 11,443 0.72 $ 26,227 $ 1.65 $ 4,645 5.65
SAD 13,824 0.87 $ 37,103 $ 2.34 $ 4,220 8.79
SEC 7,653 0.48 $ 15,121 $ 0.95 $ 4,645 3.26
SFC 11,638 0.73 $ 22,837 $ 1.44 $ 4,645 4.92
SFD 13,595 0.86 $ 27,358 $ 1.73 $ 4,220 6.48

Measure Information Template Page 136
2013 California Building Energy Efficiency Standards September 2011
MAC 28,508 0.48 $ 66,570 $ 1.12 $ 8,582 7.76
MAD 45,203 0.76 $ 121,748 $ 2.04 $ 7,059 17.25
MEC 20,984 0.35 $ 42,416 $ 0.71 $ 8,582 4.94
MFC 34,858 0.59 $ 71,687 $ 1.20 $ 8,582 8.35
MFD 46,162 0.78 $ 100,424 $ 1.69 $ 7,059 14.23
LAC 114,292 0.71 $ 259,844 $ 1.60 $ 15,793 16.45
LAD 88,620 0.55 $ 247,358 $ 1.53 $ 11,863 20.85
LEC 59,231 0.37 $ 117,974 $ 0.73 $ 15,793 7.47
LFC 98,320 0.61 $ 193,363 $ 1.19 $ 15,793 12.24
LFD 81,968 0.51 $ 165,036 $ 1.02 $ 11,863 13.91
SXX Average 11,631 0.73 $ 25,729 $ 1.62 $ 4,475 5.75
MXX Average 35,143 0.59 $ 80,569 $ 1.35 $ 7,973 10.11
LXX Average 88,486 0.55 $ 196,715 $ 1.21 $ 14,221 13.83
XAX Average 50,315 0.68 $ 126,475 $ 1.71 $ 8,694 14.55
XEX Average 29,289 0.40 $ 58,504 $ 0.80 $ 9,673 6.05
XFX Average 47,757 0.68 $ 96,784 $ 1.38 $ 8,694 11.13
ALL Average 45,087 0.62 $ 101,004 $ 1.40 $ 8,890 11.36

Measure Information Template Page 137
2013 California Building Energy Efficiency Standards September 2011
14.5 Display Case Lighting Control CTZ01 Arcata - Display Case Lighting Control
Energy Savings
(kWh)
Energy Savings/
SF (kWh)
TDV Cost
Savings ($)
TDV Cost
Savings /SF ($)
Measure
Cost ($)
Benefit/
Cost Ratio
SAC 48,247 3.04 $ 67,201 $ 4.24 $ 5,588 12.03
SAD 48,173 3.04 $ 67,175 $ 4.24 $ 5,588 12.02
SEC 47,749 3.01 $ 66,463 $ 4.19 $ 5,588 11.89
SFC 49,505 3.12 $ 69,186 $ 4.37 $ 5,588 12.38
SFD 49,713 3.14 $ 69,471 $ 4.38 $ 5,588 12.43
MAC 145,011 2.43 $ 215,710 $ 3.62 $ 11,321 19.05
MAD 144,551 2.43 $ 214,998 $ 3.61 $ 11,321 18.99
MEC 143,703 2.41 $ 214,162 $ 3.60 $ 11,321 18.92
MFC 151,100 2.54 $ 225,625 $ 3.79 $ 11,321 19.93
MFD 151,691 2.55 $ 226,524 $ 3.80 $ 11,321 20.01
LAC 166,882 1.03 $ 255,305 $ 1.57 $ 12,659 20.17
LAD 165,787 1.02 $ 253,151 $ 1.56 $ 12,659 20.00
LEC 164,603 1.02 $ 251,576 $ 1.55 $ 12,659 19.87
LFC 173,941 1.07 $ 266,892 $ 1.65 $ 12,659 21.08
LFD 175,738 1.08 $ 270,025 $ 1.67 $ 12,659 21.33
SXX Average 48,677 3.07 $ 67,899 $ 4.28 $ 5,588 12.15
MXX Average 147,211 2.47 $ 219,404 $ 3.68 $ 11,321 19.38
LXX Average 169,390 1.04 $ 259,390 $ 1.60 $ 12,659 20.49
XAX Average 119,775 2.17 $ 178,924 $ 3.14 $ 9,856 18.15
XEX Average 118,685 2.15 $ 177,400 $ 3.11 $ 9,856 18.00
XFX Average 125,281 2.25 $ 187,954 $ 3.28 $ 9,856 19.07
ALL Average 121,760 2.20 $ 182,231 $ 3.19 $ 9,856 18.49
CTZ03 Oakland - Display Case Lighting Control
Energy Savings
(kWh)
Energy Savings/
SF (kWh)
TDV Cost
Savings ($)
TDV Cost
Savings /SF ($)
Measure
Cost ($)
Benefit/
Cost Ratio
SAC 48,478 3.06 $ 67,148 $ 4.24 $ 5,588 12.02
SAD 48,387 3.05 $ 66,997 $ 4.23 $ 5,588 11.99
SEC 47,903 3.02 $ 66,267 $ 4.18 $ 5,588 11.86
SFC 49,770 3.14 $ 69,142 $ 4.36 $ 5,588 12.37
SFD 50,005 3.16 $ 69,435 $ 4.38 $ 5,588 12.42
MAC 144,766 2.43 $ 210,976 $ 3.54 $ 11,321 18.64
MAD 144,416 2.42 $ 210,335 $ 3.53 $ 11,321 18.58
MEC 145,146 2.44 $ 211,901 $ 3.56 $ 11,321 18.72
MFC 153,060 2.57 $ 224,121 $ 3.76 $ 11,321 19.80
MFD 154,059 2.59 $ 225,607 $ 3.79 $ 11,321 19.93
LAC 168,325 1.04 $ 256,756 $ 1.58 $ 12,659 20.28
LAD 167,104 1.03 $ 253,561 $ 1.56 $ 12,659 20.03
LEC 165,697 1.02 $ 252,724 $ 1.56 $ 12,659 19.96
LFC 174,575 1.08 $ 267,106 $ 1.65 $ 12,659 21.10
LFD 176,197 1.09 $ 269,740 $ 1.66 $ 12,659 21.31
SXX Average 48,909 3.09 $ 67,798 $ 4.28 $ 5,588 12.13
MXX Average 148,289 2.49 $ 216,588 $ 3.64 $ 11,321 19.13
LXX Average 170,380 1.05 $ 259,977 $ 1.60 $ 12,659 20.54
XAX Average 120,246 2.17 $ 177,629 $ 3.11 $ 9,856 18.02
XEX Average 119,582 2.16 $ 176,964 $ 3.10 $ 9,856 17.95
XFX Average 126,278 2.27 $ 187,525 $ 3.27 $ 9,856 19.03
ALL Average 122,526 2.21 $ 181,454 $ 3.17 $ 9,856 18.41
CTZ05 Santa Maria - Display Case Lighting Control
Energy Savings
(kWh)
Energy Savings/
SF (kWh)
TDV Cost
Savings ($)
TDV Cost
Savings /SF ($)
Measure
Cost ($)
Benefit/
Cost Ratio
SAC 48,363 3.05 $ 67,371 $ 4.25 $ 5,588 12.06
SAD 48,282 3.05 $ 67,237 $ 4.24 $ 5,588 12.03
SEC 47,855 3.02 $ 66,632 $ 4.20 $ 5,588 11.92
SFC 49,597 3.13 $ 69,320 $ 4.37 $ 5,588 12.40
SFD 49,808 3.14 $ 69,604 $ 4.39 $ 5,588 12.46
MAC 144,566 2.43 $ 212,293 $ 3.56 $ 11,321 18.75
MAD 144,238 2.42 $ 211,661 $ 3.55 $ 11,321 18.70
MEC 143,824 2.41 $ 211,528 $ 3.55 $ 11,321 18.68
MFC 151,503 2.54 $ 223,515 $ 3.75 $ 11,321 19.74
MFD 152,336 2.56 $ 224,735 $ 3.77 $ 11,321 19.85
LAC 167,808 1.04 $ 259,328 $ 1.60 $ 12,659 20.49
LAD 166,453 1.03 $ 255,172 $ 1.57 $ 12,659 20.16
LEC 165,249 1.02 $ 254,789 $ 1.57 $ 12,659 20.13
LFC 174,331 1.08 $ 269,438 $ 1.66 $ 12,659 21.28
LFD 176,028 1.09 $ 272,446 $ 1.68 $ 12,659 21.52
SXX Average 48,781 3.08 $ 68,033 $ 4.29 $ 5,588 12.17
MXX Average 147,293 2.47 $ 216,746 $ 3.64 $ 11,321 19.15
LXX Average 169,974 1.05 $ 262,234 $ 1.62 $ 12,659 20.72
XAX Average 119,952 2.17 $ 178,844 $ 3.13 $ 9,856 18.15
XEX Average 118,976 2.15 $ 177,649 $ 3.11 $ 9,856 18.02
XFX Average 125,601 2.26 $ 188,176 $ 3.27 $ 9,856 19.09
CTZ07 San Diego-Lindbergh - Display Case Lighting Control

Measure Information Template Page 138
2013 California Building Energy Efficiency Standards September 2011
Energy Savings
(kWh)
Energy Savings/
SF (kWh)
TDV Cost
Savings ($)
TDV Cost
Savings /SF ($)
Measure
Cost ($)
Benefit/
Cost Ratio
SAC 48,955 3.09 $ 68,688 $ 4.33 $ 5,588 12.29
SAD 48,854 3.08 $ 68,474 $ 4.32 $ 5,588 12.25
SEC 49,380 3.12 $ 69,311 $ 4.37 $ 5,588 12.40
SFC 51,078 3.22 $ 71,945 $ 4.54 $ 5,588 12.87
SFD 51,449 3.25 $ 72,506 $ 4.57 $ 5,588 12.97
MAC 145,539 2.44 $ 214,269 $ 3.60 $ 11,321 18.93
MAD 145,514 2.44 $ 213,984 $ 3.59 $ 11,321 18.90
MEC 150,777 2.53 $ 222,341 $ 3.73 $ 11,321 19.64
MFC 157,929 2.65 $ 233,990 $ 3.93 $ 11,321 20.67
MFD 159,203 2.67 $ 236,108 $ 3.96 $ 11,321 20.86
LAC 172,238 1.06 $ 269,714 $ 1.66 $ 12,659 21.31
LAD 170,384 1.05 $ 264,846 $ 1.63 $ 12,659 20.92
LEC 171,257 1.06 $ 268,138 $ 1.65 $ 12,659 21.18
LFC 178,842 1.10 $ 280,803 $ 1.73 $ 12,659 22.18
LFD 179,638 1.11 $ 282,111 $ 1.74 $ 12,659 22.29
SXX Average 49,943 3.15 $ 70,185 $ 4.43 $ 5,588 12.56
MXX Average 151,792 2.55 $ 224,138 $ 3.76 $ 11,321 19.80
LXX Average 174,472 1.08 $ 273,122 $ 1.68 $ 12,659 21.58
XAX Average 121,914 2.20 $ 183,329 $ 3.19 $ 9,856 18.60
XEX Average 123,805 2.23 $ 186,597 $ 3.25 $ 9,856 18.93
XFX Average 129,690 2.33 $ 196,244 $ 3.41 $ 9,856 19.91
ALL Average 125,402 2.26 $ 189,148 $ 3.29 $ 9,856 19.19
CTZ08 Fullerton - Display Case Lighting Control
Energy Savings
(kWh)
Energy Savings/
SF (kWh)
TDV Cost
Savings ($)
TDV Cost
Savings /SF ($)
Measure
Cost ($)
Benefit/
Cost Ratio
SAC 48,999 3.09 $ 68,127 $ 4.30 $ 5,588 12.19
SAD 48,730 3.07 $ 67,833 $ 4.28 $ 5,588 12.14
SEC 48,100 3.03 $ 66,854 $ 4.22 $ 5,588 11.96
SFC 50,099 3.16 $ 69,889 $ 4.41 $ 5,588 12.51
SFD 50,275 3.17 $ 70,147 $ 4.43 $ 5,588 12.55
MAC 147,978 2.48 $ 213,414 $ 3.58 $ 11,321 18.85
MAD 144,180 2.42 $ 207,541 $ 3.48 $ 11,321 18.33
MEC 150,085 2.52 $ 216,511 $ 3.64 $ 11,321 19.12
MFC 155,247 2.61 $ 224,806 $ 3.77 $ 11,321 19.86
MFD 155,247 2.61 $ 224,930 $ 3.78 $ 11,321 19.87
LAC 173,247 1.07 $ 266,723 $ 1.65 $ 12,659 21.07
LAD 169,911 1.05 $ 259,737 $ 1.60 $ 12,659 20.52
LEC 169,042 1.04 $ 258,918 $ 1.60 $ 12,659 20.45
LFC 177,900 1.10 $ 273,727 $ 1.69 $ 12,659 21.62
LFD 179,855 1.11 $ 277,181 $ 1.71 $ 12,659 21.90
SXX Average 49,241 3.11 $ 68,570 $ 4.33 $ 5,588 12.27
MXX Average 150,547 2.53 $ 217,441 $ 3.65 $ 11,321 19.21
LXX Average 173,991 1.07 $ 267,257 $ 1.65 $ 12,659 21.11
XAX Average 122,174 2.20 $ 180,563 $ 3.15 $ 9,856 18.32
XEX Average 122,409 2.20 $ 180,761 $ 3.15 $ 9,856 18.34
XFX Average 128,104 2.29 $ 190,113 $ 3.30 $ 9,856 19.29
ALL Average 124,593 2.24 $ 184,423 $ 3.21 $ 9,856 18.71
CTZ10 Riverside - Display Case Lighting Control
Energy Savings
(kWh)
Energy Savings/
SF (kWh)
TDV Cost
Savings ($)
TDV Cost
Savings /SF ($)
Measure
Cost ($)
Benefit/
Cost Ratio
SAC 49,356 3.11 $ 67,504 $ 4.26 $ 5,588 12.08
SAD 48,999 3.09 $ 67,041 $ 4.23 $ 5,588 12.00
SEC 48,665 3.07 $ 66,454 $ 4.19 $ 5,588 11.89
SFC 50,657 3.20 $ 69,462 $ 4.38 $ 5,588 12.43
SFD 50,892 3.21 $ 69,782 $ 4.40 $ 5,588 12.49
MAC 148,108 2.49 $ 211,706 $ 3.55 $ 11,321 18.70
MAD 144,322 2.42 $ 206,090 $ 3.46 $ 11,321 18.20
MEC 148,244 2.49 $ 211,768 $ 3.56 $ 11,321 18.71
MFC 154,181 2.59 $ 221,139 $ 3.71 $ 11,321 19.53
MFD 154,110 2.59 $ 221,113 $ 3.71 $ 11,321 19.53
LAC 174,292 1.08 $ 264,961 $ 1.63 $ 12,659 20.93
LAD 170,295 1.05 $ 257,753 $ 1.59 $ 12,659 20.36
LEC 168,943 1.04 $ 255,198 $ 1.57 $ 12,659 20.16
LFC 177,961 1.10 $ 270,070 $ 1.67 $ 12,659 21.33
LFD 179,916 1.11 $ 273,256 $ 1.69 $ 12,659 21.59
SXX Average 49,714 3.14 $ 68,049 $ 4.29 $ 5,588 12.18
MXX Average 149,793 2.52 $ 214,363 $ 3.60 $ 11,321 18.94
LXX Average 174,281 1.08 $ 264,247 $ 1.63 $ 12,659 20.87
XAX Average 122,562 2.21 $ 179,176 $ 3.12 $ 9,856 18.18
XEX Average 121,951 2.20 $ 177,807 $ 3.11 $ 9,856 18.04
XFX Average 127,953 2.30 $ 187,470 $ 3.26 $ 9,856 19.02
ALL Average 124,596 2.24 $ 182,220 $ 3.17 $ 9,856 18.49
CTZ12 Sacramento - Display Case Lighting Control
Energy Savings
(kWh)
Energy Savings/
SF (kWh)
TDV Cost
Savings ($)
TDV Cost
Savings /SF ($)
Measure
Cost ($)
Benefit/
Cost Ratio
SAC 48,999 3.09 $ 68,127 $ 4.30 $ 5,588 12.19
SAD 48,730 3.07 $ 67,833 $ 4.28 $ 5,588 12.14
SEC 48,100 3.03 $ 66,854 $ 4.22 $ 5,588 11.96

Measure Information Template Page 139
2013 California Building Energy Efficiency Standards September 2011
SFC 50,099 3.16 $ 69,889 $ 4.41 $ 5,588 12.51
SFD 50,275 3.17 $ 70,147 $ 4.43 $ 5,588 12.55
MAC 147,757 2.48 $ 216,974 $ 3.64 $ 11,321 19.17
MAD 144,098 2.42 $ 211,269 $ 3.55 $ 11,321 18.66
MEC 145,982 2.45 $ 214,011 $ 3.59 $ 11,321 18.90
MFC 153,142 2.57 $ 225,100 $ 3.78 $ 11,321 19.88
MFD 152,738 2.56 $ 224,566 $ 3.77 $ 11,321 19.84
LAC 172,356 1.06 $ 265,753 $ 1.64 $ 12,659 20.99
LAD 168,605 1.04 $ 258,269 $ 1.59 $ 12,659 20.40
LEC 167,295 1.03 $ 256,418 $ 1.58 $ 12,659 20.26
LFC 176,435 1.09 $ 271,414 $ 1.67 $ 12,659 21.44
LFD 178,331 1.10 $ 274,724 $ 1.69 $ 12,659 21.70
SXX Average 49,241 3.11 $ 68,570 $ 4.33 $ 5,588 12.27
MXX Average 148,743 2.50 $ 218,384 $ 3.67 $ 11,321 19.29
LXX Average 172,604 1.06 $ 265,315 $ 1.64 $ 12,659 20.96
XAX Average 121,758 2.19 $ 181,371 $ 3.17 $ 9,856 18.40
XEX Average 120,459 2.17 $ 179,094 $ 3.13 $ 9,856 18.17
XFX Average 126,837 2.28 $ 189,307 $ 3.29 $ 9,856 19.21
ALL Average 123,529 2.22 $ 184,090 $ 3.21 $ 9,856 18.68
CTZ13 Fresno - Display Case Lighting Control
Energy Savings
(kWh)
Energy Savings/
SF (kWh)
TDV Cost
Savings ($)
TDV Cost
Savings /SF ($)
Measure
Cost ($)
Benefit/
Cost Ratio
SAC 50,266 3.17 $ 70,975 $ 4.48 $ 5,588 12.70
SAD 49,722 3.14 $ 70,218 $ 4.43 $ 5,588 12.57
SEC 49,331 3.11 $ 69,587 $ 4.39 $ 5,588 12.45
SFC 51,228 3.23 $ 72,479 $ 4.57 $ 5,588 12.97
SFD 51,454 3.25 $ 72,773 $ 4.59 $ 5,588 13.02
MAC 149,672 2.51 $ 220,045 $ 3.69 $ 11,321 19.44
MAD 145,866 2.45 $ 214,304 $ 3.60 $ 11,321 18.93
MEC 148,826 2.50 $ 218,532 $ 3.67 $ 11,321 19.30
MFC 154,841 2.60 $ 228,330 $ 3.83 $ 11,321 20.17
MFD 154,712 2.60 $ 228,188 $ 3.83 $ 11,321 20.16
LAC 175,674 1.08 $ 271,939 $ 1.68 $ 12,659 21.48
LAD 170,351 1.05 $ 262,104 $ 1.62 $ 12,659 20.71
LEC 168,948 1.04 $ 259,826 $ 1.60 $ 12,659 20.53
LFC 177,667 1.10 $ 274,422 $ 1.69 $ 12,659 21.68
LFD 179,425 1.11 $ 277,456 $ 1.71 $ 12,659 21.92
SXX Average 50,400 3.18 $ 71,206 $ 4.49 $ 5,588 12.74
MXX Average 150,783 2.53 $ 221,880 $ 3.73 $ 11,321 19.60
LXX Average 174,413 1.08 $ 269,149 $ 1.66 $ 12,659 21.26
XAX Average 123,592 2.23 $ 184,931 $ 3.25 $ 9,856 18.76
XEX Average 122,368 2.22 $ 182,648 $ 3.22 $ 9,856 18.53
XFX Average 128,221 2.31 $ 192,275 $ 3.37 $ 9,856 19.51
ALL Average 125,199 2.26 $ 187,412 $ 3.29 $ 9,856 19.01
CTZ14 Palmdale - Display Case Lighting Control
Energy Savings
(kWh)
Energy Savings/
SF (kWh)
TDV Cost
Savings ($)
TDV Cost
Savings /SF ($)
Measure
Cost ($)
Benefit/
Cost Ratio
SAC 50,243 3.17 $ 69,248 $ 4.37 $ 5,588 12.39
SAD 49,825 3.14 $ 68,679 $ 4.33 $ 5,588 12.29
SEC 48,640 3.07 $ 66,863 $ 4.22 $ 5,588 11.96
SFC 50,606 3.19 $ 69,747 $ 4.40 $ 5,588 12.48
SFD 50,755 3.20 $ 69,969 $ 4.41 $ 5,588 12.52
MAC 149,311 2.51 $ 215,693 $ 3.62 $ 11,321 19.05
MAD 145,589 2.44 $ 210,255 $ 3.53 $ 11,321 18.57
MEC 145,817 2.45 $ 210,460 $ 3.53 $ 11,321 18.59
MFC 152,370 2.56 $ 220,498 $ 3.70 $ 11,321 19.48
MFD 152,027 2.55 $ 220,009 $ 3.69 $ 11,321 19.43
LAC 175,750 1.08 $ 267,302 $ 1.65 $ 12,659 21.12
LAD 170,259 1.05 $ 257,388 $ 1.59 $ 12,659 20.33
LEC 167,262 1.03 $ 252,715 $ 1.56 $ 12,659 19.96
LFC 176,395 1.09 $ 267,275 $ 1.65 $ 12,659 21.11
LFD 178,341 1.10 $ 270,524 $ 1.67 $ 12,659 21.37
SXX Average 50,014 3.16 $ 68,901 $ 4.35 $ 5,588 12.33
MXX Average 149,023 2.50 $ 215,383 $ 3.62 $ 11,321 19.03
LXX Average 173,601 1.07 $ 263,041 $ 1.62 $ 12,659 20.78
XAX Average 123,496 2.23 $ 181,427 $ 3.18 $ 9,856 18.41
XEX Average 120,573 2.18 $ 176,679 $ 3.10 $ 9,856 17.93
XFX Average 126,749 2.28 $ 186,337 $ 3.25 $ 9,856 18.91
ALL Average 124,213 2.24 $ 182,442 $ 3.20 $ 9,856 18.51
CTZ15 Palm Springs - Display Case Lighting Control
Energy Savings
(kWh)
Energy Savings/
SF (kWh)
TDV Cost
Savings ($)
TDV Cost
Savings /SF ($)
Measure
Cost ($)
Benefit/
Cost Ratio
SAC 51,776 3.27 $ 72,755 $ 4.59 $ 5,588 13.02
SAD 51,071 3.22 $ 71,812 $ 4.53 $ 5,588 12.85
SEC 50,040 3.16 $ 70,094 $ 4.42 $ 5,588 12.54
SFC 51,759 3.27 $ 72,728 $ 4.59 $ 5,588 13.01
SFD 52,092 3.29 $ 73,262 $ 4.62 $ 5,588 13.11
MAC 153,301 2.57 $ 225,171 $ 3.78 $ 11,321 19.89
MAD 151,698 2.55 $ 223,035 $ 3.74 $ 11,321 19.70

Measure Information Template Page 140
2013 California Building Energy Efficiency Standards September 2011
MEC 151,568 2.54 $ 221,602 $ 3.72 $ 11,321 19.57
MFC 158,126 2.65 $ 232,255 $ 3.90 $ 11,321 20.52
MFD 158,632 2.66 $ 233,198 $ 3.92 $ 11,321 20.60
LAC 185,047 1.14 $ 285,101 $ 1.76 $ 12,659 22.52
LAD 176,034 1.09 $ 271,280 $ 1.67 $ 12,659 21.43
LEC 172,611 1.06 $ 264,276 $ 1.63 $ 12,659 20.88
LFC 181,127 1.12 $ 278,551 $ 1.72 $ 12,659 22.00
LFD 182,818 1.13 $ 281,702 $ 1.74 $ 12,659 22.25
SXX Average 51,348 3.24 $ 72,130 $ 4.55 $ 5,588 12.91
MXX Average 154,665 2.60 $ 227,052 $ 3.81 $ 11,321 20.06
LXX Average 179,527 1.11 $ 276,182 $ 1.70 $ 12,659 21.82
XAX Average 128,155 2.31 $ 191,526 $ 3.35 $ 9,856 19.43
XEX Average 124,740 2.26 $ 185,324 $ 3.26 $ 9,856 18.80
XFX Average 130,759 2.35 $ 195,283 $ 3.41 $ 9,856 19.81
ALL Average 128,513 2.31 $ 191,788 $ 3.36 $ 9,856 19.46

Measure Information Template Page 141
2013 California Building Energy Efficiency Standards September 2011
14.6 Refrigeration Heat Recovery CTZ01 Arcata - Refrigeration Heat Recovery
Energy
Savings
(kWh)
Energy
Savings/
SF
(kWh)
Natural
Gas
Savings
(Therms)
Natural
Gas
Savings
/SF
(Therms)
TDV
Electric
Cost
Savings
($)
TDV Gas
Cost
Savings
($)
TDV
Total Cost
Savings
($)
TDV
Total
Cost
Savings
/SF ($)
Measure
Cost ($)
Refrigerant Cost
Savings Range ($) Net Savings Range ($)
SAC -26,406 -1.67 13,595 0.86 -$59,035 $276,545 $217,510 $13.72 $20,926 -$12,234 -$18,351 $184,351 $178,234
SAD -30,552 -1.93 13,585 0.86 -$69,082 $276,313 $207,230 $13.08 $23,202 -$5,182 -$10,365 $178,846 $173,664
SEC -17,954 -1.13 13,594 0.86 -$38,918 $276,521 $237,603 $14.99 $20,926 -$12,574 -$18,860 $204,103 $197,816
SFC -7,248 -0.46 13,620 0.86 -$14,898 $277,059 $262,161 $16.54 $20,926 -$10,761 -$16,142 $230,474 $225,093
SFD -8,995 -0.57 13,614 0.86 -$18,165 $276,937 $258,771 $16.33 $21,000 -$4,814 -$9,629 $232,957 $228,143
MAC -88,277 -1.48 46,458 0.78 -$194,546 $939,757 $745,212 $12.51 $66,536 -$41,458 -$62,187 $637,218 $616,489
MAD -106,993 -1.80 46,458 0.78 -$237,768 $939,757 $701,989 $11.79 $75,068 -$16,029 -$32,057 $610,893 $594,864
MEC -45,675 -0.77 46,469 0.78 -$93,102 $939,990 $846,887 $14.22 $66,536 -$43,327 -$64,990 $737,025 $715,361
MFC 2,363 0.04 46,490 0.78 $13,393 $940,381 $953,774 $16.01 $66,536 -$33,926 -$50,889 $853,312 $836,349
MFD 84,118 1.41 46,501 0.78 $187,911 $940,626 $1,128,537 $18.95 $75,068 -$14,160 -$28,320 $1,039,309 $1,025,149
LAC -147,172 -0.91 71,243 0.44 -$338,018 $1,441,831 $1,103,813 $6.81 $83,600 -$65,101 -$97,651 $955,113 $922,562
LAD -150,070 -0.93 70,919 0.44 -$346,337 $1,435,236 $1,088,899 $6.72 $95,545 -$26,807 -$53,613 $966,547 $939,740
LEC -120,903 -0.75 71,664 0.44 -$270,062 $1,450,116 $1,180,054 $7.28 $83,600 -$67,398 -$101,097 $1,029,056 $995,357
LFC -66,500 -0.41 72,907 0.45 -$146,283 $1,475,434 $1,329,152 $8.20 $83,600 -$55,911 -$83,866 $1,189,641 $1,161,685
LFD -70,730 -0.44 72,568 0.45 -$153,698 $1,468,386 $1,314,688 $8.11 $95,545 -$24,509 -$49,019 $1,194,633 $1,170,124
SXX Average -18,231 -1.15 13,602 0.86 -$40,020 $276,675 $236,655 $14.93 $21,396
MXX Average -30,893 -0.52 46,475 0.78 -$64,822 $940,102 $875,280 $14.70 $69,949
LXX Average -111,075 -0.69 71,860 0.44 -$250,880 $1,454,201 $1,203,321 $7.42 $88,378
XAX Average -91,578 -1.45 43,710 0.69 -$207,464 $884,907 $677,442 $10.77 $60,813
XEX Average -61,511 -0.88 43,909 0.69 -$134,027 $888,875 $754,848 $12.16 $57,021
XFX Average -11,165 -0.07 44,283 0.70 -$21,957 $896,471 $874,514 $14.02 $60,446
ALL Average -53,400 -0.78 43,977 0.69 -$118,574 $890,326 $771,752 $12.35 $59,908
CTZ03 Oakland - Refrigeration Heat Recovery
Energy
Savings
(kWh)
Energy
Savings/
SF
(kWh)
Natural
Gas
Savings
(Therms)
Natural
Gas
Savings
/SF
(Therms)
TDV
Electric
Cost
Savings
($)
TDV Gas
Cost
Savings ($)
TDV
Total
Cost
Savings
($)
TDV
Total
Cost
Savings
/SF ($)
Measure
Cost ($)
Refrigerant Cost
Savings Range ($)
Net Savings Range
($)
SAC -23,189 -1.46 9,717 0.61 -$49,601 $201,483 $151,882 $9.58 $20,926 -$12,234 -$18,351 $118,722 $112,605
SAD -27,151 -1.71 9,715 0.61 -$57,641 $201,446 $143,805 $9.07 $23,202 -$5,182 -$10,365 $115,421 $110,238
SEC -16,067 -1.01 9,718 0.61 -$34,859 $201,508 $166,649 $10.51 $20,926 -$12,574 -$18,860 $133,149 $126,862
SFC -6,729 -0.42 9,729 0.61 -$15,857 $201,740 $185,883 $11.73 $20,926 -$10,761 -$16,142 $154,196 $148,815
SFD -7,571 -0.48 9,729 0.61 -$17,251 $201,728 $184,477 $11.64 $21,000 -$4,814 -$9,629 $158,662 $153,848
MAC -73,900 -1.24 35,273 0.59 -$154,245 $722,500 $568,256 $9.54 $66,536 -$41,458 -$62,187 $460,262 $439,533
MAD -90,381 -1.52 35,273 0.59 -$187,253 $722,500 $535,248 $8.99 $75,068 -$16,029 -$32,057 $444,151 $428,123
MEC -36,652 -0.62 35,286 0.59 -$76,721 $722,745 $646,024 $10.85 $66,536 -$43,327 -$64,990 $536,161 $514,498
MFC 2,213 0.04 35,303 0.59 $3,769 $723,112 $726,881 $12.20 $66,536 -$33,926 -$50,889 $626,419 $609,456
MFD 62,652 1.05 35,311 0.59 $126,746 $723,284 $850,029 $14.27 $75,068 -$14,160 -$28,320 $760,801 $746,642
LAC -135,990 -0.84 49,016 0.30 -$291,974 $1,019,800 $727,825 $4.49 $83,600 -$65,101 -$97,651 $579,125 $546,574
LAD -139,432 -0.86 48,857 0.30 -$298,018 $1,016,324 $718,306 $4.43 $95,545 -$26,807 -$53,613 $595,954 $569,148
LEC -109,720 -0.68 49,179 0.30 -$236,932 $1,023,300 $786,368 $4.85 $83,600 -$67,398 -$101,097 $635,370 $601,671
LFC -60,881 -0.38 49,805 0.31 -$137,953 $1,037,103 $899,150 $5.55 $83,600 -$55,911 -$83,866 $759,639 $731,684
LFD -62,703 -0.39 49,640 0.31 -$140,138 $1,033,456 $893,318 $5.51 $95,545 -$24,509 -$49,019 $773,264 $748,754
SXX Average -16,141 -1.02 9,722 0.61 -$35,042 $201,581 $166,539 $10.51 $21,396
MXX Average -27,214 -0.46 35,289 0.59 -$57,541 $722,828 $665,288 $11.17 $69,949
LXX Average -101,745 -0.63 49,299 0.30 -$221,003 $1,025,997 $804,993 $4.97 $88,378
XAX Average -81,674 -1.27 31,309 0.50 -$173,122 $647,342 $474,220 $7.68 $60,813
XEX Average -54,146 -0.77 31,394 0.50 -$116,171 $649,184 $533,014 $8.74 $57,021
XFX Average -12,170 -0.10 31,586 0.50 -$30,114 $653,404 $623,290 $10.15 $60,446
ALL Average -48,367 -0.70 31,436 0.50 -$104,529 $650,135 $545,607 $8.88 $59,908
CTZ05 Santa Maria - Refrigeration Heat Recovery
Energy
Savings
(kWh)
Energy
Savings/
SF
(kWh)
Natural
Gas
Savings
(Therms)
Natural
Gas
Savings
/SF
(Therms)
TDV
Electric
Cost
Savings
($)
TDV Gas
Cost
Savings ($)
TDV
Total
Cost
Savings
($)
TDV
Total
Cost
Savings
/SF ($)
Measure
Cost ($)
Refrigerant Cost
Savings Range ($)
Net Savings Range
($)
SAC -23,293 -1.47 10,112 0.64 -$50,058 $207,565 $157,507 $9.94 $20,926 -$12,234 -$18,351 $124,347 $118,230
SAD -27,154 -1.71 10,109 0.64 -$58,187 $207,504 $149,316 $9.42 $23,202 -$5,182 -$10,365 $120,932 $115,749
SEC -16,804 -1.06 10,113 0.64 -$36,465 $207,577 $171,112 $10.80 $20,926 -$12,574 -$18,860 $137,613 $131,326
SFC -7,228 -0.46 10,125 0.64 -$16,604 $207,810 $191,205 $12.06 $20,926 -$10,761 -$16,142 $159,518 $154,137
SFD -8,304 -0.52 10,124 0.64 -$18,433 $207,785 $189,352 $11.95 $21,000 -$4,814 -$9,629 $163,538 $158,723
MAC -74,595 -1.25 36,645 0.62 -$155,326 $745,163 $589,837 $9.90 $66,536 -$41,458 -$62,187 $481,843 $461,114
MAD -90,885 -1.53 36,644 0.62 -$188,591 $745,163 $556,573 $9.35 $75,068 -$16,029 -$32,057 $465,476 $449,448
MEC -39,874 -0.67 36,655 0.62 -$81,639 $745,371 $663,733 $11.14 $66,536 -$43,327 -$64,990 $553,870 $532,207
MFC 758 0.01 36,673 0.62 $3,535 $745,739 $749,274 $12.58 $66,536 -$33,926 -$50,889 $648,812 $631,849
MFD 68,507 1.15 36,682 0.62 $141,477 $745,922 $887,399 $14.90 $75,068 -$14,160 -$28,320 $798,171 $784,011
LAC -135,427 -0.84 51,937 0.32 -$294,060 $1,064,269 $770,210 $4.75 $83,600 -$65,101 -$97,651 $621,509 $588,959
LAD -138,730 -0.86 51,752 0.32 -$300,182 $1,060,280 $760,098 $4.69 $95,545 -$26,807 -$53,613 $637,746 $610,940
LEC -113,666 -0.70 52,099 0.32 -$246,622 $1,067,671 $821,049 $5.06 $83,600 -$67,398 -$101,097 $670,051 $636,352
LFC -64,295 -0.40 52,769 0.33 -$144,733 $1,081,891 $937,158 $5.78 $83,600 -$55,911 -$83,866 $797,647 $769,692
LFD -66,498 -0.41 52,590 0.32 -$147,599 $1,078,011 $930,413 $5.74 $95,545 -$24,509 -$49,019 $810,359 $785,849
SXX Average -16,557 -1.04 10,117 0.64 -$35,950 $207,648 $171,699 $10.83 $21,396

Measure Information Template Page 142
2013 California Building Energy Efficiency Standards September 2011
MXX Average -27,218 -0.46 36,660 0.62 -$56,109 $745,472 $689,363 $11.57 $69,949
LXX Average -103,723 -0.64 52,229 0.32 -$226,639 $1,070,424 $843,785 $5.20 $88,378
XAX Average -81,681 -1.28 32,867 0.52 -$174,401 $671,657 $497,257 $8.01 $60,813
XEX Average -56,781 -0.81 32,956 0.52 -$121,575 $673,540 $551,965 $9.00 $57,021
XFX Average -12,843 -0.10 33,161 0.53 -$30,393 $677,860 $647,467 $10.50 $60,446
ALL Average -49,166 -0.71 33,001 0.53 -$106,232 $674,515 $568,282 $9.20 $59,908
CTZ07 San Diego-Lindbergh - Refrigeration Heat Recovery
Energy
Savings
(kWh)
Energy
Savings/
SF
(kWh)
Natural
Gas
Savings
(Therms)
Natural
Gas
Savings
/SF
(Therms)
TDV
Electric
Cost
Savings
($)
TDV Gas
Cost
Savings
($)
TDV
Total
Cost
Savings
($)
TDV
Total
Cost
Savings
/SF ($)
Measure
Cost ($)
Refrigerant Cost
Savings Range ($)
Net Savings Range
($)
SAC -18,715 -1.18 6,247 0.39 -$40,334 $130,863 $90,529 $5.71 $20,926 -$12,234 -$18,351 $57,369 $51,252
SAD -22,332 -1.41 6,247 0.39 -$47,739 $130,875 $83,137 $5.25 $23,202 -$5,182 -$10,365 $54,752 $49,570
SEC -12,663 -0.80 6,249 0.39 -$27,834 $130,912 $103,078 $6.50 $20,926 -$12,574 -$18,860 $69,579 $63,292
SFC -6,175 -0.39 6,253 0.39 -$13,906 $130,985 $117,080 $7.39 $20,926 -$10,761 -$16,142 $85,392 $80,012
SFD -6,118 -0.39 6,252 0.39 -$13,493 $130,985 $117,492 $7.41 $21,000 -$4,814 -$9,629 $91,678 $86,864
MAC -55,969 -0.94 23,840 0.40 -$120,512 $496,470 $375,958 $6.31 $66,536 -$41,458 -$62,187 $267,964 $247,235
MAD -69,373 -1.16 23,840 0.40 -$146,316 $496,457 $350,141 $5.88 $75,068 -$16,029 -$32,057 $259,045 $243,016
MEC -25,782 -0.43 23,854 0.40 -$58,533 $496,739 $438,206 $7.36 $66,536 -$43,327 -$64,990 $328,343 $306,680
MFC 785 0.01 23,868 0.40 -$647 $497,033 $496,386 $8.33 $66,536 -$33,926 -$50,889 $395,924 $378,961
MFD 34,852 0.59 23,871 0.40 $71,569 $497,106 $568,675 $9.55 $75,068 -$14,160 -$28,320 $479,447 $465,288
LAC -116,133 -0.72 22,962 0.14 -$251,049 $498,269 $247,219 $1.52 $83,600 -$65,101 -$97,651 $98,519 $65,969
LAD -118,808 -0.73 22,942 0.14 -$254,238 $497,804 $243,565 $1.50 $95,545 -$26,807 -$53,613 $121,213 $94,407
LEC -89,692 -0.55 22,973 0.14 -$198,081 $498,501 $300,421 $1.85 $83,600 -$67,398 -$101,097 $149,423 $115,724
LFC -57,760 -0.36 23,027 0.14 -$134,295 $499,725 $365,430 $2.25 $83,600 -$55,911 -$83,866 $225,919 $197,963
LFD -56,745 -0.35 23,012 0.14 -$130,860 $499,382 $368,522 $2.27 $95,545 -$24,509 -$49,019 $248,467 $223,958
SXX Average -13,201 -0.83 6,250 0.39 -$28,661 $130,924 $102,263 $6.45 $21,396
MXX Average -23,097 -0.39 23,855 0.40 -$50,888 $496,761 $445,873 $7.49 $69,949
LXX Average -87,828 -0.54 22,983 0.14 -$193,705 $498,736 $305,031 $1.88 $88,378
XAX Average -66,888 -1.02 17,680 0.31 -$143,365 $375,123 $231,758 $4.36 $60,813
XEX Average -42,712 -0.60 17,692 0.31 -$94,816 $375,384 $280,568 $5.24 $57,021
XFX Average -15,194 -0.15 17,714 0.31 -$36,939 $375,869 $338,931 $6.20 $60,446
ALL Average -41,375 -0.59 17,696 0.31 -$91,085 $375,474 $284,389 $5.27 $59,908
CTZ08 Fullerton - Refrigeration Heat Recovery
Energy
Savings
(kWh)
Energy
Savings/
SF
(kWh)
Natural
Gas
Savings
(Therms)
Natural
Gas
Savings
/SF
(Therms)
TDV
Electric
Cost
Savings
($)
TDV Gas
Cost
Savings
($)
TDV
Total
Cost
Savings
($)
TDV
Total
Cost
Savings
/SF ($)
Measure
Cost ($)
Refrigerant Cost
Savings Range ($)
Net Savings Range
($)
SAC -20,858 -1.32 7,543 0.48 -$44,549 $163,805 $119,256 $7.52 $20,926 -$12,234 -$18,351 $86,096 $79,979
SAD -23,106 -1.46 7,541 0.48 -$48,709 $163,744 $115,035 $7.26 $23,202 -$5,182 -$10,365 $86,651 $81,468
SEC -17,518 -1.11 7,544 0.48 -$37,736 $163,793 $126,057 $7.95 $20,926 -$12,574 -$18,860 $92,557 $86,271
SFC -9,714 -0.61 7,553 0.48 -$22,436 $164,026 $141,589 $8.93 $20,926 -$10,761 -$16,142 $109,902 $104,521
SFD -10,663 -0.67 7,552 0.48 -$23,931 $163,977 $140,046 $8.84 $21,000 -$4,814 -$9,629 $114,232 $109,417
MAC -58,999 -0.99 20,787 0.35 -$126,545 $439,151 $312,606 $5.25 $66,536 -$41,458 -$62,187 $204,612 $183,883
MAD -69,474 -1.17 20,787 0.35 -$144,666 $439,151 $294,486 $4.94 $75,068 -$16,029 -$32,057 $203,389 $187,360
MEC -35,499 -0.60 20,792 0.35 -$79,754 $439,237 $359,483 $6.04 $66,536 -$43,327 -$64,990 $249,620 $227,957
MFC -9,982 -0.17 20,809 0.35 -$29,584 $439,592 $410,007 $6.88 $66,536 -$33,926 -$50,889 $309,545 $292,582
MFD -11,884 -0.20 20,809 0.35 -$31,424 $439,592 $408,168 $6.85 $75,068 -$14,160 -$28,320 $318,940 $304,780
LAC -110,056 -0.68 21,570 0.13 -$233,709 $472,840 $239,131 $1.48 $83,600 -$65,101 -$97,651 $90,430 $57,880
LAD -110,114 -0.68 21,536 0.13 -$231,735 $472,081 $240,346 $1.48 $95,545 -$26,807 -$53,613 $117,994 $91,188
LEC -92,209 -0.57 21,577 0.13 -$198,794 $473,011 $274,217 $1.69 $83,600 -$67,398 -$101,097 $123,219 $89,520
LFC -62,349 -0.38 21,657 0.13 -$140,975 $474,798 $333,823 $2.06 $83,600 -$55,911 -$83,866 $194,312 $166,357
LFD -61,792 -0.38 21,640 0.13 -$138,254 $474,419 $336,165 $2.07 $95,545 -$24,509 -$49,019 $216,110 $191,601
SXX Average -16,372 -1.03 7,547 0.48 -$35,472 $163,869 $128,397 $8.10 $21,396
MXX Average -37,168 -0.62 20,797 0.35 -$82,395 $439,345 $356,950 $5.99 $69,949
LXX Average -87,304 -0.54 21,596 0.13 -$188,693 $473,430 $284,736 $1.76 $88,378
XAX Average -65,435 -1.05 16,627 0.32 -$138,319 $358,462 $220,143 $4.66 $60,813
XEX Average -48,409 -0.76 16,638 0.32 -$105,428 $358,680 $253,252 $5.23 $57,021
XFX Average -27,731 -0.40 16,670 0.32 -$64,434 $359,400 $294,966 $5.94 $60,446
ALL Average -46,948 -0.73 16,646 0.32 -$102,187 $358,881 $256,694 $5.28 $59,908
CTZ10 Riverside - Refrigeration Heat Recovery
Energy
Savings
(kWh)
Energy
Savings/
SF
(kWh)
Natural
Gas
Savings
(Therms)
Natural
Gas
Savings
/SF
(Therms)
TDV
Electric
Cost
Savings
($)
TDV Gas
Cost
Savings
($)
TDV
Total
Cost
Savings
($)
TDV
Total
Cost
Savings
/SF ($)
Measure
Cost ($)
Refrigerant Cost
Savings Range ($)
Net Savings Range
($)
SAC -19,177 -1.21 5,343 0.34 -$40,267 $116,436 $76,168 $4.81 $20,926 -$12,234 -$18,351 $43,008 $36,892
SAD -21,182 -1.34 5,342 0.34 -$43,813 $116,436 $72,622 $4.58 $23,202 -$5,182 -$10,365 $44,238 $39,055
SEC -16,641 -1.05 5,342 0.34 -$35,361 $116,448 $81,087 $5.12 $20,926 -$12,574 -$18,860 $47,587 $41,301
SFC -9,927 -0.63 5,348 0.34 -$22,682 $116,558 $93,876 $5.92 $20,926 -$10,761 -$16,142 $62,189 $56,808
SFD -10,528 -0.66 5,348 0.34 -$23,329 $116,558 $93,229 $5.88 $21,000 -$4,814 -$9,629 $67,415 $62,601
MAC -61,925 -1.04 20,368 0.34 -$129,734 $437,866 $308,132 $5.17 $66,536 -$41,458 -$62,187 $200,138 $179,409
MAD -71,575 -1.20 20,368 0.34 -$146,428 $437,866 $291,439 $4.89 $75,068 -$16,029 -$32,057 $200,342 $184,314
MEC -44,385 -0.75 20,368 0.34 -$95,533 $437,879 $342,346 $5.75 $66,536 -$43,327 -$64,990 $232,483 $210,819
MFC -16,675 -0.28 20,384 0.34 -$42,854 $438,197 $395,342 $6.64 $66,536 -$33,926 -$50,889 $294,880 $277,917
MFD -20,538 -0.34 20,384 0.34 -$48,040 $438,197 $390,157 $6.55 $75,068 -$14,160 -$28,320 $300,929 $286,770
LAC -109,129 -0.67 24,338 0.15 -$229,215 $536,583 $307,368 $1.90 $83,600 -$65,101 -$97,651 $158,667 $126,117
LAD -108,758 -0.67 24,260 0.15 -$227,453 $534,796 $307,343 $1.90 $95,545 -$26,807 -$53,613 $184,991 $158,185
LEC -99,078 -0.61 24,357 0.15 -$210,202 $536,987 $326,785 $2.02 $83,600 -$67,398 -$101,097 $175,787 $142,088
LFC -69,051 -0.43 24,531 0.15 -$152,929 $540,890 $387,961 $2.39 $83,600 -$55,911 -$83,866 $248,450 $220,495

Measure Information Template Page 143
2013 California Building Energy Efficiency Standards September 2011
LFD -69,445 -0.43 24,479 0.15 -$152,026 $539,715 $387,690 $2.39 $95,545 -$24,509 -$49,019 $267,635 $243,126
SXX Average -15,491 -0.98 5,345 0.34 -$33,090 $116,487 $83,397 $5.26 $21,396
MXX Average -43,020 -0.72 20,374 0.34 -$92,518 $438,001 $345,483 $5.80 $69,949
LXX Average -91,092 -0.56 24,393 0.15 -$194,365 $537,794 $343,429 $2.12 $88,378
XAX Average -65,291 -1.02 16,670 0.28 -$136,152 $363,331 $227,179 $3.87 $60,813
XEX Average -53,368 -0.80 16,689 0.28 -$113,699 $363,771 $250,072 $4.29 $57,021
XFX Average -32,694 -0.46 16,746 0.28 -$73,643 $365,019 $291,376 $4.96 $60,446
ALL Average -49,868 -0.75 16,704 0.28 -$106,658 $364,094 $257,436 $4.39 $59,908
CTZ12 Sacramento - Refrigeration Heat Recovery
Energy
Savings
(kWh)
Energy
Savings/
SF
(kWh)
Natural
Gas
Savings
(Therms)
Natural
Gas
Savings
/SF
(Therms)
TDV
Electric
Cost
Savings
($)
TDV Gas
Cost
Savings
($)
TDV
Total
Cost
Savings
($)
TDV
Total
Cost
Savings
/SF ($)
Measure
Cost ($)
Refrigerant Cost
Savings Range ($)
Net Savings Range
($)
SAC -20,858 -1.32 7,543 0.48 -$44,549 $163,805 $119,256 $7.52 $20,926 -$12,234 -$18,351 $86,096 $79,979
SAD -23,106 -1.46 7,541 0.48 -$48,709 $163,744 $115,035 $7.26 $23,202 -$5,182 -$10,365 $86,651 $81,468
SEC -17,518 -1.11 7,544 0.48 -$37,736 $163,793 $126,057 $7.95 $20,926 -$12,574 -$18,860 $92,557 $86,271
SFC -9,714 -0.61 7,553 0.48 -$22,436 $164,026 $141,589 $8.93 $20,926 -$10,761 -$16,142 $109,902 $104,521
SFD -10,663 -0.67 7,552 0.48 -$23,931 $163,977 $140,046 $8.84 $21,000 -$4,814 -$9,629 $114,232 $109,417
MAC -68,559 -1.15 27,063 0.45 -$146,294 $578,776 $432,482 $7.26 $66,536 -$41,458 -$62,187 $324,488 $303,759
MAD -79,872 -1.34 27,063 0.45 -$166,991 $578,764 $411,773 $6.91 $75,068 -$16,029 -$32,057 $320,677 $304,648
MEC -46,237 -0.78 27,065 0.45 -$100,674 $578,813 $478,139 $8.03 $66,536 -$43,327 -$64,990 $368,276 $346,613
MFC -13,758 -0.23 27,081 0.45 -$36,955 $579,156 $542,200 $9.10 $66,536 -$33,926 -$50,889 $441,738 $424,775
MFD -19,581 -0.33 27,081 0.45 -$46,624 $579,156 $532,532 $8.94 $75,068 -$14,160 -$28,320 $443,304 $429,144
LAC -118,989 -0.73 36,483 0.23 -$254,328 $796,535 $542,207 $3.34 $83,600 -$65,101 -$97,651 $393,506 $360,956
LAD -119,504 -0.74 36,297 0.22 -$254,450 $792,325 $537,875 $3.32 $95,545 -$26,807 -$53,613 $415,523 $388,716
LEC -107,079 -0.66 36,537 0.23 -$230,531 $797,758 $567,228 $3.50 $83,600 -$67,398 -$101,097 $416,230 $382,531
LFC -69,796 -0.43 37,042 0.23 -$156,642 $808,980 $652,337 $4.02 $83,600 -$55,911 -$83,866 $512,827 $484,871
LFD -71,449 -0.44 36,917 0.23 -$158,583 $806,190 $647,607 $3.99 $95,545 -$24,509 -$49,019 $527,553 $503,043
SXX Average -16,372 -1.03 7,547 0.48 -$35,472 $163,869 $128,397 $8.10 $21,396
MXX Average -45,601 -0.77 27,071 0.45 -$99,507 $578,933 $479,425 $8.05 $69,949
LXX Average -97,363 -0.60 36,655 0.23 -$210,907 $800,357 $589,451 $3.64 $88,378
XAX Average -71,815 -1.12 23,665 0.38 -$152,553 $512,325 $359,771 $5.94 $60,813
XEX Average -56,945 -0.85 23,715 0.39 -$122,980 $513,455 $390,475 $6.49 $57,021
XFX Average -32,494 -0.45 23,871 0.39 -$74,195 $516,914 $442,719 $7.31 $60,446
ALL Average -53,112 -0.80 23,756 0.39 -$115,295 $514,386 $399,091 $6.60 $59,908
CTZ13 Fresno - Refrigeration Heat Recovery
Energy
Savings
(kWh)
Energy
Savings/
SF
(kWh)
Natural
Gas
Savings
(Therms)
Natural
Gas
Savings
/SF
(Therms)
TDV
Electric
Cost
Savings
($)
TDV Gas
Cost
Savings
($)
TDV
Total
Cost
Savings
($)
TDV
Total
Cost
Savings
/SF ($)
Measure
Cost ($)
Refrigerant Cost
Savings Range ($)
Net Savings Range
($)
SAC -19,194 -1.21 6,448 0.41 -$41,371 $143,174 $101,802 $6.42 $20,926 -$12,234 -$18,351 $68,642 $62,526
SAD -20,958 -1.32 6,446 0.41 -$44,616 $143,125 $98,508 $6.22 $23,202 -$5,182 -$10,365 $70,124 $64,941
SEC -16,946 -1.07 6,448 0.41 -$36,587 $143,174 $106,586 $6.73 $20,926 -$12,574 -$18,860 $73,087 $66,800
SFC -10,125 -0.64 6,456 0.41 -$23,317 $143,345 $120,028 $7.57 $20,926 -$10,761 -$16,142 $88,340 $82,959
SFD -10,991 -0.69 6,455 0.41 -$24,600 $143,320 $118,721 $7.49 $21,000 -$4,814 -$9,629 $92,906 $88,092
MAC -63,148 -1.06 22,549 0.38 -$136,046 $494,989 $358,943 $6.03 $66,536 -$41,458 -$62,187 $250,949 $230,220
MAD -71,922 -1.21 22,549 0.38 -$151,858 $494,977 $343,118 $5.76 $75,068 -$16,029 -$32,057 $252,022 $235,993
MEC -46,988 -0.79 22,550 0.38 -$102,402 $494,989 $392,587 $6.59 $66,536 -$43,327 -$64,990 $282,724 $261,060
MFC -17,805 -0.30 22,564 0.38 -$45,118 $495,283 $450,165 $7.56 $66,536 -$33,926 -$50,889 $349,703 $332,740
MFD -22,845 -0.38 22,564 0.38 -$53,114 $495,283 $442,169 $7.42 $75,068 -$14,160 -$28,320 $352,941 $338,782
LAC -108,088 -0.67 30,743 0.19 -$233,073 $685,520 $452,447 $2.79 $83,600 -$65,101 -$97,651 $303,746 $271,196
LAD -107,673 -0.66 30,585 0.19 -$231,668 $681,935 $450,266 $2.78 $95,545 -$26,807 -$53,613 $327,915 $301,108
LEC -101,278 -0.62 30,798 0.19 -$219,379 $686,793 $467,413 $2.88 $83,600 -$67,398 -$101,097 $316,415 $282,716
LFC -70,553 -0.44 31,178 0.19 -$158,382 $695,383 $537,001 $3.31 $83,600 -$55,911 -$83,866 $397,490 $369,535
LFD -71,882 -0.44 31,080 0.19 -$159,664 $693,144 $533,479 $3.29 $95,545 -$24,509 -$49,019 $413,425 $388,916
SXX Average -15,643 -0.99 6,451 0.41 -$34,098 $143,227 $109,129 $6.89 $21,396
MXX Average -44,542 -0.75 22,555 0.38 -$97,708 $495,104 $397,396 $6.67 $69,949
LXX Average -91,895 -0.57 30,877 0.19 -$200,433 $688,555 $488,121 $3.01 $88,378
XAX Average -65,164 -1.02 19,887 0.32 -$139,772 $440,620 $300,848 $5.00 $60,813
XEX Average -55,071 -0.83 19,932 0.33 -$119,456 $441,652 $322,195 $5.40 $57,021
XFX Average -34,034 -0.48 20,050 0.33 -$77,366 $444,293 $366,927 $6.11 $60,446
ALL Average -50,693 -0.77 19,960 0.33 -$110,747 $442,295 $331,549 $5.52 $59,908
CTZ14 Palmdale - Refrigeration Heat Recovery
Energy
Savings
(kWh)
Energy
Savings/
SF
(kWh)
Natural
Gas
Savings
(Therms)
Natural
Gas
Savings
/SF
(Therms)
TDV
Electric
Cost
Savings
($)
TDV Gas
Cost
Savings
($)
TDV
Total
Cost
Savings
($)
TDV
Total
Cost
Savings
/SF ($)
Measure
Cost ($)
Refrigerant Cost
Savings Range ($)
Net Savings Range
($)
SAC -18,973 -1.20 6,902 0.44 -$40,122 $153,257 $113,135 $7.14 $20,926 -$12,234 -$18,351 $79,975 $73,858
SAD -20,755 -1.31 6,898 0.44 -$43,323 $153,159 $109,836 $6.93 $23,202 -$5,182 -$10,365 $81,452 $76,269
SEC -19,280 -1.22 6,902 0.44 -$40,568 $153,232 $112,664 $7.11 $20,926 -$12,574 -$18,860 $79,164 $72,878
SFC -12,960 -0.82 6,909 0.44 -$28,492 $153,404 $124,912 $7.88 $20,926 -$10,761 -$16,142 $93,225 $87,844
SFD -14,521 -0.92 6,905 0.44 -$31,134 $153,318 $122,184 $7.71 $21,000 -$4,814 -$9,629 $96,369 $91,555
MAC -62,289 -1.05 24,108 0.40 -$131,496 $529,571 $398,075 $6.68 $66,536 -$41,458 -$62,187 $290,081 $269,352
MAD -71,102 -1.19 24,108 0.40 -$146,896 $529,571 $382,675 $6.43 $75,068 -$16,029 -$32,057 $291,578 $275,550
MEC -59,519 -1.00 24,104 0.40 -$125,486 $529,522 $404,036 $6.78 $66,536 -$43,327 -$64,990 $294,174 $272,510
MFC -28,747 -0.48 24,116 0.40 -$66,071 $529,742 $463,671 $7.79 $66,536 -$33,926 -$50,889 $363,209 $346,246
MFD -36,869 -0.62 24,115 0.40 -$79,765 $529,742 $449,977 $7.56 $75,068 -$14,160 -$28,320 $360,749 $346,590
LAC -108,263 -0.67 33,736 0.21 -$229,471 $751,184 $521,713 $3.22 $83,600 -$65,101 -$97,651 $373,012 $340,462
LAD -108,129 -0.67 33,540 0.21 -$228,356 $746,718 $518,361 $3.20 $95,545 -$26,807 -$53,613 $396,010 $369,203

Measure Information Template Page 144
2013 California Building Energy Efficiency Standards September 2011
LEC -109,532 -0.68 33,778 0.21 -$231,891 $752,139 $520,247 $3.21 $83,600 -$67,398 -$101,097 $369,249 $335,550
LFC -85,136 -0.53 33,994 0.21 -$184,665 $756,899 $572,233 $3.53 $83,600 -$55,911 -$83,866 $432,722 $404,767
LFD -87,121 -0.54 33,859 0.21 -$187,130 $753,791 $566,661 $3.50 $95,545 -$24,509 -$49,019 $446,606 $422,097
SXX Average -17,298 -1.09 6,903 0.44 -$36,728 $153,274 $116,546 $7.35 $21,396
MXX Average -51,705 -0.87 24,110 0.40 -$109,943 $529,630 $419,687 $7.05 $69,949
LXX Average -99,636 -0.61 33,781 0.21 -$212,303 $752,146 $539,843 $3.33 $88,378
XAX Average -64,919 -1.01 21,549 0.35 -$136,611 $477,243 $340,632 $5.60 $60,813
XEX Average -62,777 -0.96 21,595 0.35 -$132,648 $478,298 $345,649 $5.70 $57,021
XFX Average -44,226 -0.65 21,650 0.35 -$96,210 $479,483 $383,273 $6.33 $60,446
ALL Average -56,213 -0.86 21,598 0.35 -$119,658 $478,350 $358,692 $5.91 $59,908
CTZ15 Palm Springs - Refrigeration Heat Recovery
Energy
Savings
(kWh)
Energy
Savings/
SF
(kWh)
Natural
Gas
Savings
(Therms)
Natural
Gas
Savings
/SF
(Therms)
TDV
Electric
Cost
Savings
($)
TDV Gas
Cost
Savings
($)
TDV
Total
Cost
Savings
($)
TDV
Total
Cost
Savings
/SF ($)
Measure
Cost ($)
Refrigerant Cost
Savings Range ($) Net Savings Range ($)
SAC -14,987 -0.95 2,250 0.14 -$32,539 $51,689 $19,150 $1.21 $20,926 -$12,234 -$18,351 -$14,010 -$20,127
SAD -15,793 -1.00 2,250 0.14 -$33,933 $51,689 $17,756 $1.12 $23,202 -$5,182 -$10,365 -$10,629 -$15,811
SEC -15,409 -0.97 2,250 0.14 -$33,220 $51,677 $18,457 $1.16 $20,926 -$12,574 -$18,860 -$15,042 -$21,329
SFC -10,655 -0.67 2,251 0.14 -$24,154 $51,726 $27,572 $1.74 $20,926 -$10,761 -$16,142 -$4,115 -$9,496
SFD -10,901 -0.69 2,251 0.14 -$24,265 $51,726 $27,461 $1.73 $21,000 -$4,814 -$9,629 $1,646 -$3,168
MAC -48,067 -0.81 8,532 0.14 -$105,335 $194,802 $89,467 $1.50 $66,536 -$41,458 -$62,187 -$18,527 -$39,256
MAD -51,536 -0.87 8,532 0.14 -$110,844 $194,802 $83,958 $1.41 $75,068 -$16,029 -$32,057 -$7,139 -$23,167
MEC -47,445 -0.80 8,529 0.14 -$102,926 $194,728 $91,802 $1.54 $66,536 -$43,327 -$64,990 -$18,061 -$39,724
MFC -25,995 -0.44 8,538 0.14 -$61,800 $194,949 $133,148 $2.24 $66,536 -$33,926 -$50,889 $32,686 $15,723
MFD -26,917 -0.45 8,538 0.14 -$61,455 $194,949 $133,494 $2.24 $75,068 -$14,160 -$28,320 $44,266 $30,106
LAC -83,699 -0.52 7,502 0.05 -$181,108 $172,848 -$8,260 -$0.05 $83,600 -$65,101 -$97,651 -$156,960 -$189,511
LAD -81,478 -0.50 7,499 0.05 -$176,625 $172,775 -$3,850 -$0.02 $95,545 -$26,807 -$53,613 -$126,202 -$153,009
LEC -81,558 -0.50 7,502 0.05 -$177,216 $172,848 -$4,368 -$0.03 $83,600 -$67,398 -$101,097 -$155,366 -$189,065
LFC -67,603 -0.42 7,507 0.05 -$151,067 $172,983 $21,916 $0.14 $83,600 -$55,911 -$83,866 -$117,594 -$145,550
LFD -65,948 -0.41 7,506 0.05 -$146,216 $172,946 $26,731 $0.16 $95,545 -$24,509 -$49,019 -$93,324 -$117,833
SXX Average -13,549 -0.85 2,250 0.14 -$29,622 $51,702 $22,079 $1.39 $21,396
MXX Average -39,992 -0.67 8,534 0.14 -$88,472 $194,846 $106,374 $1.79 $69,949
LXX Average -76,057 -0.47 7,503 0.05 -$166,447 $172,880 $6,434 $0.04 $88,378
XAX Average -49,260 -0.77 6,094 0.11 -$106,731 $139,768 $33,037 $0.86 $60,813
XEX Average -48,137 -0.76 6,094 0.11 -$104,454 $139,751 $35,297 $0.89 $57,021
XFX Average -34,670 -0.51 6,099 0.11 -$78,159 $139,880 $61,720 $1.37 $60,446
ALL Average -43,199 -0.67 6,096 0.11 -$94,847 $139,809 $44,962 $1.07 $59,908

Measure Information Template Page 145
2013 California Building Energy Efficiency Standards September 2011
15. Appendix J: Acronym List and Glossary
AB 32 (Assembly Bill 32) California Global Warming Solutions Act of 2006
AC Air conditioner, or Air-conditioning
AHRI Air-conditioning, Heating, and Refrigeration Institute
ARB (California) Air Resources Board
B/C Benefit to cost ratio
Btu British thermal unit
Btu/h British thermal units per hour
CA California
CARB California Air Resources Board
CASE Codes and Standards Enhancement
CEC California Energy Commission
CFC Chlorofluorocarbon
CO2 Carbon dioxide
CTZ01 Climate zone 1 - Arcata
CTZ03 Climate zone 3 - Oakland
CTZ05 Climate zone 5 - Santa Maria
CTZ07 Climate zone 7 - San Diego (Lindbergh)
CTZ08 Climate zone 8 - Fullerton
CTZ10 Climate zone 10 - Riverside
CTZ12 Climate zone 12 - Sacramento (Sacramento Executive Airport)
CTZ13 Climate zone 13 - Fresno
CTZ14 Climate zone 14 - Palmdale
CTZ15 Climate zone 15 - Palm Springs
DOE 2.2R Department of Energy, energy simulation software, version 2.2R
DX Direct expansion (refrigeration system)
EER Energy efficiency ratio
EUL Effective useful life
GHG Greenhouse gas
GWP Global warming potential
HFC Hydrofluorocarbon

Measure Information Template Page 146
2013 California Building Energy Efficiency Standards September 2011
HVAC Heating, ventilation, and air-conditioning
IPCC Intergovernmental Panel on Climate Change
IPCC/TEAP Intergovernmental Panel on Climate Change Technology and Assessment
Panel
kW Kilo-watt
kWh Kilo-watt hour
LAC Big box store (with) air-cooled (condenser) central (compressor system)
LAD Big box store (with) air-cooled (condenser) distributed (compressor system)
LCC Life-cycle costing
LEC Big box store (with) evaporative-cooled (condenser) central (compressor
system)
LED Light-emitting diode
LFC Big box store (with) water-cooled (condenser) central (compressor system)
LFD Big box store (with) water-cooled (condenser) distributed (compressor
system)
LSHX Liquid suction heat exchanger
LT Low-temperature
MAC Large (supermarket with) air-cooled (condenser) central (compressor system)
MAD Large (supermarket with) air-cooled (condenser) distributed (compressor
system)
MBH Thousand British thermal units per hour
MEC Large (supermarket with) evaporative-cooled (condenser) central (compressor
system)
MFC Large (supermarket with) water-cooled (condenser) central (compressor
system)
MFD Large (supermarket with) water-cooled (condenser) distributed (compressor
system)
MMBtu Million British thermal units
MMTCO2eq Million metric tons of carbon dioxide equivalents
MT Medium-temperature
MTCO2eq Metric tons of carbon dioxide equivalents
PG&E Pacific Gas and Electric
R-404A Refrigerant 404A, a "nearly azeotropic" blend of hydrofluorocarbons R-143a
(52 wt.%), R-125 (44 wt.%), and R-134a (4 wt.%).

Measure Information Template Page 147
2013 California Building Energy Efficiency Standards September 2011
R-507 Refrigerant 507A, a "nearly azeotropic" blend of hydrofluorocarbons R-143a
(50 wt.%), and R-125 (50 wt.%).
RGT Return gas temperature
SAC Small (supermarket with) air-cooled (condenser) central (compressor system)
SAD Small (supermarket with) air-cooled (condenser) distributed (compressor
system)
SBD Savings By Design
SCAQMD South Coast Air Quality Management District
SCE Southern California Edison
SCT Saturated condensing temperature
SDG&E San Diego Gas and Electric
SEC Small (supermarket with) evaporative-cooled (condenser) central (compressor
system)
SET Saturated evaporating temperature
SF Square foot
SFC Small (supermarket with) water-cooled (condenser) central (compressor
system)
SFD Small (supermarket with) water-cooled (condenser) distributed (compressor
system)
SST Saturated suction temperature
TBD To be determined
TD Temperature difference
TDV Time-dependent valuation
THR Total heat of rejection
TXV Thermostatic expansion valve
U.S. EPA United States Environmental Protection Agency
W Watt
WBT Wet-bulb temperature
ADDITION is any change to a building that increases conditioned floor area and conditioned
volume. Addition is also any change that increases the floor area or volume of an unconditioned
building of an occupancy group or type regulated by Part 6.

Measure Information Template Page 148
2013 California Building Energy Efficiency Standards September 2011
ALTERATION is any change to a building's water-heating system, space-conditioning system,
lighting system, or envelope that is not an addition.
APPLIANCE EFFICIENCY REGULATIONS are the regulations in Title 20, Section 1601 et seq.
of the California Code of Regulations.
BUBBLE POINT. Refrigerant liquid saturation temperature at a specified pressure.
CONDENSER SPECIFIC EFFICIENCY is the Total Heat of Rejection (THR) capacity divided by
the fan input electric power at 100% fan speed (including spray pump electric input power for
evaporative condensers).
COOLER is space greater than or equal to 28°F but less than 55°F.
CLIMATE ZONES are the 16 geographic areas of California for which the Commission has
established typical weather data, prescriptive packages and energy budgets. Climate zone boundary
descriptions are in the document "California Climate Zone Descriptions" (July 1995).
CLOSED-CIRCUIT COOLING TOWER is a closed-circuit cooling tower that utilizes indirect
contact between a heated fluid, typically water or glycol, and the cooling atmosphere to transfer the
source heat load indirectly to the air, essentially combining a heat exchanger and cooling tower into
one relatively compact device.
DEW POINT. Refrigerant vapor saturation temperature at a specified pressure.
FREEZER is space designed to maintain less than 28°F and space designed for convertible between
cooler and freezer operation.
MICRO-CHANNEL CONDENSER is an air-cooled condenser for refrigeration systems which
utilizes multiple small parallel gas flow passages in a flat configuration with unitized fin surface
between the gas passages, rather than round tubes arranged at a right angle to separate plate fins.
REFRIGERANT CONDENSING TEMPERATURE: See SATURATED CONDENSING
TEMPERATURE
REFRIGERATED WAREHOUSE is a building or a space constructed for storage of products,
where mechanical refrigeration is used to maintain the space temperature at 55o F or less.
REFRIGERATED SPACE is a building or a space that is a refrigerated warehouse, walk-in cooler,
or a freezer.
SATURATED CONDENSING TEMPERATURE (CONDENSING TEMPERATURE, or SCT). For single component and azeotropic refrigerants, the saturation temperature corresponding to the
refrigerant pressure at the condenser entrance. For zeotropic refrigerants, the arithmetic average of
the Dew Point and Bubble Point temperatures corresponding to the refrigerant pressure at the
condenser entrance.
THERMOSTATIC EXPANSION VALVE (TXV) is a refrigerant metering valve, installed in an air
conditioner or heat pump, which controls the flow of liquid refrigerant entering the evaporator in
response to the superheat of the gas leaving it.
TIME DEPENDENT VALUATION (TDV) ENERGY is the time varying energy caused to be used
by the building to provide space conditioning and water heating and for specified buildings lighting.
TDV energy accounts for the energy used at the building site and consumed in producing and in

Measure Information Template Page 149
2013 California Building Energy Efficiency Standards September 2011
delivering energy to a site, including, but not limited to, power generation, transmission and
distribution losses.
TOTAL HEAT OF REJECTION (THR) is the heat absorbed at the evaporator plus the heat picked
up in the suction line plus the heat added to the refrigerant in the compressor.

Measure Information Template Page 150
2013 California Building Energy Efficiency Standards September 2011
16. Appendix K: Nonresidential Construction Forecast The Non-Residential construction forecast dataset is data that is published by the California Energy
Commission‘s (CEC) demand forecast office. This demand forecast office is charged with calculating
the required electricity and natural gas supply centers that need to be built in order to meet the new
construction utility loads. Data is sourced from Dodge construction database, the demand forecast
office future generation facility planning data, and building permit office data.
All CASE reports should use the statewide construction forecast for 2014. The TDV savings analysis
is calculated on a 15 or 30 year net present value, so it is correct to use the 2014 construction forecast
as the basis for CASE savings.
The demand generation office publishes this dataset and categorizes the data by demand forecast
climate zones (FCZ) as well as building type (based on NAICS codes). The 16 climate zones are
organized by the generation facility locations throughout California, and differ from the Title 24
building climate zones (BCZ). HMG has reorganized the demand forecast office data using 2000
Census data (population weighted by zip code) and mapped FCZ and BCZ to a given zip code. The
construction forecast data is provided to CASE authors in BCZ in order to calculate Title 24 statewide
energy savings impacts. Though the individual climate zone categories differ between the demand
forecast published by the CEC and the construction forecast, the total construction estimates are
consistent; in other words, HMG has not added to or subtracted from total construction area.
The demand forecast office provides two (2) independent data sets: total construction and additional
construction. Total construction is the sum of all existing floor space in a given category (Small
office, large office, restaurant, etc.). Additional construction is floor space area constructed in a given
year (new construction); this data is derived from the sources mentioned above (Dodge, Demand
forecast office, building permits).
Additional construction is an independent dataset from total construction. The difference between two
consecutive years of total construction is not necessarily the additional construction for the year
because this difference does not take into consideration floor space that was renovated, or repurposed.
In order to further specify the construction forecast for the purpose of statewide energy savings
calculation for Title 24 compliance, HMG has provided CASE authors with the ability to aggregate
across multiple building types. This tool is useful for measures that apply to a portion of various
building types‘ floor space (e.g. skylight requirements might apply to 20% of offices, 50% of
warehouses and 25% of college floor space).
The main purpose of the CEC demand forecast is to estimate electricity and natural gas needs in 2022
(or 10-12 years in the future), and this dataset is much less concerned about the inaccuracy at 12 or 24
month timeframe.
It is appropriate to use the CEC demand forecast construction data as an estimate of future years
construction (over the life of the measure). The CEC non-residential construction forecast is the best
publicly available data to estimate statewide energy savings.
Citation
―NonRes Construction Forecast by BCZ v7‖; Developed by Heschong Mahone Group with data
sourced August, 2010 from Abrishami, Moshen at the California Energy Commission (CEC)

Measure Information Template Page 151
2013 California Building Energy Efficiency Standards September 2011