Case File 1 - Middle Tennessee State...
10
Transcript of Case File 1 - Middle Tennessee State...


� Forensics © �005 TEXAS INSTRUMENTS INCORPORATED � Forensics © �005 TEXAS INSTRUMENTS INCORPORATED
CaseFile1
Tracks of a Killer: Using footprints to estimate height
Analyze the relationships between shoe size, stride length, and height, and then use that information to identify the likely killer.
The body of famous pop music producer Jonathan Wallace was found in his bathtub. It is our hypothesis that an intruder surprised the victim and drowned him. The only clue at the crime scene was a set of muddy footprints leading from a nearby window to the bathroom and back again. The footprints were smeared, so their exact size could not be determined. The soles of the shoes had no pattern. It will be difficult to match the footprints to any particular pair of shoes.
Three suspects were questioned immediately following the murder: Penelope Paige, pop star: 5’4”/green eyes/blond hairPossible motive: She is suing Wallace over the failure of her last album.Rex Chapman, rock guitarist: 5’8”/brown eyes/brown hair Possible motive: He accused Wallace of stealing profits from his hit single “Walk It Off.”Dirty Dawg, rapper: 6’0”/brown eyes/black hair Possible motive: He wants out of a record contract with Wallace.
Victim Jonathan Wallace. Found 2 p.m. on
10/5/05. Time of death estimated at
between 8 and 10 a.m.Footprints presumed to have been left by
the murderer. Prints are 25–30 cm long. Heel-to-heel stride length is 64–65 cm.
� Forensics © �005 TEXAS INSTRUMENTS INCORPORATED � Forensics © �005 TEXAS INSTRUMENTS INCORPORATED © �005 TEXAS INSTRUMENTS INCORPORATED Forensics �
ForensicsObjectives
• determine if there is a relationship between the length of a person’s stride and his or her height• determine if there is a relationship between the size of a person’s shoes and his or her height
ScienceandMathematicsObjectives• efficientlygatherdatatotestforcorrelationsbetweenheight,shoesize,andstridelength• usealinearregressionmodelofthedatatopredictheightbasedonstridelength
Materials• TI-8�/TI-84 PlusTM Family• forstation1:metrictapemeasureormeterstick• forstation2:metricruler• forstation3:metrictapemeasureormeterstick straight walkway at least 10 m long chalkortape
ProcedurePart I: Collecting the Data
1. Setupthreestationswithtwopeopleateach,onepersontocollectdataandonepersontorecorddata.
a) Atstation1,usethetapemeasureormetersticktomeasureeachperson’sheightwithout shoestothenearesthalfcentimeter,andrecord it intheEvidenceRecordnext tothe person’s name.
b) Atstation2,haveeachpersonremovehisorherrightshoe.Turntheshoeoverandusea rulertomeasurethedistancefromthetipofthetoetotheendoftheheel.Recordthe lengthoftheperson’sshoeintheEvidenceRecord.
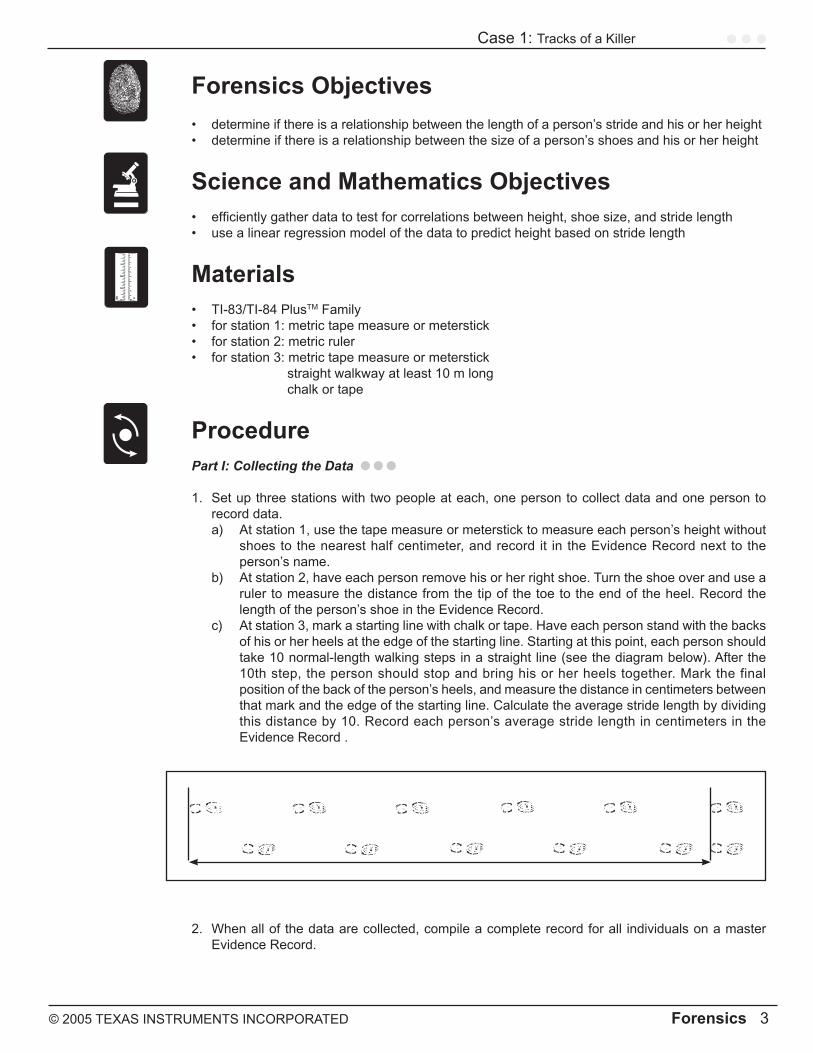
c) Atstation3,markastartinglinewithchalkortape.Haveeachpersonstandwiththebacks ofhisorherheelsattheedgeofthestartingline.Startingatthispoint,eachpersonshould take 10 normal-length walking steps in a straight line (see the diagram below). After the 10th step, the person should stop and bring his or her heels together. Mark the final positionofthebackoftheperson’sheels,andmeasurethedistanceincentimetersbetween thatmarkandtheedgeofthestartingline.Calculatetheaveragestridelengthbydividing thisdistanceby10.Recordeachperson’saveragestridelengthincentimetersinthe EvidenceRecord.
2. Whenallofthedataarecollected,compileacompleterecordforall individualsonamasterEvidenceRecord.
Case 1: TracksofaKiller

4 Forensics © �005 TEXAS INSTRUMENTS INCORPORATED 4 Forensics © �005 TEXAS INSTRUMENTS INCORPORATED
TIP!
TIP!
Part II: Analyzing the Data 3. Enteryourdatainthecalculator. a) Turnthecalculatoron. b) Press .Thiswillbringupthreelists:L1,L2,andL3.Ifthelistscontainold
data,youcanclearthembyhighlightingthelistnumber(usethearrowkeystomove around) and then pressing .
c) Entereachstudent’sheightinL1,shoelengthinL2,andaveragestridelengthinL3.Make sure thatallof thedata foraparticularstudentare in thesamerow.Donot enter the students’namesinthedatalistsinyourcalculator.
UsethearrowkeystomovebetweenL1,L2,andL3.Ifyoumakeamistaketypinginthenumber, highlight the wrong number, press ,andthenkeyinthecorrectnumber.Todeleteanextranumber,press .Thiswilldeletethenumberandmovetheentirerowup.To insert a number, press and then the number.
4. Beginanalyzingthedatabygraphingheightversusstridelength. a) Press . This will take you to the STATPLOTscreen. b) Choose PLOT1 by pressing . c) In theresultingscreen,usethearrowkeystohighlightOn and press . Use the
arrowkeystomovedowntoType.Chooseadot(scatter)plotbyhighlightingthefirstof thepicturedgraphsandpressing .
d) To put the height data on the x-axis,movedowntoXlist. Choose L1 by pressing .
e) To put stride length on the y-axis,movedown toYList. Choose L3 by pressing .
f) Tomarkeachdatapointwithabox,movedowntoMark, use the arrow keys to highlight thebox,andpress .
g) Tosetthegraphscalingvalues,press . h) Choose option 9:ZoomStat toscaletheaxesofthegraphtoshowyourdatacorrectly.
Yourscreenshouldnowchangetoshowagraphofyourdata.
Toselectamenuitem,eitherpressthenumbercorrespondingtothatitemor use the arrow keys to highlight the item and press .
Case 1: TracksofaKiller

4 Forensics © �005 TEXAS INSTRUMENTS INCORPORATED 4 Forensics © �005 TEXAS INSTRUMENTS INCORPORATED © �005 TEXAS INSTRUMENTS INCORPORATED Forensics 5
Thepicturebelowshowsagraphofsomesampledata.(Don’texpectyourdatatolook exactlylikethis!)
Next,youwillusethecalculatortodeterminetheequationforthestraightlinethatfitsyour datathebest.Itisimportanttohaveanequationthatdescribestherelationshipbetween heightandstridelength.Ifyouhaveanequation,youcanpredicttheheightofany person based on the length of the person’s stride.
Thereisaspecifickindofmathematicalformulathatcanbeusedtodeterminetheequation forastraightlinethatbestfitsagroupofdatapoints.Itiscalledalinear regression. In order tousethisformula,wehavetoassumethattherelationshipbetweenheightandstride lengthislinear.Inotherwords,wehavetoassumethatheightandstridelengtharerelated byanequationthatisinthefollowingform:
wheretheaandbareconstants.Itispossibletocalculatetheequationbyhand,butit takesalongtimeandisalittlebittedious.However,yourcalculatorhasaprogramcalled LinRegthatwillcalculatetheaandbforyourdataquickly.
5. Beforeusingthecalculator’sLinRegprogramtocalculatethelinearregression,turnonthe
calculator’sDiagnosticfunction.Thiswilltellthecalculatortocalculatehowwellthelinefitsthedata,inadditiontocalculatingtheaandbvalues.
a) Gotothecalculator’sfunctioncatalogbypressing . b) UsethearrowkeystoscrolldownuntiltheDiagnosticOn option is highlighted, and then
press .Yourscreenshouldlooklikethis:
6. UsetheLinRegfunctiontoperformthelinearregressionandstoretheresultingequationin
variableY1. a) Press , highlight CALC,andchooseoption4:LinReg(ax+b). This will print
LinReg(ax+b)ontheHomescreen. b) Youneedtotellthecalculatorwhereyourdataareandwheretostorethefinalequation.
Youwanttofindthelinethatdescribestherelationshipbetweenheight(listL1)andstride length (list L�). Press totellthecalculatorthatlists L1andL3containthedatathatyouwanttofitalineto.
c) ToindicatethatyouwanttostoretheequationinvariableY1,press toselect Y-VARS. Press totellthecalculatortostoretheequationintheY1 variable.TheMainscreenshouldnowshowthis:LinReg(ax+b)L1,L3,Y1.
Case 1: TracksofaKiller
� Forensics © �005 TEXAS INSTRUMENTS INCORPORATED � Forensics © �005 TEXAS INSTRUMENTS INCORPORATED
TIP!
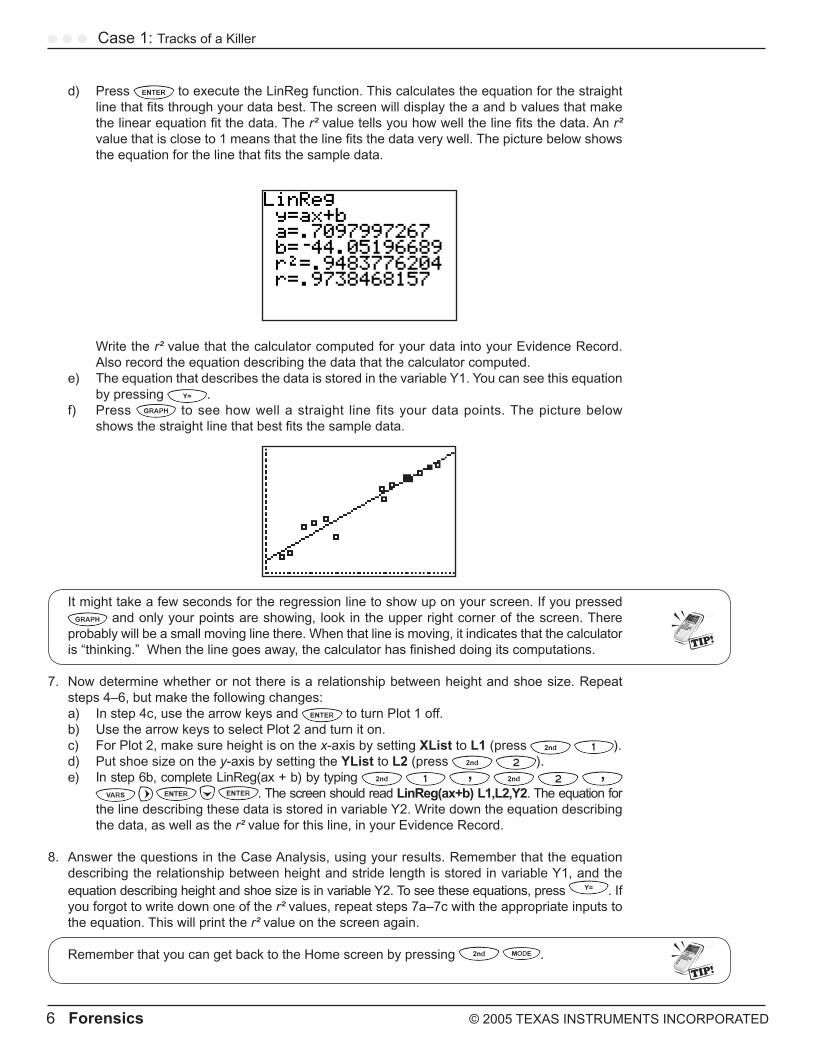
d) Press toexecutetheLinRegfunction.Thiscalculatestheequationforthestraight linethatfitsthroughyourdatabest.Thescreenwilldisplaytheaandbvaluesthatmake thelinearequationfitthedata.Ther²valuetellsyouhowwellthelinefitsthedata.Anr² valuethatiscloseto1meansthatthelinefitsthedataverywell.Thepicturebelowshows theequationforthelinethatfitsthesampledata.
Write the r²valuethatthecalculatorcomputedforyourdataintoyourEvidenceRecord.
Alsorecordtheequationdescribingthedatathatthecalculatorcomputed. e) TheequationthatdescribesthedataisstoredinthevariableY1.Youcanseethisequation
by pressing . f) Press toseehowwellastraight line fitsyourdatapoints.Thepicturebelow
showsthestraightlinethatbestfitsthesampledata.
Itmighttakeafewsecondsfortheregressionlinetoshowuponyourscreen.Ifyoupressedandonlyyourpointsareshowing, lookintheupperrightcornerofthescreen.There
probablywillbeasmallmovinglinethere.Whenthatlineismoving,itindicatesthatthecalculatoris“thinking.”Whenthelinegoesaway,thecalculatorhasfinisheddoingitscomputations.
7. Now determine whether or not there is a relationship between height and shoe size. Repeat
steps4–6,butmakethefollowingchanges: a) Instep4c,usethearrowkeysand to turn Plot 1 off. b) UsethearrowkeystoselectPlot2andturniton. c) ForPlot2,makesureheightisonthex-axisbysettingXList to L1 (press ). d) Put shoe size on the y-axisbysettingtheYList to L2 (press ). e) Instep6b,completeLinReg(ax+b)bytyping
.ThescreenshouldreadLinReg(ax+b)L1,L2,Y2.Theequationfor thelinedescribingthesedataisstoredinvariableY2.Writedowntheequationdescribing the data, as well as the r²valueforthisline,inyourEvidenceRecord.
8. AnswerthequestionsintheCaseAnalysis,usingyourresults.Rememberthattheequation
describingtherelationshipbetweenheightandstridelengthisstoredinvariableY1,andtheequationdescribingheightandshoesizeisinvariableY2.Toseetheseequations,press . If you forgot to write down one of the r²values,repeatsteps7a–7cwiththeappropriateinputstotheequation.Thiswillprintther²valueonthescreenagain.
RememberthatyoucangetbacktotheHomescreenbypressing .
TIP!
Case 1: TracksofaKiller

� Forensics © �005 TEXAS INSTRUMENTS INCORPORATED � Forensics © �005 TEXAS INSTRUMENTS INCORPORATED © �005 TEXAS INSTRUMENTS INCORPORATED Forensics 7
NAME: ______________________________________ DATE: ______________________________________ EvidenceRecord
StudentNameHeight(cm)
(L1)
ShoeLength(cm)(L2)
StrideLength(cm)(L3)
r²valueforheightversusstridelength:_____________________Equationdescribingtherelationshipbetweenheightandstridelength:____________________
r²valueforheightversusshoesize:_________________________Equationdescribingtherelationshipbetweenheightandshoesize:____________________
Case 1: TracksofaKiller

8 Forensics © �005 TEXAS INSTRUMENTS INCORPORATED 8 Forensics © �005 TEXAS INSTRUMENTS INCORPORATED
CaseAnalysis 1. Based on your data, is there a linear relationship between height and stride length?2. Whatisthevalueofr²forthestraightlinethatbestdescribesyourdataforheightversusstride
length?Doyouthinkthestraightlinefitsthesedatawell?�. Based on your data, is there a linear relationship between height and shoe size?4. Doyouthinkthatitispossibletoinferaperson’sheightfromhisorhershoesize?Explainyour
answer.5. Usingtherelationshipbetweenheightandstridelengththatyoucalculated,determinethe
approximateheightsofpeoplewiththefollowingstridelengths:a)75.5cm,b)45.5cm,andc)50.0cm.
6. Usingtherelationshipbetweenheightandstridelengththatyoucalculated,predictthestridelengthofapersonwhoisnotastudentinyourclass(forexample,yourteacher,yourprincipal,orastudentinadifferentclass)basedonhisorherheight.Thenmeasuretheperson’sactualstridelength.Howclosewasyourpredictiontotheactualstridelength?
7. Supposeyoumeasurethestride lengthofasetof footprints,youpredict that thepersonwhomade the footprints is175cmtall,andyou laterfindout that thepersonwhomadethefootprintsisactuallyonly152cmtall.Giveonepossiblereasonthatyourpredictionwas incorrect.
8. Usingtherelationshipsthatyoucalculated,determinewhichofthethreesuspectsmostlikelyleftthefootprintstoandfromJonathanWallace’sbathroom.Showallyourcalculations.(Hint:Intheequationthatyouwrotedown,x is stride length and y is height.)
CRIME SCENE DO NOT CROSS CRIME SCENE DO NOT CROSS
CRIME SCENE DO NOT CROSS CRIME SCENE DO NOT CROSSCRIME SCENE DO NOT CROSS CRIME SCENE DO NOT CROSS
Case 1: TracksofaKiller

8 Forensics © �005 TEXAS INSTRUMENTS INCORPORATED 8 Forensics © �005 TEXAS INSTRUMENTS INCORPORATED © �005 TEXAS INSTRUMENTS INCORPORATED Forensics �
Case File 1 Tracks of a Killer: Using footprints to estimate height
TeacherNotes
Teachingtime:oneclassperiod
This lab introducestheconceptsof linearregressionand r²valuesthroughananalysisof therelationship between stride length, shoe size, and height.
Tips
• Havingthreestationsmaynotworkwellwithsomeclassesbecausethestudentswillspendsometimewaitingforotherstohavemeasurementstaken.Youmaywanttobreakuptheclassintogroupsofthreeorfourstudents;eachgroupwillmakeallthreemeasurements.
• MakeatransparencyoftheEvidenceRecordtabletobeusedasamasterEvidenceRecord.Studentscanrecordtheirindividualdataonthetransparency,andthentheycanallcopythecompileddataintotheirownEvidenceRecords.
Modifications
Iftimeisshortorstudentsarelessadvanced,steps1band7,aswellasCaseAnalysisquestions3and4,canbeeliminated.
SampleData
Case 1: TracksofaKiller
StudentNameHeight(cm)
(L1)
ShoeLength(cm)(L2)
StrideLength(cm)(L3)
Student 1 14�.5 ��.0 58.0Student � 158.5 �5.5 70.5Student � 18�.5 �8.0 88.0Student 4 17�.5 ��.0 8�.0Student 5 180.0 �0.5 85.0Student � 1�1.0 �5.5 �4.5Student 7 174.0 �8.0 77.5Student 8 18�.0 �8.5 8�.0Student � 181.5 ��.5 84.5
Student 10 184.0 �0.0 8�.5Student 11 14�.0 ��.0 5�.5Student 1� 15�.5 �4.0 �8.0Student 1� 155.5 ��.0 ��.5Student 14 17�.5 �4.5 81.0Student 15 181.0 �0.0 85.0
CRIME SCENE DO NOT CROSS CRIME SCENE DO NOT CROSS
CRIME SCENE DO NOT CROSS CRIME SCENE DO NOT CROSSCRIME SCENE DO NOT CROSS CRIME SCENE DO NOT CROSS

10 Forensics © �005 TEXAS INSTRUMENTS INCORPORATED
r²valueforheightversusstridelength:0.948 Equationdescribingtherelationshipbetweenheightandstridelength: y=0.7098x-44.05
r²valueforheightversusshoesize: 0.409Equationdescribingtherelationshipbetweenheightandshoesize: y=0.1206x+5.703
CaseAnalysisAnswers
1. Based on your data, is there a linear relationship between height and stride length? There should be a clear linear relationship between height and stride length. The data
points should fall on a fairly straight line.2. Whatisthevalueofr²forthestraightlinethatbestdescribesyourdataforheightversusstride
length?Doyouthinkthestraightlinefitsthesedatawell? The r² values should be fairly close to 1 (0.95 or 0.90 is acceptable). If the values are
significantly lower than this, it is possible that the students entered incorrect data or that their measurements were inaccurate.
�. Based on your data, is there a linear relationship between height and shoe size? There should not be a clearly linear relationship between height and shoe size.4. Doyouthinkthatitispossibletoinferaperson’sheightfromhisorhershoesize?Explainyour
answer. No, it is generally not possible to predict a person’s height from his or her shoe size.5. Usingtherelationshipbetweenheightandstridelengththatyoucalculated,determinethe
approximateheightsofpeoplewith the followingstride lengths:a)75.5cm,b)45.5cm, andc)50.0cm.
Answers will vary depending on calculated height–stride-length equations.6. Usingtherelationshipbetweenheightandstridelengththatyoucalculated,predictthestride
lengthofapersonwhoisnotastudentinyourclass(forexample,yourteacher,yourprincipal,orastudentinadifferentclass)basedonhisorherheight.Thenmeasuretheperson’sactualstridelength.Howclosewasyourpredictiontotheactualstridelength?
Answers will vary.7. Supposeyoumeasurethestridelengthofasetoffootprints,youpredictthatthepersonwho
madethefootprintsis175cmtall,andyoulaterfindoutthatthepersonwhomadethefootprintsisactuallyonly152cmtall.Giveonepossiblereasonthatyourpredictionwasincorrect.
Possible reasons for incorrect predictions of height include the following: the person was running or was taking larger or smaller steps than usual, the person’s normal stride does not follow the usual trend, and the stride length was measured incorrectly.
8. Usingtherelationshipsthatyoucalculated,determinewhichofthethreesuspectsmostlikelyleftthefootprintstoandfromJonathanWallace’sbathroom.Showallyourcalculations.(Hint:Intheequationthatyouwrotedown,x is stride length and y is height.)
Answers will vary; based on the sample data here, Penelope Paige most likely left the footprints (her height is closest to the calculated height of 5 ft).
Case 1: TracksofaKiller
stride length 0.7098 (height) 44.05
stride length 44.05 64.5 44.05height
0.7098 0.7098152.9 cm = 60 in
= −+ += =
=