CASCADES INC. · 2020-01-27 · 1 Based on Street’s EBITDA estimates $436 million for 2016 and...
39
CASCADES INC. Institutional Investor Roadshow – Boston & NYC September 19-20, 2016
Transcript of CASCADES INC. · 2020-01-27 · 1 Based on Street’s EBITDA estimates $436 million for 2016 and...

CASCADES INC.
Institutional Investor Roadshow – Boston & NYC
September 19-20, 2016

DISCLAIMER
2
Certain statements in this presentation, including statements regarding future results and performance, are forward-lookingstatements within the meaning of securities legislation based on current expectations. The accuracy of such statements issubject to a number of risks, uncertainties and assumptions that may cause actual results to differ materially from thoseprojected, including, but not limited to, the effect of general economic conditions, decreases in demand for Cascades Inc.’s(“Cascades,” “CAS,” the “Company,” the “Corporation,” “us” or “we”) products, the prices and availability of raw materials,changes in the relative values of certain currencies, fluctuations in selling prices and adverse changes in general market andindustry conditions. This presentation may also include price indices as well as variance and sensitivity analyses that areintended to provide the reader with a better understanding of the trends related to our business activities. These items are basedon the best estimates available to the Company.
The financial information included in this presentation also contains certain data that are not measures of performance underIFRS (“non-IFRS measures”). For example, the Company uses operating income before depreciation and amortization (“OIBD”which, for purposes of this presentation, we call “EBITDA”) and operating income before depreciation and amortization(excluding specific items) (“OIBD (excluding specific items)” which, for purposes of this presentation, we call “EBITDA (excludingspecific items)”) because such measures are used by management to assess the operating and financial performance of theCompany’s operating segments. Such information is reconciled to the most directly comparable financial measures, as set forthin the “Supplemental Information on Non-IFRS Measures” section of our most recent quarterly report or annual report.
Specific items are defined as items such as charges for or reversal of impairment of assets, for facility or machine closures,accelerated depreciation of assets due to restructuring measures, premiums paid on long-term debt refinancing, loss onrefinancing of long-term debt, gains or losses on sales of business units, unrealized gains or losses on derivative financialinstruments that do not qualify for hedge accounting, unrealized gains or losses on interest rate swaps, foreign exchange gainsor losses on long-term debt, other significant items of an unusual or non-recurring nature, and all such items included indiscontinued operations or in the share of results of our associates and joint ventures.
All amounts in this presentation are in Canadian dollars unless otherwise indicated.
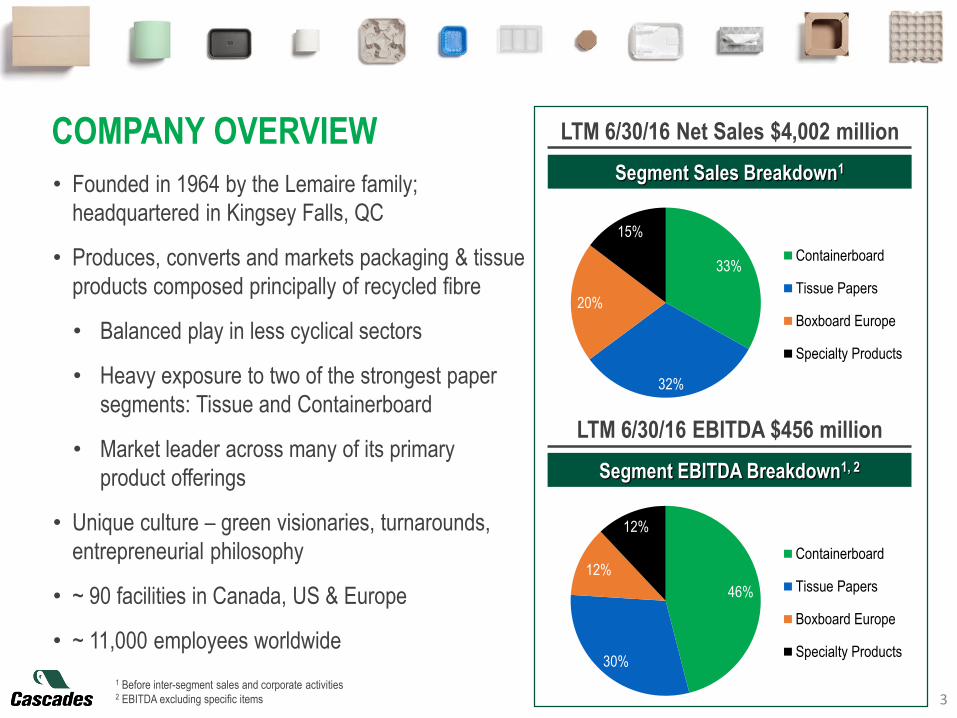
46%
30%
12%
12%
Containerboard
Tissue Papers
Boxboard Europe
Specialty Products
33%
32%
20%
15%
Containerboard
Tissue Papers
Boxboard Europe
Specialty Products
Segment Sales Breakdown1
COMPANY OVERVIEW
3
• Founded in 1964 by the Lemaire family;
headquartered in Kingsey Falls, QC
• Produces, converts and markets packaging & tissue
products composed principally of recycled fibre
• Balanced play in less cyclical sectors
• Heavy exposure to two of the strongest paper
segments: Tissue and Containerboard
• Market leader across many of its primary
product offerings
• Unique culture – green visionaries, turnarounds,
entrepreneurial philosophy
• ~ 90 facilities in Canada, US & Europe
• ~ 11,000 employees worldwide
1 Before inter-segment sales and corporate activities2 EBITDA excluding specific items
LTM 6/30/16 Net Sales $4,002 million
Segment EBITDA Breakdown1, 2
LTM 6/30/16 EBITDA $456 million
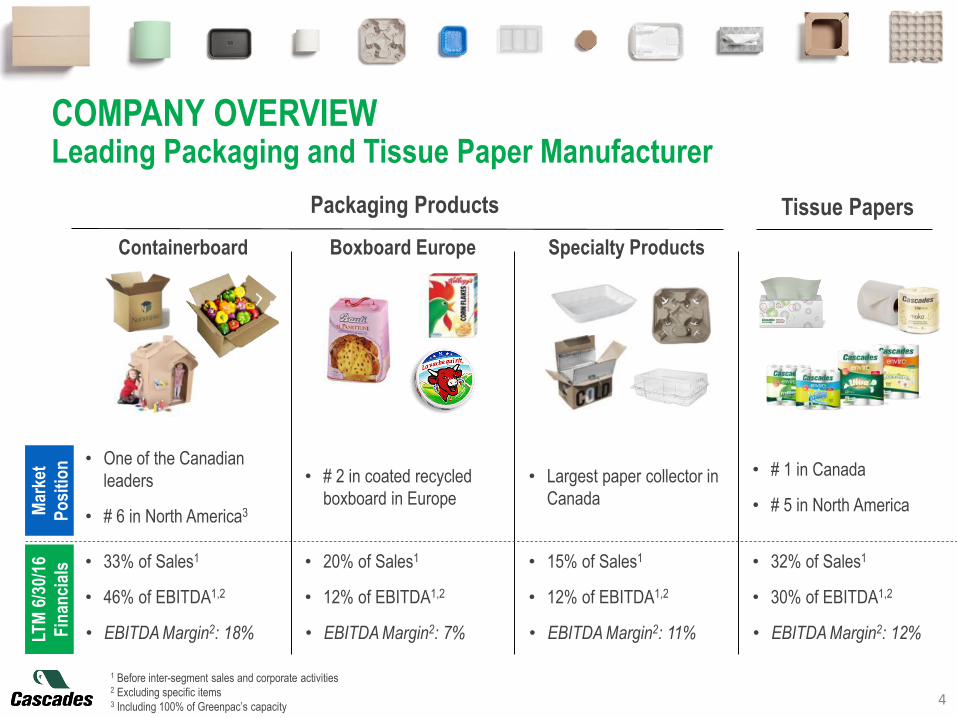
COMPANY OVERVIEWLeading Packaging and Tissue Paper Manufacturer
4
Packaging Products
Containerboard
Tissue Papers
Boxboard Europe Specialty Products
Mar
ket
Po
siti
on • One of the Canadian
leaders
• # 6 in North America3
• # 2 in coated recycled
boxboard in Europe
• Largest paper collector in
Canada
• # 1 in Canada
• # 5 in North America
LTM
6/3
0/16
Fin
anci
als • 33% of Sales1
• 46% of EBITDA1,2
• EBITDA Margin2: 18%
• 20% of Sales1
• 12% of EBITDA1,2
• EBITDA Margin2: 7%
• 15% of Sales1
• 12% of EBITDA1,2
• EBITDA Margin2: 11%
• 32% of Sales1
• 30% of EBITDA1,2
• EBITDA Margin2: 12%
1 Before inter-segment sales and corporate activities2 Excluding specific items3 Including 100% of Greenpac’s capacity
5
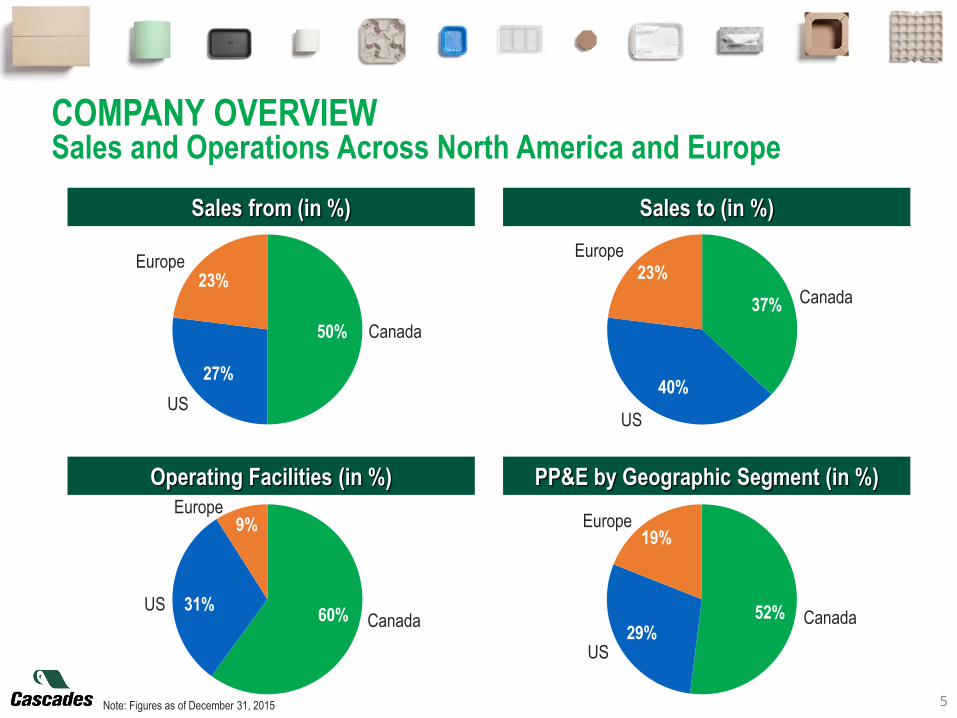
23%Europe
Canada50%
US
27%
23%
Europe
Canada37%
US
40%
9%Europe
Canada60%US 31%
19%Europe
Canada52%
US29%
Sales from (in %) Sales to (in %)
Operating Facilities (in %) PP&E by Geographic Segment (in %)
Note: Figures as of December 31, 2015
COMPANY OVERVIEWSales and Operations Across North America and Europe
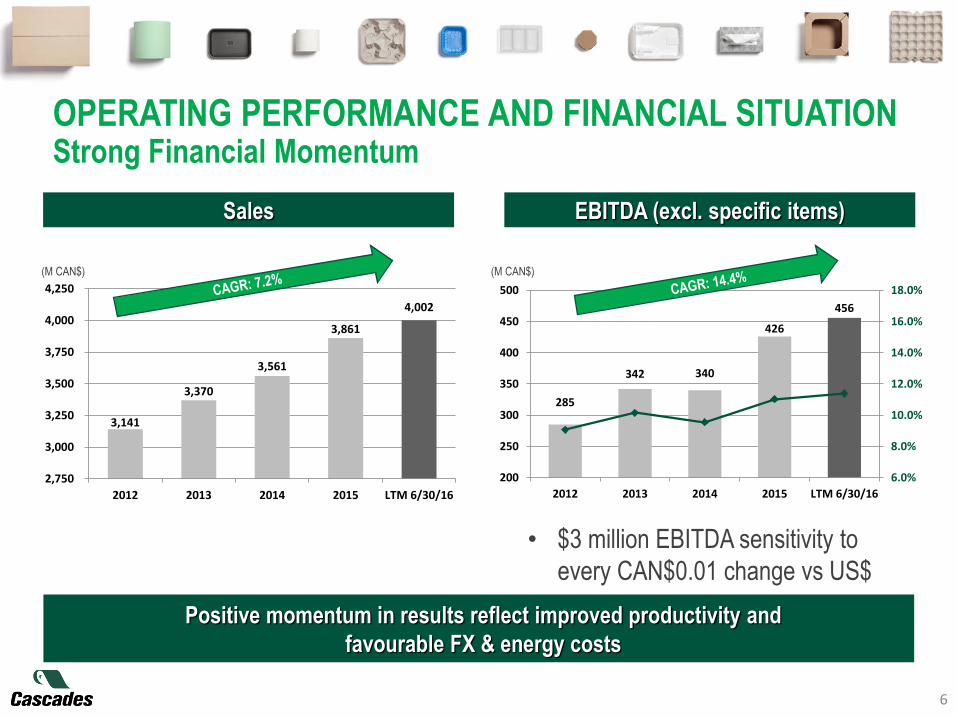
285
342 340
426
456
6.0%
8.0%
10.0%
12.0%
14.0%
16.0%
18.0%
200
250
300
350
400
450
500
2012 2013 2014 2015 LTM 6/30/16
3,141
3,370
3,561
3,861
4,002
2,750
3,000
3,250
3,500
3,750
4,000
4,250
2012 2013 2014 2015 LTM 6/30/16
OPERATING PERFORMANCE AND FINANCIAL SITUATIONStrong Financial Momentum
6
Sales EBITDA (excl. specific items)
(M CAN$) (M CAN$)
• $3 million EBITDA sensitivity to
every CAN$0.01 change vs US$
Positive momentum in results reflect improved productivity and
favourable FX & energy costs
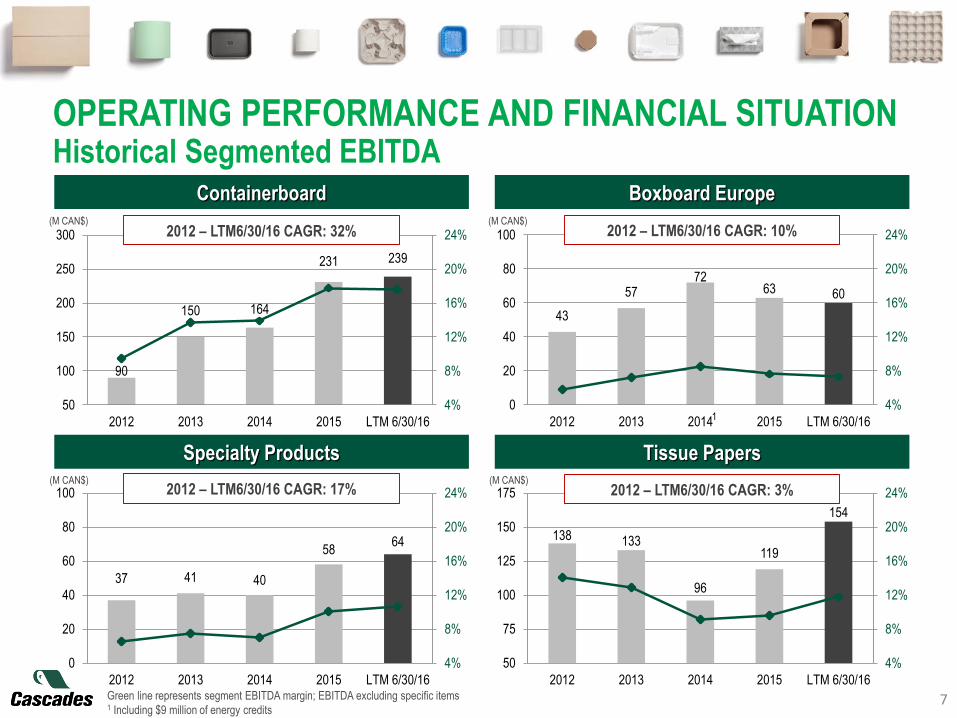
138 133
96
119
154
4%
8%
12%
16%
20%
24%
50
75
100
125
150
175
2012 2013 2014 2015 LTM 6/30/16
37 41 40
5864
4%
8%
12%
16%
20%
24%
0
20
40
60
80
100
2012 2013 2014 2015 LTM 6/30/16
43
5772
63 60
4%
8%
12%
16%
20%
24%
0
20
40
60
80
100
2012 2013 2014 2015 LTM 6/30/16
90
150 164
231 239
4%
8%
12%
16%
20%
24%
50
100
150
200
250
300
2012 2013 2014 2015 LTM 6/30/16
OPERATING PERFORMANCE AND FINANCIAL SITUATIONHistorical Segmented EBITDA
7
Containerboard Boxboard Europe
Specialty Products Tissue Papers
(M CAN$) (M CAN$)
(M CAN$) (M CAN$)2012 – LTM6/30/16 CAGR: 17% 2012 – LTM6/30/16 CAGR: 3%
2012 – LTM6/30/16 CAGR: 32% 2012 – LTM6/30/16 CAGR: 10%
1
Green line represents segment EBITDA margin; EBITDA excluding specific items1 Including $9 million of energy credits
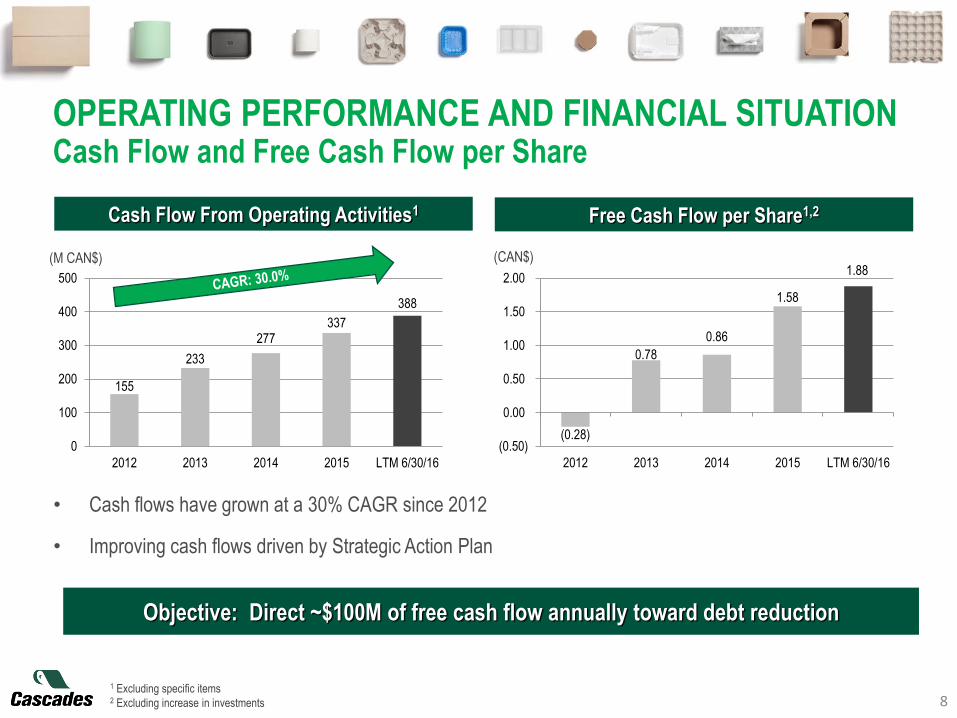
(0.28)
0.78
0.86
1.58
1.88
(0.50)
0.00
0.50
1.00
1.50
2.00
2012 2013 2014 2015 LTM 6/30/16
155
233
277337
388
0
100
200
300
400
500
2012 2013 2014 2015 LTM 6/30/16
1 Excluding specific items2 Excluding increase in investments 8
Objective: Direct ~$100M of free cash flow annually toward debt reduction
OPERATING PERFORMANCE AND FINANCIAL SITUATIONCash Flow and Free Cash Flow per Share
Free Cash Flow per Share1,2Cash Flow From Operating Activities1
• Cash flows have grown at a 30% CAGR since 2012
• Improving cash flows driven by Strategic Action Plan
(M CAN$) (CAN$)
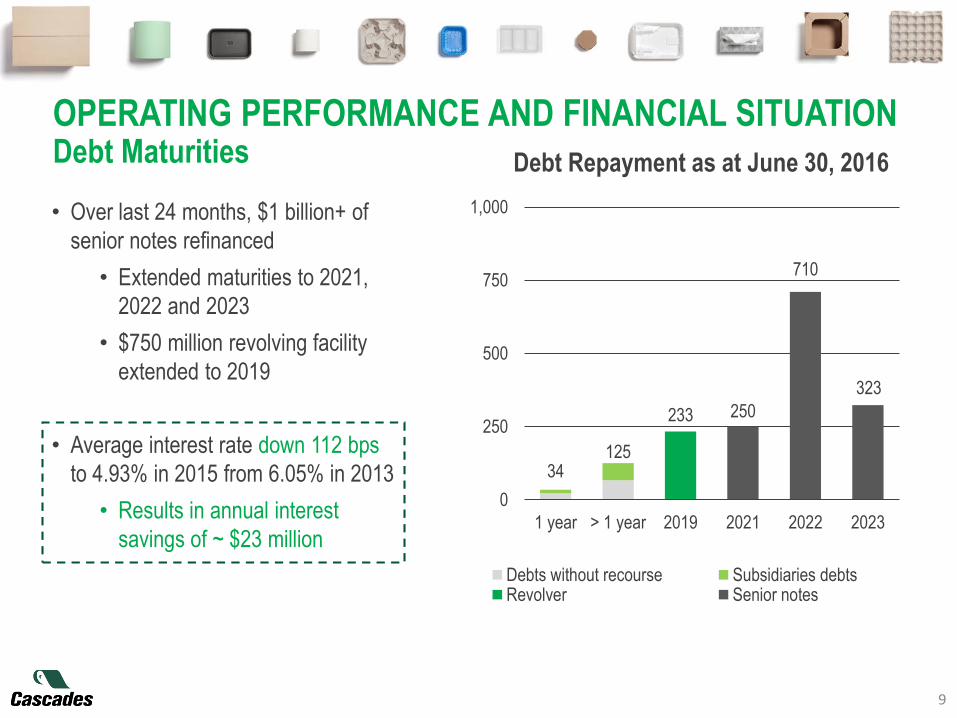
OPERATING PERFORMANCE AND FINANCIAL SITUATIONDebt Maturities
9
• Over last 24 months, $1 billion+ of
senior notes refinanced
• Extended maturities to 2021,
2022 and 2023
• $750 million revolving facility
extended to 2019
• Average interest rate down 112 bps
to 4.93% in 2015 from 6.05% in 2013
• Results in annual interest
savings of ~ $23 million
34125
233 250
710
323
0
250
500
750
1,000
1 year > 1 year 2019 2021 2022 2023
Debts without recourse Subsidiaries debtsRevolver Senior notes
Debt Repayment as at June 30, 2016
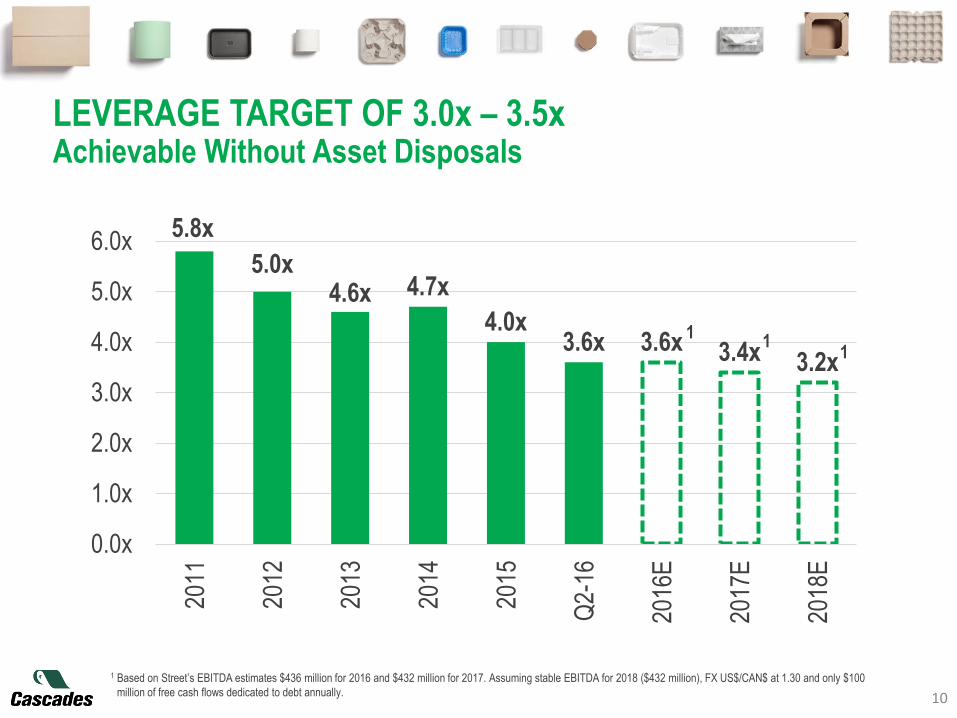
5.8x
5.0x4.6x 4.7x
4.0x3.6x 3.6x 3.4x 3.2x
0.0x
1.0x
2.0x
3.0x
4.0x
5.0x
6.0x
2011
2012
2013
2014
2015
Q2-
16
2016
E
2017
E
2018
E
10
1 Based on Street’s EBITDA estimates $436 million for 2016 and $432 million for 2017. Assuming stable EBITDA for 2018 ($432 million), FX US$/CAN$ at 1.30 and only $1001 million of free cash flows dedicated to debt annually.
LEVERAGE TARGET OF 3.0x – 3.5xAchievable Without Asset Disposals
11
1

60%
70%
80%
90%
100%
Q22009
Q22010
Q22011
Q22012
Q22013
Q22014
Q22015
Q22016
North American Containerboard Producers
36.0
42.0
40.0
44.0
38.0
0.6
2016e
41.2
New
capacity
0.5
39.8
2014
0.9
New
capacity
40.7
2015e 2018e
42.6
New
capacity
0.8
2017e
41.8
New
capacity
CONTAINERBOARD PACKAGING GROUPEnvironment Still Sound
11
Fundamentals Sound Despite Added Capacity
Industry Operating Rates and Expected Capacity2
(Million s.t.)
% of total capacity
IP 33%
WestRock 19%
GP 10%
PCA 10%
Kapstone 4%
Cascades 4%
Pratt 4%
Others 16%
Top-5 Producers 76%
2015 Industry Participants
Source: RISI, Deutsche Bank, Company reports and estimates1 Including 59.7% of Greenpac’s total capacity2 New capacity, net of capacity shutdowns
2 SP Fiber
PCA D3 Yr 2
Pratt Yr 1
Greif Yr 1
IP Valliant Yr 1
Productivity 0.8%
Pratt Yr 2
Greif Yr 2
IP Valliant Yr 2
SP Fiber Yr 2
Corr. Supplies
Productivity 0.8%
1
(Operating rate)
Kruger Yr 1
Corr. Sup. Yr 1
Productivity 0.8%
Kruger Yr 2
Corr. Sup. Yr 2
Productivity 0.8%
(+2.3%) (+1.2%) (+1.5%) (+1.9%)
Cascades EBITDA increases ~$2.5M with
every 1% increase in our utilization rate
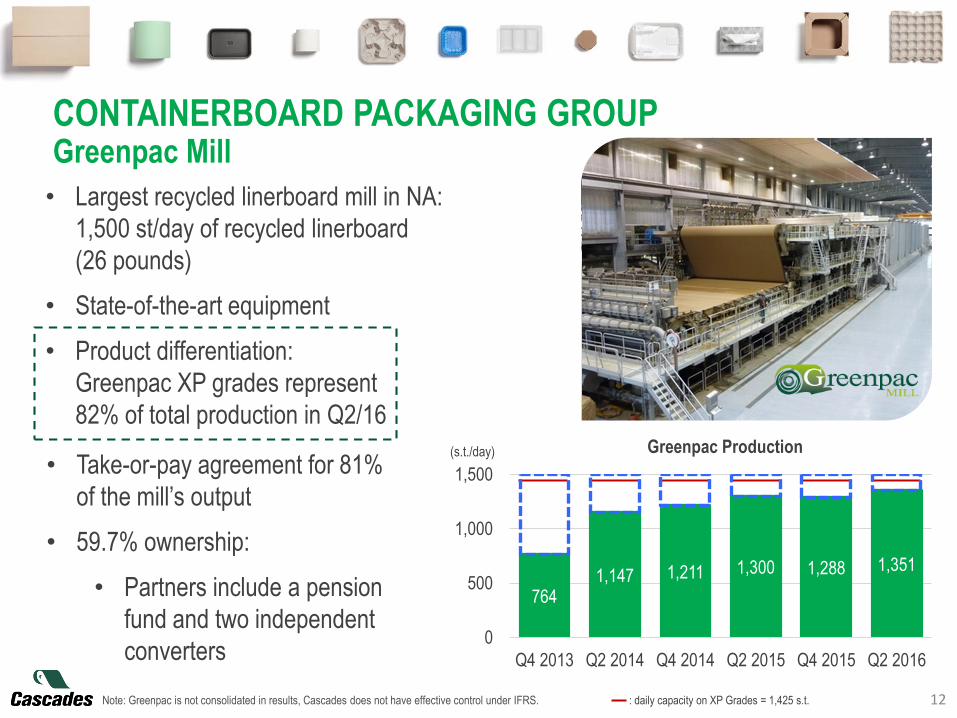
• Largest recycled linerboard mill in NA:
1,500 st/day of recycled linerboard
(26 pounds)
• State-of-the-art equipment
• Product differentiation:
Greenpac XP grades represent
82% of total production in Q2/16
CONTAINERBOARD PACKAGING GROUPGreenpac Mill
12Note: Greenpac is not consolidated in results, Cascades does not have effective control under IFRS. : daily capacity on XP Grades = 1,425 s.t.
• Take-or-pay agreement for 81%
of the mill’s output
• 59.7% ownership:
• Partners include a pension
fund and two independent
converters
(s.t./day) Greenpac Production
7641,147 1,211 1,300 1,288 1,351
0
500
1,000
1,500
Q4 2013 Q2 2014 Q4 2014 Q2 2015 Q4 2015 Q2 2016
9,258 9,720 9,943 10,290462 223 347
0
2,500
5,000
7,500
10,000
12,500
2012 Newcapacity
2014 Newcapacity
2016e Newcapacity
2018e
80
100
120
140
160
1996 2000 2004 2008 2012 2016e
Inde
xed
U.S
. Tis
sue
Dem
and
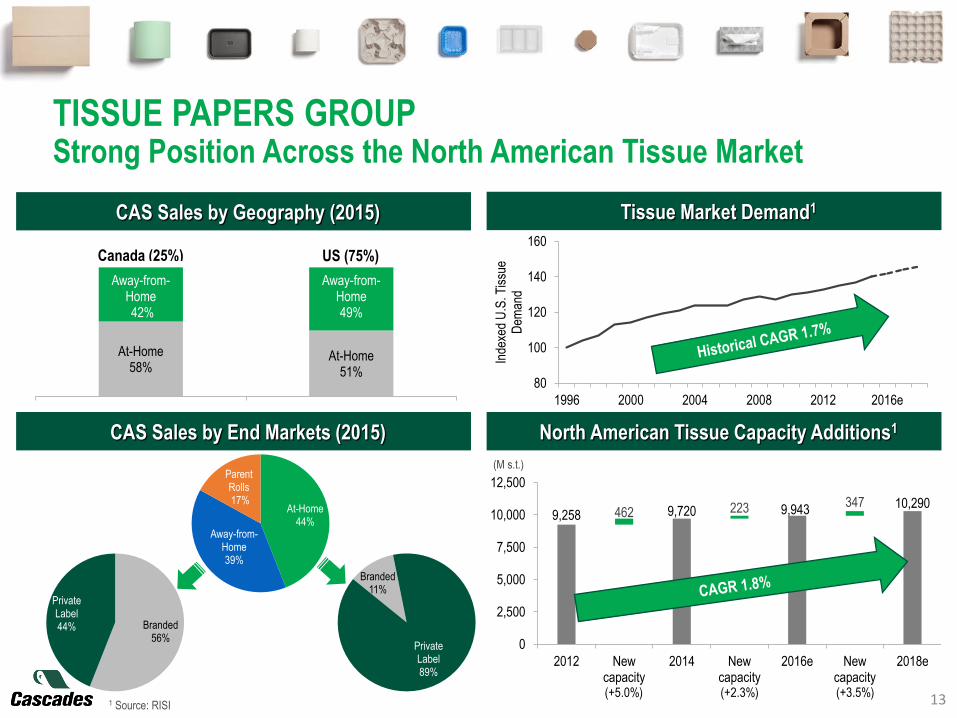
At-Home58%
At-Home51%
Away-from-Home42%
Away-from-Home49%
Canada (25%) US (75%)
At-Home44%
Away-from-Home39%
Parent Rolls17%
Branded56%
Private Label44%
Branded11%
Private Label89%
TISSUE PAPERS GROUPStrong Position Across the North American Tissue Market
131 Source: RISI
CAS Sales by Geography (2015)
CAS Sales by End Markets (2015)
Tissue Market Demand1
North American Tissue Capacity Additions1
(M s.t.)
(+5.0%) (+2.3%) (+3.5%)
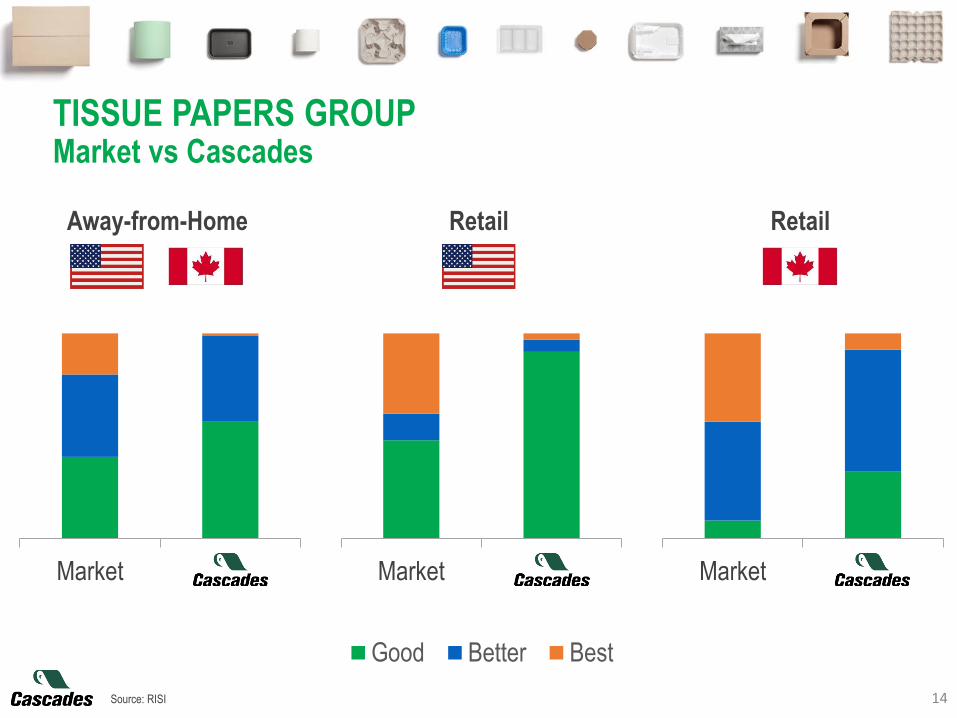
MarketMarket
Market
Good Better Best
Market
14Source: RISI
TISSUE PAPERS GROUPMarket vs Cascades
Away-from-Home Retail Retail
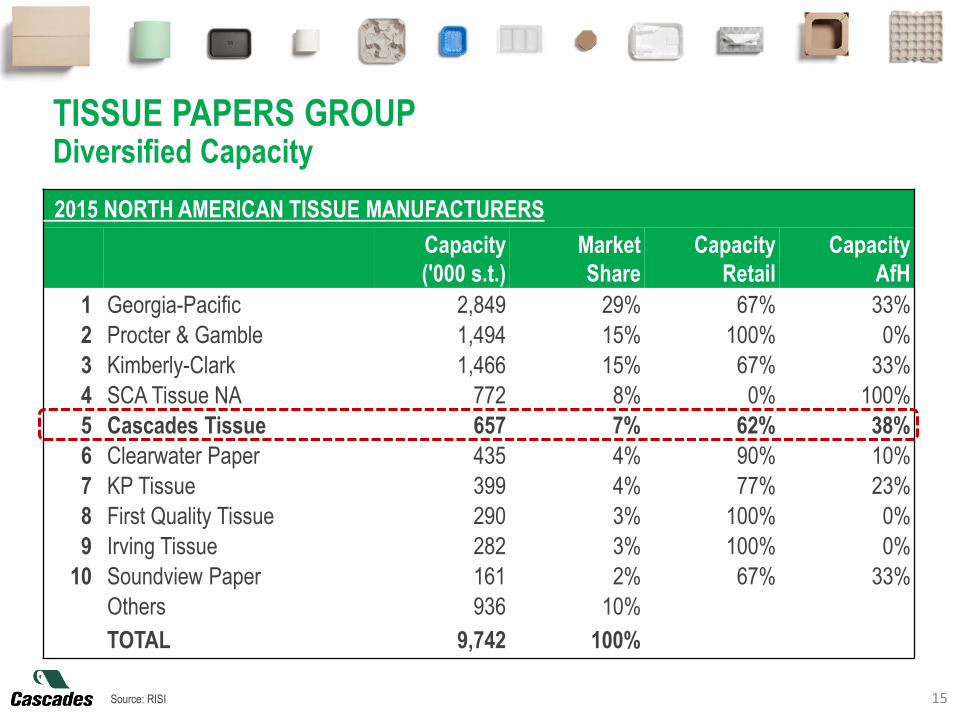
15
2015 NORTH AMERICAN TISSUE MANUFACTURERS
Capacity
('000 s.t.)
Market
Share
Capacity
Retail
Capacity
AfH
1 Georgia-Pacific 2,849 29% 67% 33%
2 Procter & Gamble 1,494 15% 100% 0%
3 Kimberly-Clark 1,466 15% 67% 33%
4 SCA Tissue NA 772 8% 0% 100%
5 Cascades Tissue 657 7% 62% 38%
6 Clearwater Paper 435 4% 90% 10%
7 KP Tissue 399 4% 77% 23%
8 First Quality Tissue 290 3% 100% 0%
9 Irving Tissue 282 3% 100% 0%
10 Soundview Paper 161 2% 67% 33%
Others 936 10%
TOTAL 9,742 100%
Source: RISI
TISSUE PAPERS GROUPDiversified Capacity
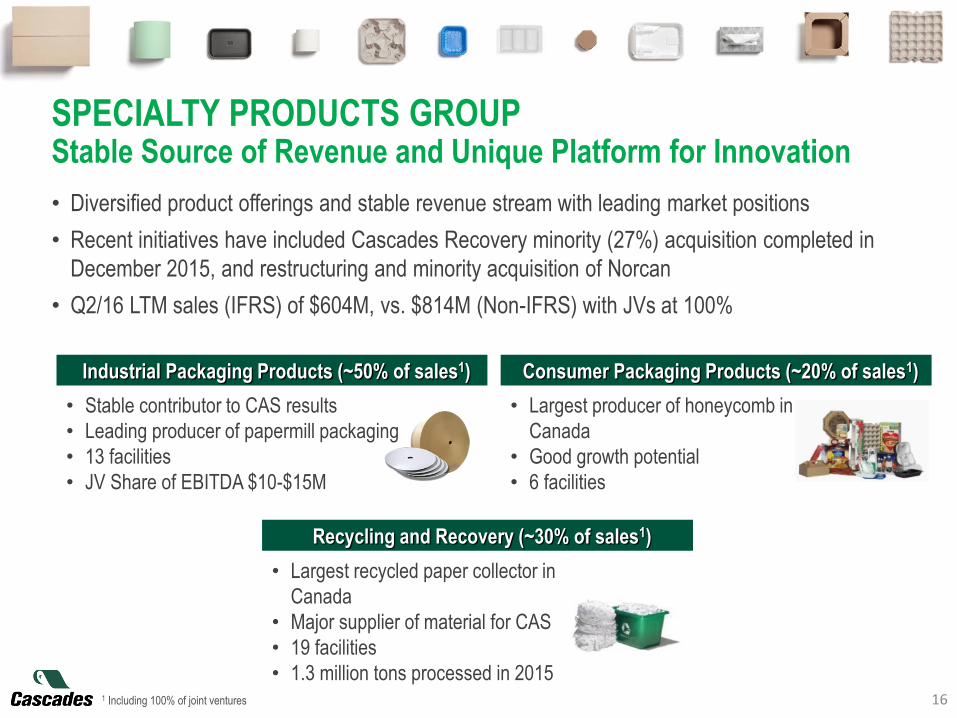
SPECIALTY PRODUCTS GROUPStable Source of Revenue and Unique Platform for Innovation
16
• Largest recycled paper collector in
Canada
• Major supplier of material for CAS
• 19 facilities
• 1.3 million tons processed in 2015
• Largest producer of honeycomb in
Canada
• Good growth potential
• 6 facilities
• Stable contributor to CAS results
• Leading producer of papermill packaging
• 13 facilities
• JV Share of EBITDA $10-$15M
• Diversified product offerings and stable revenue stream with leading market positions
• Recent initiatives have included Cascades Recovery minority (27%) acquisition completed in
December 2015, and restructuring and minority acquisition of Norcan
• Q2/16 LTM sales (IFRS) of $604M, vs. $814M (Non-IFRS) with JVs at 100%
Recycling and Recovery (~30% of sales1)
Consumer Packaging Products (~20% of sales1)Industrial Packaging Products (~50% of sales1)
1 Including 100% of joint ventures
17
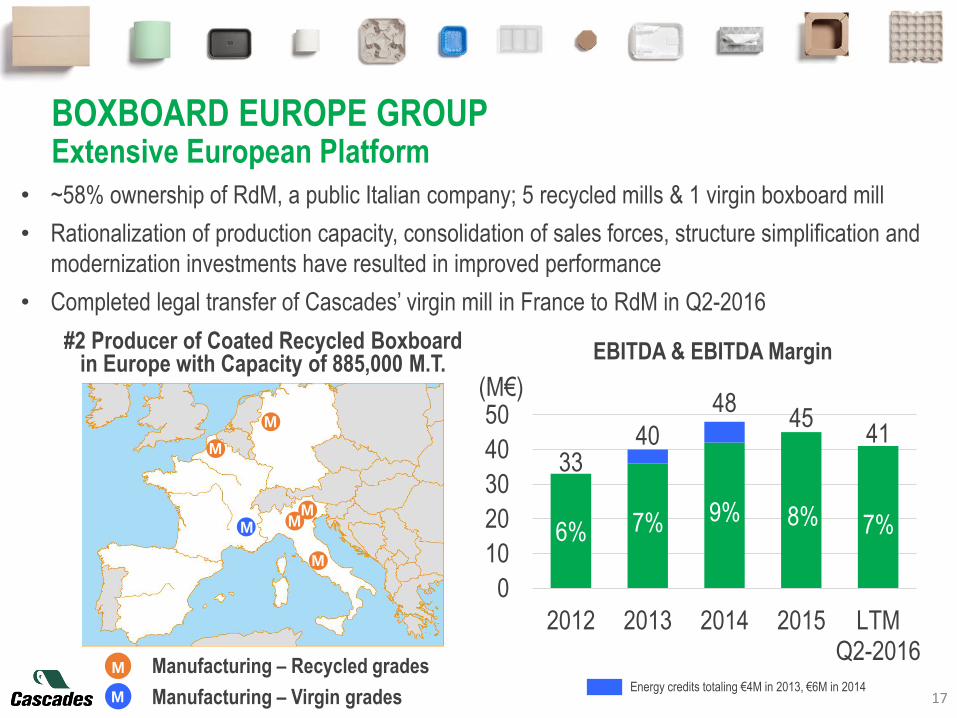
• ~58% ownership of RdM, a public Italian company; 5 recycled mills & 1 virgin boxboard mill
• Rationalization of production capacity, consolidation of sales forces, structure simplification and
modernization investments have resulted in improved performance
• Completed legal transfer of Cascades’ virgin mill in France to RdM in Q2-2016
M
Manufacturing – Recycled grades
Manufacturing – Virgin grades
M
M MM
M
M
M
#2 Producer of Coated Recycled Boxboard in Europe with Capacity of 885,000 M.T.
EBITDA & EBITDA Margin
Energy credits totaling €4M in 2013, €6M in 2014
6% 7% 9% 8% 7%
3340
4845
41
0
10
20
30
40
50
2012 2013 2014 2015 LTMQ2-2016
(M€)
BOXBOARD EUROPE GROUPExtensive European Platform

18
OUR FOUR STRATEGIC PRIORITIES
MODERNIZE
core operations through
focused investments
Status: Ongoing
OPTIMIZE
capital allocation and
reduce working capital
Status: Ongoing
RESTRUCTURE
underperforming units
Status: Well-advanced
INNOVATE
to improve and develop
processes and products
Status: Continuous
1 2
3 4
19
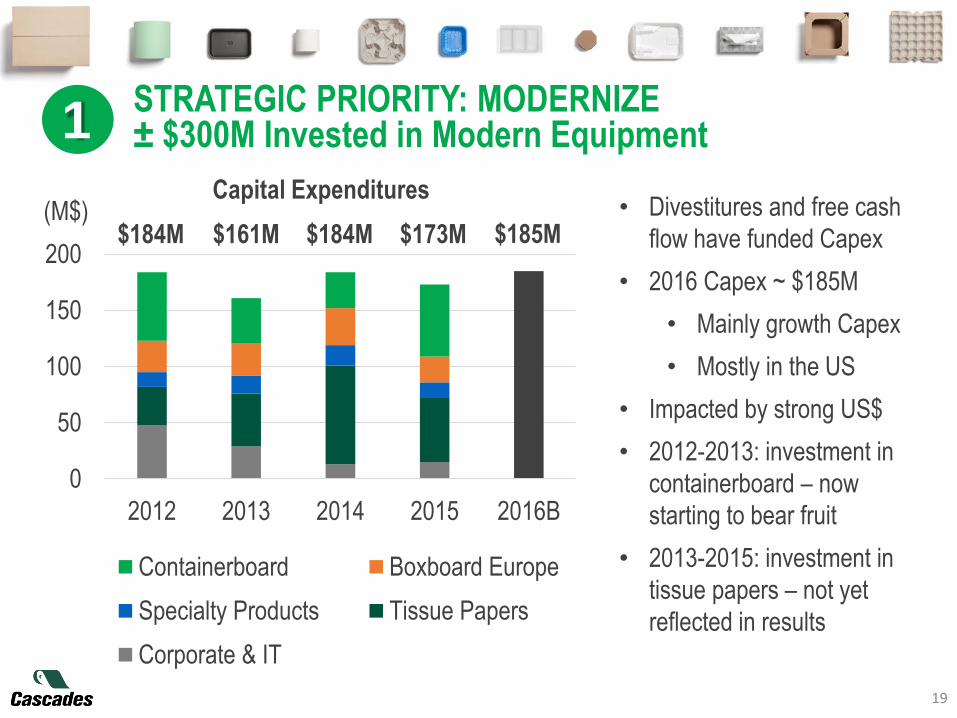
STRATEGIC PRIORITY: MODERNIZE± $300M Invested in Modern Equipment
0
50
100
150
200
2012 2013 2014 2015 2016B
(M$)
Containerboard Boxboard Europe
Specialty Products Tissue Papers
Corporate & IT
Capital Expenditures• Divestitures and free cash
flow have funded Capex
• 2016 Capex ~ $185M
• Mainly growth Capex
• Mostly in the US
• Impacted by strong US$
• 2012-2013: investment in
containerboard – now
starting to bear fruit
• 2013-2015: investment in
tissue papers – not yet
reflected in results
$184M $161M $184M $173M $185M
1
20
C
M
C
CM
M C
M
C
M
MM
C
M
C
C
C
CMC
CM
CM
C
C
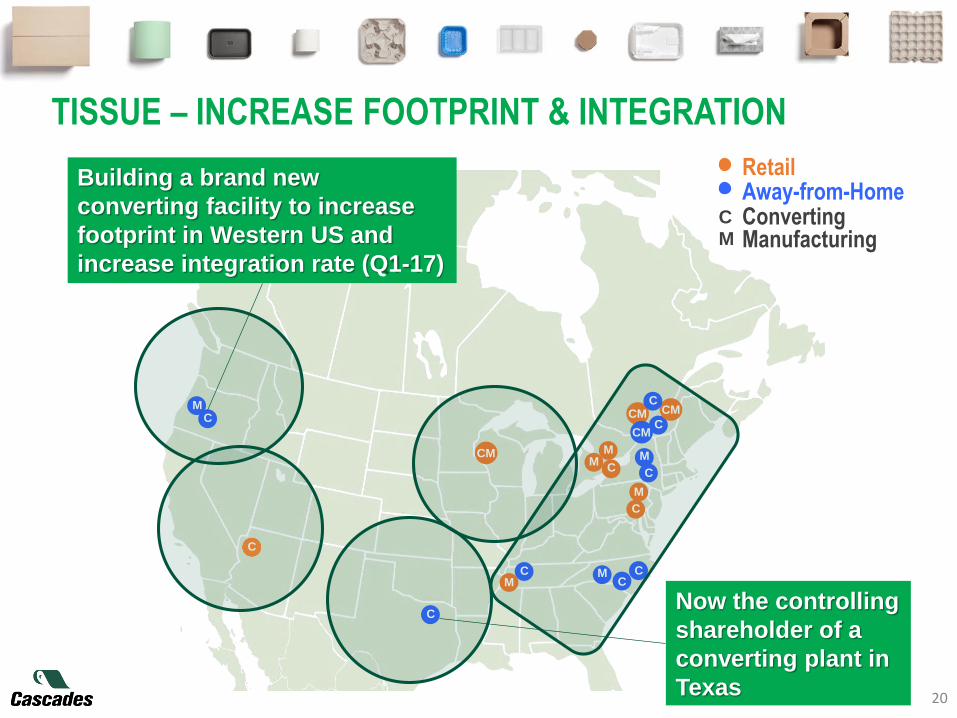
Now the controlling
shareholder of a
converting plant in
Texas
Building a brand new
converting facility to increase
footprint in Western US and
increase integration rate (Q1-17)
RetailAway-from-Home
ManufacturingConverting
MC
TISSUE – INCREASE FOOTPRINT & INTEGRATION
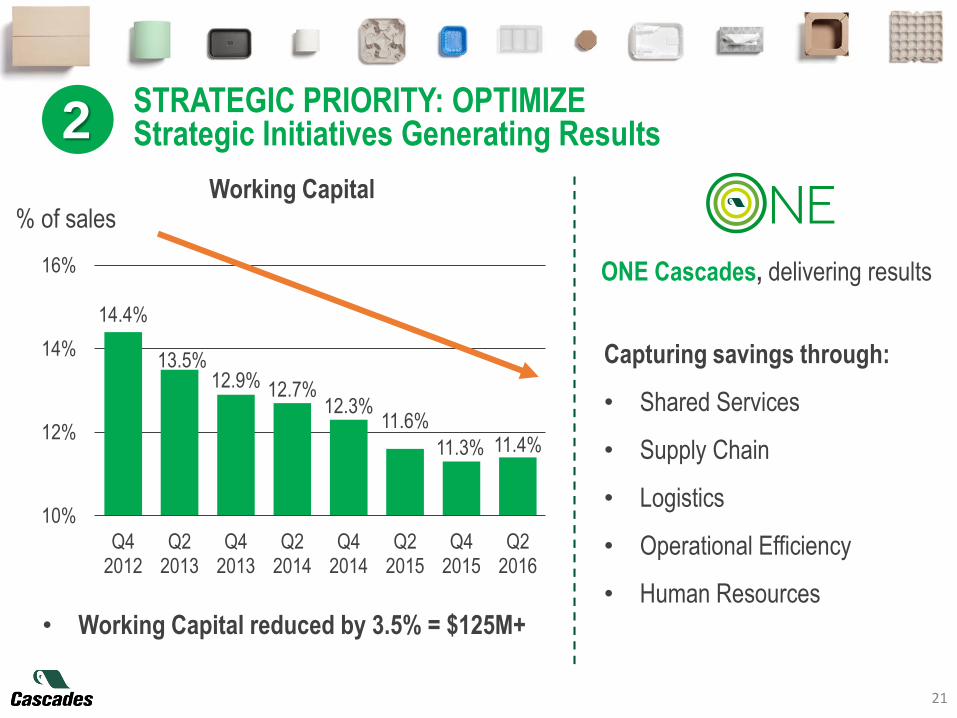
14.4%
13.5%12.9% 12.7%
12.3%11.6%
11.3% 11.4%
10%
12%
14%
16%
Q42012
Q22013
Q42013
Q22014
Q42014
Q22015
Q42015
Q22016
21
STRATEGIC PRIORITY: OPTIMIZEStrategic Initiatives Generating Results2
% of sales
• Working Capital reduced by 3.5% = $125M+
Working Capital
ONE Cascades, delivering results
Capturing savings through:
• Shared Services
• Supply Chain
• Logistics
• Operational Efficiency
• Human Resources
22
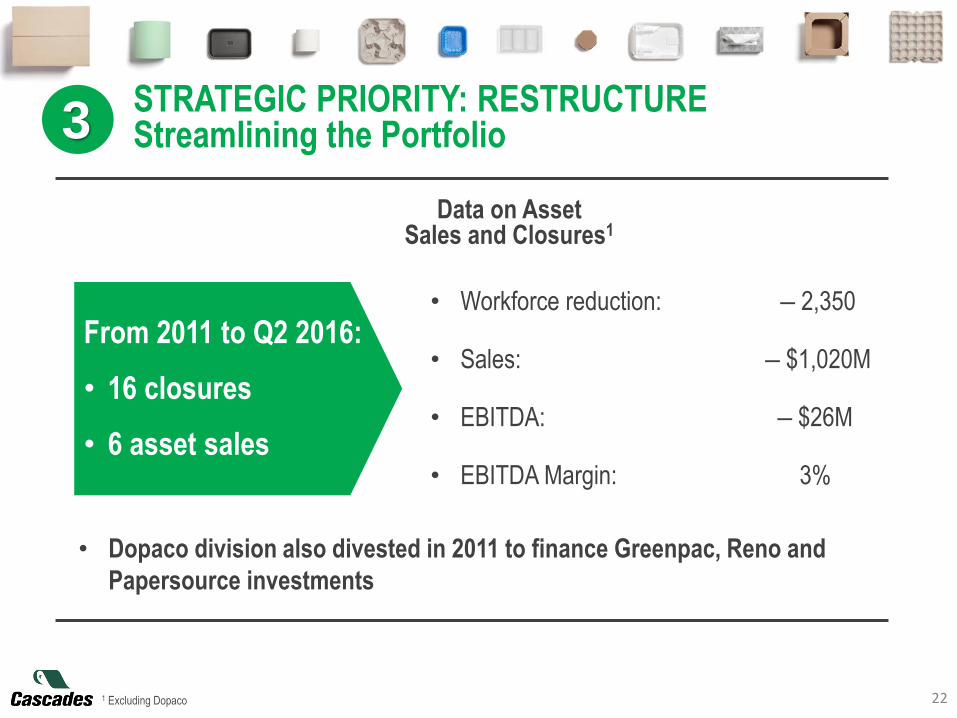
From 2011 to Q2 2016:
• 16 closures
• 6 asset sales
• Workforce reduction: ‒ 2,350
• Sales: ‒ $1,020M
• EBITDA: ‒ $26M
• EBITDA Margin: 3%
• Dopaco division also divested in 2011 to finance Greenpac, Reno and
Papersource investments
Data on AssetSales and Closures1
STRATEGIC PRIORITY: RESTRUCTUREStreamlining the Portfolio3
1 Excluding Dopaco
23
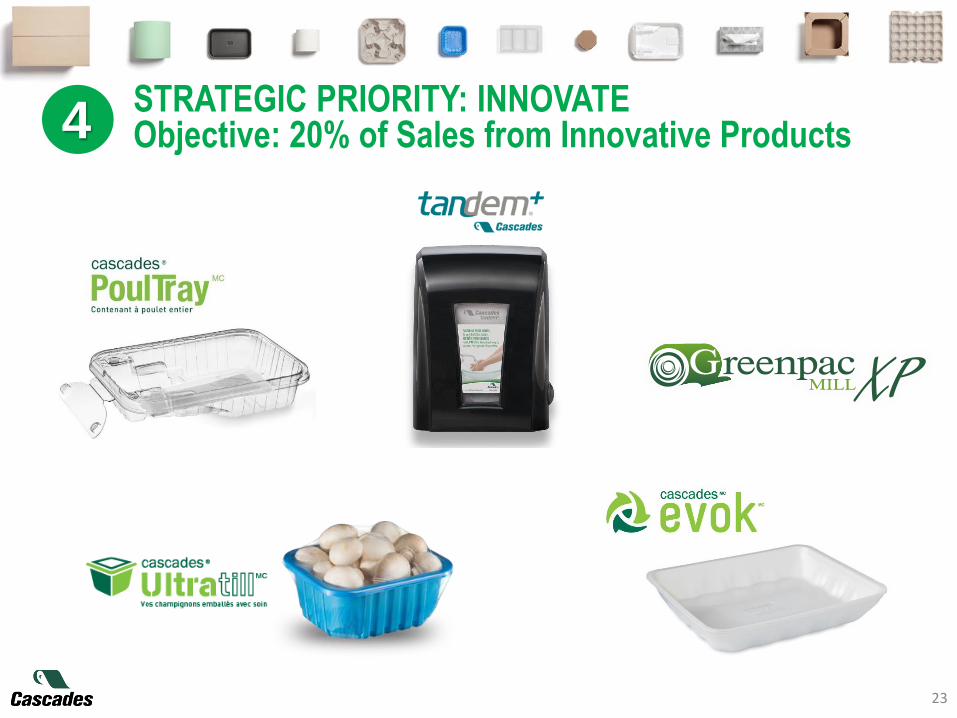
STRATEGIC PRIORITY: INNOVATEObjective: 20% of Sales from Innovative Products4

24
FOCUSED ON GROWTH AND PRODUCTIVITY
Containerboard
Packaging Group
Tissue Papers
Group
Specialty
Products Group
Boxboard Europe
Group
GROWTH
AREAS
• Improve processes
• Grow US converting
footprint
• Product innovation and
differentiation including
‘lightweighting’
• Increase US Away-
from-Home segment
• Expand footprint in
Western & Southern US
• Grow market presence
in value-added
products (Better, Best)
• Consumer
packaging provides
strong growth
potential (i.e. food
protein packaging)
• Strengthen presence
in growing markets
(i.e. Eastern Europe)
• Continue to reduce
leverage to provide
flexibility
PRODUCTIVITY
INITIATIVES
• Leverage modernized
Canadian asset base
• Improve utilization rates
• Continue to improve
performance of
Greenpac Mill
• Lower costs to improve
competitiveness:
continue to modernize
asset base & optimize
logistics (trim & freight)
• Invest in innovation
• Continue to secure
strategic sources of
recovered material
• Optimize logistics
and increase
integration
• Strategic investments
to reduce costs and
improve quality &
margins (such as in
energy, automation,
capacity creep)
• IT upgrades
OBJECTIVESIn top 3 in the sector in
terms of EBITDA marginEBITDA margin of 13%
Grow topline by 10%+
over next 3 years,
improve margins
Maintain/grow solid
EBITDA contribution
25
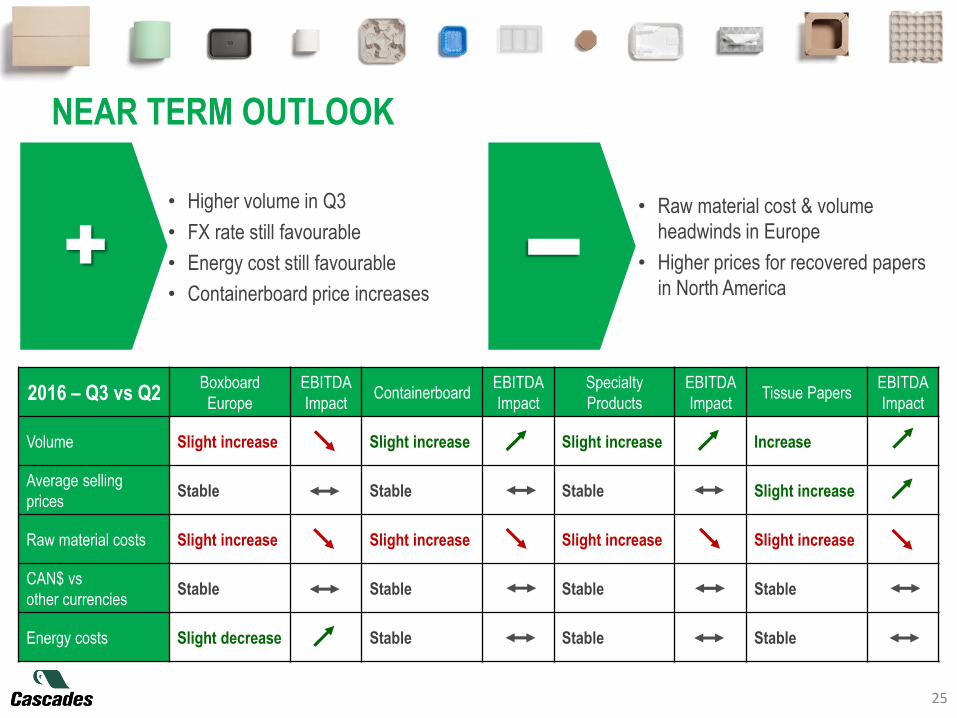
NEAR TERM OUTLOOK
• Higher volume in Q3
• FX rate still favourable
• Energy cost still favourable
• Containerboard price increases
• Raw material cost & volume
headwinds in Europe
• Higher prices for recovered papers
in North America
+
I2016 – Q3 vs Q2
Boxboard
Europe
EBITDA
ImpactContainerboard
EBITDA
Impact
Specialty
Products
EBITDA
ImpactTissue Papers
EBITDA
Impact
Volume Slight increase Slight increase Slight increase Increase
Average selling
prices Stable Stable Stable Slight increase
Raw material costs Slight increase Slight increase Slight increase Slight increase
CAN$ vs
other currenciesStable Stable Stable Stable
Energy costs Slight decrease Stable Stable Stable

POTENTIAL BENEFITS STEMMING FROM OUR INITIATIVES
26
Other sources of growth and incremental value• Culture of innovation
• Good performance from European platform and hidden value of Boralex investment
• On-going initiatives to improve our business processes
Modernizing our operating platform to increase profitability• $185M Capex program in 2016
• Divestitures and closures of under-performing units
• Containerboard: sound fundamentals and improved platform
• Modernized converting platform and improved manufacturing productivity
• Greenpac to positively contribute to EPS for a second full year in 2016
• Tissue Papers: strong and growing position in North America
• Increasing presence in the US with recent expansion initiatives
• Ramp-up and resulting benefits from recent Capex projects
Potential tailwinds• CAD$ weakness
• More stable economic reality in Canada, the US and Europe
• China’s economic weakness and favourable impact on recovered paper prices
• Lower oil and gas costs
• Benefits of recent price increases (2015-2016)
Taking the right steps to position Cascades for the future
APPENDIX
27

800
900
1,000
1,100
1,200
1,300
1,400
1,500
1,600
Aug
08
Ja
n 0
9
Ju
n 0
9
No
v 0
9
Apr
10
Sep
10
Fe
b 1
1
Ju
l 1
1
De
c 1
1
Ma
y 1
2
Oct
12
Ma
r 1
3
Aug
13
Ja
n 1
4
Ju
n 1
4
No
v 1
4
Apr
15
Sep
15
Fe
b 1
6
Ju
l 1
6
Tissue Papers - Selected Benchmarks
Virgin parent rolls
Recycled parent rolls
(US$/s.t.)
250
300
350
400
450
500
550
600
650
Aug
06
Fe
b 0
7
Aug
07
Fe
b 0
8
Aug
08
Fe
b 0
9
Aug
09
Feb 1
0
Aug
10
Fe
b 1
1
Aug
11
Fe
b 1
2
Aug
12
Fe
b 1
3
Aug
13
Fe
b 1
4
Aug
14
Feb 1
5
Aug
15
Fe
b 1
6
Aug
16
Containerboard - Selected Benchmarks
Linerboard 42-lb. unbleached kraft, Eastern U.S.
Corrugating medium 26-lb. semichemical, Eastern U.S.
(US$/s.t.)
28
BUSINESS DRIVERS – PRICE DYNAMICS
Source: RISI
29
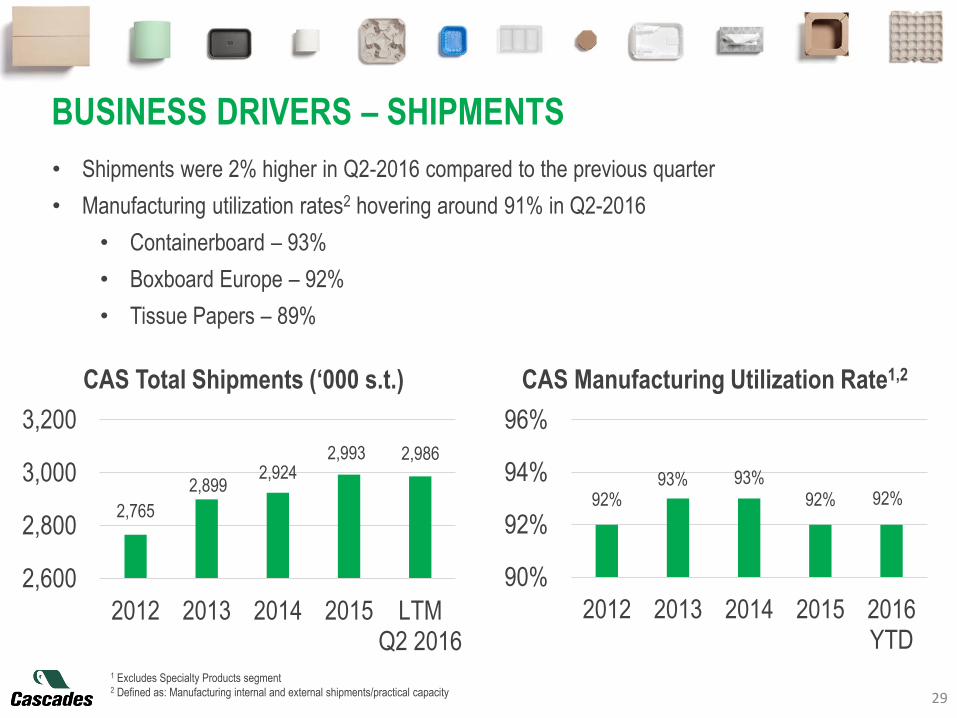
BUSINESS DRIVERS – SHIPMENTS
• Shipments were 2% higher in Q2-2016 compared to the previous quarter
• Manufacturing utilization rates2 hovering around 91% in Q2-2016
• Containerboard – 93%
• Boxboard Europe – 92%
• Tissue Papers – 89%
CAS Total Shipments (‘000 s.t.) CAS Manufacturing Utilization Rate1,2
1 Excludes Specialty Products segment2 Defined as: Manufacturing internal and external shipments/practical capacity
2,765
2,8992,924
2,993 2,986
2,600
2,800
3,000
3,200
2012 2013 2014 2015 LTMQ2 2016
92%93% 93%
92% 92%
90%
92%
94%
96%
2012 2013 2014 2015 2016YTD
30
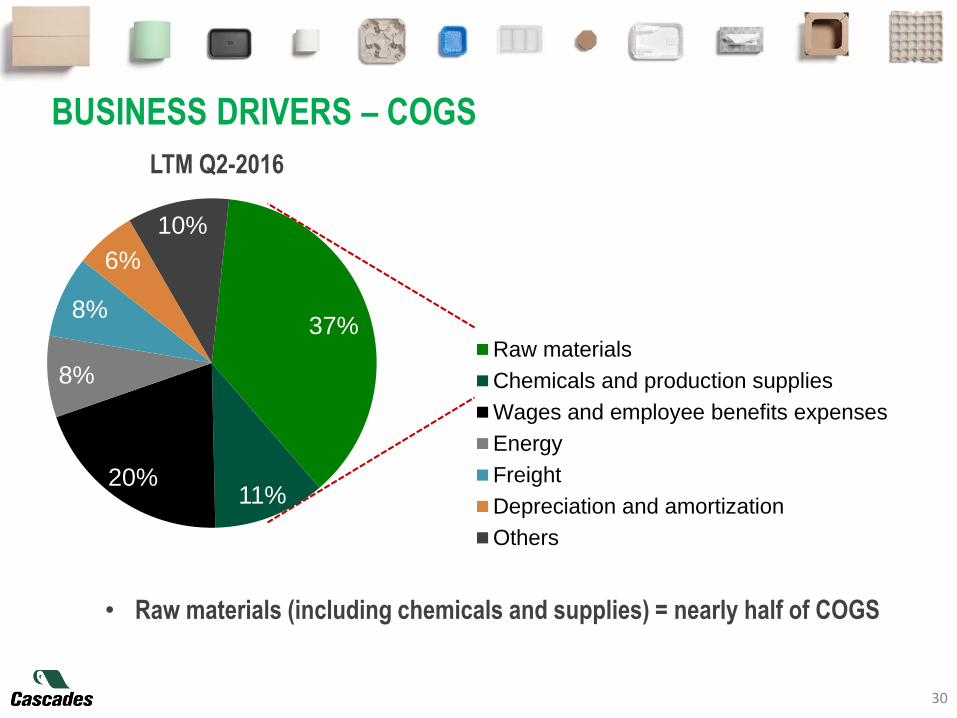
BUSINESS DRIVERS – COGS 36%
11%20%
9%
8%
6%
10%
Raw materials
Chemicals and production supplies
Wages and employee benefits expenses
Energy
Freight
Depreciation and amortization
Others
LTM Q2-2016
• Raw materials (including chemicals and supplies) = nearly half of COGS
37%
11%20%
8%
8%
6%
10%
Raw materials
Chemicals and production supplies
Wages and employee benefits expenses
Energy
Freight
Depreciation and amortization
Others
50
100
150
200
June 1
3
Sep
t 13
Dec 1
3
Mar
14
June 1
4
Sep
t 1
4
Dec 1
4
Mar
15
June 1
5
Sep
t 15
Dec 1
5
Mar
16
June 1
6
Sep
t 16
(US$/ton)Recycled Fibre Prices
White grades (Basket of products) Brown grades (OCC)
700
800
900
1,000
1,100
May 1
3
Aug
13
Nov 1
3
Feb 1
4
May 1
4
Aug
14
Nov 1
4
Feb 1
5
May 1
5
Aug
15
Nov 1
5
Feb 1
6
May 1
6
Aug
16
(US$/ton)Virgin Pulp Prices
NBSK NBHK
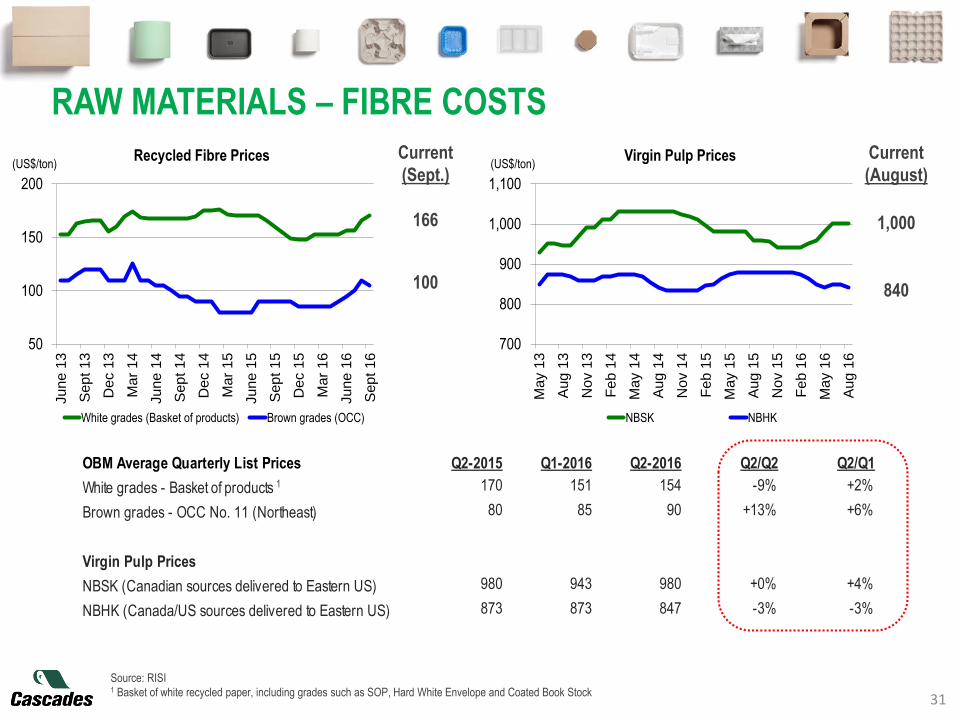
OBM Average Quarterly List Prices Q2-2015 Q1-2016 Q2-2016 Q2/Q2 Q2/Q1
White grades - Basket of products 170 151 154 -9% +2%
Brown grades - OCC No. 11 (Northeast) 80 85 90 +13% +6%
Virgin Pulp Prices
NBSK (Canadian sources delivered to Eastern US) 980 943 980 +0% +4%
NBHK (Canada/US sources delivered to Eastern US) 873 873 847 -3% -3%
RAW MATERIALS – FIBRE COSTS
31
Current
(Sept.)
100
166 1,000
840
Current
(August)
1
Source: RISI1 Basket of white recycled paper, including grades such as SOP, Hard White Envelope and Coated Book Stock

0
1
2
3
4
5
6
32
RAW MATERIALS – SOURCING STRATEGY
Strategy
• Constant review of our inventory strategy
• Ensure control over fibre supply with potential
to increase tons under control
• Develop substitute grades
• Continue to increase integration rate within CAS
• Potential to increase virgin content in certain
circumstances
• Continue to close the loop with customers &
retailers
World Top Recovered Paper Suppliers Cascades’ NA Recycled Fibre Supply
20151
Most of the fibre
supply comes
from internal
sources,
contracts and
regular streams
1 Including volume processed for Greenpac
Recovery &
Internal
25%
Spot
25%
Contractual
Agreements
23%
Regular &
Steady Volume
(Noncontractual)
27%
Source: RISI
(M Tonnes)
33
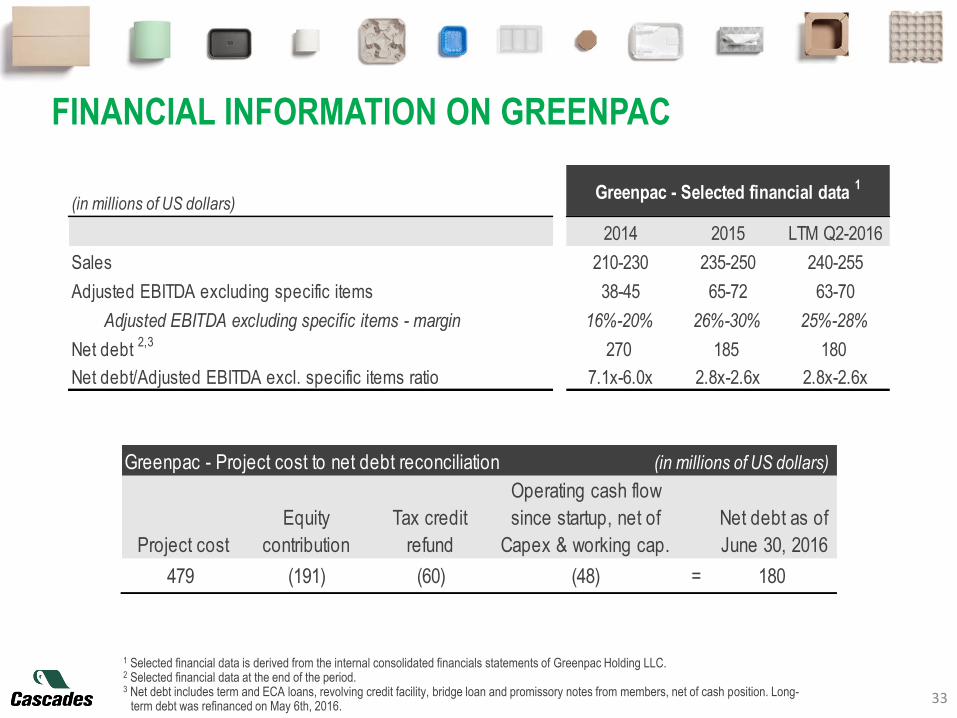
FINANCIAL INFORMATION ON GREENPAC
1 Selected financial data is derived from the internal consolidated financials statements of Greenpac Holding LLC. 2 Selected financial data at the end of the period.3 Net debt includes term and ECA loans, revolving credit facility, bridge loan and promissory notes from members, net of cash position. Long-
term debt was refinanced on May 6th, 2016.
(in millions of US dollars)
2014 2015 LTM Q2-2016
Sales 210-230 235-250 240-255
Adjusted EBITDA excluding specific items 38-45 65-72 63-70
Adjusted EBITDA excluding specific items - margin 16%-20% 26%-30% 25%-28%
Net debt 2,3
270 185 180
Net debt/Adjusted EBITDA excl. specific items ratio 7.1x-6.0x 2.8x-2.6x 2.8x-2.6x
Greenpac - Selected financial data 1
Greenpac - Project cost to net debt reconciliation (in millions of US dollars)
Project cost
Equity
contribution
Tax credit
refund
Operating cash flow
since startup, net of
Capex & working cap.
Net debt as of
June 30, 2016
479 (191) (60) (48) = 180
34
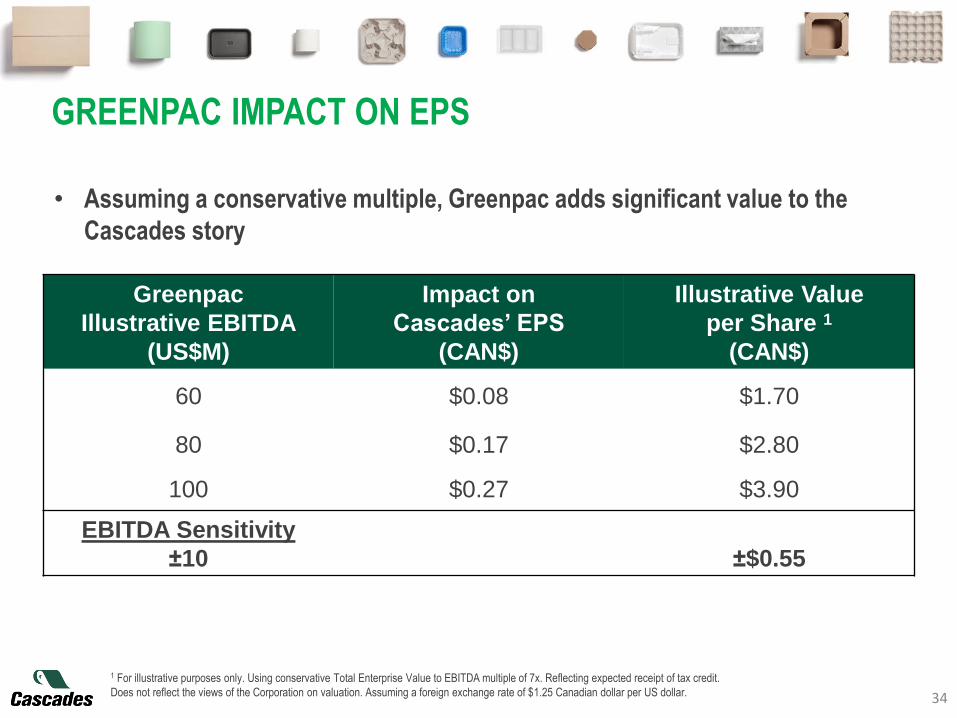
Greenpac
Illustrative EBITDA
(US$M)
Impact on
Cascades’ EPS
(CAN$)
Illustrative Value
per Share 1
(CAN$)
60 $0.08 $1.70
80 $0.17 $2.80
100 $0.27 $3.90
EBITDA Sensitivity
±10 ±$0.55
• Assuming a conservative multiple, Greenpac adds significant value to the
Cascades story
1 For illustrative purposes only. Using conservative Total Enterprise Value to EBITDA multiple of 7x. Reflecting expected receipt of tax credit.
Does not reflect the views of the Corporation on valuation. Assuming a foreign exchange rate of $1.25 Canadian dollar per US dollar.
GREENPAC IMPACT ON EPS

CAS LTM EBITDA
(M$ CAN, unless otherwise noted) (Net of corp. activities)
Low High Average Multiple Value Value/Share Multiple Value Value/Share
• Containerboard Group 239 8.5x 12.1x 10.1x 5.8x 1,387 7.6x 1,816
• Boxboard Europe 60 6.5x 15.4x 10.3x 4.5x 270 4.5x 270
• Specialty Products Group 64 10.7x 13.8x 11.5x 5.5x 352 5.5x 352
• Tissue Papers Group 154 6.7x 13.6x 10.1x 6.1x 939 8.4x 1,294
• Corporate Activities (61) 5.7x (348) 7.2x (439)
456
Total Enterprise Value (and implied multiple) 5.7x 2,600 7.2x 3,293
Add: JV contribution ($10M EBITDA @ 6.0x) 60 60
Subtract: Net Debt @ June 30, 2016 (1,664) (1,664)
Implied Equity Value - before adjustments 996 $10.55 1,689 $17.89
Add: Boralex stake (market value @ August 31,2016) 242 $2.56 242 $2.56
Add: Greenpac investment (market value @ 8.0x) 259 $2.75 259 $2.75
Subtract: Minority interest (Reno only, market value @ 4.5x) (78) ($0.82) (78) ($0.82)
Implied Equity Value - after adjustments 1,419 $15.04 2,112 $22.38
Share Price @ September 15, 2016 $11.89 $11.89
Implied share price upside potential 26% 88%
Current industry
multiples
CAS valuation using
current analyst multiples
CAS valuation using 2017e
average industry multiples
35
ILLUSTRATIVE SUM OF THE PARTS
1 LTM EBITDA as 06/30/2016; EBITDA excluding specific items. 2 Source: Bloomberg; Comparable companies include: IP, KapStone, Packaging Corp. and WestRock for Containerboard; Holmen, Mayr Melnhof, Metsä Board and Stora Enso for BoxboardEurope; Bemis, Berry Plastics, Greif, Sealed Air, Sonoco and Winpak for Specialty Products; Clearwater, K-C, KP Tissue and Orchids Paper for Tissue Papers.3 Current multiple average of analysts covering Cascades.4 2017e average industry multiples applied for Containerboard Group and Tissue Papers Group only. Source: Bloomberg.
1
2 3 4
36
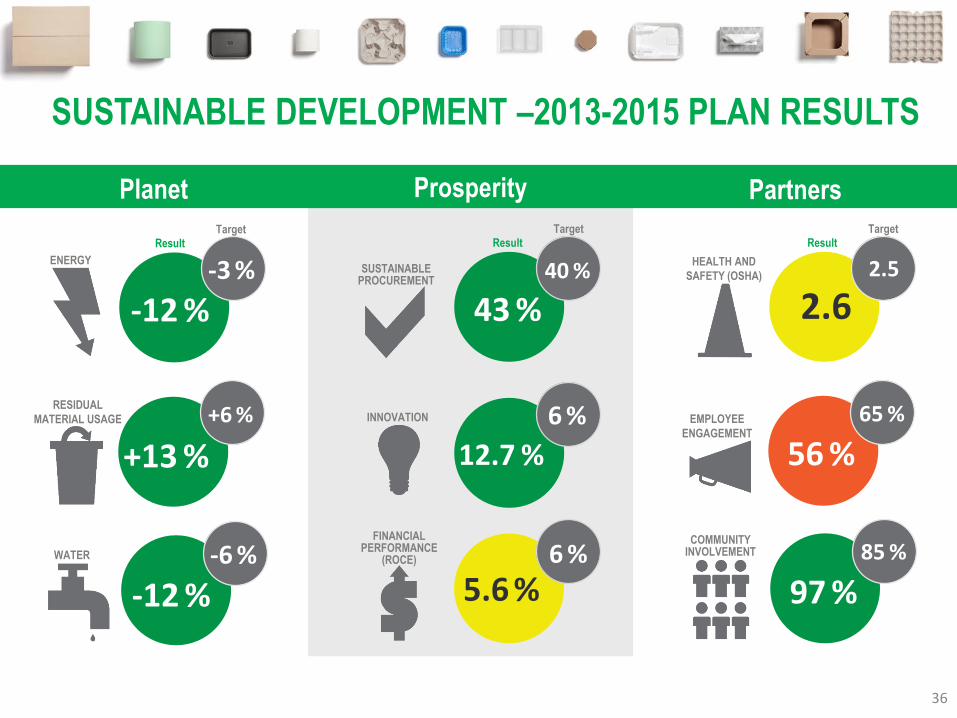
Planet Prosperity Partners
-12 %-3 %
-12 %-6 %
+13 %
+6 %
43 %40 %
5.6 %6 %
12.7 %
6 %
2.62.5
97 %85 %
56 %65 %
ResultTarget
ResultTarget
ResultTarget
ENERGY
RESIDUAL
MATERIAL USAGE
WATER
SUSTAINABLEPROCUREMENT
INNOVATION
FINANCIALPERFORMANCE
(ROCE)
HEALTH AND
SAFETY (OSHA)
EMPLOYEE
ENGAGEMENT
COMMUNITYINVOLVEMENT
SUSTAINABLE DEVELOPMENT –2013-2015 PLAN RESULTS
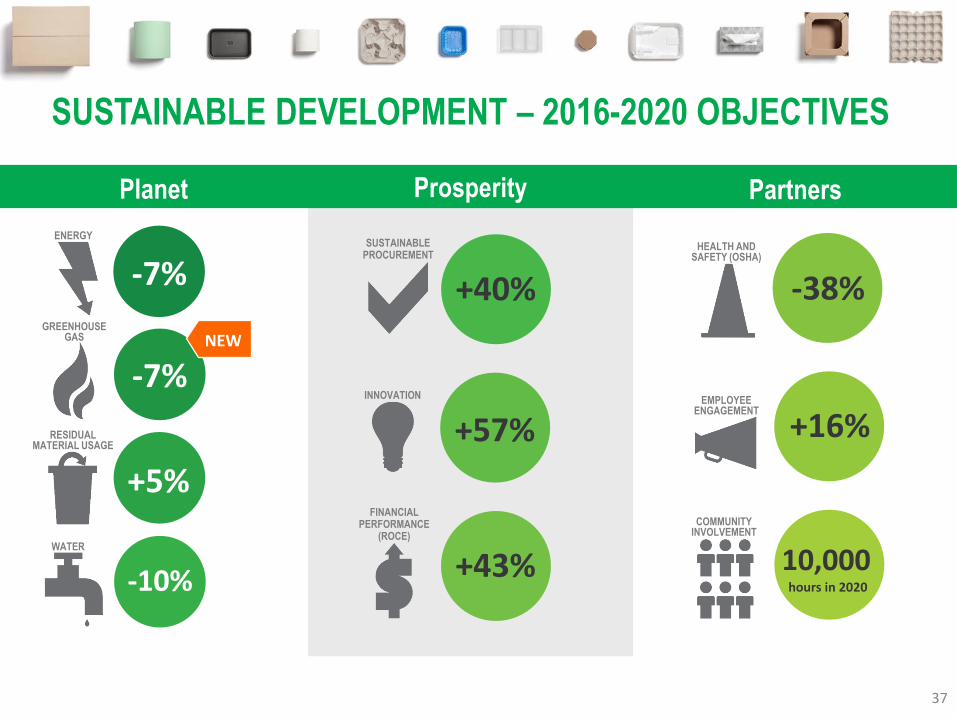
37
-7%
-7%
+5%
-10%
+40%
+57%
+43%
-38%
+16%
10,000hours in 2020
NEW
ENERGY
RESIDUALMATERIAL USAGE
WATER
SUSTAINABLEPROCUREMENT
INNOVATION
FINANCIALPERFORMANCE
(ROCE)
HEALTH ANDSAFETY (OSHA)
EMPLOYEE ENGAGEMENT
COMMUNITYINVOLVEMENT
GREENHOUSE GAS
Planet Prosperity Partners
SUSTAINABLE DEVELOPMENT – 2016-2020 OBJECTIVES
38
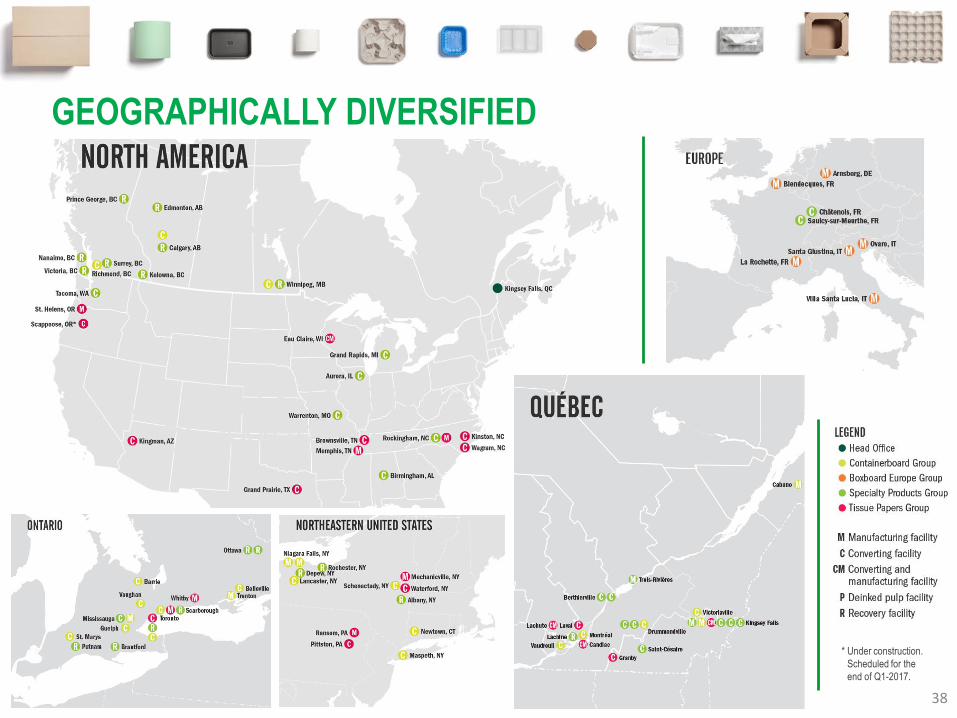
GEOGRAPHICALLY DIVERSIFIED
* Under construction.
* Scheduled for the
* end of Q1-2017.

39
For more information:www.cascades.com/investors
Jennifer Aitken, MBA
Director, Investor Relations
514-282-2697 or [email protected]