Cary, North Carolina, USA. ALL RIGHTS RESERVED. For ...
23
Transcript of Cary, North Carolina, USA. ALL RIGHTS RESERVED. For ...


Abrahams, Clark and Mingyuan Zhang. Fair Lending Compliance: Intelligence and Implications for Credit Risk Management. Copyright © 2007, SAS Institute Inc., Cary, North Carolina, USA. ALL RIGHTS RESERVED. For additional SAS resources, visit support.sas.com/bookstore.
Contents Foreword.
Preface.
Chapter 1. Credit Access and Credit Risk.
Chapter 2. Methodology and Elements of Risk and Compliance Intelligence.
Chapter 3. Analytic Process Initiation.
Chapter 4. Loan Pricing Analysis.
Chapter 5. Regression Analysis for Compliance Testing.
Chapter 6. Alternative Credit Risk Models.
Chapter 7. Multi-layered Segmentation.
Chapter 8. Model Validation.
Index.

Abrahams, Clark and Mingyuan Zhang. Fair Lending Compliance: Intelligence and Implications for Credit Risk Management. Copyright © 2007, SAS Institute Inc., Cary, North Carolina, USA. ALL RIGHTS RESERVED. For additional SAS resources, visit support.sas.com/bookstore.

Abrahams, Clark and Mingyuan Zhang. Fair Lending Compliance: Intelligence and Implications for Credit Risk Management. Copyright © 2007, SAS Institute Inc., Cary, North Carolina, USA. ALL RIGHTS RESERVED. For additional SAS resources, visit support.sas.com/bookstore.
Abrahams c01 2 11/10/07 2
2 CREDIT ACCESS AND CREDIT RISK
loans, for protected versus nonprotected classes of consumers, are used to identify poten-tial problems associated with credit risk evaluation. Factors such as disparities in marketshare and market penetration are indicators of potential problems associated with productmarketing. Beneath the results layer, where problems surface, lies the proprietary decisionlayer. This is where risk is quantied and loan decision making is performed. It is alsowhere consumer segmentation is performed and marketing strategies are developed andimplemented. It is in this decision layer where art and science are used to address, in themost appropriate way, such things as incomplete information, missing data, new emergingpopulations, environmental socioeconomic changes, and changes in both the riskiness andprevalence of various distinct consumer and small business borrower proles.
In the following sections, we describe the enterprise risk prole and the importance of aneffective risk measurement system. Next, we review the evolution of some of the more relevantregulations, note some recent class action lawsuits for alleged consumer protection and fair lendingviolations, and share a brief outlook for future developments at the federal and state levels. Wediscuss how to prepare for the challenges created by changes in laws and regulations and marketswith three fundamental principles that underpin corporate internal controls. Finally, we introducereturn on compliance in terms of performance measurement and risk control, supported by a simplebusiness case on fair lending technology investment.
ENTERPRISE RISK MANAGEMENT
Senior management and the board of directors of major nancial institutions are charged with thefollowing responsibilities relative to enterprise risk management (ERM) and compliance:
• Dening the risk management function itself and ensuring that the proper committee andorganizational structures are in place to support ERM.
• Dening the corporation’s risk preferences via risk policies and key risk measure tolerancespecications.
• Ensuring that stafng is adequate and appropriately skilled in risk management, and thatthe right incentives are in place.
• Making sure that adequate risk cushions exist to support both day-to-day operations andthe rm’s strategic business plan.
• Providing for employee training and development to foster organizational learning so asto lessen the likelihood of repeating past mistakes.
• Leading by example to mold the desired risk culture by effective communication and takingreinforcing actions.
The passage of the Sarbanes-Oxley Act in 2002 was brought about by serious concerns thatresonated from regulators, stock exchanges, and institutional investors in the wake of corporatefrauds and failures5 (e.g., Barings Bank, Sumitomo, Enron, WorldCom, Adelphia) that saw bil-lions of dollars in shareholder value vanish and threatened the stability of the equity markets.A resounding theme in these failures was ineffective management and board oversight of opera-tions. Sarbanes-Oxley established new rules for corporate governance practices, and it has becomeincreasingly important that corporations take notice and act to make any necessary improvementsin their internal controls and external reporting. Consider the fact that interest rate risk on the bal-ance sheets of consumers having adjustable rate mortgages is now translating to signicant creditrisk on lender balance sheets. By dening loan affordability and product suitability measures and
5. See Testimony Concerning Implementation of the Sarbanes-Oxley Act of 2002 , William H. Donaldson, Chairman,U.S. Securities and Exchange Commission, September 9, 2003, www.sec.gov/news/testimony/090903tswhd.htm.

Abrahams, Clark and Mingyuan Zhang. Fair Lending Compliance: Intelligence and Implications for Credit Risk Management. Copyright © 2007, SAS Institute Inc., Cary, North Carolina, USA. ALL RIGHTS RESERVED. For additional SAS resources, visit support.sas.com/bookstore.
Abrahams c01 2 11/10/07 3
ENTERPRISE RISK MANAGEMENT 3
disparity indices, these risks could have been identied, monitored, and addressed prior to becom-ing a problem for the industry at large, and a concentration/asset quality issue for institutions inparticular, who have seen their equity shares signicantly decline in value.6
This book deals primarily with compliance and credit risk management, but we recognize thatthere is overlap between these two areas, and also spillover into other areas of risk. All nancialinstitutions have internal controls in place that are designed to identify, measure, monitor, andcontrol a variety of risks that fall into various broad categories.7 An Ofce of the Comptroller of theCurrency (OCC) handbook advises national banks that “Risk identication should be a continuingprocess, and should occur at both the transaction and portfolio level.”8 Risk identication is themain topic of Chapter 3 in this book, and we advocate a continuous, systematic process forexamining lending patterns and loan performance in the aggregate (e.g., portfolio level). We alsofocus on loan decisioning, pricing, and marketing relative to both credit and compliance at thecustomer level. Measurement of risk is a demanding endeavor, and requires the use of statisticalmethods to help determine the signicance and materiality of risk exposures. In the compliancerealm, we devote several chapters to this topic. In the credit area, risk measurement sometimesrequires the use of some fairly sophisticated mathematical algorithms to estimate the probabilitythat a loan will default, or the extent to which the amount and timing of credit losses are likelycaused by delinquency, or risk grade, migration. Concerning risk measurement, we cannot improveon the OCC’s guidance:
Accurate and timely measurement of risk is essential to effective risk management systems. A bank that doesnot have a risk measurement system has limited ability to control or monitor risk levels. Further, the morecomplex the risk, the more sophisticated should be the tools that measure it. A bank should periodicallytest to make sure that the measurement tools it uses are accurate.9
Risk monitoring should be performed regularly, with up-to-date information, and it shouldprovide an accurate and consistent picture of risk exposures to all relevant stakeholders so thatcontrols can be applied and so that any violations of policy, regulation, or law can be swiftlyaddressed. Some stakeholders may require less detail, but their higher-level picture should havethe available dots behind it to connect to the more granular assessments and quantitative analyses.
At the enterprise, or highest, level, it is customary to periodically document the rm’s risk proleas part of the capital plan. This corporate risk prole must have an accompanying explanation forthe corporate capital plan’s readership, namely the board of directors, regulators,10 stock analysts,rating agencies,11 and business partners. For example, Figure 1.1 depicts a sample risk prole.
While these categories of risk12 are shown as distinct, they are interrelated. By recognizingtheir intersection points, their associated risks can be more effectively and efciently managed.Operational risk is dened as the risk of failures, and losses, due to people, processes, or systems,and includes transaction risk. Compliance risk exposures can be measured relative to their associ-ated business transactions and activities, for example, underwriting, loan pricing, marketing, andso forth. Compliance risk is interrelated with operational risk, and operational risk also can leadto market or credit risk.13 This book focuses on major intersection points between credit risk and
6. Another crisis is unfolding in the subprime mortgage market for adjustable rate and option-priced loans that arerepricing after a prolonged period of rising interest rates.
7. While there is no single categorization that has been adopted, the OCC’s guidelines are used as a basis for thecurrent discussion.
8. Administrator of National Banks, Comptroller’s Handbook for Large Bank Supervision , United States of AmericaComptroller of the Currency, May 2001, pp. 5–6.
9. Ibid., p. 6. Chapters 4, 5, and 6 focus on risk measurement, with some elements on monitoring as well.10. OCC, FDIC, Federal Reserve, OTS, SEC, State Banking Commissions, etc.11. For example, Moody’s, Standard & Poor’s, Dun & Bradstreet.12. For denitions of the risk categories, refer to Appendix 1A.13. Jorion pointed that legal risk is often related to credit risk. See also Jorion, Philippe. Value at Risk: The New
Benchmark for Managing Financial Risk , McGraw-Hill, 2007, pp. 22–27. Both Jorion and Dufe and Singleton,

Abrahams, Clark and Mingyuan Zhang. Fair Lending Compliance: Intelligence and Implications for Credit Risk Management. Copyright © 2007, SAS Institute Inc., Cary, North Carolina, USA. ALL RIGHTS RESERVED. For additional SAS resources, visit support.sas.com/bookstore.
Abrahams c01 2 11/10/07 4
4 CREDIT ACCESS AND CREDIT RISK
Enterprise Risk Profile
Quality of Risk Aggregate Level of Direction of RiskRisk Quantity of Risk Management (Weak, Risk (Low, (Increasing, Stable,Category (Low, Moderate, High) Satisfactory, Strong) Moderate, High) Decreasing)
OCC Bank OCC Bank OCC Bank OCC Bank6/30/07 6/30/07 6/30/07 6/30/07 6/30/07 6/30/07 6/30/07 6/30/07
Credit Moderate Moderate Weak Satisf. High Moderate Increasing Stable
InterestRate
Moderate Moderate Satisf. Satisf. Moderate Moderate Stable Stable
Liquidity Low Low Strong Strong Low Low Stable Stable
Price Moderate Moderate Strong Strong Low Low Stable Stable
Transaction Moderate Moderate Satisf. Satisf. High Moderate Increasing Stable
Compliance High High Satisf. Satisf. High High Increasing Increasing
Strategic Moderate Moderate Increasing Stable
Reputation High High Increasing Stable
FIGURE 1.1 CORPORATE RISK PROFILE
compliance risk and the opportunities they present for more integrated identication, measure-ment, monitoring, and control of associated risks. The outcome is stronger, more effective andmore efcient internal controls for the enterprise.
LAWS AND REGULATIONS
Over the past 40 years, there have been many signicant regulatory developments related to insti-tutional lending practices and programs. During the period 1968–77, Congress enacted legislationdesigned to:
• Prohibit discrimination in the sale, rental, and nancing of dwellings, and in other housing-related transactions.14
• Prohibit creditors from discriminating against credit applicants.15
• Increase lending to meet credit needs in underserved communities.16
• Collect data on loan applications17 by census tract that, for the most part, are secured byresidential real estate.18
categorized the risk faced by nancial institutions into (1) market risk, (2) credit risk, (3) liquidity risk, and (4)operational risk (Dufe and Singleton also included systemic risk). They all considered regulatory and legal risk aspart of operational risk. See Dufe and Singleton, Credit Risk: Pricing, Measurement, and Management , PrincetonUniversity Press, 2003, pp. 3–7.
14. Title VIII of the Civil Rights Act of 1968 (Fair Housing Act) Prohibited basis: race, color, national origin, religion,sex, familial status (including children under the age of 18 living with parents of legal custodians, pregnant women,and people securing custody of children under the age of 18), and handicap (disability).
15. Regulation B, the Equal Credit Opportunity Act (ECOA) of 1975. Prohibited basis: race, color, religion, nationalorigin, sex, marital status, age, or because an applicant receives income from a public assistance program.
16. Regulation BB: Community Reinvestment Act (CRA) 1977.17. Including actions taken on applications (i.e., origination, denial, incomplete, withdrawn, approved but not accepted,
and loan purchased by institution).18. Regulation C: Home Mortgage Disclosure Act (HMDA) 1975.

Abrahams, Clark and Mingyuan Zhang. Fair Lending Compliance: Intelligence and Implications for Credit Risk Management. Copyright © 2007, SAS Institute Inc., Cary, North Carolina, USA. ALL RIGHTS RESERVED. For additional SAS resources, visit support.sas.com/bookstore.
Abrahams c01 2 11/10/07 5
LAWS AND REGULATIONS 5
With the passage in 1980 of the Depository Institutions Deregulation and Monetary Control Act,state usury laws limiting rates lenders could charge on residential mortgage loans were preempted,which set the stage for a signicantly broader pricing range for the subprime mortgage market.In 1989, Representative Joseph Kennedy (D-Massachusetts) obtained successful passage of anamendment to the Home Mortgage Disclosure Act (HMDA) that required reporting on loan appli-cant race and income. More recently, in 2002, HMDA was amended again to include loan pricinginformation for loans exceeding specic thresholds for spread over comparable-maturity treasurysecurity yields.19 The 2002 HMDA amendment took effect in 2004 for data reported in 2005and thereafter. While the HMDA data do not represent a complete picture of lending practices,they are used by regulatory agencies as part of their screening activities for potential complianceviolations, and the Federal Reserve Board issues an annual report on this data.20
Tom Miller, Attorney General of Iowa, in his keynote address at the 2007 Fair Lending Sum-mit,21 pointed to the convergence of consumer protection and fair lending/civil rights and he citedtwo issues driving the intersection. First, he pointed to the $295 million Ameriquest settlement.22
While it is legal for lenders to charge what they want, selling tactics relative to representing coststo the borrower, and also cases where similarly situated borrowers in protected classes may appearto be charged more than their nonprotected class counterparts, can raise issues. Second, AttorneyGeneral Miller pointed to yield spread premiums (YSPs) for independent mortgage brokers, whichare a source of compensation. If one to two points additional are charged to consumers and thispractice is not evenly applied across the loan applicant base, especially if certain classes of appli-cants are more susceptible to accepting those costs, then this causes problems. The Ameriquestpredatory lending practices case was not isolated. In fact, Attorney General Miller and his ofceled the national group that recently obtained the largest national consumer protection settlementever with Household Finance, which totaled $484 million. Looking beyond the retrospective reliefassociated with these settlements, lenders are studying the injunctive relief that species goingforward restrictions on business operations and practices, monitoring, and reporting requirements.Proactive lenders seize the opportunity to set the standard themselves, rather than waiting forinjunctive relief on a future class action settlement to set the new standard.
Looking ahead, the prospect of Congress passing legislation on predatory lending appearsto be strengthening, and as of March 2007, 27 states (including the District of Columbia) hadalready announced adoption or support23 of the Conference of State Bank Supervisors/AmericanAssociation of Residential Mortgage Regulators guidance on nontraditional mortgage productrisks. These nontraditional mortgage products appear to present higher credit and compliance riskfor both borrowers and lenders in subprime markets.
19. For rst liens the trigger is three percent, while for subordinate liens the trigger is ve percent. In 2002, the Boardof Governors of the Federal Reserve System (FRB) issued several new regulatory changes, some of which becameeffective in 2004 (subject to 2005 ling), to improve the quality, consistency, and utility of the data reportedunder HMDA. The 2004 HMDA data, released to the public in the spring of 2005, was the rst to reect the newregulatory requirements and to include the pricing information.
20. Avery, Robert B., Glenn B. Canner, and Robert E. Cook. “New Information Reported under HMDA and ItsApplication in Fair Lending Enforcement,” Federal Reserve Bulletin, 2005, pp. 344–394.
21. Miller, Tom. The Emerging Nexus: Fair Lending Enforcement Issues and Enforcement with Consumer Protec-tion Issues , Keynote Address, Fair Lending Summit 2007, National Real Estate Development Center (NREDC),Washington, DC, March 26, 2007.
22. Attorney General Miller led the group of states bring action against the national lender.23. Announcements ranged from “regulatory alerts” to “state guidance” to intent to “draft rules.” Some states, including
North Carolina (HB 1817), have passed predatory lending laws or amendments in 2007, and the Fair MortgagePractices Act was introduced July 12, 2007 in the House of Representatives by House Financial Services CommitteeRanking Member Spencer Bachus, and original cosponsors Reps. Paul Gillmor and Deborah Pryce. This particularpiece of legislation aims to better protect homebuyers from predatory lending practices, with special focus toprotecting the subprime market.
Abrahams, Clark and Mingyuan Zhang. Fair Lending Compliance: Intelligence and Implications for Credit Risk Management. Copyright © 2007, SAS Institute Inc., Cary, North Carolina, USA. ALL RIGHTS RESERVED. For additional SAS resources, visit support.sas.com/bookstore.
Abrahams c01 2 11/10/07 6
6 CREDIT ACCESS AND CREDIT RISK
CHANGING MARKETS
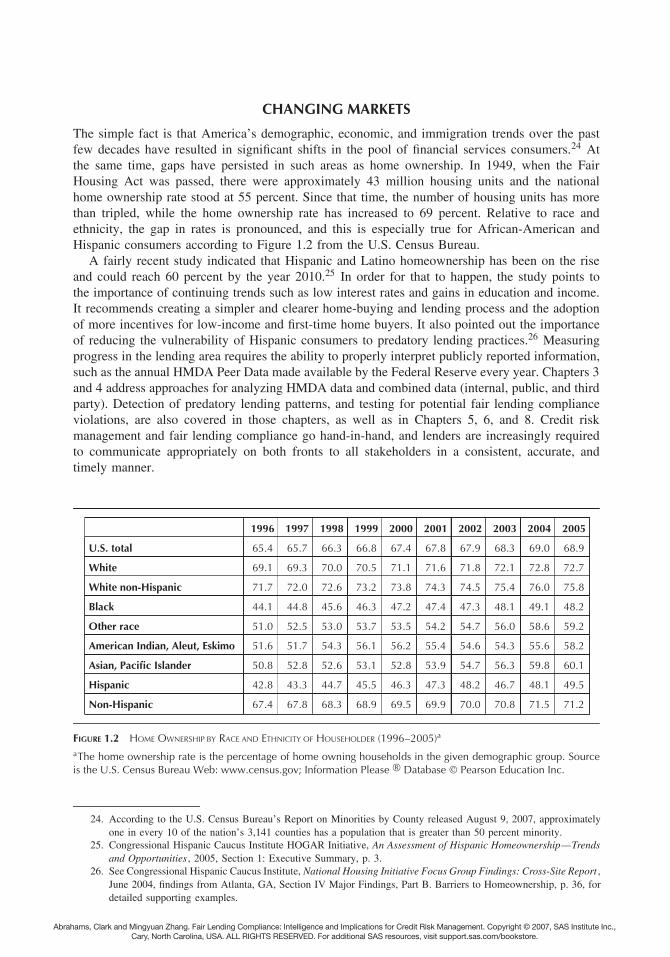
The simple fact is that America’s demographic, economic, and immigration trends over the pastfew decades have resulted in signicant shifts in the pool of nancial services consumers.24 Atthe same time, gaps have persisted in such areas as home ownership. In 1949, when the FairHousing Act was passed, there were approximately 43 million housing units and the nationalhome ownership rate stood at 55 percent. Since that time, the number of housing units has morethan tripled, while the home ownership rate has increased to 69 percent. Relative to race andethnicity, the gap in rates is pronounced, and this is especially true for African-American andHispanic consumers according to Figure 1.2 from the U.S. Census Bureau.
A fairly recent study indicated that Hispanic and Latino homeownership has been on the riseand could reach 60 percent by the year 2010.25 In order for that to happen, the study points tothe importance of continuing trends such as low interest rates and gains in education and income.It recommends creating a simpler and clearer home-buying and lending process and the adoptionof more incentives for low-income and rst-time home buyers. It also pointed out the importanceof reducing the vulnerability of Hispanic consumers to predatory lending practices.26 Measuringprogress in the lending area requires the ability to properly interpret publicly reported information,such as the annual HMDA Peer Data made available by the Federal Reserve every year. Chapters 3and 4 address approaches for analyzing HMDA data and combined data (internal, public, and thirdparty). Detection of predatory lending patterns, and testing for potential fair lending complianceviolations, are also covered in those chapters, as well as in Chapters 5, 6, and 8. Credit riskmanagement and fair lending compliance go hand-in-hand, and lenders are increasingly requiredto communicate appropriately on both fronts to all stakeholders in a consistent, accurate, andtimely manner.
1996 1997 1998 1999 2000 2001 2002 2003 2004 2005
U.S. total 65.4 65.7 66.3 66.8 67.4 67.8 67.9 68.3 69.0 68.9
White 69.1 69.3 70.0 70.5 71.1 71.6 71.8 72.1 72.8 72.7
White non-Hispanic 71.7 72.0 72.6 73.2 73.8 74.3 74.5 75.4 76.0 75.8
Black 44.1 44.8 45.6 46.3 47.2 47.4 47.3 48.1 49.1 48.2
Other race 51.0 52.5 53.0 53.7 53.5 54.2 54.7 56.0 58.6 59.2
American Indian, Aleut, Eskimo 51.6 51.7 54.3 56.1 56.2 55.4 54.6 54.3 55.6 58.2
Asian, Pacific Islander 50.8 52.8 52.6 53.1 52.8 53.9 54.7 56.3 59.8 60.1
Hispanic 42.8 43.3 44.7 45.5 46.3 47.3 48.2 46.7 48.1 49.5
Non-Hispanic 67.4 67.8 68.3 68.9 69.5 69.9 70.0 70.8 71.5 71.2
FIGURE 1.2 HOME OWNERSHIP BY RACE AND ETHNICITY OF HOUSEHOLDER (1996–2005)a
aThe home ownership rate is the percentage of home owning households in the given demographic group. Sourceis the U.S. Census Bureau Web: www.census.gov; Information Please Database Pearson Education Inc.
24. According to the U.S. Census Bureau’s Report on Minorities by County released August 9, 2007, approximatelyone in every 10 of the nation’s 3,141 counties has a population that is greater than 50 percent minority.
25. Congressional Hispanic Caucus Institute HOGAR Initiative, An Assessment of Hispanic Homeownership—Trendsand Opportunities , 2005, Section 1: Executive Summary, p. 3.
26. See Congressional Hispanic Caucus Institute, National Housing Initiative Focus Group Findings: Cross-Site Report ,June 2004, ndings from Atlanta, GA, Section IV Major Findings, Part B. Barriers to Homeownership, p. 36, fordetailed supporting examples.

Abrahams, Clark and Mingyuan Zhang. Fair Lending Compliance: Intelligence and Implications for Credit Risk Management. Copyright © 2007, SAS Institute Inc., Cary, North Carolina, USA. ALL RIGHTS RESERVED. For additional SAS resources, visit support.sas.com/bookstore.
Abrahams c01 2 11/10/07 7
CHANGING MARKETS 7
The number of consumers in the underserved market is in the tens of millions, with some portionfalling into the underbanked or thin credit le category, and the rest is identied as unbanked.27
By default, these consumers today may be denied credit or put into programs geared toward thesubprime segment of the consumer credit pool. In the latter case, they are charged higher prices(rates, fees, margins) than those offered to “more established” consumers.28
Loan originators can signicantly help provide fair access and pricing to individuals and house-holds that fall outside of the more traditional credit-based nancing model. In order to more rapidlyassimilate the massive number of consumers who fall outside of the mainstream usage of credit, akey area is nding new ways to view and model their default risk. To do so, one must identify andtap alternative data sources that can provide signicant information value relative to qualifyingunbanked and underbanked consumers for nancial products and services.29 We recognize thatsome utility and other payment information has been available, and assessed to some degree, priorto this time. At least one of the major credit bureaus has maintained this type of informationin some markets for over 20 years. In addition, a standard means for reporting alternative datahas already been developed, for example, the Metro II format from the Service Bureau.30 Overthe past few years, the Information Policy Institute has conducted research on how underservedconsumers can gain increased access to credit, especially in the area of nontraditional data.31 Keyndings of their latest study of 8 million credit les (including consumers with thin les or thosethat are unscorable) are that:
• There is similarity in risk proles among traditional consumers and their nontraditionalcounterparts.
• Nontraditional data make extending credit easier.• Minorities and the poor benet more than expected from nontraditional data.• Nontraditional data decrease credit risk and increase access.• Nontraditional data has relatively little effect on the mainstream population.• Scoring models can be improved with more comprehensive data.
27. “Lenders rely heavily on credit scores to make credit decisions. An estimated 32 million Americans, however, havecredit les that do not have sufcient information to calculate standard credit scores. An additional 22 millionhave no les at all.” See Afshar, Anna. “Use of Alternative Credit Data Offers Promise, Raises Issues,” NewEngland Community Developments—Emerging Issues in Community Development and Consumer Affairs, FederalReserve Bank of Boston, Issue 1, Third Quarter 2005.
28. Studies have found that in case of “thin” or no credit history, minority applicants are more likely to be denied fora loan than nonminority applicants. For example, an analysis of the Boston Fed data (Han, Song, Learning andStatistical Discrimination in Lending, unpublished manuscript, 2002) found that, for the subsample with no credithistory information, very large racial differences exist in underwriting outcomes, versus no racial differences forthe subsample where information on credit history is available. This was termed as statistical discrimination. Seealso Ross, Stephen L. “What Is Known about Testing for Discrimination: Lessons Learned by Comparing acrossDifferent Markets,” University of Connecticut Working Paper 2003-21, 2002, pp. 54–58. Another hypothesis thathas been raised is that racial effects may be signicant only for the nancially disadvantaged subgroup. See Hunter,William C. and Mary Beth Walker. “The Cultural Afnity Hypothesis and Mortgage Lending Decisions,” Journalof Real Estate Finance and Economics , Springer, vol. 13(1), 1996, pp. 57–70.
29. Afshar, 2005. Asfhar reports on alternative sources of payment data and that the “big three” national credit bureausare beginning to investigate ways of expanding their own credit scoring models to include alternative data.
30. Using Metro II Credit Reporting Software, businesses report debtor and consumer accounts to the major creditreporting repositories. Supported industries include automobile dealers, nance companies, collection agencies,utilities, property management rms, banks, credit unions, mortgage companies, jewelry stores, government, lawrms, educational institutions, medical billing agencies, and more.
31. See Turner, Michael, S. Alyssa Lee, Ann Schnare, Robin Varghese, and Patrick D. Walker. Give Credit WhereCredit Is Due: Increasing Access to Affordable Mainstream Credit Using Alternative Data , Political and EconomicResearch Council and the Brookings Institution Urban Markets Initiative, December 2006; and Information PolicyInstitute, Giving Underserved Consumers Better Access to the Credit System: The Promise of Non-Traditional Data ,July 2005.
Abrahams, Clark and Mingyuan Zhang. Fair Lending Compliance: Intelligence and Implications for Credit Risk Management. Copyright © 2007, SAS Institute Inc., Cary, North Carolina, USA. ALL RIGHTS RESERVED. For additional SAS resources, visit support.sas.com/bookstore.
Abrahams c01 2 11/10/07 8
8 CREDIT ACCESS AND CREDIT RISK
Alternative information must be tapped that can be used to assess consumer riskiness; saving habits;employment stability; nancial capacity; and breadth, depth, and history of relationships withproviders of essentials (i.e., utilities, telecommunications, housing, transportation, etc.). Chapter6 explores some new ways to develop models that can accommodate missing information andalternative data to help evaluate underserved and unbanked consumers for loans.
The foregoing discussion has touched on the “opportunity side” of compliance and risk man-agement. Fair lending is no longer just a compliance issue. It has a signicant impact on variousaspects of an institution’s business growth and operations. In particular, it will evolve to moredirectly affect an institution’s marketing strategies and revenue-generating opportunities, largelythrough the evolution of a new generation of credit risk models and multilevel customer seg-mentation strategies.32 These models and strategies will not only pertain to customers and theparameters of the nancial transaction; they will span external factors in the macroeconomic,community-based, sociological, and cultural realms.
PREPARE FOR THE CHALLENGES
The foregoing discussion implies that institutions must effectively respond to the changing envi-ronment. Failure to do so can have serious consequences. From the view of the board of directors,the regulatory community, shareholders, and corporate management, the following are criticalconcerns that must be satised by any nancial institution on a continual basis:
• Trust that nancial performance results will be reported accurately and in a timely manner.• Condence in management’s ability to swiftly detect and correct problems.• Belief that the institution has processes and plans in place of sufcient quality to safeguard
the operation, while providing a fair return to shareholders.• Ability to achieve and maintain compliance with all applicable laws and regulations.• Adequate internal control strength to ensure operational effectiveness and compliance with
internal policies.• Constantly strive for greater efciency by identifying and eliminating redundant or unnec-
essary processes, people, and systems to ensure a streamlined organization.• Mold a culture that is customer focused and results oriented, with individual accountability
at all levels of the rm.
To ensure that these concerns are met, a nancial institution’s primary regulator will periodicallyconduct various exams to perform an independent verication. In order to avoid surprises in theseexams, it is desirable to know ahead of time how well an institution is performing and complyingwith the laws and regulations in question. Financial performance is included, in addition to lawsand regulations, because regulators worry a great deal about the nancial strength of nancialrms. They use the Uniform Financial Institutions Rating System33 (commonly referred to asCAMELS), which focuses on capital adequacy, asset quality, management and administration,earnings, liquidity, and sensitivity to market risks.
Several problems confront most institutions that desire to institute a proactive versus reactivecompliance program. First, it is very difcult to stay on top of the mountain of information thataccumulates during each exam period (usually two or more years). Information emanates from amultitude of sources in a variety of databases on a mixture of platforms and operating systems.
32. As a result, the new OCC examination procedures emphasize evaluation of credit scoring in the context of fairlending. See OCC Fair Lending Examination Procedures: Comptroller’s Handbook for Compliance, Appendix D,Fair Lending Sample Size Tables, April 2006, pp. 47, 95–97.
33. See Glantz, Morton, Managing Bank Risk: An Introduction to Broad-Based Credit Engineering . Academic Press,2002, pp. 375–379.

Abrahams, Clark and Mingyuan Zhang. Fair Lending Compliance: Intelligence and Implications for Credit Risk Management. Copyright © 2007, SAS Institute Inc., Cary, North Carolina, USA. ALL RIGHTS RESERVED. For additional SAS resources, visit support.sas.com/bookstore.
Abrahams c01 2 11/10/07 9
PREPARE FOR THE CHALLENGES 9
Second, data is multidimensional and often must be compiled at the transaction or account level,then organized via segment, assessed, aggregated and compared, trended, and nally summarized.Compliance staff struggle in their attempts to make a multitude of meaningful comparisons relativeto their past performance; to other lenders operating in the same market; and across geographies,legal entities, different types of loans, and different groups of loan applicants. Often, they arestill in a risk investigation mode, rather than a risk mitigation mode, when the regulators begin topoint out suspect patterns and potential issues. In short, they nd themselves behind the curve withrespect to business intelligence. Third, accessibility of information instills condence in regulators,and it can be crucial in preparation for safety and soundness examinations. Often, internal analysisis not initiated until data is in the hands of the regulatory examiner or is triggered in quick-responsesituations, such as when a Community Reinvestment Act (CRA)-related protest is lodged, or whena problem surfaces as the result of a customer complaint, governmental inquiry, or discovery orderrelated to a pending legal action is received, and so forth. In these situations, banks can exhaustthe review period in a defensive mode while they attempt to gather data that would demonstratesatisfactory performance.
The question becomes: “How can nancial institutions avoid surprise and the attendant reactionmode that accompanies it?”
The answer to this question is more easily stated than achieved. Specically, institutions canachieve the desired result only after they have put effective processes in place to support an ongo-ing rigorous compliance self-assessment program. Lenders must maintain, improve, and validateexisting credit risk evaluation models that are used to measure and price the risk of borrowers andtheir nancial transactions. These processes must afford users with the condence that comes withknowing that the business and analytic intelligence they provide is rooted in data, processes, andanalytical engines that are transparent and that have undergone rigorous and comprehensive val-idation. Comprehensive, accurate, and timely business and analytic intelligence results in greaterinsight, leading to foresight and the ability to avoid surprises and costly missteps. Issues are sur-faced early on and are dealt with appropriately before they pose problems and consume signicantresources.
There are three regulatory concerns that have echoed across nancial services over the past fewyears: (1) the need for process validation, (2) the necessity of having an issue surfacing culture,and (3) transparency.
Process Validation
With respect to any law, or regulation, or internal policy or guideline, how does an institutionsatisfy itself that it is in compliance? Often, compliance failures go undetected for some periodof time, only to surface long after their occurrence during a formal regulatory exam, as theresult of a customer or governmental agency complaint, or from inquiries from the news media.Enterprise compliance solutions must provide a window into the multilayered infrastructure of anorganization. To accomplish this, information must be brought in from a variety of sources rangingfrom large central transaction systems, to process-owner business rule repositories, to individualdepartmental data stores. The information is interpreted, translated, and, if necessary, correctedbefore being stored. This information value chain is completed when an intelligent storage facilityenables access that facilitates analysis, visualization, and subsequent reporting of results. What wehave just described is an enterprise intelligence platform (EIP).34
Errors can originate in the data, or they can occur due to processing aws. To the extent thatprocesses can be automated, validation of computer programs is more sustainable and can be
34. For a more in-depth explanation and review of this kind technology and its components, see Schwenk, Helena,SAS: SAS Enterprise Intelligence Platform, Ovum Ltd., January 2006, www.ovum.com.

Abrahams, Clark and Mingyuan Zhang. Fair Lending Compliance: Intelligence and Implications for Credit Risk Management. Copyright © 2007, SAS Institute Inc., Cary, North Carolina, USA. ALL RIGHTS RESERVED. For additional SAS resources, visit support.sas.com/bookstore.
Abrahams c01 2 11/10/07 10
10 CREDIT ACCESS AND CREDIT RISK
achieved and demonstrated far more easily than similar manual processing. Statistical samplingcan be used to monitor data quality and collection process. For compliance testing and creditunderwriting and pricing, it is important to evaluate loan policy, guidelines, and approval process.35
Another source of errors is the misuse of models or the use of inaccurate models. We devote thelast chapter of the book to the topic of model validation relatively to all aspects (i.e., input,processing, and output).
Issue Surfacing Culture
The cornerstone of this objective is clear communication that the messenger will not be shotand mistakes will happen, but attempts to conceal them will not be tolerated. Shareholder andregulator trust depends on the belief that the institution can effectively identify and manage riskexposures. It is important to quickly formulate and execute all necessary corrective measures andrisk management strategies so as to lessen, or avoid, any negative consequences.
The hallmark of a chief executive ofcer (CEO), or C-level management, is leadership. Corpo-rate leadership requires that executives set aside personal agendas and other conicts of interestand do what is in the best interest of the rm and its reputation for high integrity, fairness in allbusiness dealings, and transparency to regulator agencies, shareholders, and the public at large.Condence that an institution knows what is going on, and quickly corrects problems before theybecome signicant exposures is core to owning stakeholder trust and it is very difcult to recap-ture when major failures come to light or negative performance trends come into question. Majorinternal control failures that result in nancial injury to customers can cause a nancial institutionto be put under close supervision by its primary regulatory agency. The resulting burden of greaterregulatory oversight can approach an all-consuming exercise for executive management and theboard audit and compliance committees. The military phrase “punishment will continue until atti-tude improves” may come to mind for an executive management team that nds that while theymay have addressed most of the concerns that initially led to their problems, the closer oversightprocesses has managed to surface new and material internal control weaknesses in completely dif-ferent areas, frequencies of corporate policy exceptions that are above tighter imposed regulatorythresholds, technical violations of regulations, or worse, clear violations of law.
Maintaining vigilance in this area is especially challenging in times where budgets are tightand focus is most often directed to revenue-generating activities in preference to rooting outrule-bending or rule-breaking behavior. Common reasons for not ensuring that sufcient earlywarning and intelligence-gathering systems are in place to detect violations of fair lending policyand law include:
• “If it doesn’t appear to be broken, don’t x it.”• “We don’t want to open a can of worms.”• “We don’t want to waste resources checking out false warnings.”• “It is more defensible to not know about a problem than to surface possible warning signs
and do nothing about them.”• “We don’t want to create evidence that can be discovered by a plaintiff or government
oversight/enforcement agency and used against us in court.”
The path commonly referred to as the ostrich approach is sometimes promoted by one or moreof these lines of reasoning.
Unfortunately, this sort of defensive strategy may save money in the short run, but it exposesthe institution to potentially much higher future costs associated with consequences of preventable
35. This is one of the principles for credit risk management. See Basel Committee on Banking Supervision, “Principlesfor the Management of Credit Risk,” July 1999, p. 15, paragraph 43.

Abrahams, Clark and Mingyuan Zhang. Fair Lending Compliance: Intelligence and Implications for Credit Risk Management. Copyright © 2007, SAS Institute Inc., Cary, North Carolina, USA. ALL RIGHTS RESERVED. For additional SAS resources, visit support.sas.com/bookstore.
Abrahams c01 2 11/10/07 11
PREPARE FOR THE CHALLENGES 11
and undetected regulatory violations. Those consequences include direct losses stemming fromimmediate nancial losses on transactions, or across a portfolio or customer segment. Losses maycontinue over time, with lawsuits, business interruption, restitution, write-downs on asset values,regulatory and taxation penalties, higher insurance premiums, lower debt ratings, distraction ofcompany senior management from normal priority of responsibilities, loss of shareholder value,damaged employee morale, and reputation/brand damage. A recent Wharton Business Schoolstudy36 reported that operational loss events have a signicant negative impact on stock price(market value) on the institution for both the banking and insurance industries. The size of themarket value loss for an institution was found to be several times (i.e., four to ve times) theoperational loss reported by the institution.37
A strategy of “not wanting the power to know what is going wrong” exposes the board ofdirectors to civil money penalties and nes that potentially could surpass director and ofcer(D&O) issuance coverage. The simple truth is: What you don’t know can hurt you, your rm, andyour corporate board. Hence, it would seem that there should be ample justication for investmentsin time and resources on strengthening internal controls, and leveraging technology so as to lessenthe likelihood that serious problems will go undetected. Putting together a business case forcompliance technology investment is an exercise that must be specic to each institution. This isbecause risk exposures and control strength vary by institution. For example, relative to HMDAand fair lending, two institutions may have identical volume and a similar geographic footprint,but different odds ratios and disparity indices. With respect to controls, one lending institutionmay be using old technology or manually intensive processes that are error-prone versus anotherinstitution that has a state-of-the-art compliance solution in place. In most cases, analysis willshow that the cost of such an investment is small in comparison with the expected market valueerosion. As we will see in the next major section, you need to estimate expected losses by takinginto account both the likelihood and impact of various sorts of problems, or outcomes, underdifferent scenarios and adjust for market value erosion as a nal step (i.e., the four to ve timesfactor mentioned earlier).
As a key strategy, nancial institutions need to signal their effectiveness in compliance riskmanagement and control. Public disclosure of your ERM program is an example of one suchsignal. The delivery mechanism could be a supplemental section in the corporate annual report ora stand-alone report issued periodically to shareholders, stock analysts, and rating agencies. Thiscan serve to minimize potential market value erosion when an operational event ends up happeningby chance even when compliance risk management and effectiveness of controls in the institutionare of high quality. Certainly, if an institution that is not subject to Basel II compliance38 wereto voluntarily raise the bar on itself and qualify for the advanced measurement approach underBasel II for credit or operational risk management, that would also be a signal.
Another Wharton Study39 showed that there is spillover effect (in terms of stock price drop) onother institutions in the industry when large loss events occur. That is, investors perceive the reportof a large operational event as symptomatic of poor operational risk management and controlsthroughout the industry. An industry effect generally makes sense for certain environmental factors(e.g., movements in interest rates, where compression of spreads occurs when rates rise andwidening of spreads occurs when rates fall). Still balance sheet structure can amplify, or mute, theindustry average affect. The market does have access to a fair amount of nancial information.
36. See Cummins, J. David, Christopher M. Lewis, and Ran Wei. “The Market Value Impact of Operational LossEvents for US banks and insurers,” Journal of Banking & Finance, Vol. 30, Issue 10, October 2006, pp. 2605–2634.
37. Recent settlements in compliance areas such as predatory and subprime lending practices that have been inthe multi-hundred-million-dollar range represent huge operational losses stemming from thousands of individualtransactions.
38. For example, insurance companies, nonbank nancial companies, medium-sized banks in the United States.39. Cummins, Lewis, and Wei, 2006.

Abrahams, Clark and Mingyuan Zhang. Fair Lending Compliance: Intelligence and Implications for Credit Risk Management. Copyright © 2007, SAS Institute Inc., Cary, North Carolina, USA. ALL RIGHTS RESERVED. For additional SAS resources, visit support.sas.com/bookstore.
Abrahams c01 2 11/10/07 12
12 CREDIT ACCESS AND CREDIT RISK
In the case of operational failures, this result falls more into the category of “guilt by association.”Markets do not have access to control strength information to gauge vulnerability to the sametype of event across rms. The spillover impact is scary because it is not rooted in demonstrablelinkages, but rather market perception. Thus, a nancial institution can suffer market value erosiondue to poor compliance risk management in other institutions—something completely beyond itscontrol. Of course, the average effect is much smaller than the average market value erosion ofthe institution in which the event happened.
All the more reasons for good nancial institutions to signal their effectiveness in compliancerisk management and control to the market. Signaling is needed because, in the foreseeable future,investors and rating agencies will not be in a position to determine after the fact whether oneinstitution is better than another in compliance risk management.
Transparency
Transparency refers to the ability of any interested party to view the operation and all of its partsin such a manner as to make it readily apparent to the observer what is being performed and howit is being performed. This not only facilitates third-party review (e.g., internal audit or primaryregulator), but it also facilitates end-to-end process validation. For starters, transparency beginswith compliance solution design and standards that:
• Foster self-documenting procedures and system-generated reports and analysis.• Require internal program comments by developers.• Produce external functional documentation that provides linkage to specic regulatory
requirements.• Afford extensive solution operational documentation that species exactly how the appli-
cation operates, its source inputs, data translations, data and metadata management, algo-rithms, analysis methodology, and how outputs are derived.
Cryptic annotations understood only by the original developers will not sufce. Solutiondevelopment and application documentation are very different skills—rarely found in the sameindividuals, particularly for complex, large-scale solutions.
You will need to have documentation expertise available not only for the development stageand ongoing change management of the automated portions of your self-assessment program,but also to document the manual procedures followed by staff as they perform tasks throughoutthe self-examination cycle. This becomes even more important during a regulatory examination,where examiners expect full disclosure of the entire process. In-house compliance staff mustbe prepared and capable of convincing corporate executives, the board of directors, externalauditors, and regulatory examiners that compliance program verication is achieved on an ongoingbasis. That can become a daunting task, especially with large and complicated in-house systems.Point solutions, which are not end to end, become fragmented, and process validation must bemade transparent at every control point where a separate application boundary is crossed, such asimport/export to a spreadsheet or a proprietary reporting package. Transparency is elusive whendealing with a multivendor, multicomponent fair lending solution strategy.
If public attention is drawn to your lending practices, it will be hard to defend your position ifthe compliance system lacks auditability. Simply put, your self-assessment solution must providethe ability to trace a logical line from origination systems to aggregate reports. Preliminary adversendings and trends should be subjected to statistical analysis and signicant and material resultsmust be traceable to root causes and supporting information.
Abrahams, Clark and Mingyuan Zhang. Fair Lending Compliance: Intelligence and Implications for Credit Risk Management. Copyright © 2007, SAS Institute Inc., Cary, North Carolina, USA. ALL RIGHTS RESERVED. For additional SAS resources, visit support.sas.com/bookstore.
Abrahams c01 2 11/10/07 13
PREPARE FOR THE CHALLENGES 13
Determine Compliance Strategies
The previous section discussed fundamental principles for lending institutions to prepare for chal-lenges posed by changes in markets and regulations. Now we discuss how to develop strategies toput these principles into action. These strategies will not only require new and improved policiesand procedures, but also the means to measure and monitor performance of compliance programs.It is important to evaluate your current position in terms of program maturity in order to designappropriate compliance strategies.
Compliance program evolution is intertwined with corporate information evolution. Davis,Miller, and Russell (2006) present an information evolution model. The model classies companiesbased on their maturity in “managing information as a strategic asset as a function of infrastructure,people, process and culture.” The model entails ve stages relative to information capabilities.40
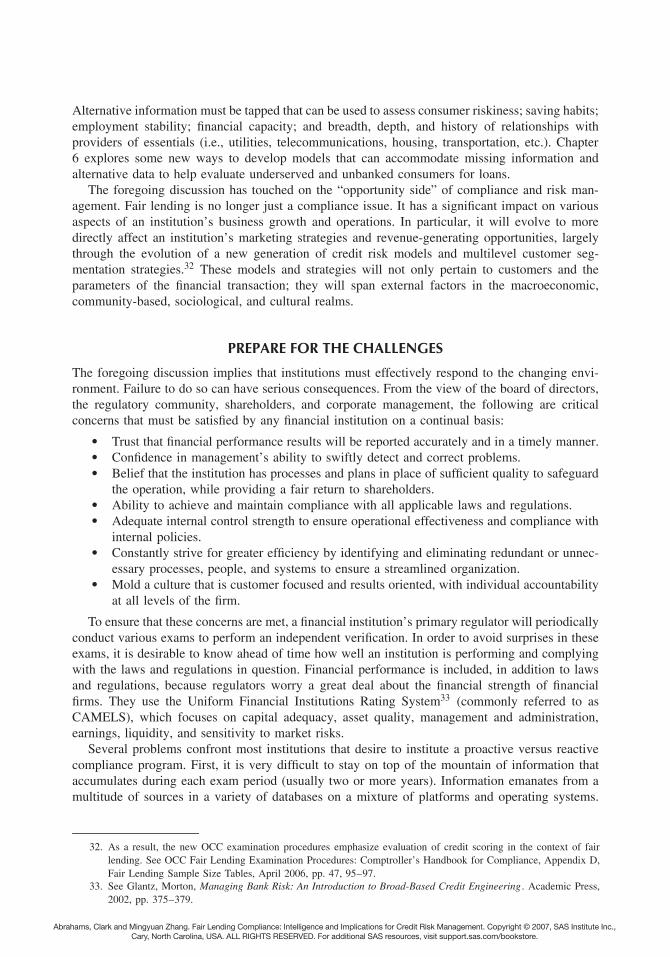
Compliance programs also fall into one of ve different stages of maturity, and Figure 1.3 showsthe stages in order of increasing maturity, effectiveness, efciency, and control strength.41
At Stage 1, governance is in place (e.g., committees meet regularly with written charters, anda basic program is in place that is board approved). Processes are largely manual and unreliable.Standards lack consistency and controls are poor.
In Stage 2, previously mastered tasks can be repeated. This stage is characterized by theexistence of some business unit–level standards, policies, and procedures, especially relative to
Maturity
Stage 1 Stage 2 Stage 3 Stage 4 Stage 5Characteristics Initial Repeatable Defined Managed Optimizing
Governance in place: committees withBOD-approved charters meet regularly
X X X X X
Departmental policy and procedures in place forat least the most risky activities
X X X X
Technology deployed and compliance testingperformed but not risk based or effective
X
Compliance testing performed effectively X X X
Technology effectively utilized X X X
Enterprise policy and procedures and metricsin place
X X
High-level enterprise risk assessment X X
Detail-level enterprise risk assessment X
Consistent continuous testing and self-evolvingstandards and policies
X
FIGURE 1.3 COMPLIANCE PROGRAM MATURITY MODEL
40. The ve stages are (1) Operate, (2) Consolidate, (3) Integrate, (4) Optimize, and (5) Innovate, as described byDavis, Jim, Gloria J. Miller, and Allan Russell. Information Revolution: Using the Information Evolution Modelto Grow Your Business. John Wiley & Sons, 2006.
41. Brickman, Joel, and Paul Kurgan, “New Challenges for Enhancing Regulatory Risk Management on an EnterpriseLevel,” Regulatory Compliance Risk Management Conference, American Conference Institute, November 29–30,2006, slides 19–20.

Abrahams, Clark and Mingyuan Zhang. Fair Lending Compliance: Intelligence and Implications for Credit Risk Management. Copyright © 2007, SAS Institute Inc., Cary, North Carolina, USA. ALL RIGHTS RESERVED. For additional SAS resources, visit support.sas.com/bookstore.
Abrahams c01 2 11/10/07 14
14 CREDIT ACCESS AND CREDIT RISK
the more risky activities undertaken through the normal course of business. Technology is inplace, but is not effectively implemented. Compliance testing is performed but is not risk basedor effective in many instances.
In Stage 3 the key compliance processes are characterized and fairly well understood, andwhere risk assessments are performed for all business units. Standards, policies, and proceduresare adequate to address risks at the business unit level. Technology and testing are effectivelyimplemented, but enterprise reporting is still hampered by inability to aggregate information andthe existence of silo inconsistencies.
By Stage 4, the compliance processes are measured and controlled. This stage is whereenterprise risk metrics are dened, and tolerances are board approved in policies and enforcedthrough documented procedures and assigned responsibilities. Effective surfacing and proper esca-lation of issues and accountability for timely resolution is commonplace. High-level assess-ment is performed at the enterprise level. Standards, policies, and procedures are consistentthroughout, and technology and compliance testing are aligned. There is more focus on develop-ing integrated information and technology that will support cross-functional needs and initiatives.Stage 4 builds on the achievements of Stage 3 via continuous process improvement of ways tobetter identify, measure, monitor, and control compliance risk and strengthen internal controls.Strategies are formulated from more powerful risk evaluations of current and potential exposuresthat, in turn, are fueled by more complete and meaningful information. The insight gained resultsin greater foresight.
At Stage 5, the focus is on process improvement. This stage is where a rm realizes a sus-tainable advantage in the compliance risk management arena. Detail-level enterprise assessmentsare performed. Standards, policies, and procedures self-evolve. There is consistent, continuoustesting performed and consistent reporting performed at all levels. Repeatability and adaptabilityof analytical processes is routine.
Clearly, an institution would benet from attaining stage 5, the highest compliance maturitylevel. The general consensus is that most rms are at stage 3 of compliance program maturity.Therefore, most companies need to make the case for stronger, more mature programs. However, itis challenging to make the case to invest in the areas that will safeguard as opposed to generatingrevenue. It is more difcult for a CEO to (1) justify to Wall Street investors his decision tospend money on preventative measures such as strengthening internal controls and the corporatecompliance self-assessment program that reduce shareholder return, than it is to (2) justify to theboard of directors spending four times as much (or more) to mount a legal defense and gathersupporting data and analysis in the wake of a class-action lawsuit alleging lending discrimination.The reason is that in the rst instance, capital spending is voluntary, whereas in the secondinstance there is no choice in the matter and spending even greater sums of money has becomea necessity. The reason for emphasizing the foregoing points is to make the case for a proactivecompliance program that anticipates and heads off trouble, rather than reacting after the fact andmounting a defensive strategy. The next section discusses the tangible returns associated with asolid compliance program, and Appendix 1B frames the business case for a signicant compliancerisk management technology upgrade in a simple and intuitive manner.
RETURN ON COMPLIANCE
Historically, there has not been much attention given to making business cases for compliance riskmanagement. This is primarily due to a couple of factors. First, compliance solutions tended tocover the bare minimum to meet the legal or regulatory requirement. Second, the requirement hadto be met, so there could be little debate over whether to spend money to avoid a violation of law.
Today, the landscape has changed. It is no longer enough to be “compliant” at a point in time.It is now important to anticipate, and indeed head off, future violations. A recent survey of 175

Abrahams, Clark and Mingyuan Zhang. Fair Lending Compliance: Intelligence and Implications for Credit Risk Management. Copyright © 2007, SAS Institute Inc., Cary, North Carolina, USA. ALL RIGHTS RESERVED. For additional SAS resources, visit support.sas.com/bookstore.
Abrahams c01 2 11/10/07 15
RETURN ON COMPLIANCE 15
executives at global nancial rms revealed that compliance is the number two prot concern,with globalization capturing the top spot, and risk in the number three spot.42 The same studyfound that advanced compliance capabilities can be a competitive advantage. It also noted thatnoncompliance is more costly than just penalties, that costs of piecemeal approaches are escalating,and that lack of coordination among initiatives is a common problem.
Fortunately, on a parallel track, we have seen great strides in technology, especially with theadvent of business intelligence that can deliver compliance and risk solutions for an ever wideningarea of regulations, including credit risk management and fair lending. One of the impediments toany modeling exercise is getting the required data. The source of the data consists of a combinationof quantitative modeling results for disparate impact and disparate treatment testing, and variousother sources of compliance intelligence that we point to in the nonquantitative realm in Figure2.10, such as mystery shopping results, policy assessments, and so on. With additional choicesnow available, management is confronted with the question: “What is it worth to have the powerto know the institution’s potential compliance exposures, so that appropriate action can be takento x current problems and head off future ones?”
A simplied framework for constructing a business case for elevating the institution’s compli-ance program to the next level of maturity, or for maintaining a mature program in the wake ofconstant changes and challenges, appears in Appendix 1B.43 Most companies budget for expensesand capital expenditures on an annual basis. Constructing a business case is usually a prerequisitefor obtaining approval to add resources, upgrading technology, and so forth. This high-level busi-ness case for a compliance technology upgrade points out examples of the sorts of things that needquantication. In developing this simple business case, we have tapped the examination guidelinesto identify four primary areas of key risk factors; exam focal points typically will drive off of these,and they vary by institution based on a number of criteria (e.g., past examination ndings, HMDAdata, prevailing customer complaints, etc.). Business intelligence solutions can help trace eventsto their root cause in order to nd and x problems. By benchmarking performance and settingthresholds on key indicators, you can identify performance that is out of the norm or trendingnegatively, and set priorities and focus accordingly. This presumes the following questions havebeen answered. How should performance be measured, and what level of compliance performanceis desired? Who decides and who sets the standards? How often should the standards be reviewedand changed? Should reviews be performance triggered?
In addition to making a business case for improving regulatory compliance risk management,we see a solid case to be made for adopting a more integrated approach toward compliance riskmanagement and ERM in general. At the highest level, the board of directors has responsibility forgauging the risk-bearing capacity of the rm and setting risk tolerances accordingly. The board,however, can only know based on what management provides to them, the opinions of independentauditors, and possibly external legal counsel and consultants retained by it or management. It isvital that critical information on risk exposures be appropriately quantied and surfaced to theboard in a timely manner. This requires solid risk management and rigorous control assessment. Allforms of internal and environmental changes must be monitored. The process should be efcientto ensure complete coverage, while avoiding redundancy. We assert that a more fully integratedapproach strengthens the capability to account for, indeed exploit, natural dependencies that existacross compliance areas so as to avoid over/underestimating risk exposures. An example would
42. Ribeiro, Jack. “Global Services Industry Outlook—Shaping Your Strategy in a Changing World.” Deloitte &Touche USA LLP, 2006 and Brickman and Kurgan, 2006, slides 2–4.
43. Model assumptions concerning the probability distributions of various categories of compliance exposures and theimpact of compliance controls may be based on experience in the eld, and also on data and test results from theinstitution’s fair lending self-examination program. The impact of fair lending exposures can be estimated fromboth past internal information, and also external sources such as public disclosures of the terms of settlements oflawsuits brought for violations of related laws and regulations.

Abrahams, Clark and Mingyuan Zhang. Fair Lending Compliance: Intelligence and Implications for Credit Risk Management. Copyright © 2007, SAS Institute Inc., Cary, North Carolina, USA. ALL RIGHTS RESERVED. For additional SAS resources, visit support.sas.com/bookstore.
Abrahams c01 2 11/10/07 16
16 CREDIT ACCESS AND CREDIT RISK
be credit risk management and fair lending compliance, because credit scoring impacts access tocredit in addition to controlling credit default risk. Another would be incorporating CRA goalsetting with effective tapping of emerging markets using alternative credit underwriting modelsfor nontraditional users of credit, while simultaneously satisfying strategic plan goals aimed atimproving the lender’s annual HMDA peer fair lending results. In Chapter 8, we explore ways toaddress these multiple objectives using a credit and compliance optimization process (CCOP).

Abrahams, Clark and Mingyuan Zhang. Fair Lending Compliance: Intelligence and Implications for Credit Risk Management. Copyright © 2007, SAS Institute Inc., Cary, North Carolina, USA. ALL RIGHTS RESERVED. For additional SAS resources, visit support.sas.com/bookstore.
Abrahams c01 2 11/10/07 17
TAXONOMY OF ENTERPRISE RISKS 17
Appendix 1ATAXONOMY OF ENTERPRISE RISKS
Credit risk Risk arising from an obligor’s failure to meet the terms of any contract with thebank or otherwise failing to perform as agreed. Arises anytime bank funds are extended,committed, or otherwise exposed through actual or implied contractual agreements.
Interest rate risk Risk arising from movements in interest rates. The economic perspectivefocuses on the value of the bank in today’s interest rate environment and the sensitivity ofthat value to changes in interest rates.
Liquidity risk Risk arising from an inability to meet obligations when they come due, possi-bly incurring unacceptable losses. Includes the inability to manage unplanned decreases orchanges in funding sources or address changes in market conditions.
Price risk Risk to earnings or capital arising from changes in the value of portfolios of nancialinstruments. This risk arises from market-making, dealing, and position-taking activities ininterest rate, foreign exchange, equity, and commodities markets.
Transaction risk The current and prospective risk to earnings and capital arising from fraud,error, and the inability to deliver products and services, maintain a competitive position, andmanage information. Risk is inherent in efforts to gain strategic advantage and in the failureto keep pace with changes in the nancial services marketplace. Transaction risk is evidentin each product and service offered. Transaction risk encompasses product development anddelivery, transaction processing, systems development, computing systems, complexity ofproducts and services, and the internal control environment.
Compliance risk Risk arising from violations or nonconformance with laws, rules, regulations,prescribed practices, or ethical standards.
Strategy risk Risk arising from adverse business decisions or improper implementation of thosedecisions. A function of the compatibility of an organization’s strategic goals, strategiesdeveloped to achieve those goals, and the quality of implementation.
Reputation risk Risk arising from negative public opinion. Affects the ability to establish newrelationships or services, or to continue servicing existing relationships. Can expose the bankto litigation, nancial loss, or damage to its reputation.

Abrahams, Clark and Mingyuan Zhang. Fair Lending Compliance: Intelligence and Implications for Credit Risk Management. Copyright © 2007, SAS Institute Inc., Cary, North Carolina, USA. ALL RIGHTS RESERVED. For additional SAS resources, visit support.sas.com/bookstore.
Abrahams c01 2 11/10/07 18
18 MAKING THE BUSINESS CASE
Appendix 1BMAKING THE BUSINESS CASE
This appendix presents a simplied numerical example to illustrate return on compliance programinvestment. The modeling technique used is Monte Carlo simulation. Model assumptions concern-ing the probability distributions of various categories of compliance exposures and the impact ofcompliance controls can be estimated. The basic idea is that we have risks, controls designed todeal with risks, and a gap that exists when dollar risk exposures are netted against controls overdollar exposures. The gap may be positive, negative, or zero. A positive gap says that there issome residual risk of loss. A negative gap says that there is a surplus of capacity to deal withrisks that exceed those considered to fall within assumed ranges for the modeling exercise. A zerogap means that according to the model assumptions and current business environment, the riskexposure is covered.
For the purposes of illustration we adopt a simplied view of quantifying fair lending regulatoryrisk. There are several other areas of fair lending exposure; here, we consider just four, namelyunderwriting, pricing, steering, and redlining. We will not go through all four areas in detail, butwe do want to drill down a bit further into one of them, namely, pricing, to examine how one canquantify exposures and then postulate a model that can be used to construct a range of possibleoutcomes.
Consider pricing risk from a fair lending perspective, which we cover in greater detail inChapter 4. Actual damages are authorized by the Equal Credit Opportunity Act (ECOA), FairHousing Act (FHA), Unfair and Deceptive Acts and Practices (UDAP), and state statutes (preda-tory lending laws), and pertain to economic injury. For punitive damages, a plaintiff must showintent (e.g., predatory lending where minorities are targeted, etc.). The general idea is that pric-ing exposures are a function of monetary damages, the cost of policy and procedure changes,staff training, regulatory nes and greater oversight burden, direct legal defense and court costs,consequences of damaged reputation, and so forth.
Isolating compensatory monetary damages, we nd that these expenses are a function of theinjured class denition, and the loss denition. The injured class and loss denitions are basedon the allegation that entails the amount of points and interest differential and the incidence byproduct type, geographic area, and time period. Measurement of damages requires a denitionof what level of statistical signicance is material44 and scenario testing where assumptions arevaried to gauge the effect on damages. The damage measurement can be done on a group averagedifferences basis or on actual differences by borrower. For example, if the method is averagedifferences, we might have 5,000 class members with a protected class average loan rate of 9percent, a nonprotected class average loan rate of 6 percent, for a difference of 3 percent. If theaverage loan amount is $100,000 and the average actual loan term is 60 months, then the average
44. This may be determined by the court, negotiated based on statistical signicance, the Reasonable PersonRule, etc.

Abrahams, Clark and Mingyuan Zhang. Fair Lending Compliance: Intelligence and Implications for Credit Risk Management. Copyright © 2007, SAS Institute Inc., Cary, North Carolina, USA. ALL RIGHTS RESERVED. For additional SAS resources, visit support.sas.com/bookstore.
Abrahams c01 2 11/10/07 19
MAKING THE BUSINESS CASE 19
settlement for a single loan would be in the neighborhood of $15,000, and for the entire class thedamages would be in the neighborhood of $75 million!
So far, we have only quantied compensatory monetary damages. The injured class can requesta jury trial. Publicity and potential damages are very signicant, and agreeing to a settlement toavoid that scenario can be very costly. Increased regulatory oversight can consume managementand open cans of worms everywhere—not just around the cause of the action. The questionbecomes: “What else is wrong with the institution’s internal controls that pose a serious risk thatremains undetected?” With heightened scrutiny, problems can snowball. The other categories ofrisk exposures can be estimated in a similar fashion. To recap, the process consists of identifyinghow many instances of a potential violation exist, estimating the likelihood that an issue will beraised, and gauging the impact per instance and then multiplying probabilities times the impact toestimate total exposure.
Turning to controls, quantication can be done relative to each exposure individually to net outto a residual risk exposure, or it can be done at a high level. For the sake of illustration we usea collective, high-level range—best/worst case ($16/$10.5 million) and most likely ($12 million)estimate. This assumes an average $12 million risk reduction with the current level of stafng andcosts associated with fair lending compliance areas. Realistically, you can only throw so manybodies at a problem, and we assume in this particular case that $16 million is the limit withoutchanging the technical environment. The other levers that are available would be the parametersaround your internal control structure, such as:
• Underwriting. Regression 95 percent condence level by channel, by loan purpose, byregion.
• Pricing. Overage/underage incidence 0.5 percent; amount = 15 basis points (bp).• Pricing. HMDA peer data average spread = 25 bp over/75 bp under threshold.• Steering. Percent subprime qualied for prime less than 5 percent.• Redlining. HMDA peer data market penetration disparity index less than 1.5x.
Tightening your control structure by incrementally performing more rigorous monitoring asproblems surface, by adding metrics and lowering policy thresholds to reduce false negatives, isthe most commonly encountered strategy. A compliance intelligence solution upgrade representsanother option that requires a larger initial investment, but can afford signicant reduction inexposures to costly compliance failures. The compliance solution upgrade can also include tech-nology that can test with models having a closer t to the business reality, so that problems canbe better surfaced without dramatically increasing the number of false positives, as would be thecase by simply tightening down the parameters described above. Analogous to the operationalrisk paradigm, the expected compliance exposure (cost) is the average annual aggregate nan-cial impact, and unexpected compliance exposure represents the volatility above this average at aspecied condence level.
Figure 1.4 provides the estimated exposures by compliance area for our business case. Forpricing, we are assuming that there is a minimum exposure of zero dollars, maximum of $18million, and most likely exposure of $2 million. These estimates are based on the institution’spricing disparity ratios in the HMDA data, on compliance testing results relative to underages andoverages, both amount and incidence, and so on. Similarly for the other areas, the estimates wouldbe based on key risk indicators and also specic compliance testing results for those respectiveareas. (We describe these tests in Chapters 3, 4, and 5.)
We do not go into the derivation of the distributions, and emphasis here is not on the specicform of the distributions, but rather the idea of using standard distributions to model risk. Byspecifying risk distributions, the volatility is captured to incorporate unexpected outcomes in thebusiness case. The dollar exposures are estimated by running 6,000 trials using these distributions.

Abrahams, Clark and Mingyuan Zhang. Fair Lending Compliance: Intelligence and Implications for Credit Risk Management. Copyright © 2007, SAS Institute Inc., Cary, North Carolina, USA. ALL RIGHTS RESERVED. For additional SAS resources, visit support.sas.com/bookstore.
Abrahams c01 2 11/10/07 20
20 MAKING THE BUSINESS CASE
Compliance Examination Estimated DollarArea Assumed Distribution and Parameters Exposure
Underwriting Truncated normal distribution $2,008,919
µ = 1; σ = 2; Min = 0; Max = $6MM
Pricing Triangular distribution $6,559,755
Min = 0; Max = $18MM; Most likely = $2MM
Redlining Truncated normal distributionµ = 1.5; σ = 3; Min = 0; Max = $12MM
$3,009,435
Steering Lognormal distribution µ = 2; σ = 1.5 $1,986,977
Total Exposure composite distribution $13,565,086
FIGURE 1.4 EXPOSURE DISTRIBUTIONS BY COMPLIANCE EXAMINATION AREAS
00
2
4
Per
cent
6
8
10
MeanSkewness
13.505150.369408
12
3 6 9 12 15 18
Fair Lending Compliance Exposure
21 24 27 30 33 36 39
FIGURE 1.5 ANNUAL FAIR LENDING COMPLIANCE EXPOSURE DISTRIBUTION ($MILLIONS)
The combination of these outcomes represents the $13.5 million total exposure to fair lending riskin a single year as depicted in Figure 1.5.
In the beginning of this appendix we introduced the concept of the gap, and this result, coupledwith a simulated $12,750,000 risk reduction from current control structures (based on the triangulardistribution assumptions stated earlier), leaves a quantied gap for the business case that amountsto an average of $750,000 in year one. The simulation model in this example also tells us thatif our goal is a zero gap over each of the next ve years, the likelihood of meeting goal with a

Abrahams, Clark and Mingyuan Zhang. Fair Lending Compliance: Intelligence and Implications for Credit Risk Management. Copyright © 2007, SAS Institute Inc., Cary, North Carolina, USA. ALL RIGHTS RESERVED. For additional SAS resources, visit support.sas.com/bookstore.
Abrahams c01 2 11/10/07 21
MAKING THE BUSINESS CASE 21
status quo strategy in each of years 1 through 5 is approximately 73, 19, 43, 56, and 63 percent,respectively.
Using the prevailing ve-year cost of funds rate as a conservative discounting factor, anddiscounting beginning in year two, we nd that the exposure over ve years is $7.5 million, intoday’s dollars, in order to maintain the status quo. As an alternate strategy, we consider theimpact of a technology upgrade. Suppose that the compliance department, in partnership with theMortgage Subsidiary and Community Development Bank, purchases a new integrated compliancesolution that spans Fair Lending/HMDA/CRA at a cost of $5.0 million over ve years. The resultis a lowering or risk of operational losses associated with potential violations of various lawsand regulations. Under the Basel II Advanced Measurement Approach, the institution will havean updated control self-assessment relative to operational risk. We consider the case where theimpact on capital is to lower requirements by $10 million due to reduced likelihood of violationseither occurring or going undetected relative to the following regulations and areas:
• Regulation C—HMDA• Regulation BB—CRA• Fair Lending—FHA/ECOA• Regulation Z—TILA/HOEPA• Sales practices: Regulation AA—UDAP• External broker/dealer• Marketing diversity• Systems and technology infrastructure
If we assume a hurdle rate of 15 percent, then there is an annual pretax benet of $1.5 millionassociated with the $10 million in capital that has been more protably deployed. Over ve years,discounting again at 7 percent per year (beginning in year one), the accumulated savings in presentday’s dollars is $6.15 million pretax.45
We see in this example that a $5 million investment in new technology can substantiallystrengthen internal controls and achieve a gap of zero over the next ve years. Capital reservereduction associated with the new technology results in an additional $10 million of capital beingproductively deployed at the hurdle rate. The benet from this alone can pay for a signicantportion of the cost of a new solution.
45. Some cash ows in this example are discounted over time, while others are not, such as the capital reservereduction. This is not material to the overall result.