The History of Cartography, Volume 3: Cartography in the European
Upload
emerson-meltonCategory
view
216download
2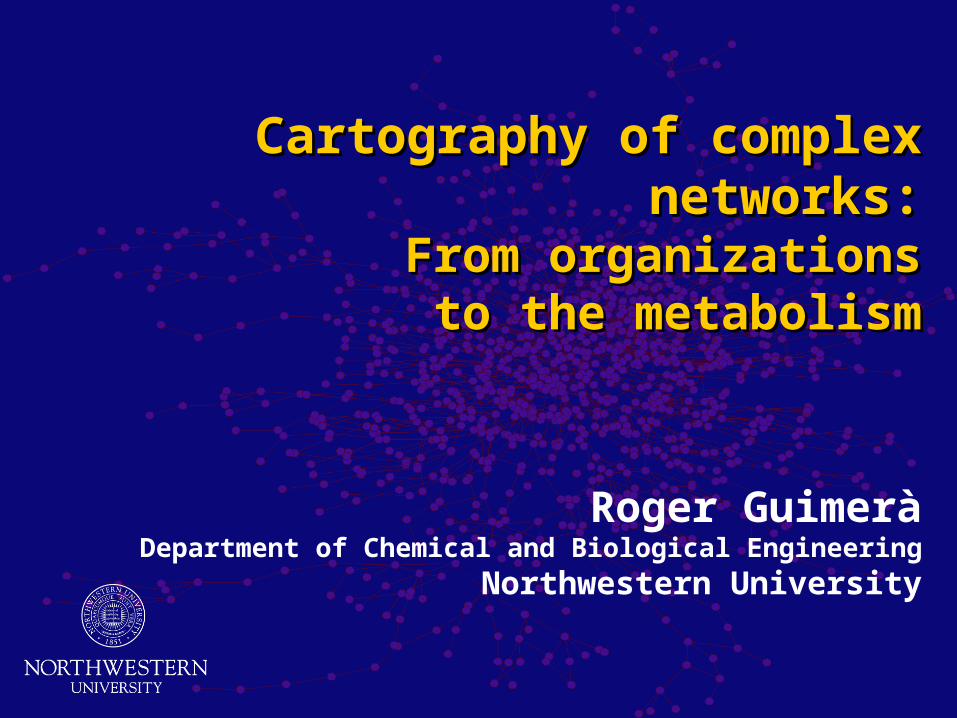
Cartography of complex networks:Cartography of complex networks:From organizationsFrom organizations
to the metabolismto the metabolism
Roger GuimeràDepartment of Chemical and Biological Engineering
Northwestern University
Oxford, June 19, 2006
From a linear world…
Predator
Consumer
Resource
Food chains
Predator
Consumer
Resource
Predator
Consumer
Resource Resource Resource
Food “tree”
Consumer
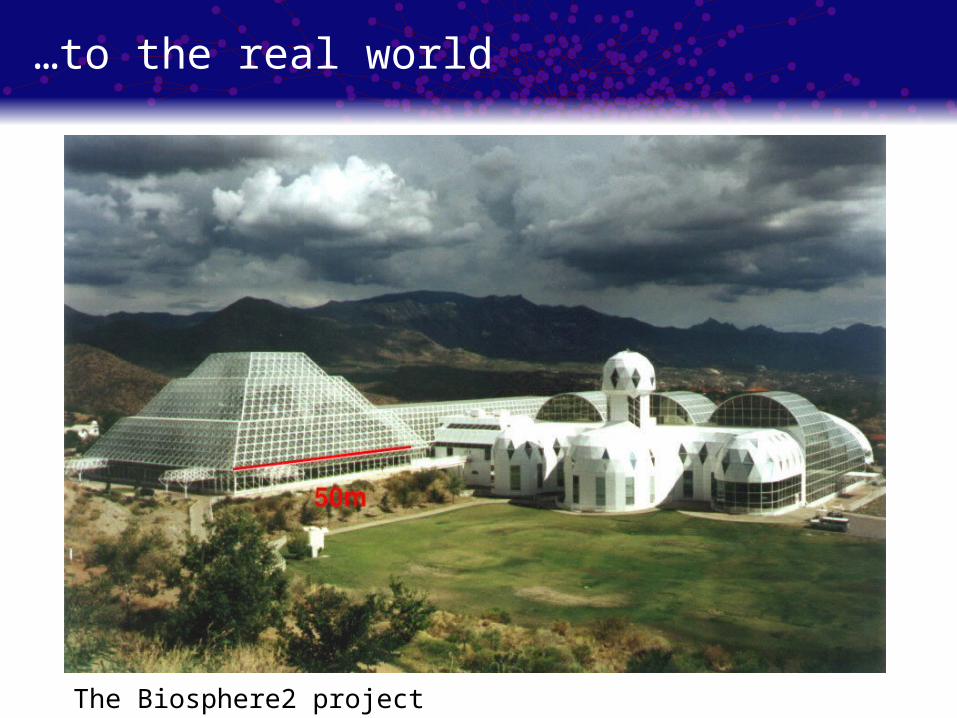
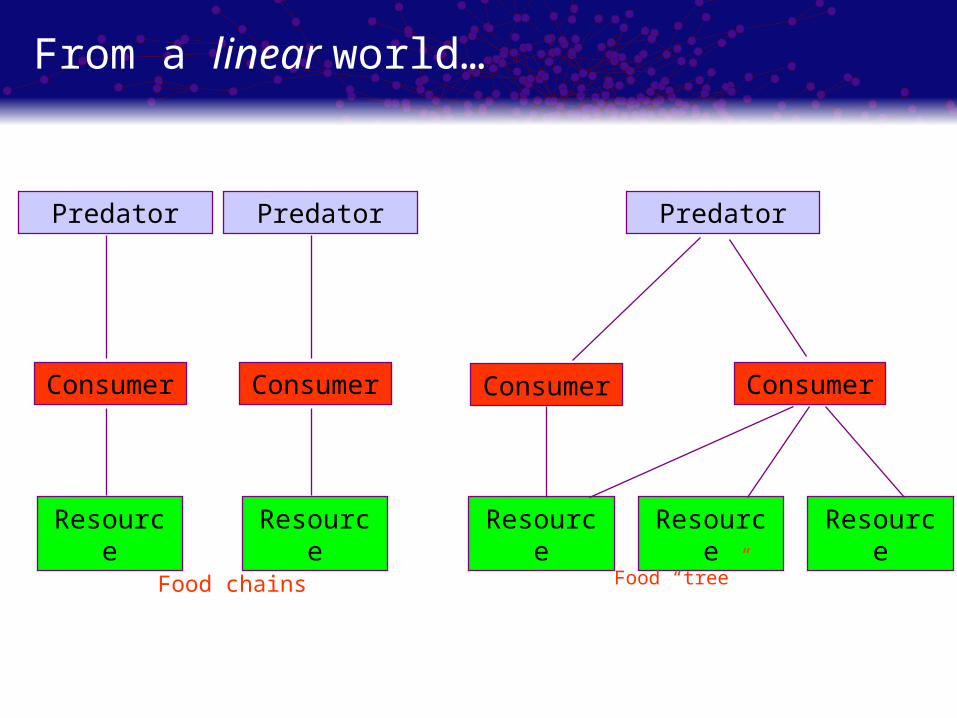
…to the real world
The Biosphere2 project
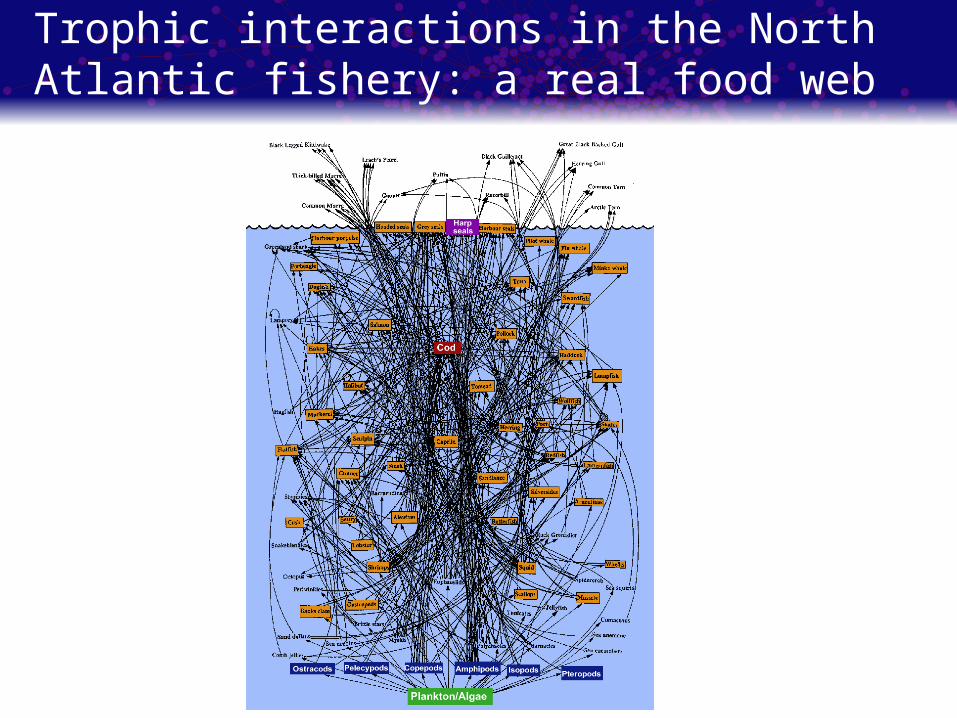
Trophic interactions in the North Atlantic fishery: a real food web
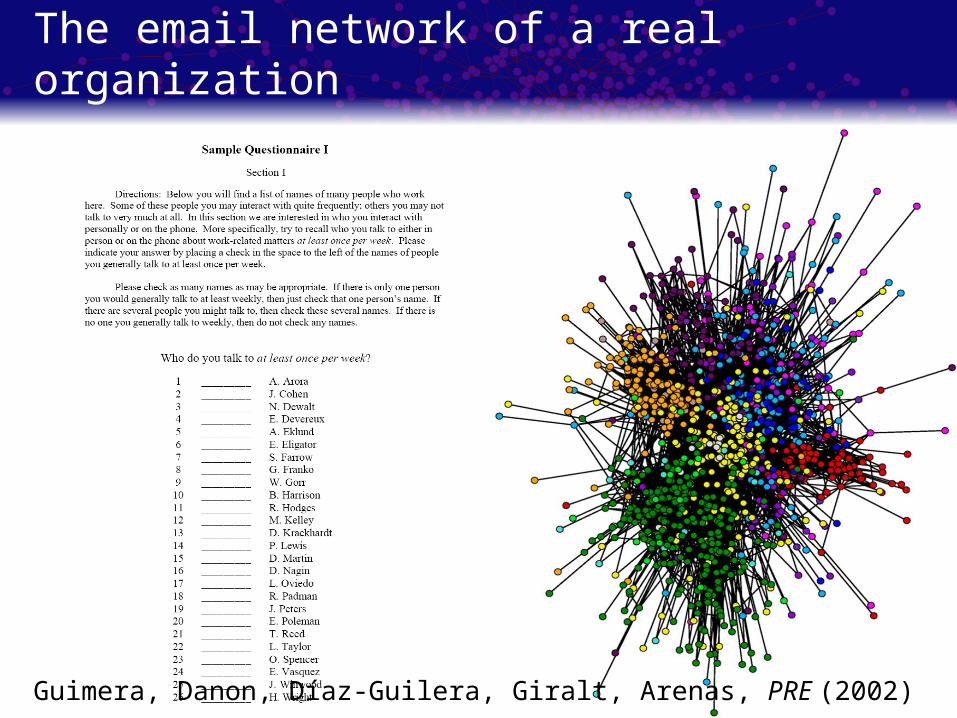
The email network of a real organization
Guimera, Danon, Díaz-Guilera, Giralt, Arenas, PRE (2002)
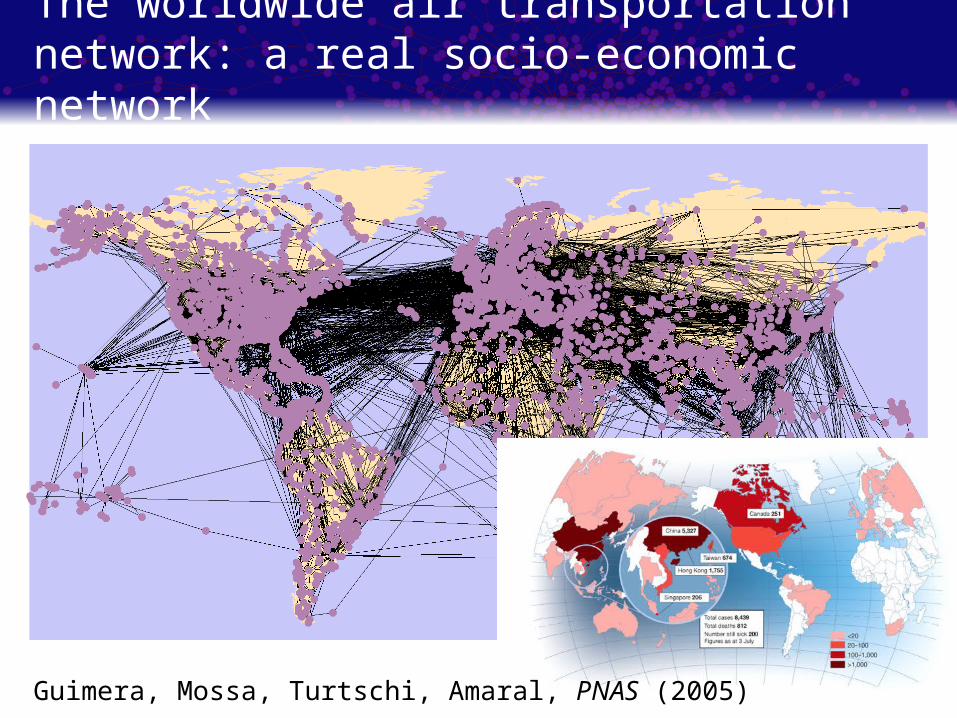
The worldwide air transportation network: a real socio-economic network
Guimera, Mossa, Turtschi, Amaral, PNAS (2005)
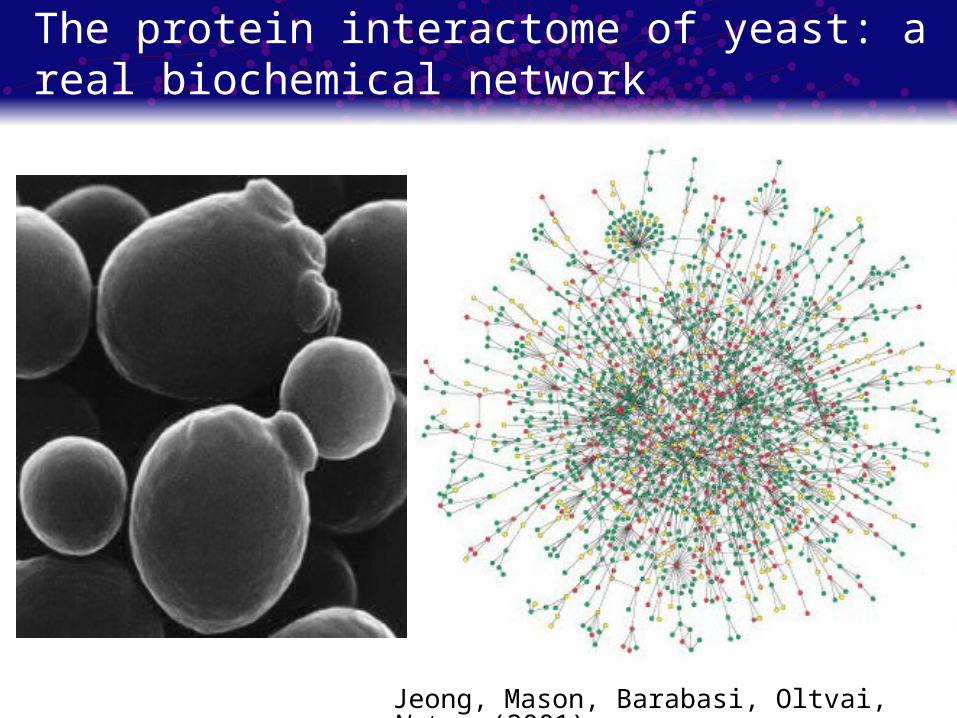
The protein interactome of yeast: a real biochemical network
Jeong, Mason, Barabasi, Oltvai, Nature (2001)
Summary
What is (was) missing in the analysis of complex systems?
Cartography of complex networks: Modules in complex networks Roles in complex networks
Can we discover new therapeutic drugs by analyzing complex networks?
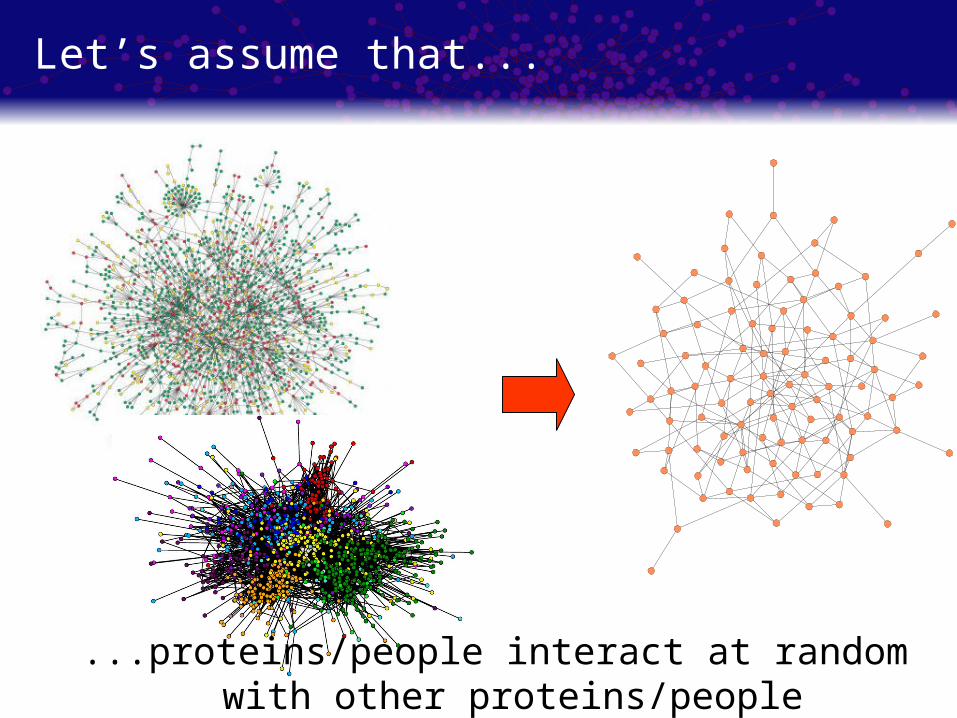
Let’s assume that...
...proteins/people interact at random with other proteins/people
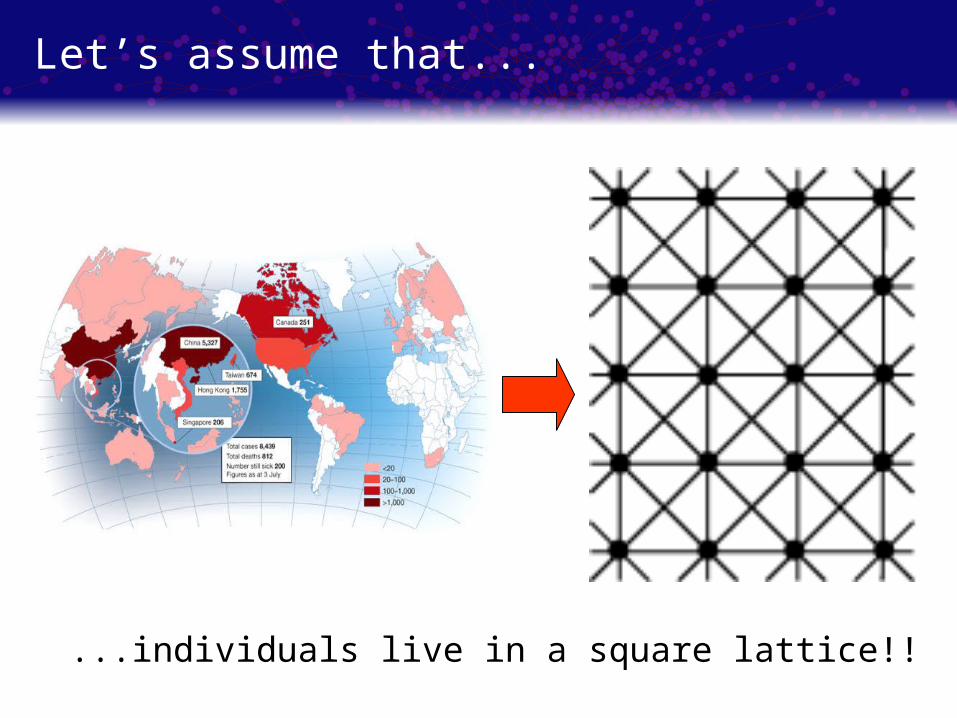
Let’s assume that...
...individuals live in a square lattice!!
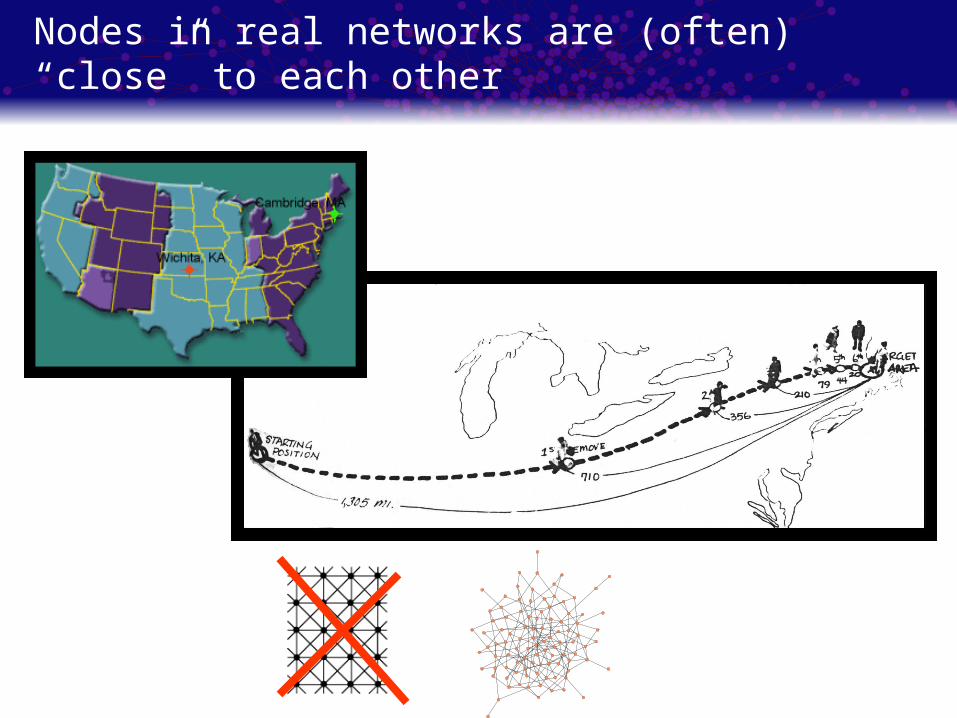
Nodes in real networks are (often) “close” to each other
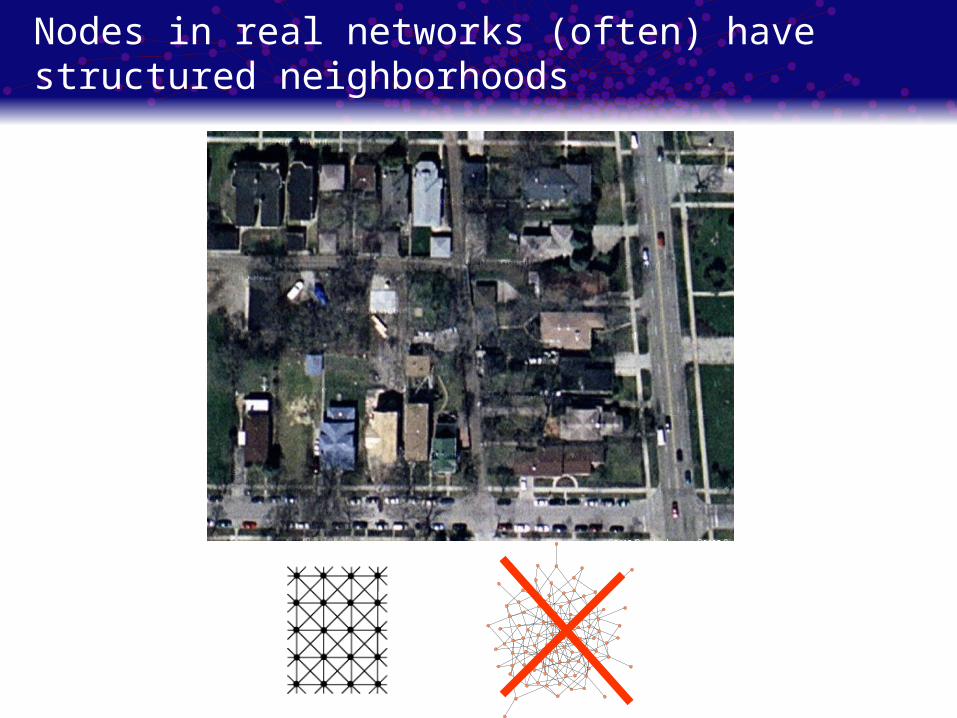
Nodes in real networks (often) have structured neighborhoods
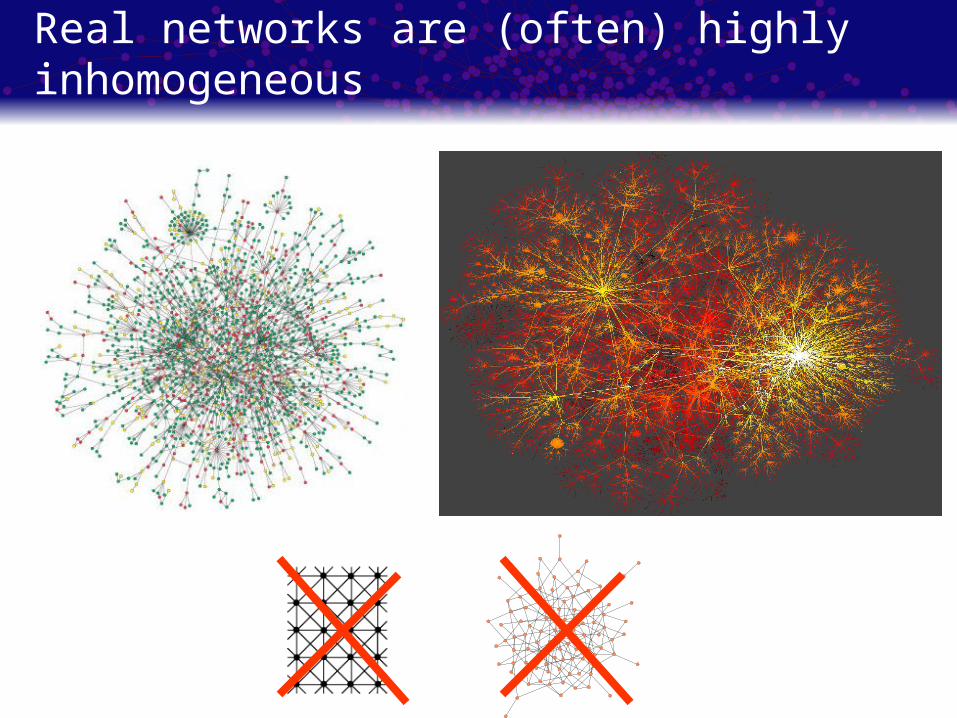
Real networks are (often) highly inhomogeneous
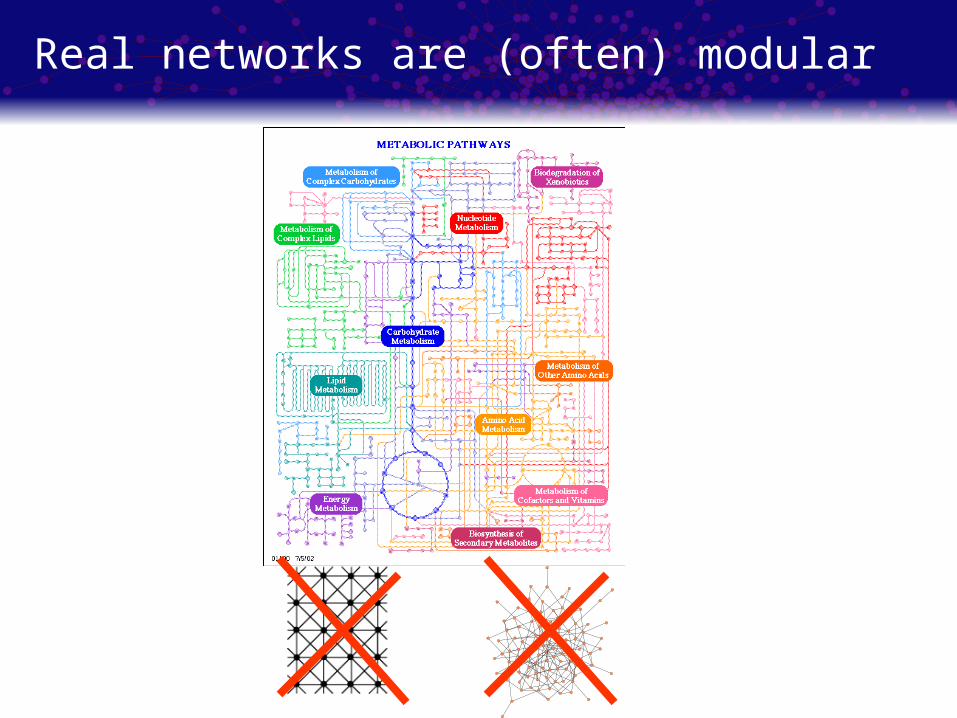
Real networks are (often) modular
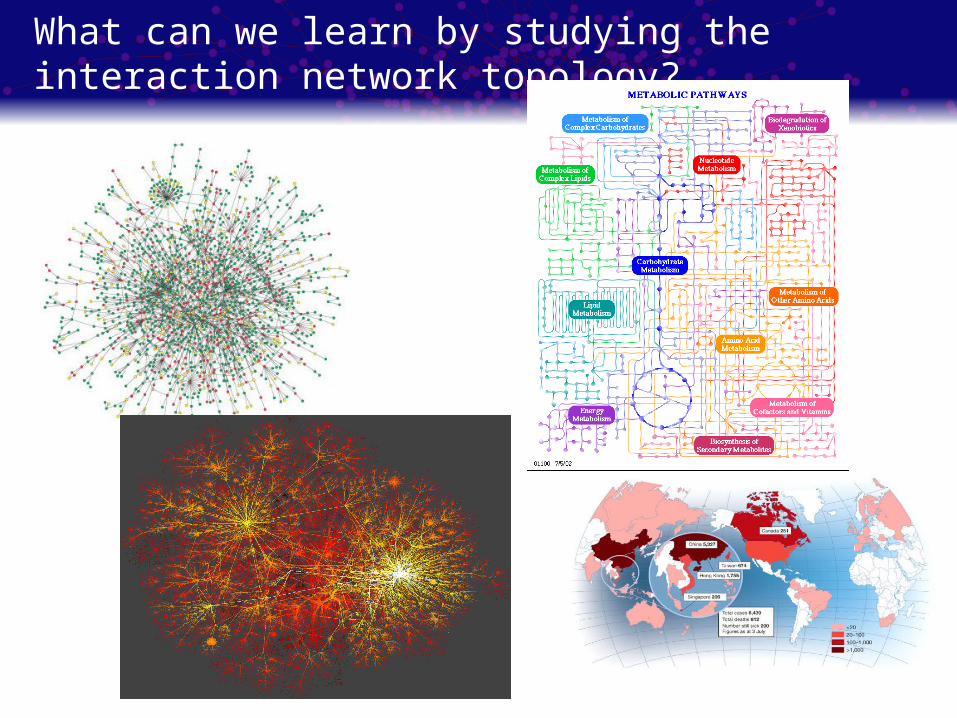
What can we learn by studying the interaction network topology?
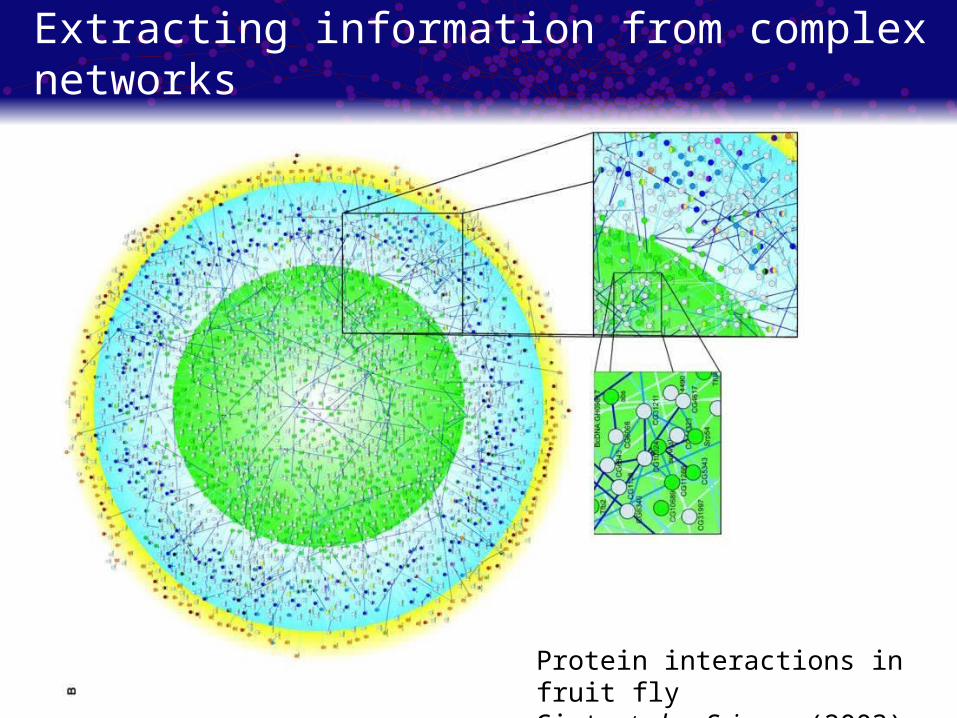
Extracting information from complex networks
Protein interactions in fruit flyGiot et al., Science (2003)
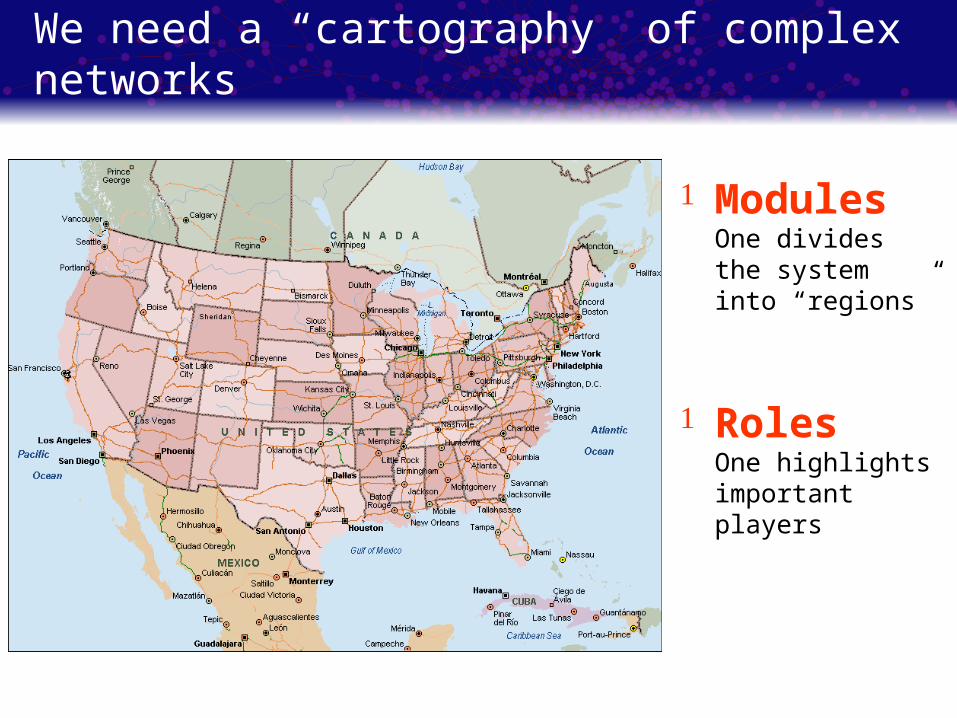
We need a “cartography” of complex networks
Modules One divides the system into “regions”
Roles One highlights important players
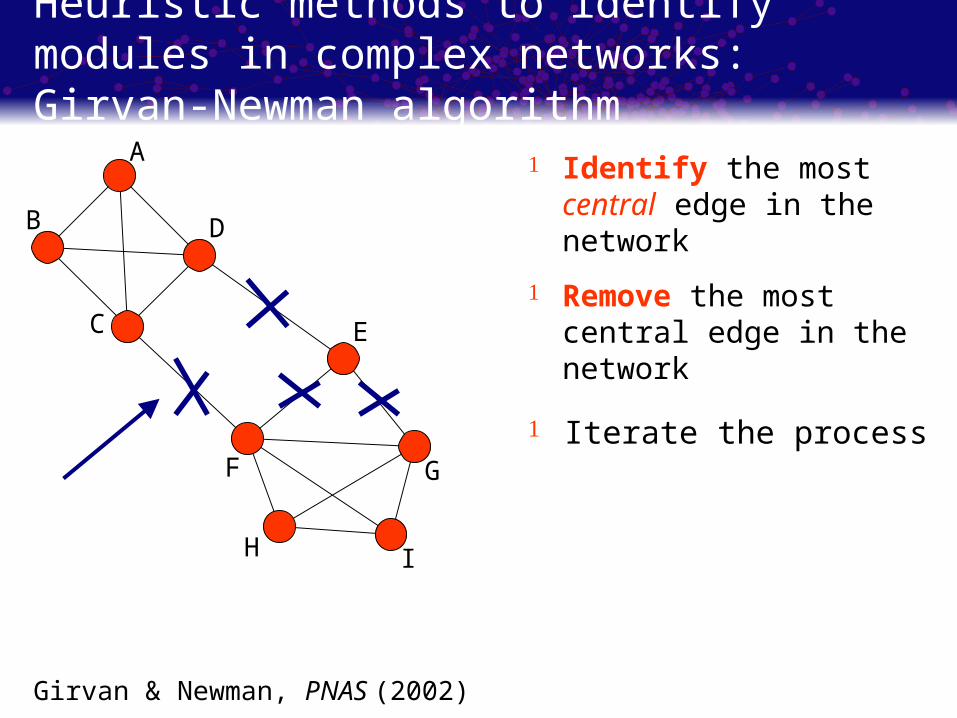
Heuristic methods to identify modules in complex networks: Girvan-Newman algorithm
Girvan & Newman, PNAS (2002)
Identify the most central edge in the network
Remove the most central edge in the network
Iterate the process
A
B
C
D
E
F
H I
G

The Girvan-Newman algorithm for module detection is remarkably effective
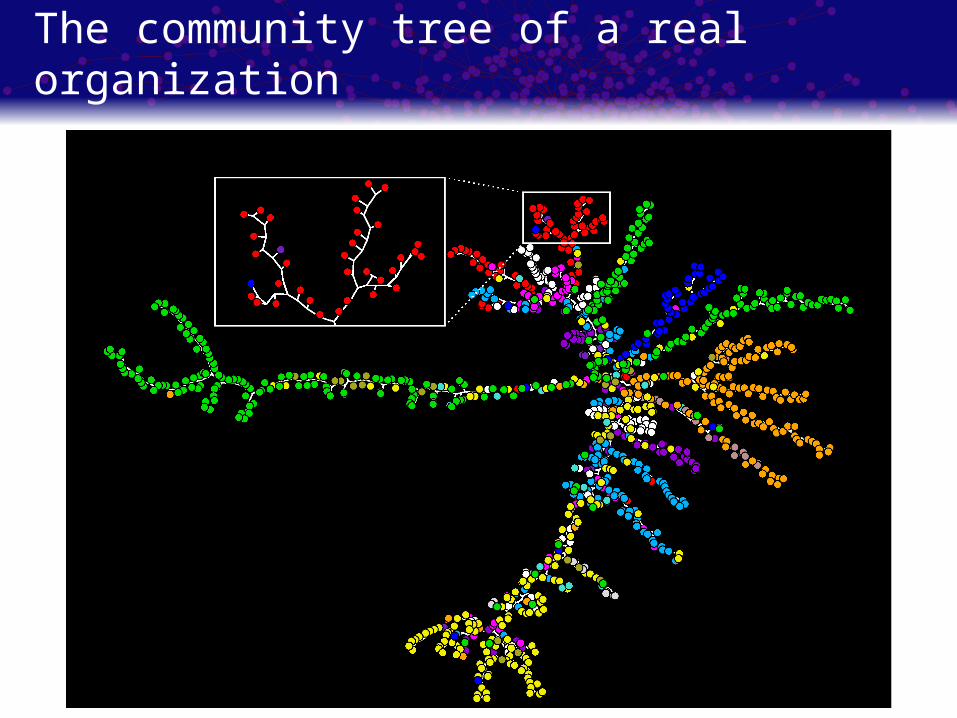
The community tree of a real organization
Shortcomings of the GN algorithm
It is very slow: O(N3)
One needs to decide where to stop the process
It does not work that well when the modular structure becomes fuzzy
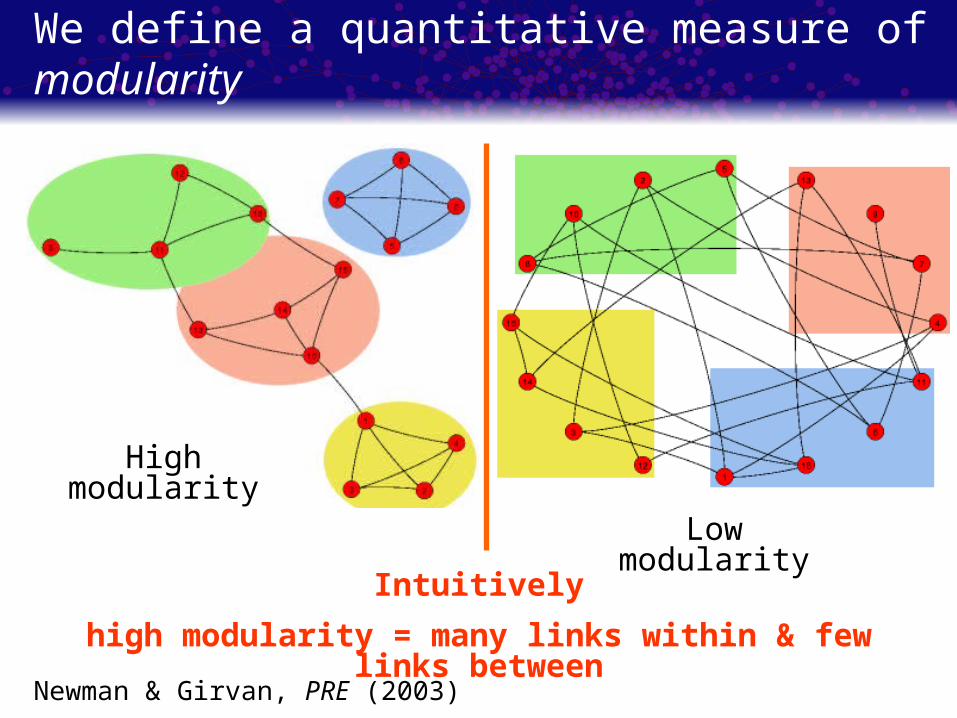
We define a quantitative measure of modularity
Low modularity
High modularity
Newman & Girvan, PRE (2003)
Intuitively
high modularity = many links within & few links between
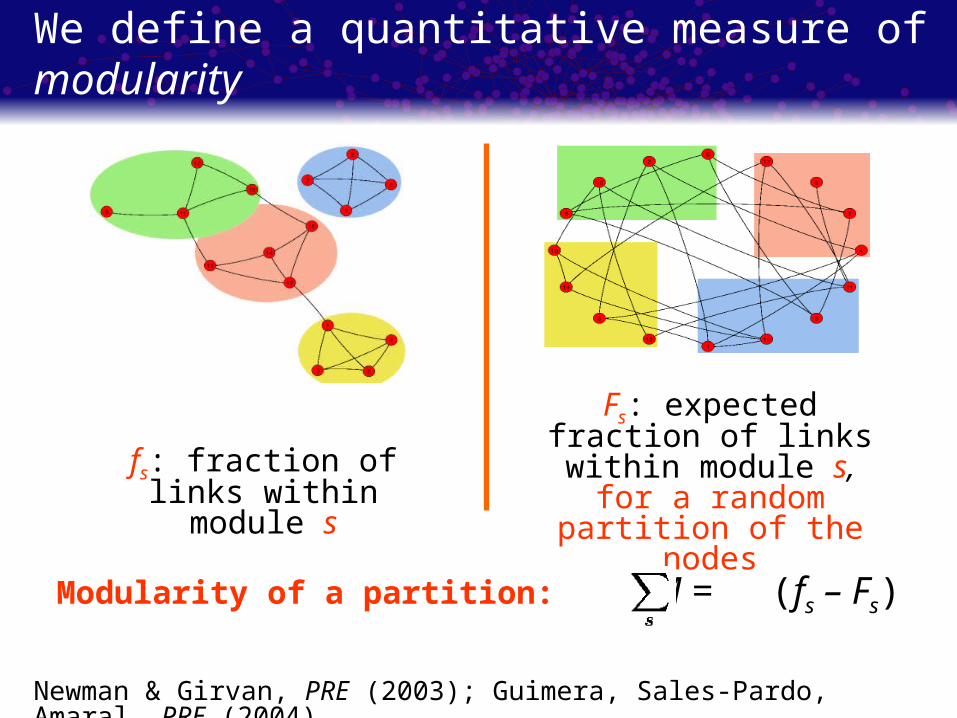
We define a quantitative measure of modularity
Newman & Girvan, PRE (2003); Guimera, Sales-Pardo, Amaral, PRE (2004)
fs: fraction of links within module s
Fs: expected fraction of links within module s, for a random partition
of the nodes
Modularity of a partition: M = (fs – Fs)
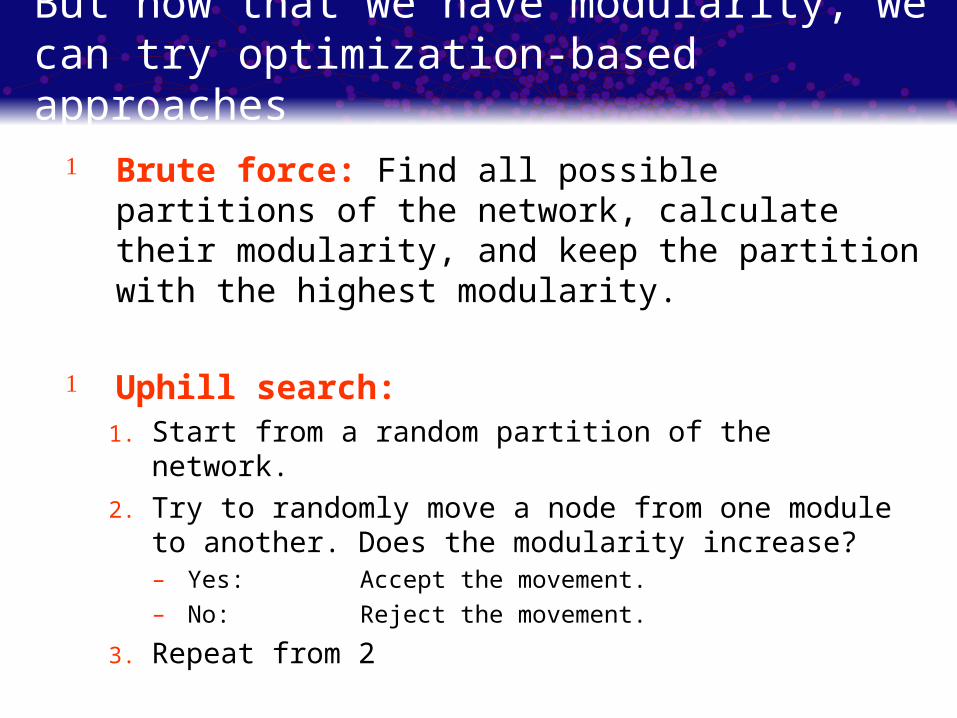
But now that we have modularity, we can try optimization-based approaches
Brute force: Find all possible partitions of the network, calculate their modularity, and keep the partition with the highest modularity.
Uphill search:1. Start from a random partition of the network.
2. Try to randomly move a node from one module to another. Does the modularity increase?– Yes: Accept the movement.– No: Reject the movement.
3. Repeat from 2
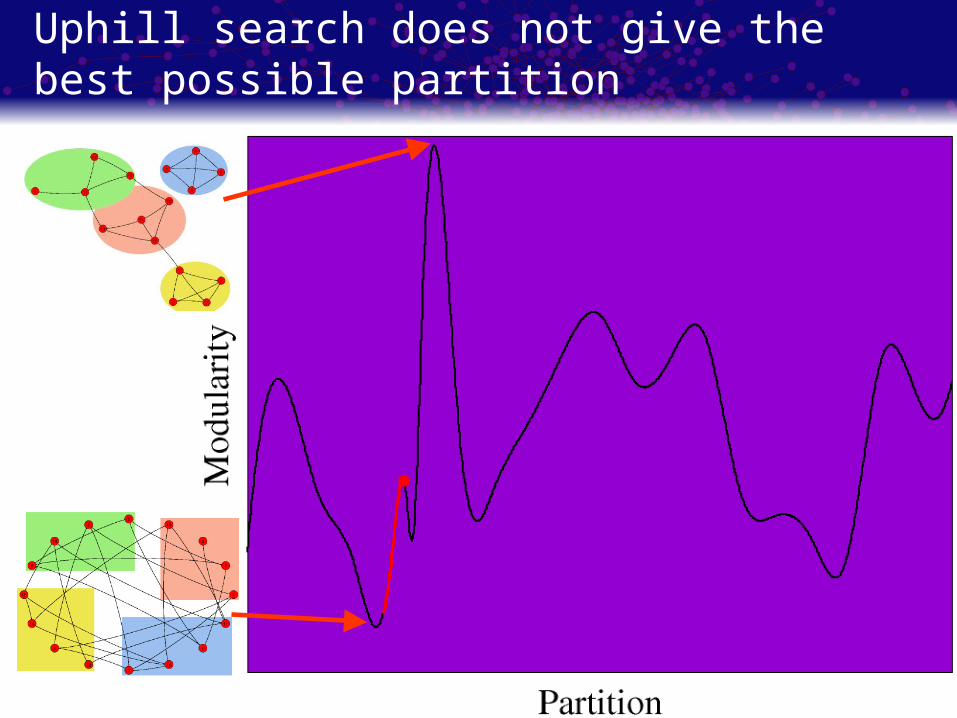
Uphill search does not give the best possible partition
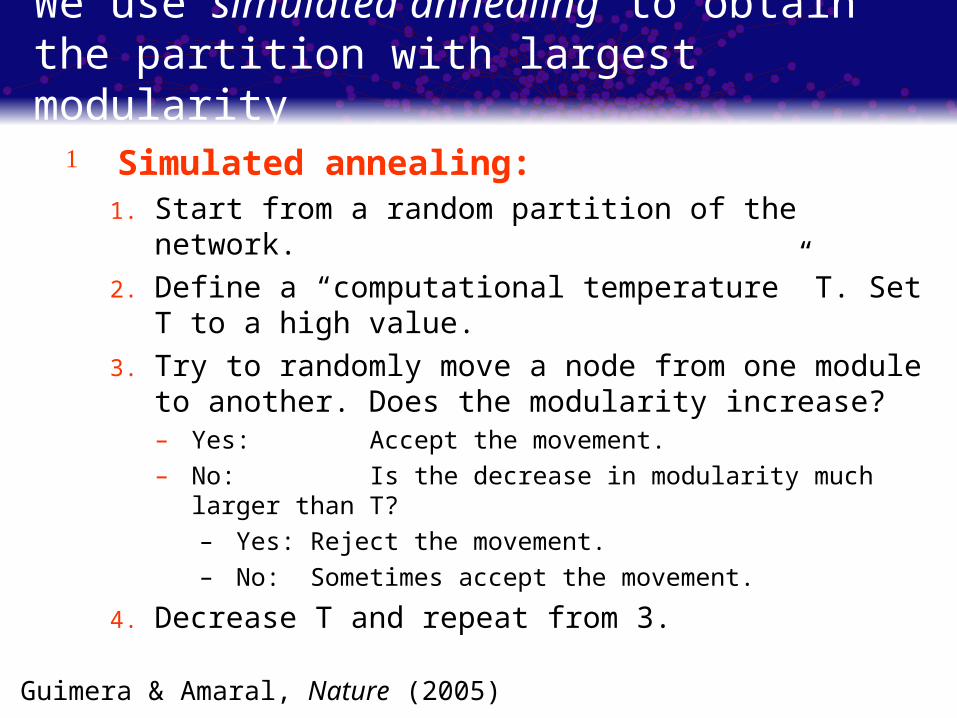
We use simulated annealing to obtain the partition with largest modularity
Simulated annealing:1. Start from a random partition of the network.
2. Define a “computational temperature” T. Set T to a high value.
3. Try to randomly move a node from one module to another. Does the modularity increase?– Yes: Accept the movement.– No: Is the decrease in modularity much larger
than T?– Yes: Reject the movement.– No: Sometimes accept the movement.
4. Decrease T and repeat from 3.
Guimera & Amaral, Nature (2005)
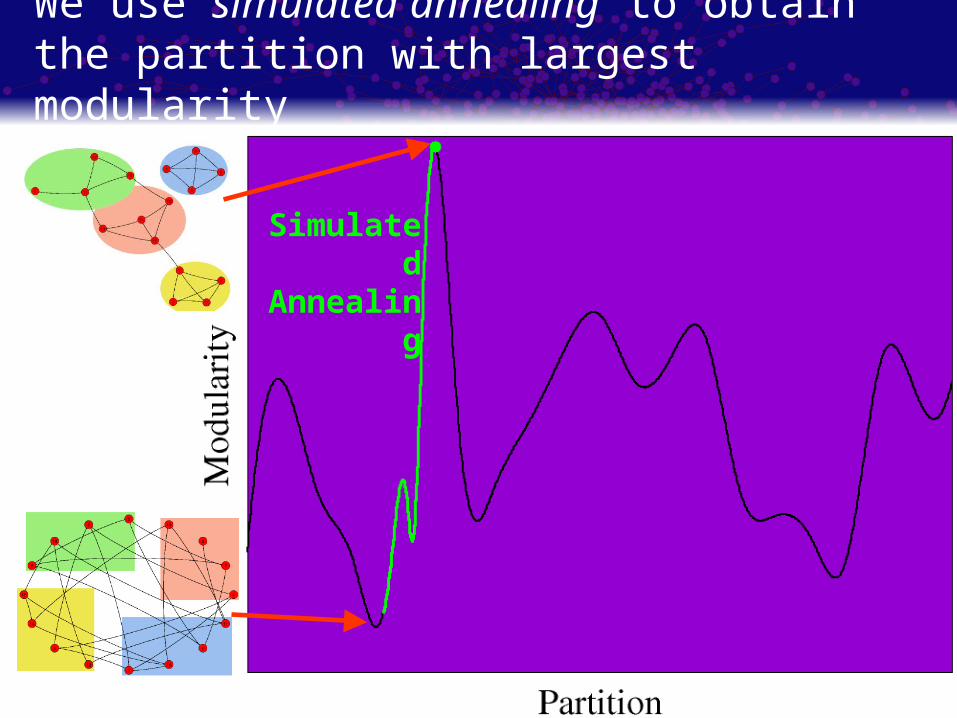
Simulated Annealing
We use simulated annealing to obtain the partition with largest modularity
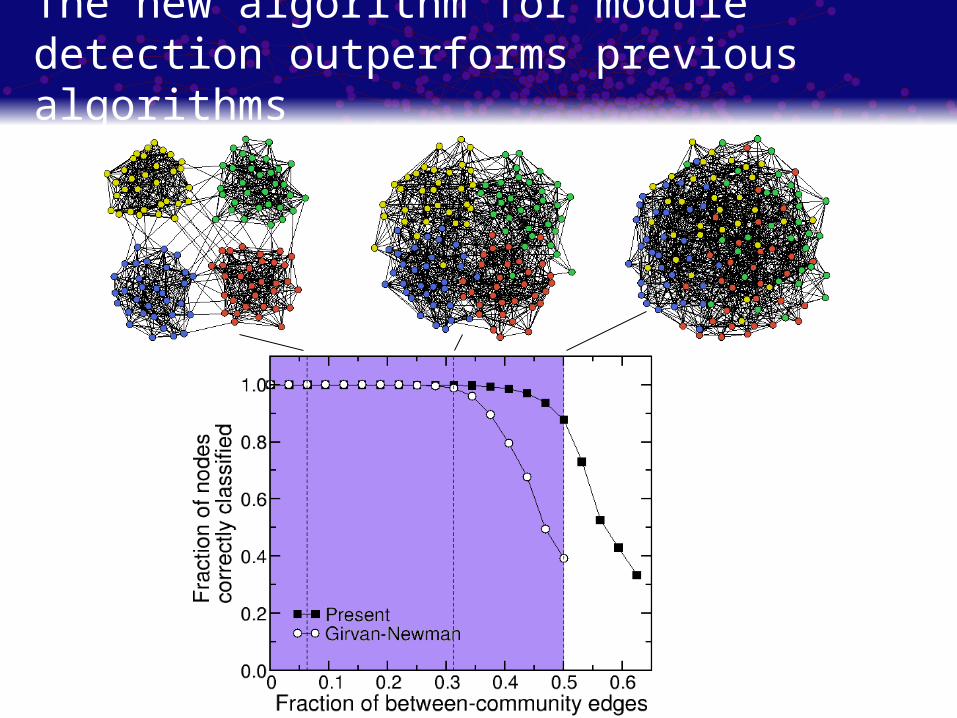
The new algorithm for module detection outperforms previous algorithms
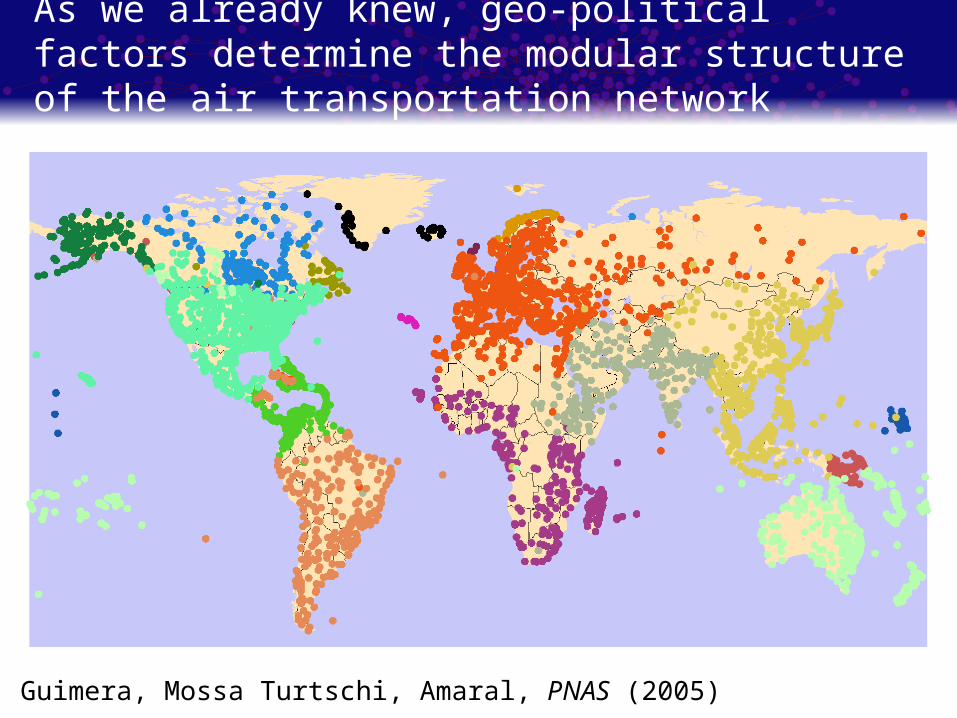
As we already knew, geo-political factors determine the modular structure of the air transportation network
Guimera, Mossa Turtschi, Amaral, PNAS (2005)
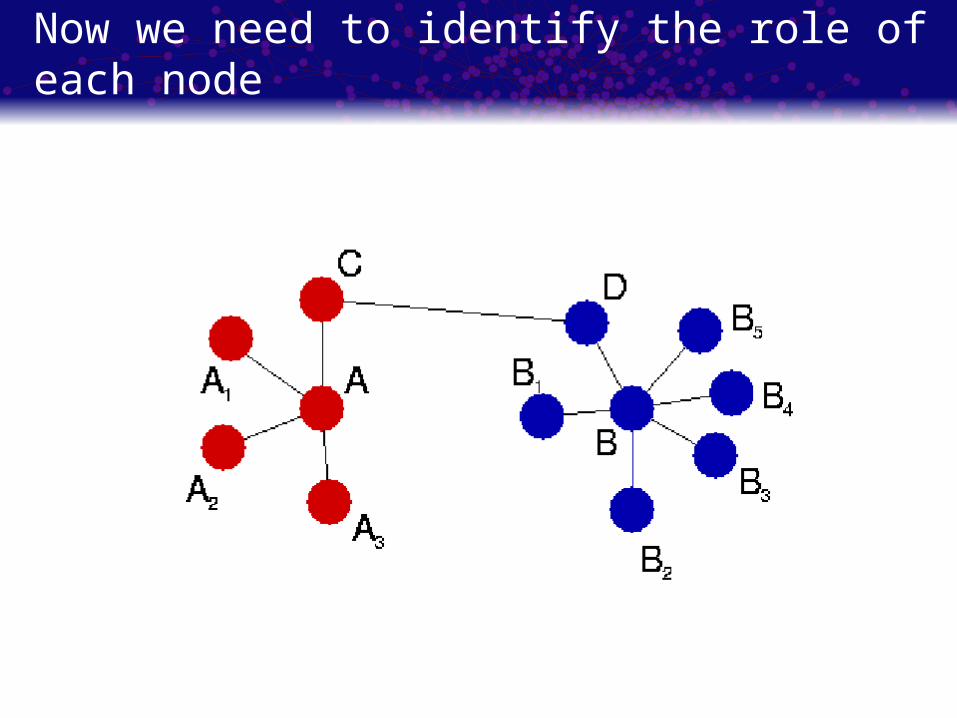
Now we need to identify the role of each node
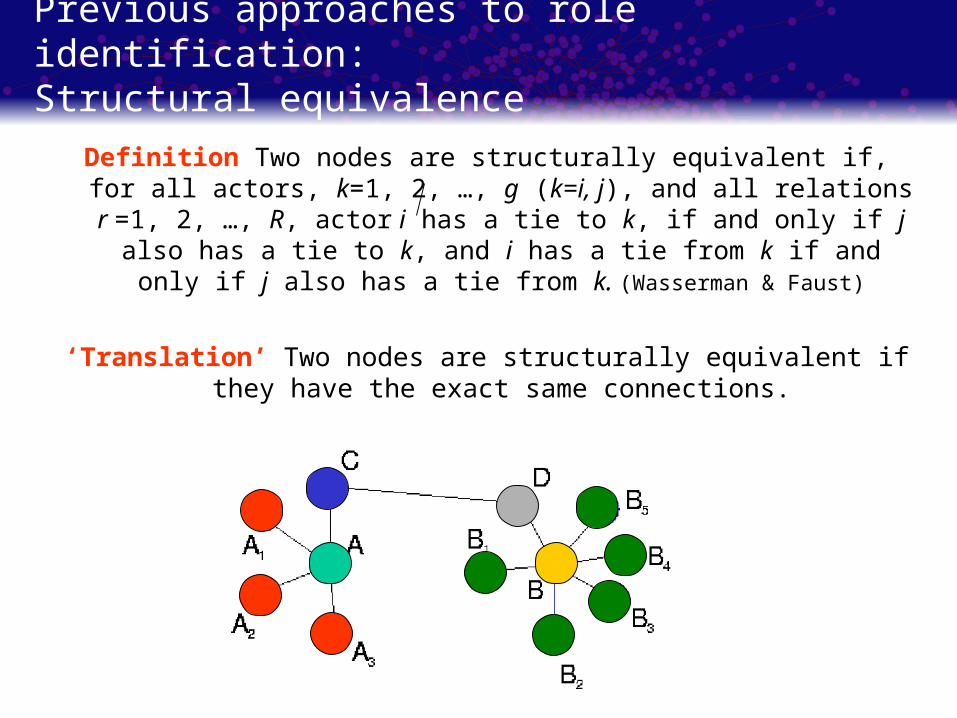
Previous approaches to role identification:Structural equivalence
Definition Two nodes are structurally equivalent if, for all actors, k=1, 2, …, g (k=i, j), and all relations r =1, 2, …, R, actor i has a tie to k, if and only if j also has a tie to k, and
i has a tie from k if and only if j also has a tie from k. (Wasserman & Faust)
‘Translation’ Two nodes are structurally equivalent if they have the exact same connections.
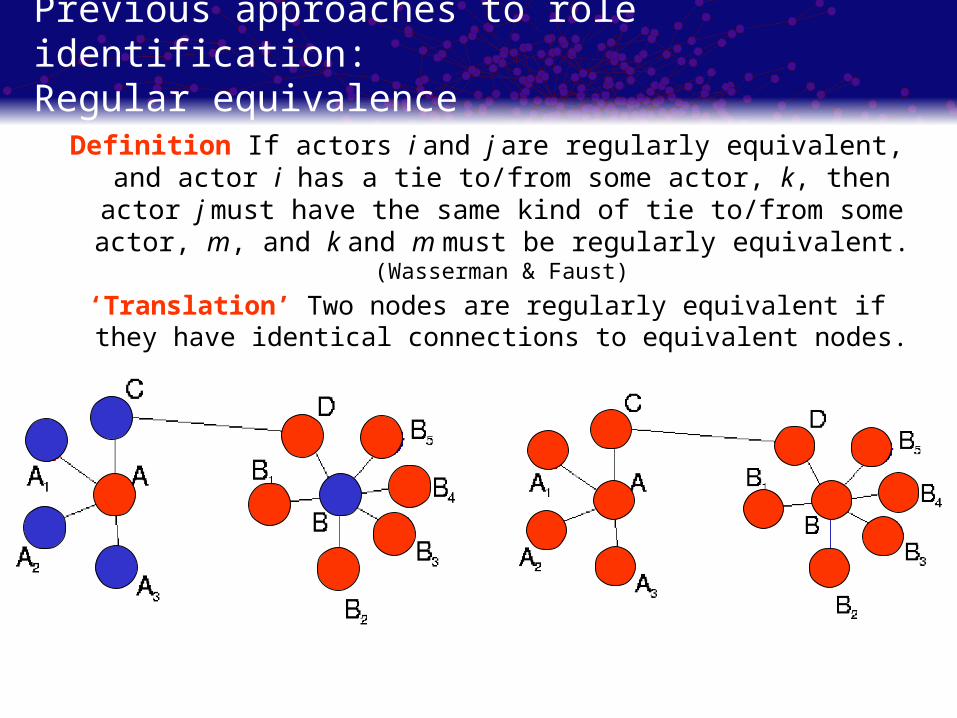
Previous approaches to role identification:Regular equivalence
Definition If actors i and j are regularly equivalent, and actor i has a tie to/from some actor, k, then actor j must have the same kind of tie to/from some actor, m, and k and m
must be regularly equivalent. (Wasserman & Faust)
‘Translation’ Two nodes are regularly equivalent if they have identical connections to equivalent nodes.
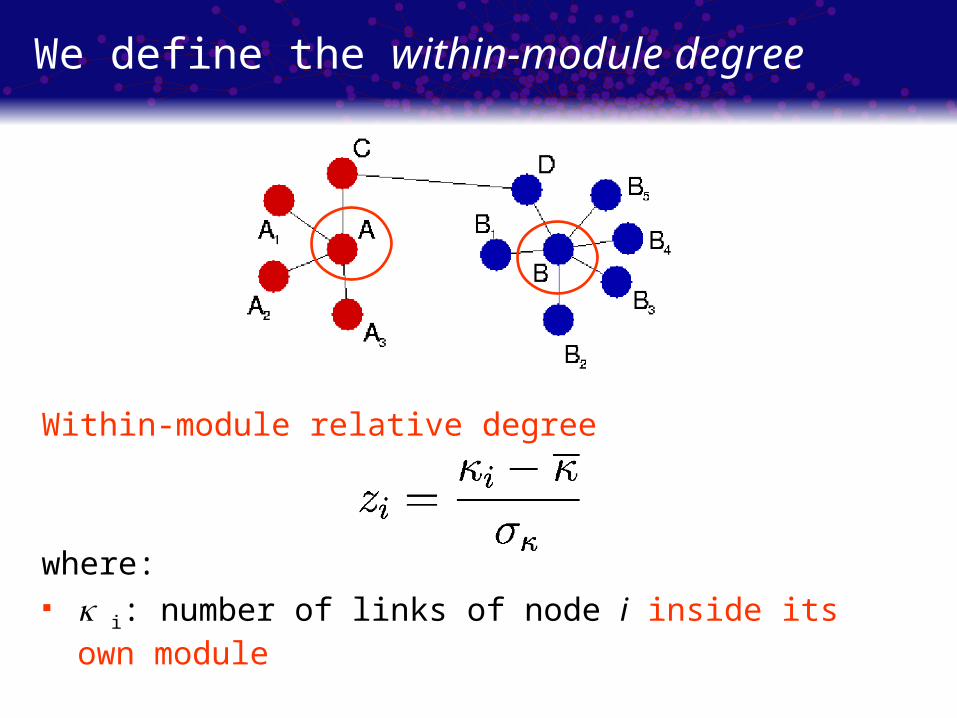
We define the within-module degree
Within-module relative degree
where: i: number of links of node i inside its own module
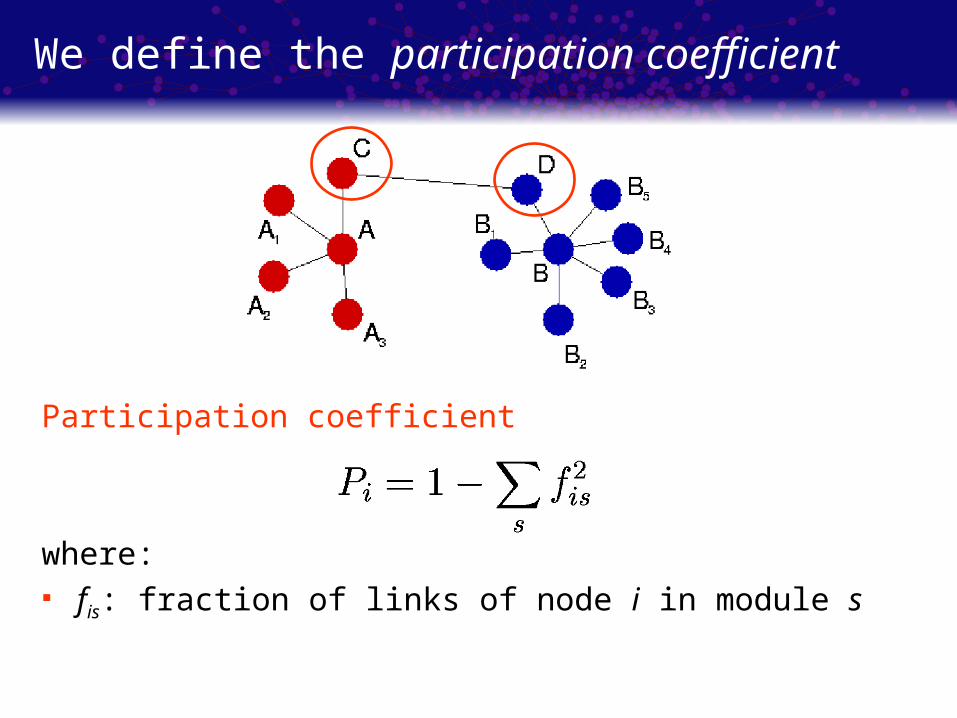
We define the participation coefficient
Participation coefficient
where: fis: fraction of links of node i in module s
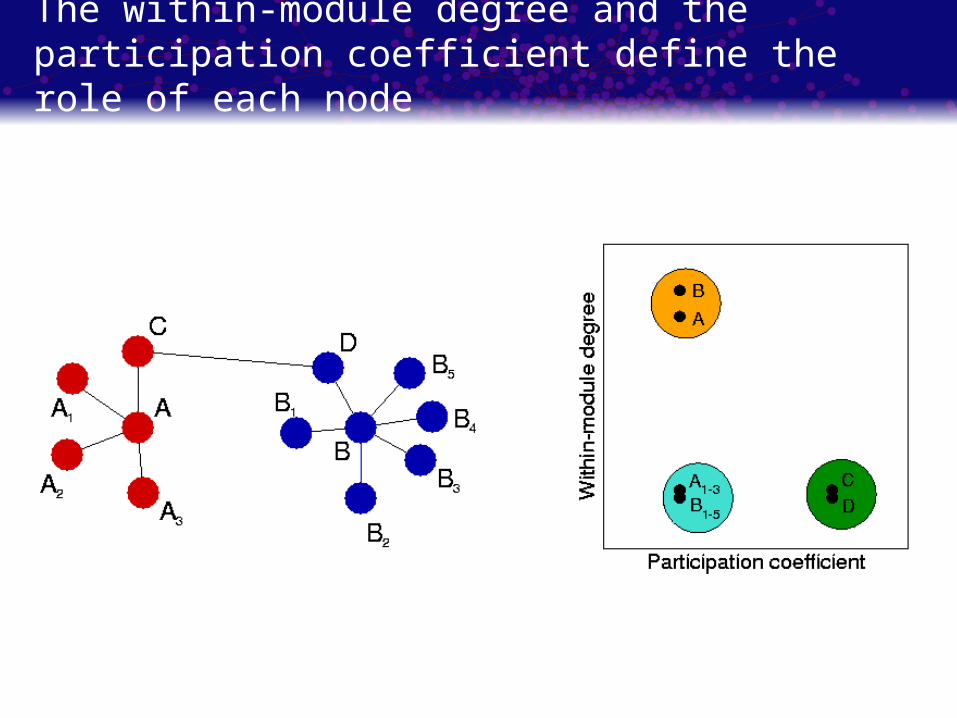
The within-module degree and the participation coefficient define the role of each node
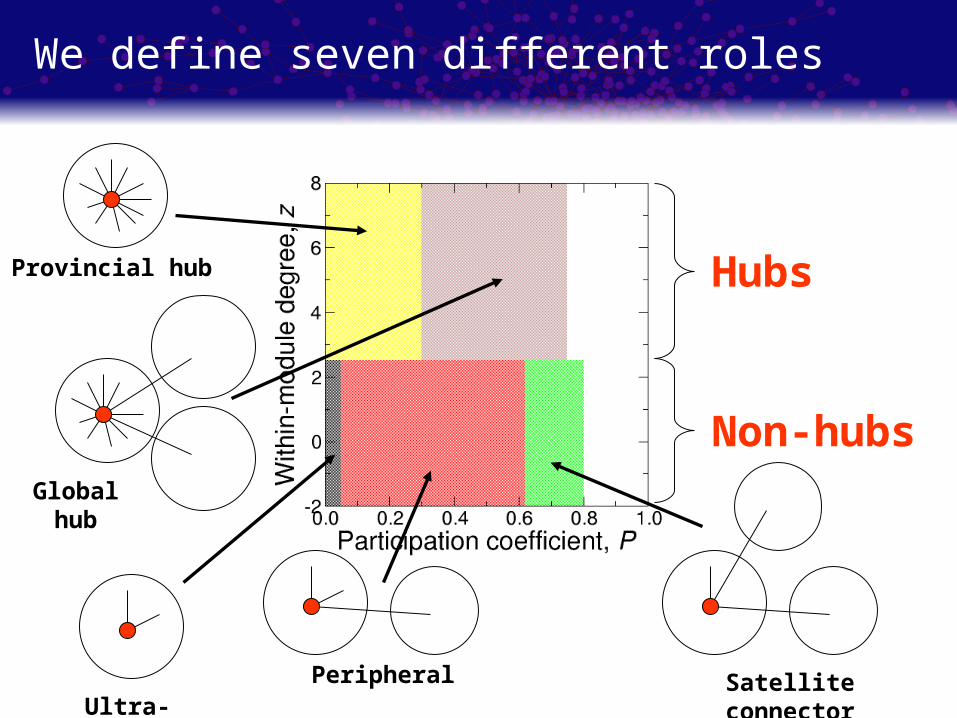
We define seven different roles
Hubs
Non-hubs
Ultra-peripheralSatellite connectorPeripheral
Provincial hub
Global hub
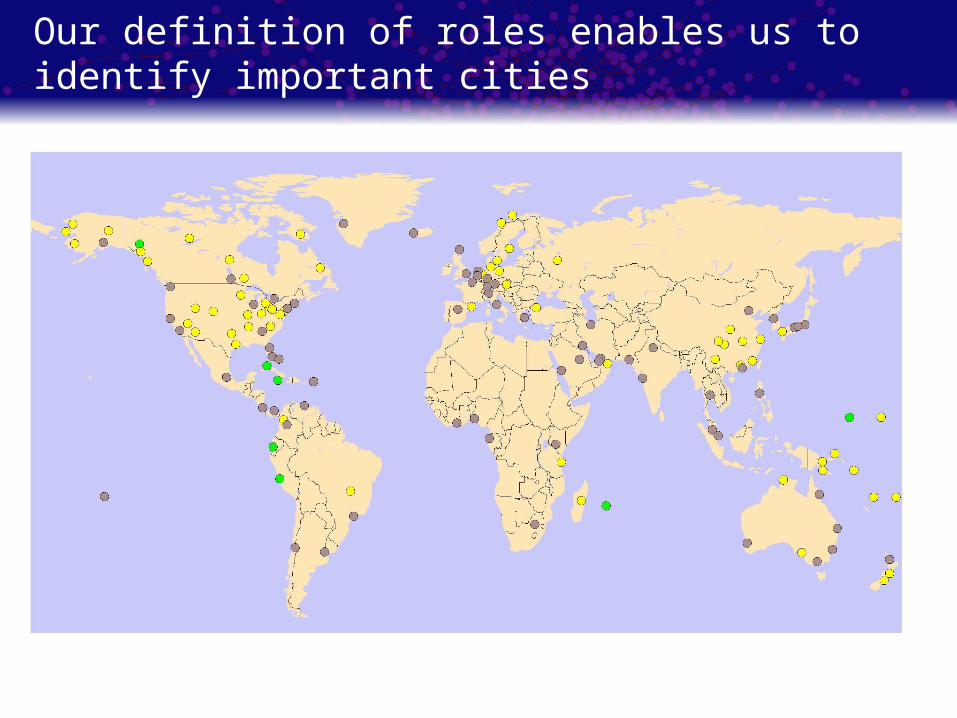
Our definition of roles enables us to identify important cities
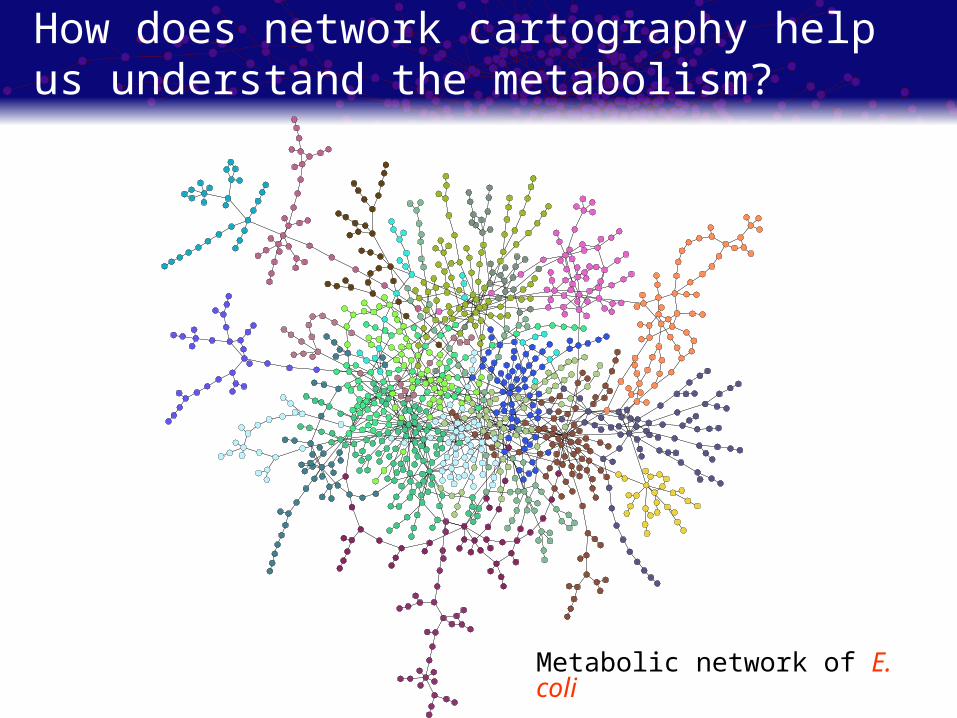
How does network cartography help us understand the metabolism?
Metabolic network of E. coli
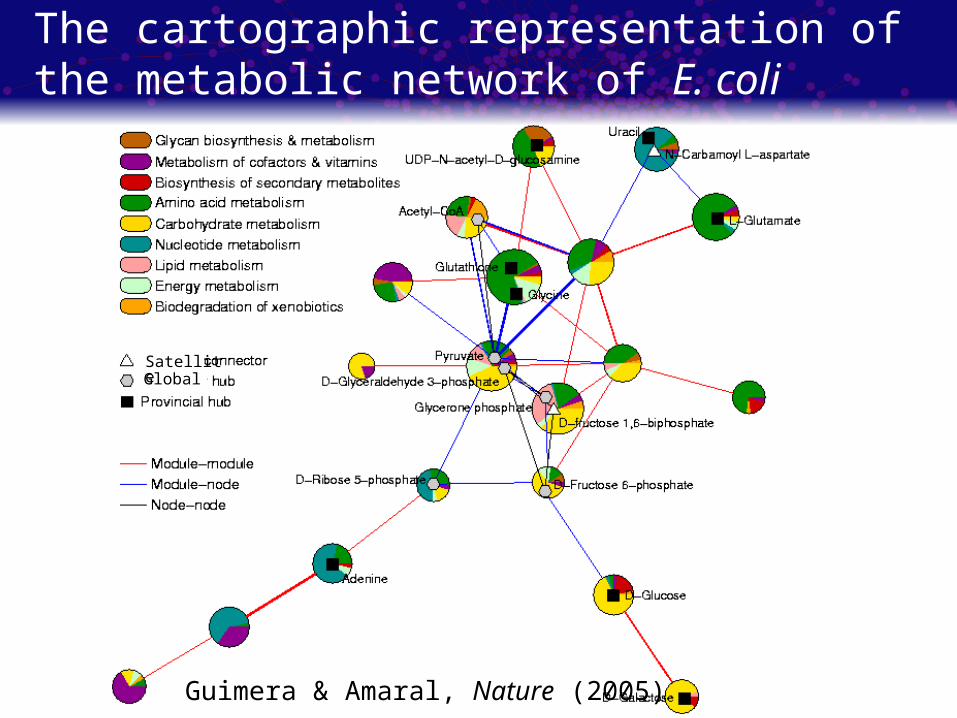
The cartographic representation of the metabolic network of E. coli
Guimera & Amaral, Nature (2005)
SatelliteGlobal
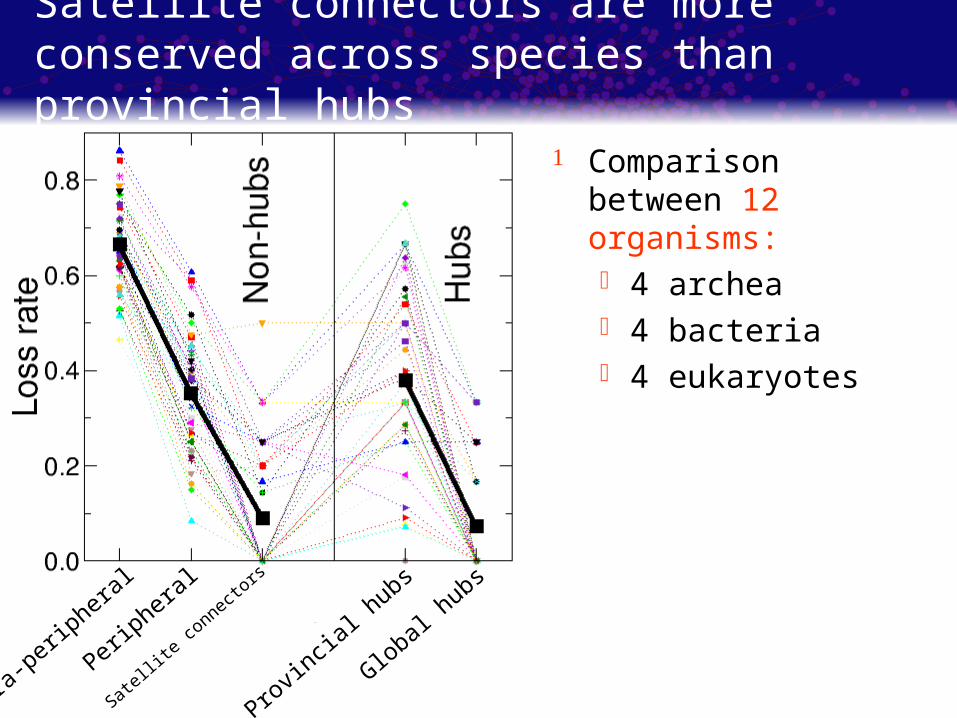
Satellite connectors are more conserved across species than provincial hubs
Comparison between 12 organisms: 4 archea 4 bacteria 4 eukaryotes
Ultra-p
eriphera
l
Periphera
l
Satellite co
nnectors
Provin
cial h
ubs
Global hubs
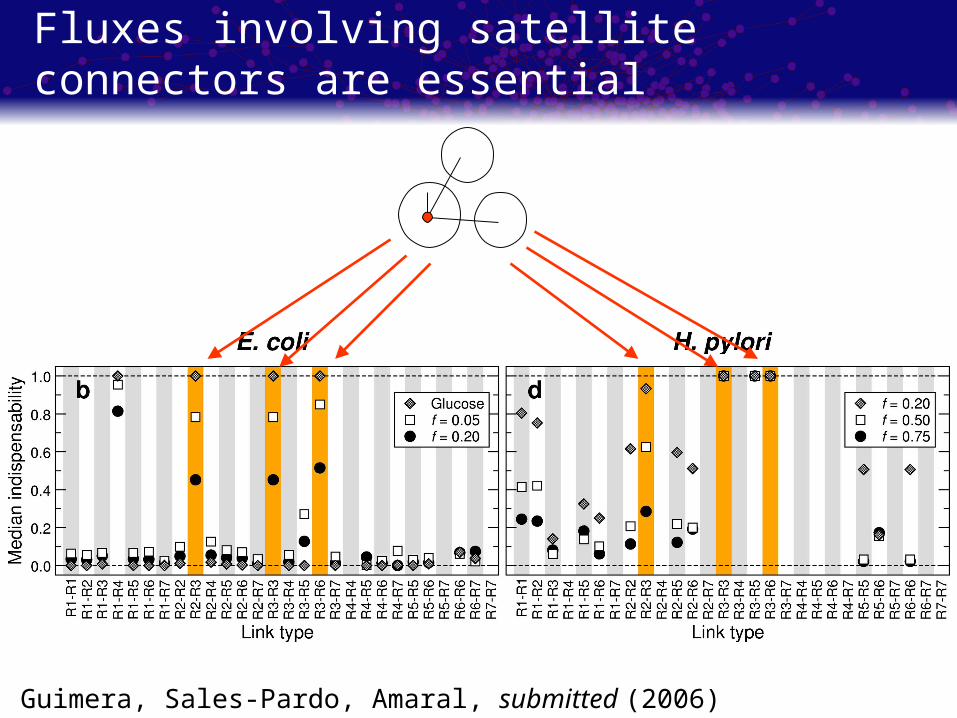
Fluxes involving satellite connectors are essential
Guimera, Sales-Pardo, Amaral, submitted (2006)
Questions for us to think
Can we design better organizations / transportation systems / … by using these new tools?
What can we learn from organizations / … that could help us design better drugs?
How are topology, dynamics, and function related?
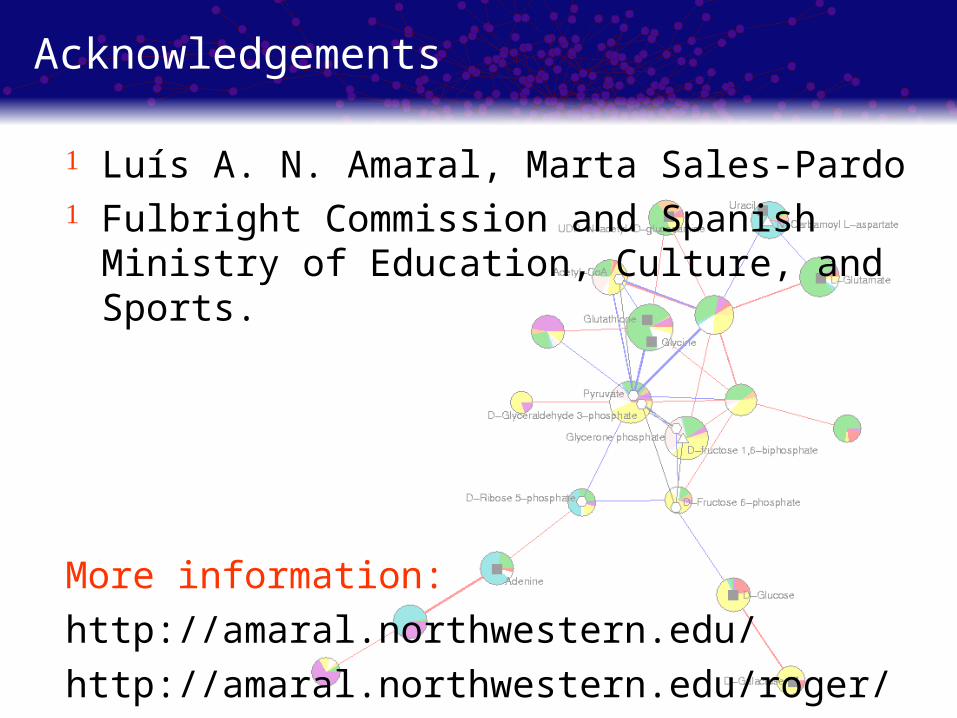
Acknowledgements
Luís A. N. Amaral, Marta Sales-Pardo Fulbright Commission and Spanish Ministry of
Education, Culture, and Sports.
More information:
http://amaral.northwestern.edu/
http://amaral.northwestern.edu/roger/
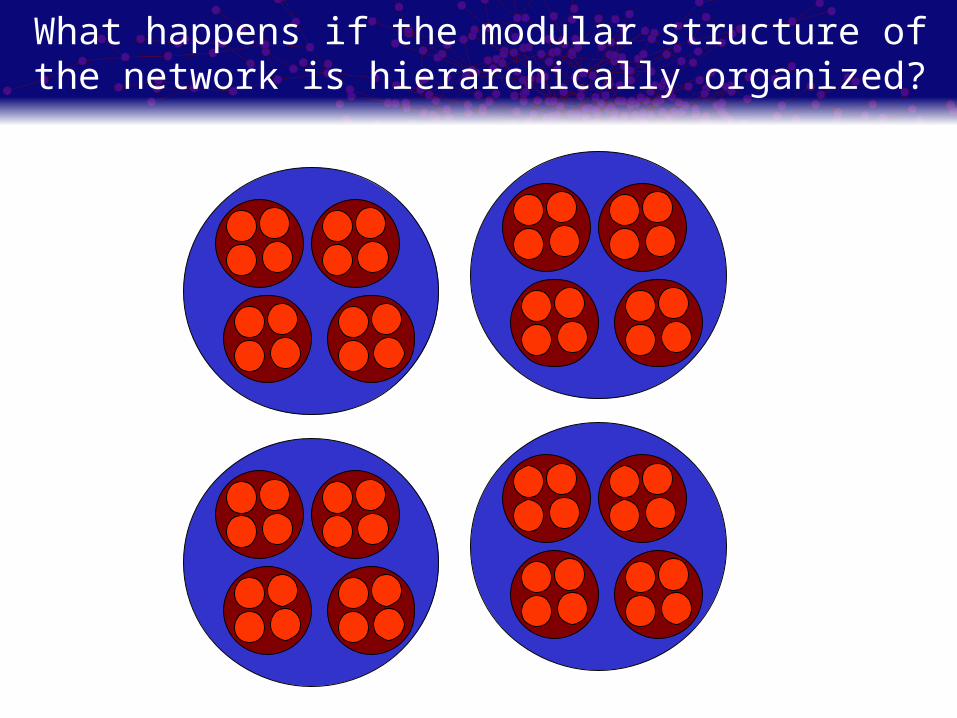
What happens if the modular structure of the network is hierarchically organized?
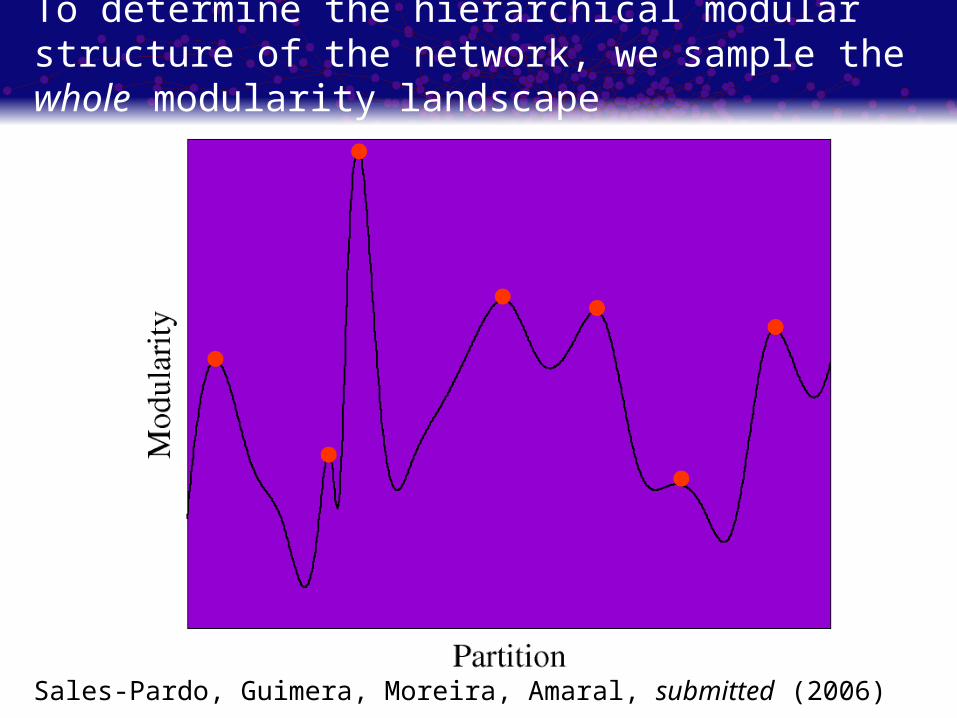
To determine the hierarchical modular structure of the network, we sample the whole modularity landscape
Sales-Pardo, Guimera, Moreira, Amaral, submitted (2006)
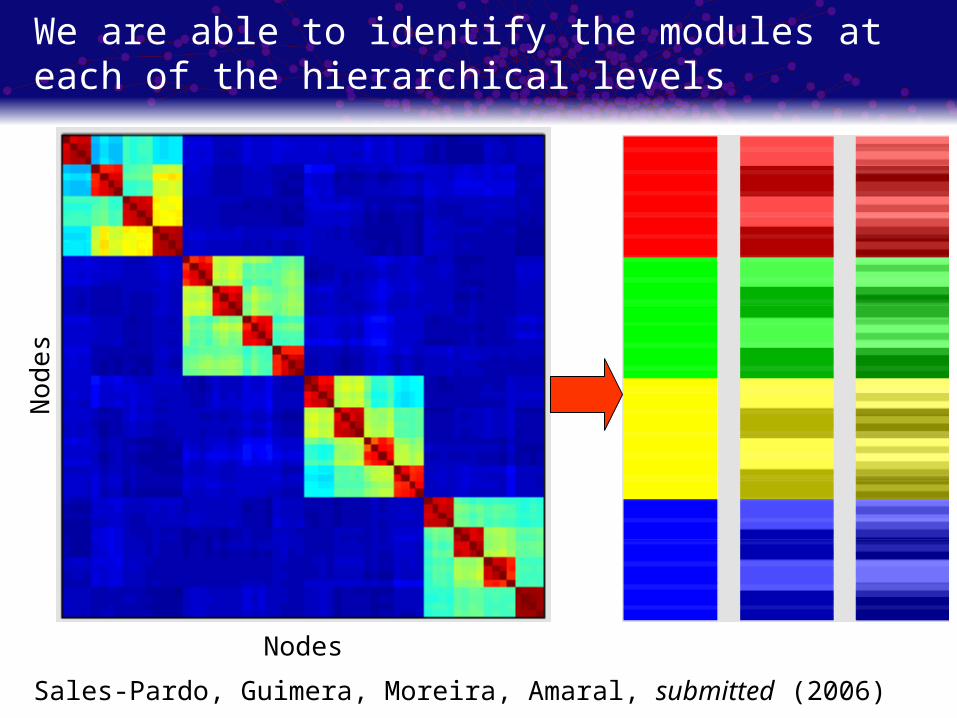
We are able to identify the modules at each of the hierarchical levels
Sales-Pardo, Guimera, Moreira, Amaral, submitted (2006)
Nodes
No
des
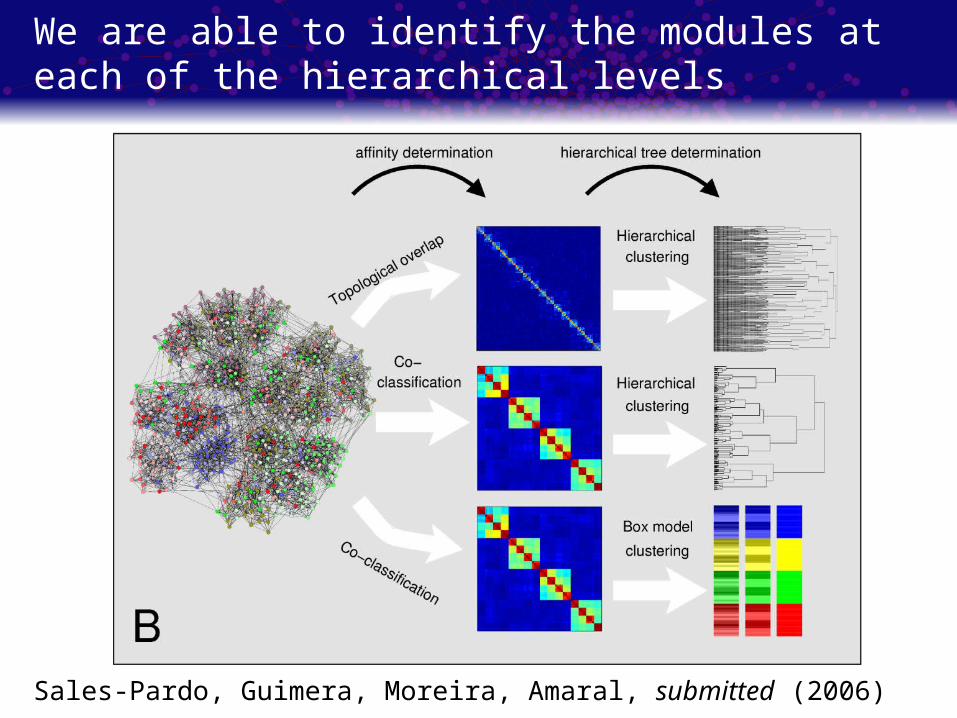
We are able to identify the modules at each of the hierarchical levels
Sales-Pardo, Guimera, Moreira, Amaral, submitted (2006)