Cars Not Moving · 4/7/2020 · The number of cars idle for 7+ days rose for the third consecutive...
12
SPEED READ Loads on wheels: On a network basis loads on wheels were largely unchanged overnight reflecting lower volumes on CN and higher volumes on CP. The net overall reflects a series of puts and takes across a number of corridors for both railways with the most significant changes being an increase in Prince Rupert volumes for CN and higher volumes for CP in the Thunder Bay corridor. Volumes in the Prince Rupert corridor increased considerably overnight and have now risen above 1,900 cars. Cars Not Moving: The count of idle cars decreased overnight for CN offset somewhat by higher counts on CP and have now fallen below 2,000 cars. Port Unloads West coast port unloads fell below the 1,000 car threshold for the first time in three days but remain on pace to exceed last week by 5%. ========================================================================================================================== Loads on Wheels Loads on wheels declined slightly overnight, due to reduced volumes on CN offset by higher traffic on CP - combined total at 12,519 and 5% above the trailing 30-day average. On a net basis, the decline in loads on wheels reflects reduced volumes in the E. Canada, USA/MEX and Vancouver corridors offset by higher volumes in the Prince Rupert and Thunder Bay corridors. CN volumes decreased 4% (-266) overnight, with reduced volumes across all corridors other than Prince Rupert. System wide CN loads on wheels presently at 6,605 and 2% below the trailing 30-day average. CP volumes increased 5% (+296) overnight, driven by an increase in traffic across all corridors other than E. Canada. CP system wide loads on wheels presently at 5,702 and 14% above the trailing 30-day average. Vancouver presently at 6,721, declined slightly by (-11) overnight, now 4% below the trailing 30-day average. The Prince Rupert pipeline presently at 1,921, increased for the third consecutive day, up 14% (+238) overnight, and 16% above the trailing 30-day average. Thunder Bay volumes rose for the fifth consecutive day, up 4% (+76) overnight - currently at 2,141, the highest seen in the last 30 days, with 74% of traffic moving on CP. Hopper Car Rationing CN rationed very few hopper cars in week 34. Shippers have now begun reporting rationing in week 35. Loads Not Moving (including cars placed for unloading) The count of cars not moving for 48+ hours decreased 11% (-230) overnight, reflecting reduced counts on CN offset by higher counts on CP. Idle car counts now at 1,935 and 18% below the trailing 30-day average. CN The count of idle cars for 48+ hours declined 19% (-294) overnight - now at 1,225 cars. The number of cars idle for 4+ days increased 11% (+64) overnight - currently at 625 cars. The count of cars not moving for 7+ days decreased 14% (-45) overnight - presently at 267 cars. 1 Daily Pipeline Status As of 23:59 2020-04-07
Transcript of Cars Not Moving · 4/7/2020 · The number of cars idle for 7+ days rose for the third consecutive...

SPEED READ
• Loads on wheels:◦ On a network basis loads on wheels were largely unchanged overnight reflecting lower volumes on CN and higher volumes on CP. ◦ The net overall reflects a series of puts and takes across a number of corridors for both railways with the most significant changes being an increase
in Prince Rupert volumes for CN and higher volumes for CP in the Thunder Bay corridor.◦ Volumes in the Prince Rupert corridor increased considerably overnight and have now risen above 1,900 cars.
• Cars Not Moving:◦ The count of idle cars decreased overnight for CN offset somewhat by higher counts on CP and have now fallen below 2,000 cars.
• Port Unloads◦ West coast port unloads fell below the 1,000 car threshold for the first time in three days but remain on pace to exceed last week by 5%.
==========================================================================================================================
Loads on Wheels
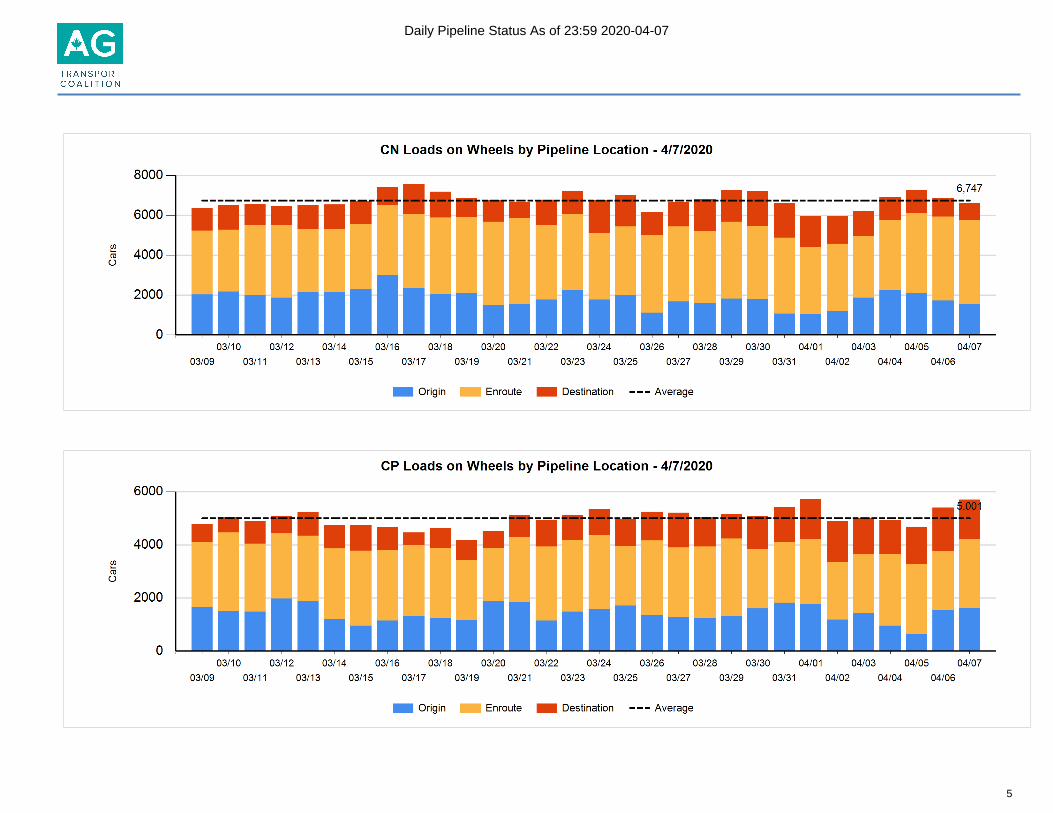
• Loads on wheels declined slightly overnight, due to reduced volumes on CN offset by higher traffic on CP - combined total at 12,519 and 5% above the trailing 30-day average.
• On a net basis, the decline in loads on wheels reflects reduced volumes in the E. Canada, USA/MEX and Vancouver corridors offset by higher volumes in the Prince Rupert and Thunder Bay corridors.
• CN volumes decreased 4% (-266) overnight, with reduced volumes across all corridors other than Prince Rupert. System wide CN loads on wheels presently at 6,605 and 2% below the trailing 30-day average.
• CP volumes increased 5% (+296) overnight, driven by an increase in traffic across all corridors other than E. Canada. CP system wide loads on wheels presently at 5,702 and 14% above the trailing 30-day average.
• Vancouver presently at 6,721, declined slightly by (-11) overnight, now 4% below the trailing 30-day average.• The Prince Rupert pipeline presently at 1,921, increased for the third consecutive day, up 14% (+238) overnight, and 16% above the trailing 30-day
average.• Thunder Bay volumes rose for the fifth consecutive day, up 4% (+76) overnight - currently at 2,141, the highest seen in the last 30 days, with 74% of traffic
moving on CP.
Hopper Car Rationing
• CN rationed very few hopper cars in week 34. Shippers have now begun reporting rationing in week 35.
Loads Not Moving (including cars placed for unloading)
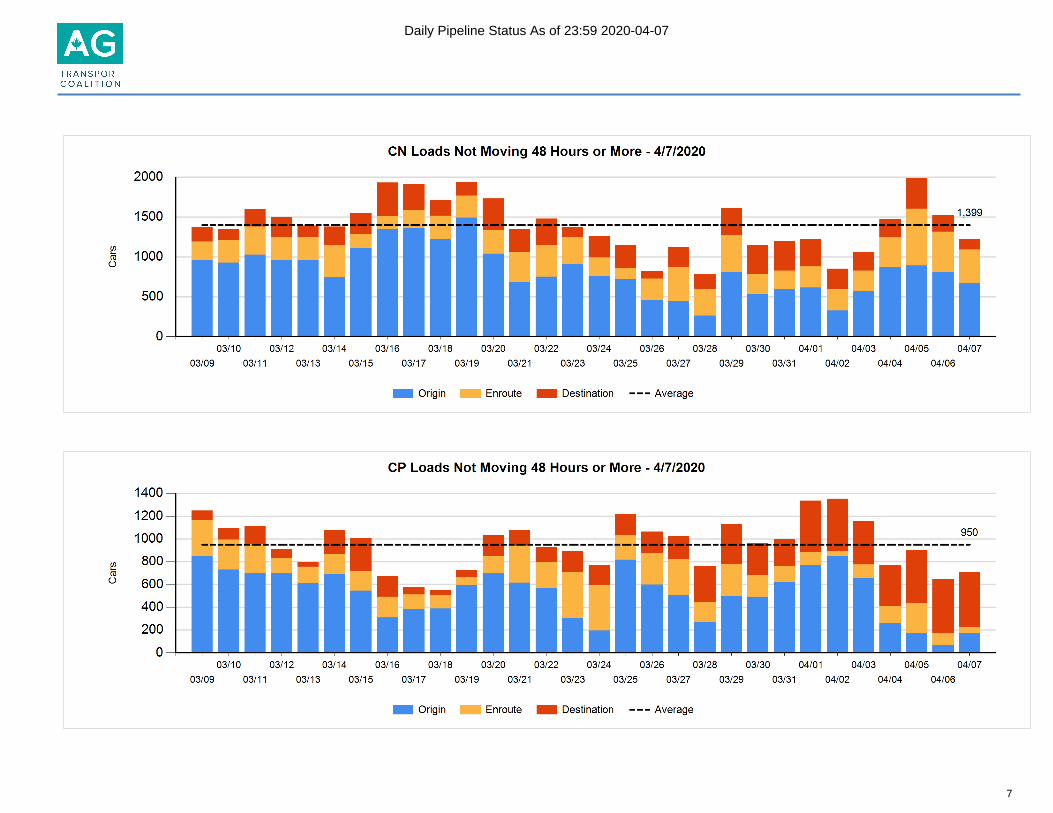
• The count of cars not moving for 48+ hours decreased 11% (-230) overnight, reflecting reduced counts on CN offset by higher counts on CP. Idle car counts now at 1,935 and 18% below the trailing 30-day average.
• CN◦ The count of idle cars for 48+ hours declined 19% (-294) overnight - now at 1,225 cars.◦ The number of cars idle for 4+ days increased 11% (+64) overnight - currently at 625 cars.◦ The count of cars not moving for 7+ days decreased 14% (-45) overnight - presently at 267 cars.
1
Daily Pipeline Status As of 23:59 2020-04-07
◦ Vancouver represents 60% of all idle cars.◦ In total 55% of all idle cars are dwelling at origin locations.
• CP◦ CP idle car counts for 48+ hours rose 10% (+64) overnight - presently at 710 cars.◦ The number of cars idle for 4+ days declined 7% (-23) overnight and have now decreased for the third consecutive day - presently at 330 cars.◦ The number of cars idle for 7+ days rose for the third consecutive day, up 84% (+62) overnight - currently at 136 cars.◦ Vancouver accounts for 87% of all idle cars.◦ In total 25% of all idle cars are dwelling at origin locations.
Port Performance
• CN and CP reported a total of 1,210 cars unloaded at the three major ports, now 5% above the trailing 30-day average. Two days in Week 36 unloads now ahead of last week's pace by 200 unloads, reflecting higher unloads at Thunder Bay and Vancouver offset by reduced unloads at Prince Rupert.
• Vancouver◦ 808 unloads reported by CN and CP at the Port of Vancouver; CN - 384 and CP - 424. Two days in Week 36 unloads are tracking ahead of last
week's performance by 100 unloads.◦ There are more than 1,550 cars on site at Vancouver with around 850 cars arriving at the port in the last 24 hours.◦ CN and CP have more than 1,250 cars in British Columbia en route to Vancouver, with nearly 750 cars at Kamloops and west, and 63% of traffic
moving on CP.• Prince Rupert
◦ Prince Rupert reported 122 unloads, the lowest seen in the last 30 days, now behind last week's unloads after two days by more than 50 unloads.◦ Loads on wheels remain above 1,000 cars - presently at 1,921 cars.◦ There are more than 650 cars west of Jasper en route to Prince Rupert.◦ There are 28 cars on site at Prince Rupert with 150 cars arriving at the port in the last 24 hours.
• Thunder Bay◦ 280 unloads were reported at Thunder Bay yesterday. Two days in Week 36 unloads are tracking ahead of last week's pace by more than 150
unloads.◦ There are 550 cars on site at Thunder Bay with 50 cars arriving at the port in the prior 24 hours.◦ There are 500 cars en route to Thunder Bay from Winnipeg and east.
2
Daily Pipeline Status As of 23:59 2020-04-07

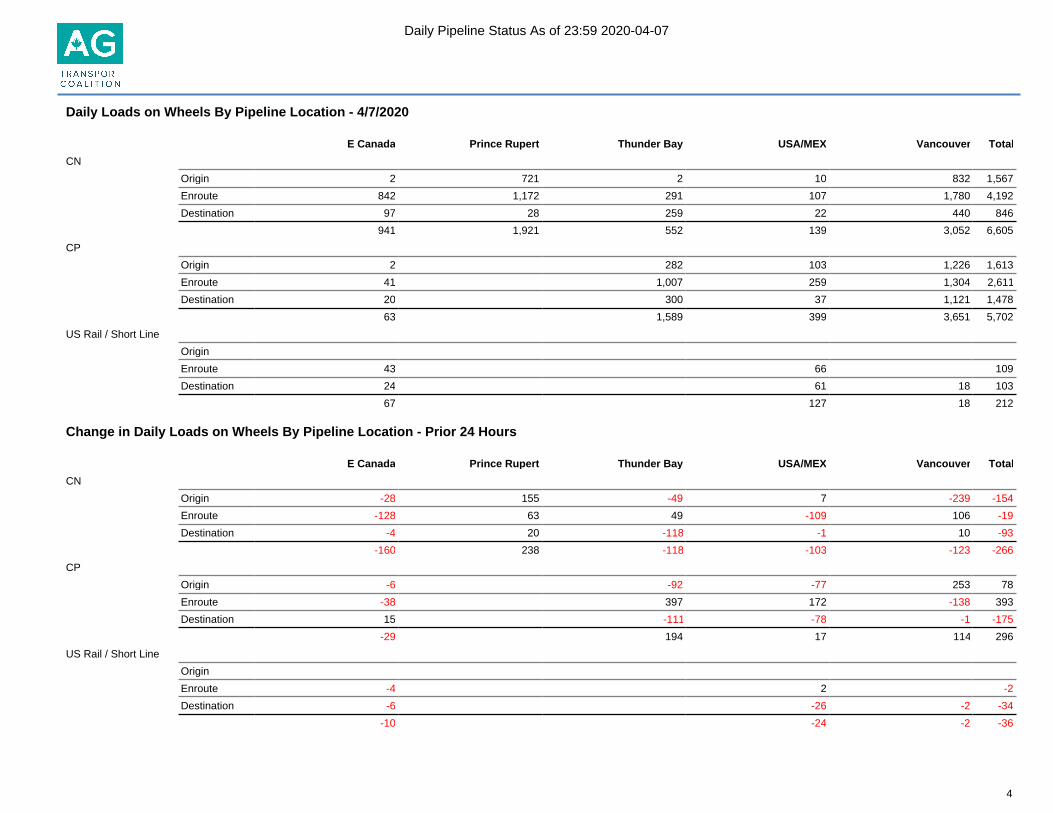
Daily Loads on Wheels - 4/7/2020 Change in Loads on Wheels - Prior 24 Hours
E Canada Prince Rupert Thunder Bay USA/MEX Vancouver Total
CN 941 1,921 552 139 3,052 6,605
CP 63 1,589 399 3,651 5,702
Short Line 67 18 85
US Rail 127 127
1,071 1,921 2,141 665 6,721 12,519
E Canada Prince Rupert Thunder Bay USA/MEX Vancouver Total
CN -160 238 -118 -103 -123 -266
CP -29 194 17 114 296
Short Line -10 -2 -12
US Rail -24 -24
-199 238 76 -110 -11 -6
3
Daily Pipeline Status As of 23:59 2020-04-07
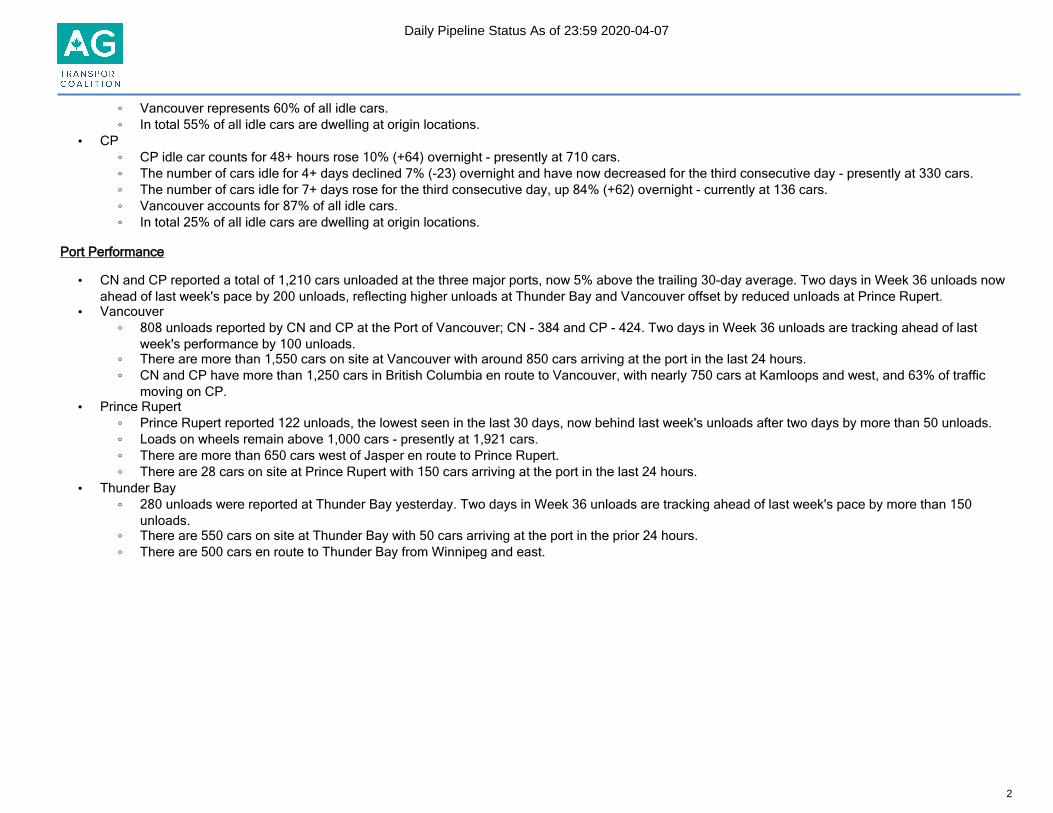
Daily Loads on Wheels By Pipeline Location - 4/7/2020
E Canada Prince Rupert Thunder Bay USA/MEX Vancouver Total
CN
Origin 2 721 2 10 832 1,567
Enroute 842 1,172 291 107 1,780 4,192
Destination 97 28 259 22 440 846
941 1,921 552 139 3,052 6,605
CP
Origin 2 282 103 1,226 1,613
Enroute 41 1,007 259 1,304 2,611
Destination 20 300 37 1,121 1,478
63 1,589 399 3,651 5,702
US Rail / Short Line
Origin
Enroute 43 66 109
Destination 24 61 18 103
67 127 18 212
Change in Daily Loads on Wheels By Pipeline Location - Prior 24 Hours
E Canada Prince Rupert Thunder Bay USA/MEX Vancouver Total
CN
Origin -28 155 -49 7 -239 -154
Enroute -128 63 49 -109 106 -19
Destination -4 20 -118 -1 10 -93
-160 238 -118 -103 -123 -266
CP
Origin -6 -92 -77 253 78
Enroute -38 397 172 -138 393
Destination 15 -111 -78 -1 -175
-29 194 17 114 296
US Rail / Short Line
Origin
Enroute -4 2 -2
Destination -6 -26 -2 -34
-10 -24 -2 -36
4
Daily Pipeline Status As of 23:59 2020-04-07
5
Daily Pipeline Status As of 23:59 2020-04-07

Loads Not Moving 48 Hours or More - 4/7/2020
E Canada Prince Rupert Thunder Bay USA/MEX Vancouver Total
CN
Origin 2 258 1 1 411 673
Enroute 137 8 37 13 223 418
Destination 19 3 11 5 96 134
158 269 49 19 730 1225
CP
Origin 1 1 3 170 175
Enroute 9 1 39 49
Destination 2 76 408 486
12 78 3 617 710
US Rail / Short Line
Origin
Enroute 43 29 72
Destination 1 26 11 38
44 55 11 110
Change in Loads Not Moving 48 Hours or More - 4/7/2020
E Canada Prince Rupert Thunder Bay USA/MEX Vancouver Total
CN
Origin -1 258 1 0 -395 -137
Enroute -66 -26 1 1 4 -86
Destination -3 1 -63 0 -6 -71
-70 233 -61 1 -397 -294
CP
Origin -5 0 0 113 108
Enroute -30 -1 -2 -23 -56
Destination -2 -56 70 12
-37 -57 -2 160 64
US Rail / Short Line
Origin
Enroute 0 0 0
Destination 0 0 -1 -1
0 0 -1 -1
6
Daily Pipeline Status As of 23:59 2020-04-07
7
Daily Pipeline Status As of 23:59 2020-04-07

Port Unloads - 4/7/2020
Prince Rupert Vancouver West Coast Total Thunder Bay Total
CN 122 384 506 118 624
CP 424 424 162 586
122 808 930 280 1,210
8
Daily Pipeline Status As of 23:59 2020-04-07

Port Terminal Status
Vancouver Port Unloads
Daily Activity for 4/7/2020
Cars Arrived Cars Received in Interchange
Cars Delivered in Interchange
Cars Placed for Unloading
Loads on Wheels at Destination As of
4/7/2020
CN 366 126 146 396 449
CP 470 146 132 451 1,126
SRY 6 6 18
04/07 04/06 Week To Date Last Week
CN 384 414 798 2,545
CP 424 434 858 2,953
SRY 10 1 11 63
Age Profile of Loaded Cars Waiting Placement for Unloading
Today
< 24 Hrs 24 - 48 Hrs > 48-72 Hrs > 72 Hrs Total On Hand
CN 156 72 89 69 386
CP 254 101 167 279 801
SRY 1 1
Change in Last 24 Hours
< 24 Hrs 24-48 Hrs 48 - 72 Hrs > 72 Hrs
CN 115 -17 68 19
CP -146 -125 108 -35
SRY 0
9
Daily Pipeline Status As of 23:59 2020-04-07

Port Terminal Status
Prince Rupert Port Unloads
Daily Activity for 4/7/2020
Cars Arrived Cars Received in Interchange
Cars Delivered in Interchange
Cars Placed for Unloading
Loads on Wheels at Destination As of
4/7/2020
CN 140 142 28
04/07 04/06 Week To Date Last Week
CN 122 191 313 1,423
Age Profile of Loaded Cars Waiting Placement for Unloading
Today
< 24 Hrs 24 - 48 Hrs > 48-72 Hrs > 72 Hrs Total On Hand
CN 1 1
Change in Last 24 Hours
< 24 Hrs 24-48 Hrs 48 - 72 Hrs > 72 Hrs
CN 0
10
Daily Pipeline Status As of 23:59 2020-04-07

Port Terminal Status
Thunder Bay Port Unloads
Daily Activity for 4/7/2020
Cars Arrived Cars Received in Interchange
Cars Delivered in Interchange
Cars Placed for Unloading
Loads on Wheels at Destination As of
4/7/2020
CN 179 259
CP 51 171 300
04/07 04/06 Week To Date Last Week
CN 118 236 354 700
CP 162 92 254 1,014
Age Profile of Loaded Cars Waiting Placement for Unloading
Today
< 24 Hrs 24 - 48 Hrs > 48-72 Hrs > 72 Hrs Total On Hand
CN 105 105
CP 51 53 73 177
Change in Last 24 Hours
< 24 Hrs 24-48 Hrs 48 - 72 Hrs > 72 Hrs
CN -253 105 -31
CP -90 26 -56
11
Daily Pipeline Status As of 23:59 2020-04-07
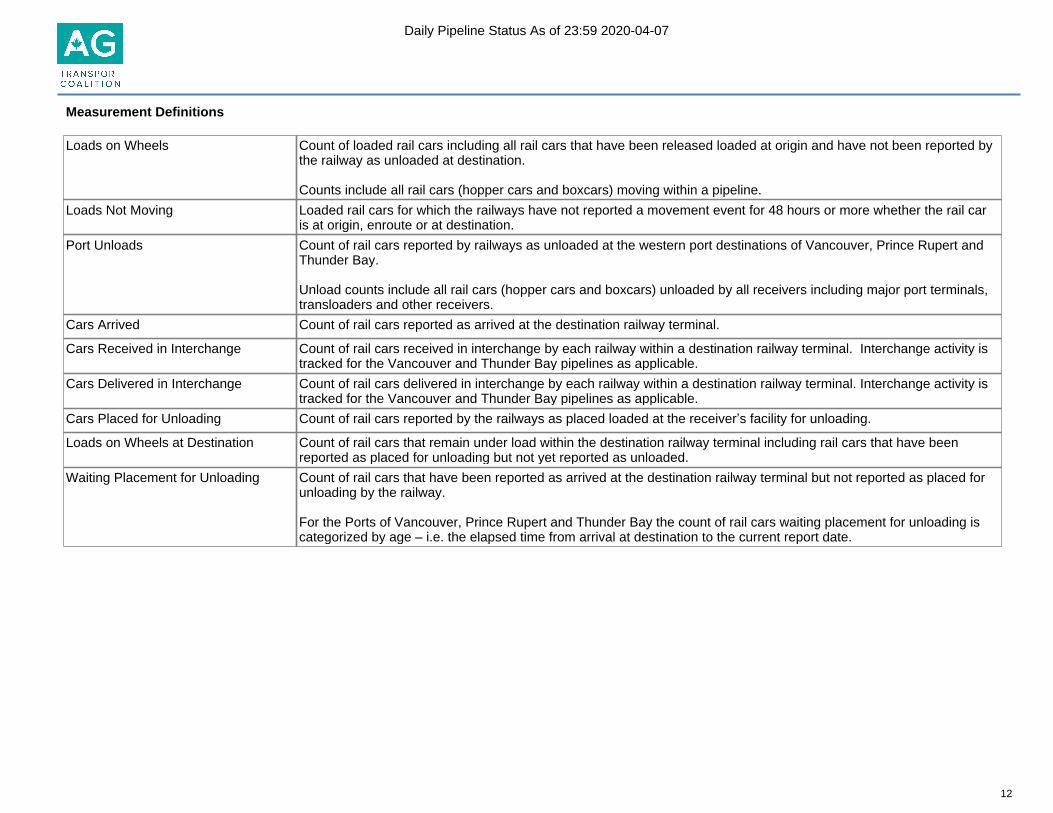
Measurement Definitions
Loads on Wheels Count of loaded rail cars including all rail cars that have been released loaded at origin and have not been reported by the railway as unloaded at destination.
Counts include all rail cars (hopper cars and boxcars) moving within a pipeline.
Loads Not Moving Loaded rail cars for which the railways have not reported a movement event for 48 hours or more whether the rail car is at origin, enroute or at destination.
Port Unloads Count of rail cars reported by railways as unloaded at the western port destinations of Vancouver, Prince Rupert and Thunder Bay.
Unload counts include all rail cars (hopper cars and boxcars) unloaded by all receivers including major port terminals, transloaders and other receivers.
Cars Arrived Count of rail cars reported as arrived at the destination railway terminal.
Cars Received in Interchange Count of rail cars received in interchange by each railway within a destination railway terminal. Interchange activity is tracked for the Vancouver and Thunder Bay pipelines as applicable.
Cars Delivered in Interchange Count of rail cars delivered in interchange by each railway within a destination railway terminal. Interchange activity is tracked for the Vancouver and Thunder Bay pipelines as applicable.
Cars Placed for Unloading Count of rail cars reported by the railways as placed loaded at the receiver’s facility for unloading.
Loads on Wheels at Destination Count of rail cars that remain under load within the destination railway terminal including rail cars that have been reported as placed for unloading but not yet reported as unloaded.
Waiting Placement for Unloading Count of rail cars that have been reported as arrived at the destination railway terminal but not reported as placed for unloading by the railway.
For the Ports of Vancouver, Prince Rupert and Thunder Bay the count of rail cars waiting placement for unloading is categorized by age – i.e. the elapsed time from arrival at destination to the current report date.
12
Daily Pipeline Status As of 23:59 2020-04-07