Carnegie Mellon Facts 1995 - CMU
104
CMU Facts Welcome Carnegie Mellon Facts 1995 Volume 9 Richard J. Hall, Editor University Planning and Budget Carnegie Mellon University February 1995 Foreword Carnegie Mellon Facts is a compilation of commonly requested data and statistical information about Carnegie Mellon. It includes information about students, alumni, faculty and staff at CMU. You can use Facts to find information on admissions, enrollment, teaching, research and University finances and facilities. Facts also provides some useful comparative data from other universities. The data presented in the tables and graphs are from internal sources except where noted. The terms used are defined in the Appendix. Carnegie Mellon Facts is intended primarily as an internal document, produced annually for use by members of the campus community. We encourage you to keep this book handy and to use it as a reference. This publication is also available in electronic form on the Planning and Budget server located on the macintosh network in the Craig Street Zone. We in University Planning Services want this book to be a reliable source of accurate and useful information. Your suggestions and comments on the contents, format and usefulness of Facts will help with the continual improvement of this information tool. Please respond to the brief questionnaire enclosed for your use. Or, call University Planning at 268-8729 if you have questions or suggestions for improving the report. Thank you. Kevin Lamb Director University Planning Services Acknowledgments University Planning and Budgets is grateful to individuals from the following departments for providing information for the 1995 Fact Book. file:///H|/Common/Admin%20&%20Office%20Productivity/Planning%20Website/ira/factbook/facts95/foreword.html (1 of 2)10/24/2008 2:41:41 PM
Transcript of Carnegie Mellon Facts 1995 - CMU
CMU Facts Welcome
Carnegie Mellon Facts 1995
Volume 9
Richard J. Hall, Editor University Planning and Budget Carnegie Mellon University February 1995
Foreword
Carnegie Mellon Facts is a compilation of commonly requested data and statistical information about Carnegie Mellon. It includes information about students, alumni, faculty and staff at CMU. You can use Facts to find information on admissions, enrollment, teaching, research and University finances and facilities. Facts also provides some useful comparative data from other universities. The data presented in the tables and graphs are from internal sources except where noted. The terms used are defined in the Appendix.
Carnegie Mellon Facts is intended primarily as an internal document, produced annually for use by members of the campus community. We encourage you to keep this book handy and to use it as a reference. This publication is also available in electronic form on the Planning and Budget server located on the macintosh network in the Craig Street Zone.
We in University Planning Services want this book to be a reliable source of accurate and useful information. Your suggestions and comments on the contents, format and usefulness of Facts will help with the continual improvement of this information tool. Please respond to the brief questionnaire enclosed for your use. Or, call University Planning at 268-8729 if you have questions or suggestions for improving the report.
Thank you.
Kevin Lamb Director University Planning Services
Acknowledgments
University Planning and Budgets is grateful to individuals from the following departments for providing information for the 1995 Fact Book.
file:///H|/Common/Admin%20&%20Office%20Productivity/Planning%20Website/ira/factbook/facts95/foreword.html (1 of 2)10/24/2008 2:41:41 PM

CMU Facts Welcome
Accounting Alumni Relations Computing Services Dean's Office - Carnegie Institute of Technology Dean's Office - College of Fine Arts Dean's Office - College of Humanities and Social Science Dean's Office - Mellon College of Science Graduate School of Industrial Administration Housing System Human Resources Instructional Technology Office of the Controller Office of the Provost Records Registrar's Office School of Computer Science The Heinz School University Libraries University Relations University Teaching Center
[Top of this page] [Fact Book Main Page] [Next Section: History, Mission, and Organization]
Last update: 8/18/95
file:///H|/Common/Admin%20&%20Office%20Productivity/Planning%20Website/ira/factbook/facts95/foreword.html (2 of 2)10/24/2008 2:41:41 PM

CMU History, Mission, and Organization
CMU History, Mission, and Organization
CONTENTS The University. Vision. Mission Statement. Our Values and Traditions. Degree Programs By College and Department, 1994-95. Research Centers, Institutions and Groups by Academic, Research, or Other Units. Endowed and Named Professors by College. Accreditations By College and Department, Fall 1994.
The University
Carnegie Mellon has emerged as one of the nation's leading private research universities. The university's interdisciplinary approach provides graduates with professional and technical skills and a strong science and liberal arts background. According to Edward B. Fiske, former education columnist for the New York Times, Carnegie Mellon's "faculty and administration have done the most original thinking of any American university in pursuing the twin goals of liberal-professional education."
Carnegie Mellon began in 1900 when industrialist Andrew Carnegie founded Carnegie Technical Schools in Pittsburgh's Oakland section. Twelve years later these schools became a degree-granting college----the Carnegie Institute of Technology. In 1967, Carnegie Tech merged with the Mellon Institute of Research to form Carnegie Mellon University.
Carnegie Mellon's internationally recognized programs encompass the areas of engineering, technology, science, liberal arts, fine arts, and public and private management. The university includes four undergraduate colleges and three graduate schools:
The Carnegie Institute of Technology (CIT) includes six departments: Chemical Engineering, Civil, and Environmental Engineering, Electrical and Computer Engineering, Engineering and Public Policy, Mechanical Engineering, and Metallurgy and Materials Science, plus a program in Biomedical Engineering.
The College of Fine Arts (CFA), the first school in the nation to award a degree in drama , includes the departments of Architecture, Art, Design, Drama and Music.
The College of Humanities and Social Sciences (H&SS) is recognized for its broad view of the liberal-professional arts and its commitment to excellence in teaching. Its departments include Economics, English, History, Modern Languages, Philosophy, Psychology, Social and Decision Sciences, and Statistics.
The Mellon College of Science (MCS) is composed of the departments of Biological Sciences, Chemistry, Mathematics and Physics.
The Graduate School of Industrial Administration (GSIA) offers a Master of Science in Industrial Administration, a degree roughly equivalent to an M.B.A. with a firmer scientific component based on the use of quantitative methods as management tools. GSIA also offers doctoral and executive education programs and now administers undergraduate programs in economics and industrial management.
The School of Computer Science (SCS) operates at the forefront of research in computing, artificial intelligence, machine translation and robotics. The school grants doctor's degrees in computer science and robotics, a master's degree in software engineering and an undergraduate degree.
The Heinz School (HNZ) offers graduate programs to educate managers and analysts for government and non-profit organizations; it awards master's degrees in Public Management and Policy, Arts management and a doctor's degree in Public Policy Analysis.
file:///H|/Common/Admin%20&%20Office%20Productivity/Planning%20Website/ira/factbook/facts95/mission.html (1 of 11)10/24/2008 2:41:41 PM
CMU History, Mission, and Organization
Vision
Carnegie Mellon will lead educational institutions by building on its traditions of innovation and transcending disciplinary boundaries to meet the changing needs of society.
Mission Statement
To create and disseminate knowledge and art through research and artistic expression, teaching and learning, and transfer to society.
To serve our students by teaching them leadership and problem-solving skills, and our values of quality, ethical behavior, responsibility to society and commitment to our work.
To pursue the advantages provided by a diverse community, open to the exchange of ideas, where discovery and artistic creativity can flourish.
Our Values and Traditions
Leadership: We lead through innovation and excellence; we establish new directions by talent and example, influencing the behavior of other institutions.
Innovation: We identify challenges and opportunities presented by evolving human needs, new research methods and technologies, and promptly assemble the talent and resources needed to exploit them. Our innovative capability is one of the foundations upon which our leadership capacity is built.
Transcending Disciplinary Boundaries: We function seamlessly and transcend traditional disciplinary boundaries to our comparative advantage.
Responsibility to Society: We serve society through transfer of technology, continuing education programs, public service and enrichment of the community through the arts.
Learning: We will build on our heritage of the Carnegie Plan to become a leading institution that combines first-rate research with outstanding undergraduate education through our focus on learning and problem-solving.
Dedication to our Work: Our students, staff and faculty are committed to our heritage emblazoned on our seal: "My Heart is in the Work."
Commitment to Quality: We focus our energies on understanding the needs of the communities we serve while applying principles of self-evaluation, benchmarking and continuous improvement to fulfill these needs.
Degree Programs By College and Department Academic Year 1994-1995
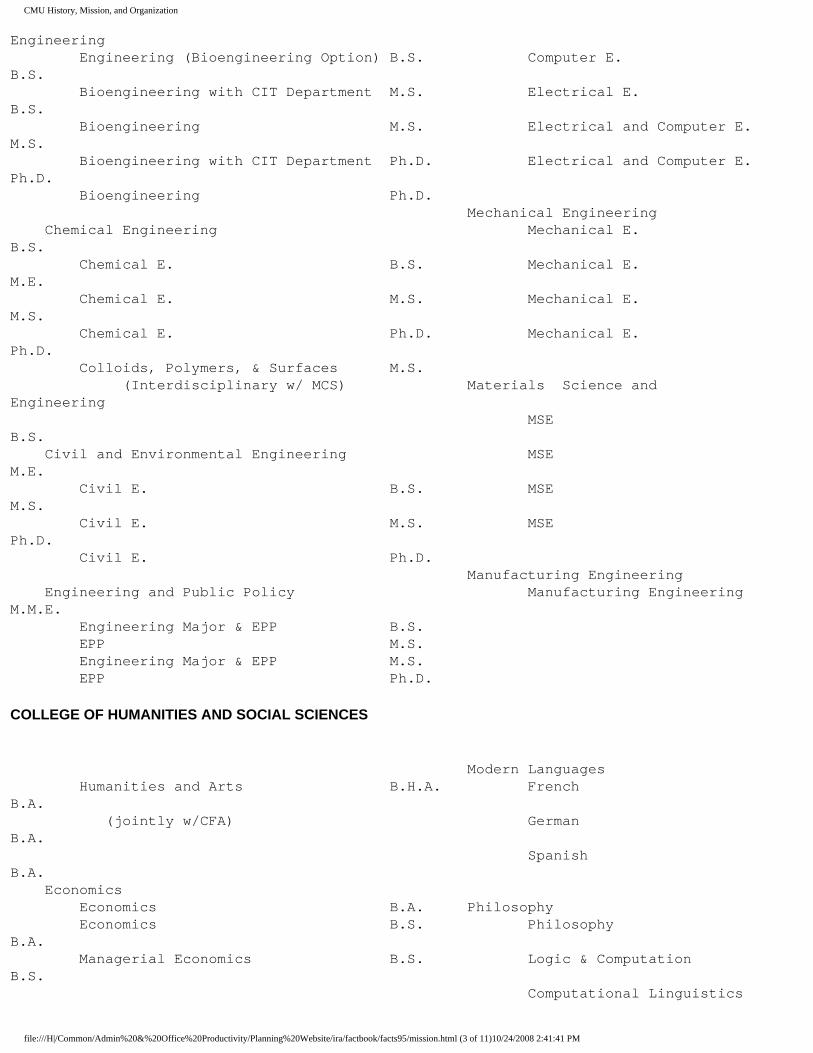
CARNEGIE INSTITUTE OF TECHNOLOGY
Biomedical Engineering Electrical and Computer
file:///H|/Common/Admin%20&%20Office%20Productivity/Planning%20Website/ira/factbook/facts95/mission.html (2 of 11)10/24/2008 2:41:41 PM
CMU History, Mission, and Organization
Engineering Engineering (Bioengineering Option) B.S. Computer E. B.S. Bioengineering with CIT Department M.S. Electrical E. B.S. Bioengineering M.S. Electrical and Computer E. M.S. Bioengineering with CIT Department Ph.D. Electrical and Computer E. Ph.D. Bioengineering Ph.D. Mechanical Engineering Chemical Engineering Mechanical E. B.S. Chemical E. B.S. Mechanical E. M.E. Chemical E. M.S. Mechanical E. M.S. Chemical E. Ph.D. Mechanical E. Ph.D. Colloids, Polymers, & Surfaces M.S. (Interdisciplinary w/ MCS) Materials Science and Engineering MSE B.S. Civil and Environmental Engineering MSE M.E. Civil E. B.S. MSE M.S. Civil E. M.S. MSE Ph.D. Civil E. Ph.D. Manufacturing Engineering Engineering and Public Policy Manufacturing Engineering M.M.E. Engineering Major & EPP B.S. EPP M.S. Engineering Major & EPP M.S. EPP Ph.D.
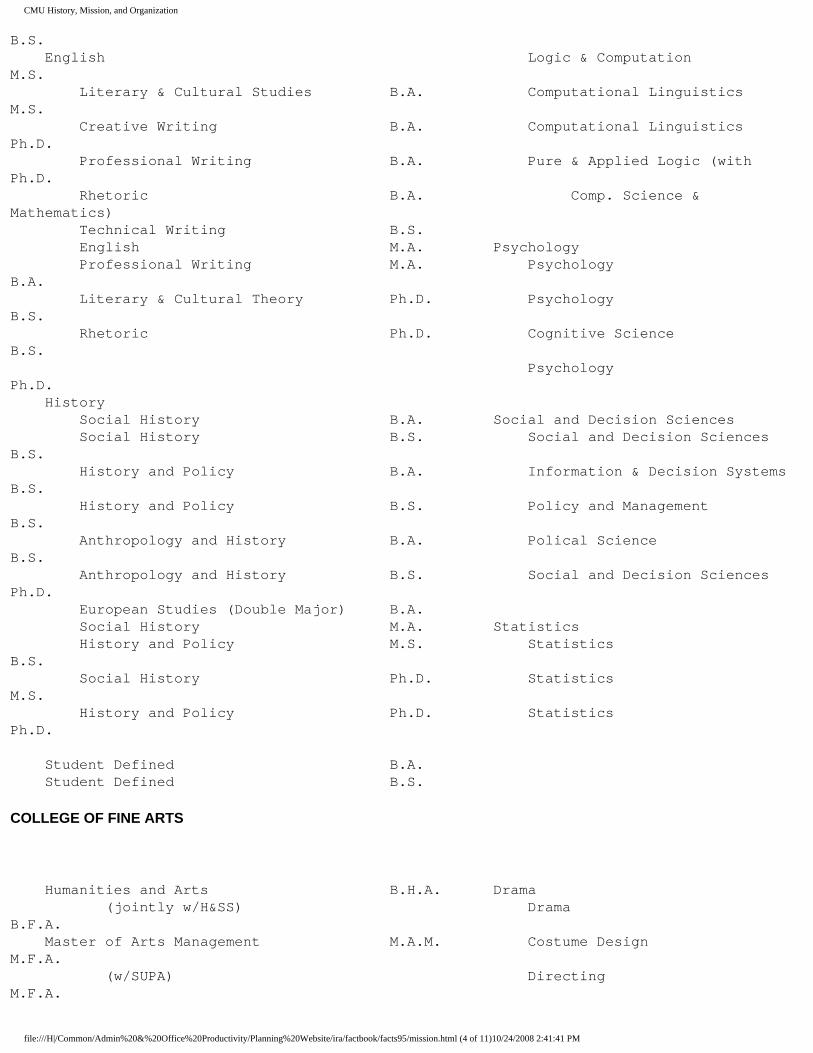
COLLEGE OF HUMANITIES AND SOCIAL SCIENCES
Modern Languages Humanities and Arts B.H.A. French B.A. (jointly w/CFA) German B.A. Spanish B.A. Economics Economics B.A. Philosophy Economics B.S. Philosophy B.A. Managerial Economics B.S. Logic & Computation B.S. Computational Linguistics
file:///H|/Common/Admin%20&%20Office%20Productivity/Planning%20Website/ira/factbook/facts95/mission.html (3 of 11)10/24/2008 2:41:41 PM
CMU History, Mission, and Organization
B.S. English Logic & Computation M.S. Literary & Cultural Studies B.A. Computational Linguistics M.S. Creative Writing B.A. Computational Linguistics Ph.D. Professional Writing B.A. Pure & Applied Logic (with Ph.D. Rhetoric B.A. Comp. Science & Mathematics) Technical Writing B.S. English M.A. Psychology Professional Writing M.A. Psychology B.A. Literary & Cultural Theory Ph.D. Psychology B.S. Rhetoric Ph.D. Cognitive Science B.S. Psychology Ph.D. History Social History B.A. Social and Decision Sciences Social History B.S. Social and Decision Sciences B.S. History and Policy B.A. Information & Decision Systems B.S. History and Policy B.S. Policy and Management B.S. Anthropology and History B.A. Polical Science B.S. Anthropology and History B.S. Social and Decision Sciences Ph.D. European Studies (Double Major) B.A. Social History M.A. Statistics History and Policy M.S. Statistics B.S. Social History Ph.D. Statistics M.S. History and Policy Ph.D. Statistics Ph.D. Student Defined B.A. Student Defined B.S.
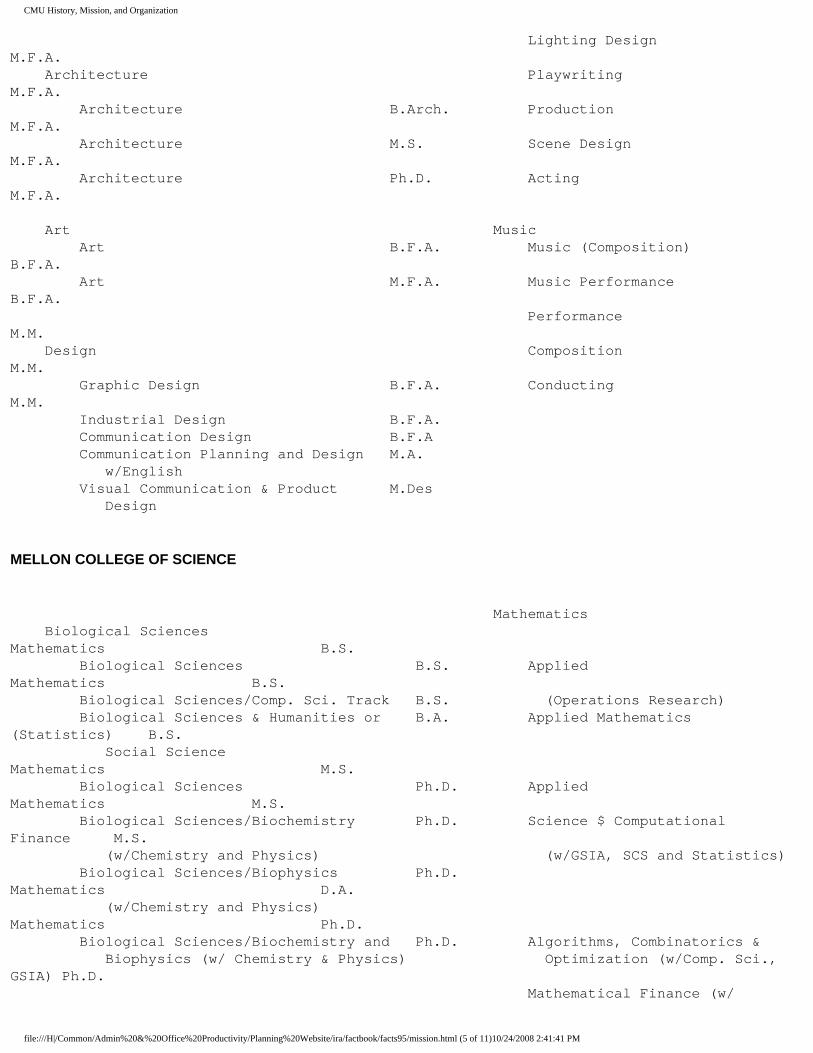
COLLEGE OF FINE ARTS
Humanities and Arts B.H.A. Drama (jointly w/H&SS) Drama B.F.A. Master of Arts Management M.A.M. Costume Design M.F.A. (w/SUPA) Directing M.F.A.
file:///H|/Common/Admin%20&%20Office%20Productivity/Planning%20Website/ira/factbook/facts95/mission.html (4 of 11)10/24/2008 2:41:41 PM
CMU History, Mission, and Organization
Lighting Design M.F.A. Architecture Playwriting M.F.A. Architecture B.Arch. Production M.F.A. Architecture M.S. Scene Design M.F.A. Architecture Ph.D. Acting M.F.A. Art Music Art B.F.A. Music (Composition) B.F.A. Art M.F.A. Music Performance B.F.A. Performance M.M. Design Composition M.M. Graphic Design B.F.A. Conducting M.M. Industrial Design B.F.A. Communication Design B.F.A Communication Planning and Design M.A. w/English Visual Communication & Product M.Des Design
MELLON COLLEGE OF SCIENCE
Mathematics Biological Sciences Mathematics B.S. Biological Sciences B.S. Applied Mathematics B.S. Biological Sciences/Comp. Sci. Track B.S. (Operations Research) Biological Sciences & Humanities or B.A. Applied Mathematics (Statistics) B.S. Social Science Mathematics M.S. Biological Sciences Ph.D. Applied Mathematics M.S. Biological Sciences/Biochemistry Ph.D. Science $ Computational Finance M.S. (w/Chemistry and Physics) (w/GSIA, SCS and Statistics) Biological Sciences/Biophysics Ph.D. Mathematics D.A. (w/Chemistry and Physics) Mathematics Ph.D. Biological Sciences/Biochemistry and Ph.D. Algorithms, Combinatorics & Biophysics (w/ Chemistry & Physics) Optimization (w/Comp. Sci., GSIA) Ph.D. Mathematical Finance (w/
file:///H|/Common/Admin%20&%20Office%20Productivity/Planning%20Website/ira/factbook/facts95/mission.html (5 of 11)10/24/2008 2:41:41 PM
CMU History, Mission, and Organization
GSIA) Ph.D. Pure & Applied Logic (w/ Computer Ph.D. Chemistry Science and Philosophy) Chemistry B.A. Chemistry B.S. Chemistry/Computer Science Track B.S. Physics Chemistry M.S. Physics B.A. Polymer Science M.S. Physics B.S. Colloids, Polymers, and Surfaces M.S. Physics/Computer Science Track B.S. (w/ Chemical E.) Physics M.S. Chemistry Ph.D. Physics Ph.D. Chemistry/Biochemistry Ph.D. Applied Physics Ph.D. (w/Biology and Physics) Physics/Biochemistry Ph.D. Chemistry/Biophysics Ph.D. (w/Biology and Chemistry) (w/Biology and Physics) Physics/Biophysics Ph.D. Chemistry/Biochemistry & Ph.D. (w/Biology and Chemistry) Biophysics (w/Biology and Physics) Physics/Biochemistry & Biophysics Ph.D. (w/Biology and Chemistry)
GRADUATE SCHOOL OF INDUSTRIAL H. JOHN HEINZ OF PUBLIC POLICY ADMINISTRATION AND MANAGEMENT Industrial Management B.S. Public Management & Policy M.S. Industrial Administration M.S.I.A. Public Management & Policy, minor M.S. Industrial Administration, minor in M.S. in Business Admin. (w/ GSIA) Pub. Management & Policy (w/ SUPA) Public Management & Policy & Juris M.S. Civil Engineering & Management (w/CIT) M.S. Doctor (w/ U. of Pittsburgh) Computational Finance M.S. Master of Arts Management (w/ CFA) M.A.M. (w/HSS, MCS and SCS) Master of Philosophy M.Phil. Software Engineering and Business M.S. Master of Public Management M.P.M. Mgt (w/SCS) Public Policy Analysis Ph.D. Industrial Administration Ph.D. Social Science & Public Policy Ph.D. Accounting Ph.D. Analysis (w/ S&DS.) Algorithms, Combinatorics and Ph.D. Optimization (w/ Computer Science and Mathematics)
file:///H|/Common/Admin%20&%20Office%20Productivity/Planning%20Website/ira/factbook/facts95/mission.html (6 of 11)10/24/2008 2:41:41 PM
CMU History, Mission, and Organization
Economics Ph.D. Financial Economics Ph.D. Information Systems Ph.D. Management of Manufacturing and Ph.D. Automation (w/ Robotics Institute) Manufacturing and Operations Ph.D. Systems Marketing Ph.D. Operations Research Ph.D. Organizational Behavior and Theory Ph.D. Politics and Political Economy Ph.D. SCHOOL OF COMPUTER SCIENCE Mathematics/Computer Science B.S. (w/Mathematics) Software Engineering M.S. Algorithms, Combinatorics & Ph.D. Optimization (w/GSIA & Mathematics) Computer Science Ph.D. Robotics Ph.D. Pure & Applied Logic (w/ Philosophy Ph.D. & Mathematics)
Information Networking Institute Information Networking M.S. (jointly w/GSIA, CIT and SCS)
Research Centers, Institutions and Groups By Academic, Research or Other Units Fall 1994
ACADEMIC UNITS
CARNEGIE INSTITUTE OF TECHNOLOGY Center for Advanced Deformation Processing Research (CADPR) Computing Systems Center (CSC) Center for Energy and Environmental Studies (CEES) Center for Entrepreneurial Development (CED) Center for Excellence in Optical Data Processing (CEODP) Center for Iron and Steelmaking Research (CISR) Center for Solid Waste Management (CSWM) Data Storage System Center (NSF/ERC DSSC) Engineering Design Research Center (NSF/ERC) Enviromental Institute Gov./Uni./Ind. Consortium Center for Bladed Disk Structures Research & Technology (GUIde) Information Networking Institute (INI) Pennsylvania SEMATECH Center of Excellence for Rapid Yield Learning (PA SCOE) Program on Innovation, Technology & Economic Grtowth (PITEG) Program on International Peace and Security (IPS)
file:///H|/Common/Admin%20&%20Office%20Productivity/Planning%20Website/ira/factbook/facts95/mission.html (7 of 11)10/24/2008 2:41:41 PM
CMU History, Mission, and Organization
SRC/CMU Research Center for Computer-Aided Design (SRC/CMU-RC-CAD)
COLLEGE OF FINE ARTS Center for Building Performance and Diagnostics (CBPD) Studio for Creative Inquiry (SFCI) Building Industry Computer-Sided Design Consortium
GRADUATE SCHOOL OF INDUSTRIAL ADMINISTRATION Carnegie Bosch Institute for Applied Studies in International Management (CBIASIM) Center for the Management of Technology (CMT) Center for the Study of Public Policy (CSPP) Donald H. Jones Center for Entrepreneurship (DHJCE) Green Design Initiative Institute for Strategic Development The Center for Financial Analysis and Securities Trading
HEINZ SCHOOL Center for Economic Development (HEINZ CED) Decision Systems Research Institute (DSRI) Urban Systems Institute (USI)
HUMANITIES AND SOCIAL SCIENCES Center for Advancement of Applied Ethics (CAAE) Center for Educational Computing in English (CECE) Center for History and Policy Center for the Study of Writing (CSW) Laboratory for Computational Linguistics (LCL) Pittsburgh Center for Social History (PCSH) (w/ U. of Pittsburgh) Statistical Center for Quality Improvement (SCQI)
MELLON COLLEGE OF SCIENCE Center for Nonlinear Analysis (CNA) Pittsburgh NMR Center for Biomedical Research (NMRCBR) (w/ U. of Pittsburgh) Pittsburgh Supercomputing Center (PSC) (w/ U. of Pittsburgh and Westinghouse) Science & Technology Center for Light Microscope Imaging and Biotechnology (STC)
SCHOOL OF COMPUTER SCIENCE Center for Machine Translation (CMT) Human Computer Institute (HCI) Information Technology Center (ITC) Robotics Institute (RI) Field Robotics Center (FRC) Vision and Autonomous Systems Center (VASC)
CARNEGIE MELLON RESEARCH INSTITUTE (CMRI) Advanced Devices and Materials Group (AD&MG) High Technology Center (HTC) Materials Technology Center (MTC)
Computer, Automation and Robotics Group Computer Engineering Center (CEC)
Industry Systems Group Center for Protective Coatings(CPC) Rail Systems Center (MTC)
file:///H|/Common/Admin%20&%20Office%20Productivity/Planning%20Website/ira/factbook/facts95/mission.html (8 of 11)10/24/2008 2:41:41 PM
CMU History, Mission, and Organization
High Speed Ground Transportation Center (HSGTC)
Biotechnology Group Center for Environmental Microbiology (CEM) Biotechnology Center
Special Programs Group Center for Materials Production (CMP) Steel Structure Painting Council (Center for Surfaces & Coatings) ASTM Engine Test Monitoring Center (ASTMC) Research Center on the Materials of the Artist and Conversation (CMA&C)
SOFTWARE ENGINEERING INSTITUTE (SEI)
OTHER UNITS Hunt Institute for Botanical Documentation (HIBD) University Teaching Center (UTC)
Endowed and Named Professors By College Fall 1994
COLLEGE OF FINE ARTS Andrew Mellon Professor -- Howard Saalman (Emeritus) Bessie F. Anathan Professor in Fine Arts -- Barbara J. Anderson Dorothy L.Stubnitz Professor -- Herbert Olds Nierenberg Professor of Design -- David Smith Philip Chosky Visiting Professors of Drama -- Jose Meier, Bonnie Walker, Natalie Baker, Geoffrey Hitch T. David Fitzgibbon Chair in Architecture -- Dennis Neeley
CARNEGIE INSTITUTE OF TECHNOLOGY Alumni Chair in Environmental Science and Engineering -- Edward Rubin Buhl Professor of Electrical and Computer Engineering & Computer Science -- Daniel P. Siewiorek George Tallman Ladd Professor -- Not Filled George Westinghouse Professor of Engineering -- David Casasent Mobay Professor in Chemical Engineering (Emeritus) -- Herbert Toor Posco Professor -- Richard J. Fruehan Rudolph R. & Florence Dean Professor of Chemical Engineering -- Ignacio E. Grossmann Theodore Ahrens Professor of Engineering -- J. Fletcher Osterle U.S. Steel Professor of Metallurgical Engineering & Materials Science (Emeritus) -- Harold W. Paxton Walter J. Blenko, Sr. Professor of Environmental Engineering -- Francis C. McMichael William J. Brown Professor Mechanical Engineering -- Norman A. Chigier
GRADUATE SCHOOL OF INDUSTRIAL ADMINISTRATION David M. & Barbara A. Kirr Professor of Organization -- Gerald R. Salancik David T. & Lindsay J. Morgenthaler Professor of Entrepreneurship -- John R. Thorne Ford Foundation Distinguished Professor -- Gerald C. Meyers Heinz Chair in Graduate School of Industrial Administration -- Bennet T. McCallum IBM Chair in Information Systems at GSIA -- Gerald L. Thompson Richard M. Cyert Professor of Management and Economics -- Shyam Sunder Alumni Professor of Economics and Finance -- Sanjay Srivastava R.M. and M.S. Cyert Professor of Economics and Management -- Richard M. Cyert
COLLEGE OF HUMANITIES AND SOCIAL SCIENCES
file:///H|/Common/Admin%20&%20Office%20Productivity/Planning%20Website/ira/factbook/facts95/mission.html (9 of 11)10/24/2008 2:41:41 PM
CMU History, Mission, and Organization
Alumni University Professor of Philosophy -- Clark Glymour D. O. Hebb Professor of Psychology -- Marcel A. Just Howard Heinz Professor of the Humanities -- Peter N. Stearns Lee and Marge Gregg Professor of Psychology -- Patricia A. Carpenter Leonard J. Savage Professor of Statistics and Social Sciences -- Joseph B. Kadane Luce Professor of Technology and Social Change -- David W. Hounshell Maurice Falk Professor of Statistics & Social Sciences -- Stephen E. Fienberg Richard S. Caliguiri Professor of Urban Studies -- Joel A. Tarr Thomas Stockham Baker Professor of English and Interdisciplinary Studies -- Richard E. Young Walter VanDyke Bingham Professor of Psychology and Computer Science -- John R. Anderson
MELLON COLLEGE OF SCIENCE Alumni Professor of Biological Sciences -- Chien Ho Buhl Professor of Theoretical Physics -- Not Filled Eberly Family Chair of Biological Sciences -- Not Filled Lord Professor of Chemistry -- Not Filled Otto Stern Professor of Physics -- Robert B. Griffiths Alumni Chair of Mathematics -- Morton E. Gurtin
SCHOOL OF COMPUTER SCIENCE Alan J. Perlis Professor of Computer Science -- Not Filled U.A. & Helen Whitaker Professor of Computer Science -- Takeo Kanade Finnmecanica Professor of Computer Science -- Guy Blelloch Herbert A. Simon University Professor of Computer Science and Robotics -- Raj Reddy
H. JOHN HEINZ III SCHOOL OF PUBLIC MANAGEMENT & POLICY Henry J. Heinz, II Professor of Urban Studies -- Not Filled J. Erik Jonsson Professor of Urban Systems and Operations Research -- Alfred Blumstein
CARNEGIE MELLON UNIVERSITY Alumni University Professor of Industrial Administration and Applied Mathematics -- Egon Balas Gulf Oil Foundation Chair in Engineering -- John Anderson Herbert A. Simon University Professor of Computer Science -- D. Raj Reddy Hillman University Professor of Computer Science, Philosophy, and Mathematical Logic -- Dana S. Scott Howard M. Wilcoff University Professor of Electrical and Computer Engineering -- Ronald A. Rohrer Harry B. and James H. Higgins Professor of Economics and Finance and University Professor -- Lester B. Lave John E. Swearingen University Professor of Chemical Engineering -- Arthur W. Westerberg R.K. Mellon Professor of Computer Science -- Herbert A. Simon R.M. Trueblood University Professor of Accounting and Economics (GSIA) -- Yuji Ijiri Sun Company University Professor -- Stephen J. Fenves U.A. & Helen Whitaker University Professor of Electrical & Computer Eng. -- Stephen W.Director University Professor of Physics (Emeritus) -- Lincoln Wolfenstein University Professor of Applied Science (Emeritus) -- William W. Mullins University Professor of Composition -- Leonardo Balada University Professor of Electrical and Computer Engineering -- Angel G. Jordan University Professor of Phychology -- Robyn Dawes University Professor of Physics and Mathematics -- Robert F. Sekerka University Professor of Political Economy and Public Policy (GSIA) -- Alan Meltzer William W. Cooper University Professor -- Otto Davis
Accreditations By College and Department Fall Semester 1994
College/Department Accreditation Agency
file:///H|/Common/Admin%20&%20Office%20Productivity/Planning%20Website/ira/factbook/facts95/mission.html (10 of 11)10/24/2008 2:41:41 PM
CMU History, Mission, and Organization
CARNEGIE MELLON UNIVERSITY Middle States Association of Colleges and Schools MSA
CARNEGIE INSTITUTE OF TECHNOLOGY Accreditation Board for Engineering Technology ABET Chemical Engineering Civil Engineering Computer Engineering Electrical Engineering Engineering and Public Policy Mechanical Engineering Materials Science and Engineering
COLLEGE OF FINE ARTS
Architecture National Architectural Accrediting Board NAAB Art National Association of Schools of Art and Design Design NASAD Music National Association of Schools of Music NASM
GRADUATE SCHOOL OF INDUSTRIAL American Assembly of Collegiate Schools of Business ADMINISTRATION AACSB
MELLON COLLEGE OF SCIENCE
Chemistry American Chemical Society ACS
H. JOHN HEINZ III SCHOOL OF National Association of Schools of Public PUBLIC POLICY & MANANGEMENT Affairs and Administration NASPAA
[Top of this page] [Fact Book Main Page] [Next Section: Student Data]
Last update: 7/12/95
file:///H|/Common/Admin%20&%20Office%20Productivity/Planning%20Website/ira/factbook/facts95/mission.html (11 of 11)10/24/2008 2:41:41 PM

CMU Student Data
CMU Student Data
CONTENTS Top Fifteen Competing Schools, Based on Application Overlap 1990 to 1994. Top Fifteen Competing Schools, Based on Admittance Overlap 1990 to 1994. Enrolled First-Time Freshmen by Region and State, Fall 1994 (Graph). Undergraduate Head Count Enrollment by Region and State, Fall 1994 (Graph). Head Count Enrollment by Continent and Country of Citizenship, Fall 1994. Head Count Enrollment by Department, Level, and Status, Fall 1994. Head Count Enrollment by Department, Level, and Sex, Fall 1994. Head Count Enrollment by Department and Class, Fall 1994. Full-Time Equivalent (FTE) Enrollment by Department and Class, Fall 1994. Head Count and FTE Enrollment by College, Level, and Status, Fall 1989 to 1994. Undergraduate Head Count Enrollment by Department, Race, and Sex, Fall 1994. Graduate Head Count Enrollment by Department, Race, and Sex, Fall 1994. Distribution of Students by Housing Type, Level, and Sex, Fall 1994. Average Within-University Persistence Rate by College 4-5-6 Year, Fall 1994 (Graph). Average Within-University Persistence Rate by College 1-2-3-4 Year, Fall 1994 (Graph). Total Degrees Granted by Department and Level, 1993-94. Total Degrees Granted by College and Level, 1989-90 to 1993-94.
Top Fifteen Competing Schools Entering Freshmen 1990 to 1994 Based on Application Overlap
Rank Each Year School 1994 1993 1992 1991 1990 Cornell 1 1 1 1 1 MIT 2 3 2 2 2 U of Penn 3 2 3 3 3 Northwestern 4 6 4 7 8 Johns Hopkins 5 5 5 11 18 Princeton 6 4 6 5 4 Case Western 7 17 10 14 25
file:///H|/Common/Admin%20&%20Office%20Productivity/Planning%20Website/ira/factbook/facts95/student.html (1 of 26)10/24/2008 2:41:43 PM

CMU Student Data
Washington U 8 9 9 10 10 U. of 9 10 15 8 9 Michigan Boston U 10 11 11 9 7 RPI 11 8 7 4 6 Penn State 12 16 8 6 5 Yale 13 15 20 19 13 Duke 14 13 16 16 14 Columbia U 15 25 23 24 19
Top Fifteen Competing Schools Entering Freshmen 1990 to 1994 Based on Admittance Overlap
Rank Each Year School 1994 1993 1992 1991 1990 Cornell 1 1 1 2 1 Case Western 2 6 4 8 14 Washington U. 3 4 6 7 6 Boston U. 4 5 5 4 4 RPI 5 2 2 1 3 Northwestern 6 11 9 10 12 John Hopkins 7 9 11 15 11 U. of Penn 8 3 8 9 5 Penn State 9 7 3 3 2 U. of Michigan 10 8 10 5 10 MIT 11 14 14 11 9 Lehigh 12 10 12 16 8 New York U. 13 20 28 21 21 Tufts 14 18 18 26 16 Rutgers 15 13 12 13 15
Overlap refers to the number of applicants or admittees who applied or were admitted to Carnegie Mellon andone of the other schools listed.
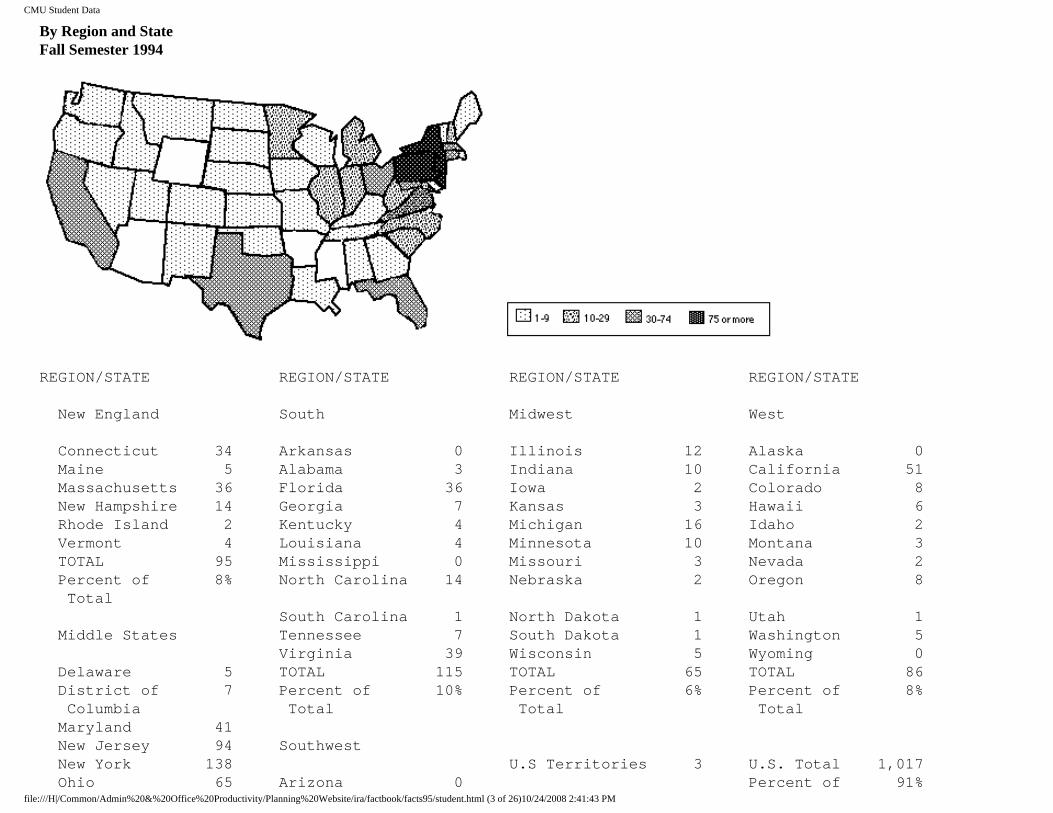
Enrolled First-Time Freshmen file:///H|/Common/Admin%20&%20Office%20Productivity/Planning%20Website/ira/factbook/facts95/student.html (2 of 26)10/24/2008 2:41:43 PM
CMU Student Data
By Region and State Fall Semester 1994
REGION/STATE REGION/STATE REGION/STATE REGION/STATE New England South Midwest West Connecticut 34 Arkansas 0 Illinois 12 Alaska 0 Maine 5 Alabama 3 Indiana 10 California 51 Massachusetts 36 Florida 36 Iowa 2 Colorado 8 New Hampshire 14 Georgia 7 Kansas 3 Hawaii 6 Rhode Island 2 Kentucky 4 Michigan 16 Idaho 2 Vermont 4 Louisiana 4 Minnesota 10 Montana 3 TOTAL 95 Mississippi 0 Missouri 3 Nevada 2 Percent of 8% North Carolina 14 Nebraska 2 Oregon 8 Total South Carolina 1 North Dakota 1 Utah 1 Middle States Tennessee 7 South Dakota 1 Washington 5 Virginia 39 Wisconsin 5 Wyoming 0 Delaware 5 TOTAL 115 TOTAL 65 TOTAL 86 District of 7 Percent of 10% Percent of 6% Percent of 8% Columbia Total Total Total Maryland 41 New Jersey 94 Southwest New York 138 U.S Territories 3 U.S. Total 1,017 Ohio 65 Arizona 0 Percent of 91%
file:///H|/Common/Admin%20&%20Office%20Productivity/Planning%20Website/ira/factbook/facts95/student.html (3 of 26)10/24/2008 2:41:43 PM
CMU Student Data
Pennsylvania 261 New Mexico 1 Total Total West Virginia 10 Oklahoma 1 Foreign 103 TOTAL 621 Texas 30 Unknown 0 Countries Percent of 55% TOTAL 32 Percent of 9% Total Percent of 3% Total TOTAL 1,120
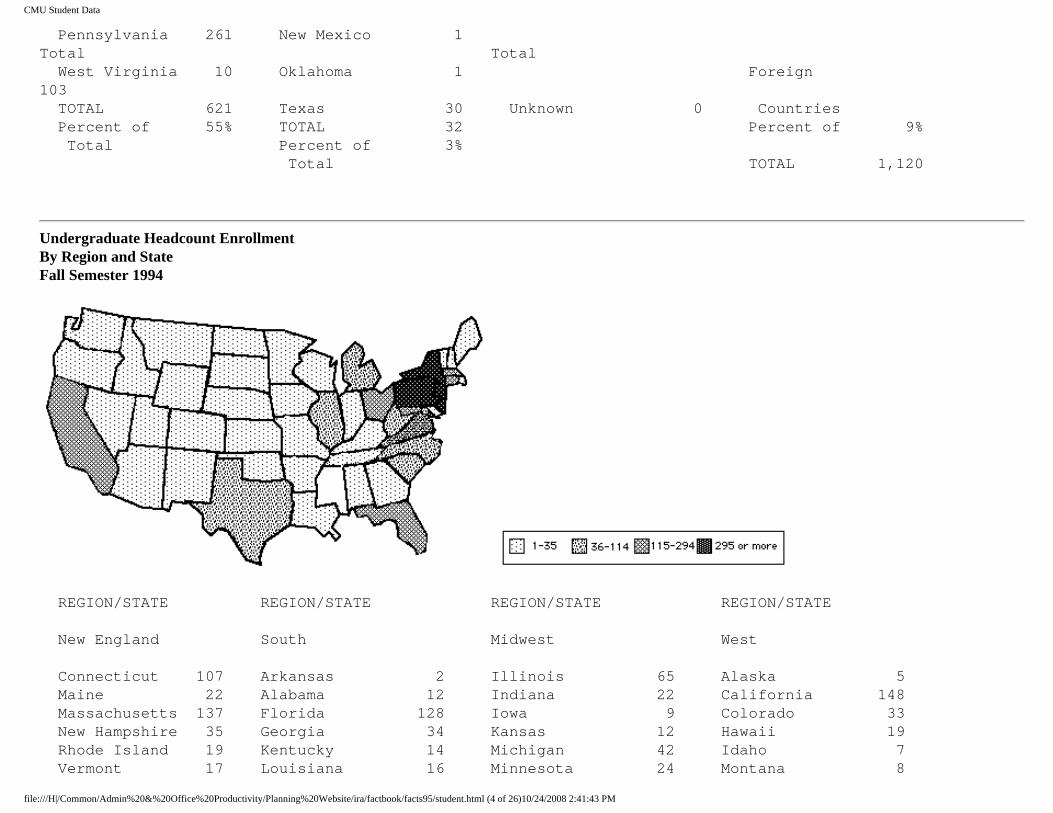
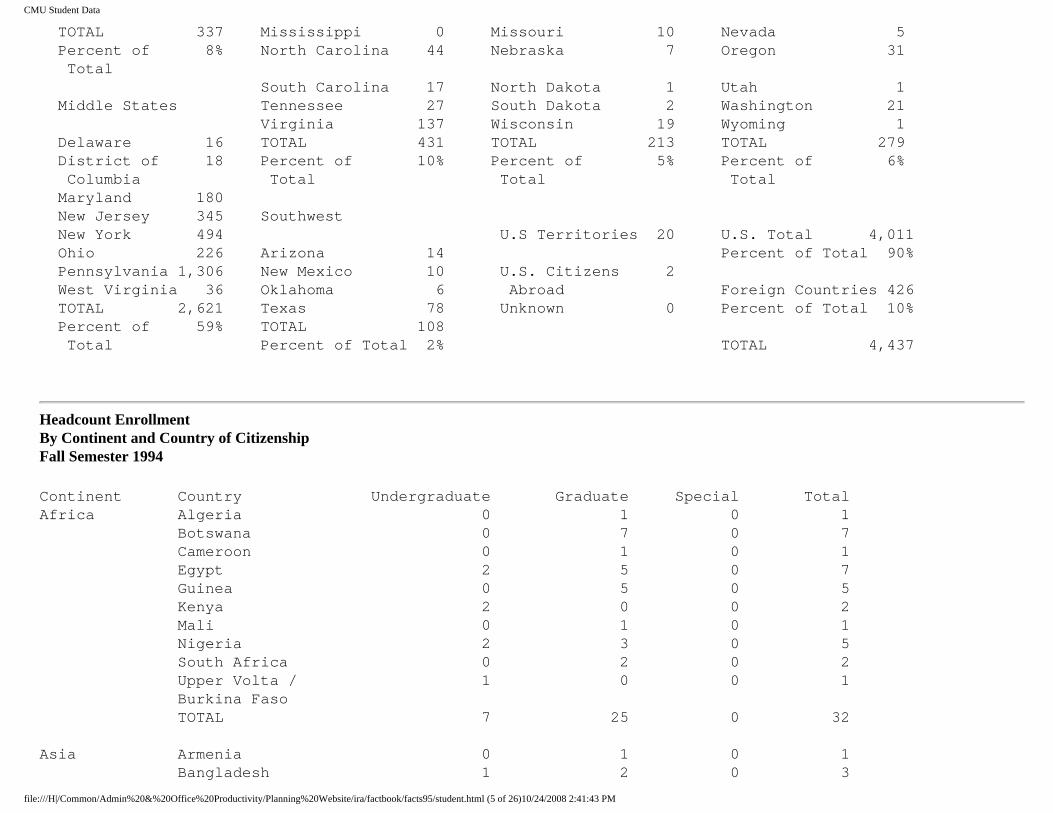
Undergraduate Headcount Enrollment By Region and State Fall Semester 1994
REGION/STATE REGION/STATE REGION/STATE REGION/STATE New England South Midwest West Connecticut 107 Arkansas 2 Illinois 65 Alaska 5 Maine 22 Alabama 12 Indiana 22 California 148 Massachusetts 137 Florida 128 Iowa 9 Colorado 33 New Hampshire 35 Georgia 34 Kansas 12 Hawaii 19 Rhode Island 19 Kentucky 14 Michigan 42 Idaho 7 Vermont 17 Louisiana 16 Minnesota 24 Montana 8
file:///H|/Common/Admin%20&%20Office%20Productivity/Planning%20Website/ira/factbook/facts95/student.html (4 of 26)10/24/2008 2:41:43 PM
CMU Student Data
TOTAL 337 Mississippi 0 Missouri 10 Nevada 5 Percent of 8% North Carolina 44 Nebraska 7 Oregon 31 Total South Carolina 17 North Dakota 1 Utah 1 Middle States Tennessee 27 South Dakota 2 Washington 21 Virginia 137 Wisconsin 19 Wyoming 1 Delaware 16 TOTAL 431 TOTAL 213 TOTAL 279 District of 18 Percent of 10% Percent of 5% Percent of 6% Columbia Total Total Total Maryland 180 New Jersey 345 Southwest New York 494 U.S Territories 20 U.S. Total 4,011 Ohio 226 Arizona 14 Percent of Total 90% Pennsylvania 1,306 New Mexico 10 U.S. Citizens 2 West Virginia 36 Oklahoma 6 Abroad Foreign Countries 426 TOTAL 2,621 Texas 78 Unknown 0 Percent of Total 10% Percent of 59% TOTAL 108 Total Percent of Total 2% TOTAL 4,437
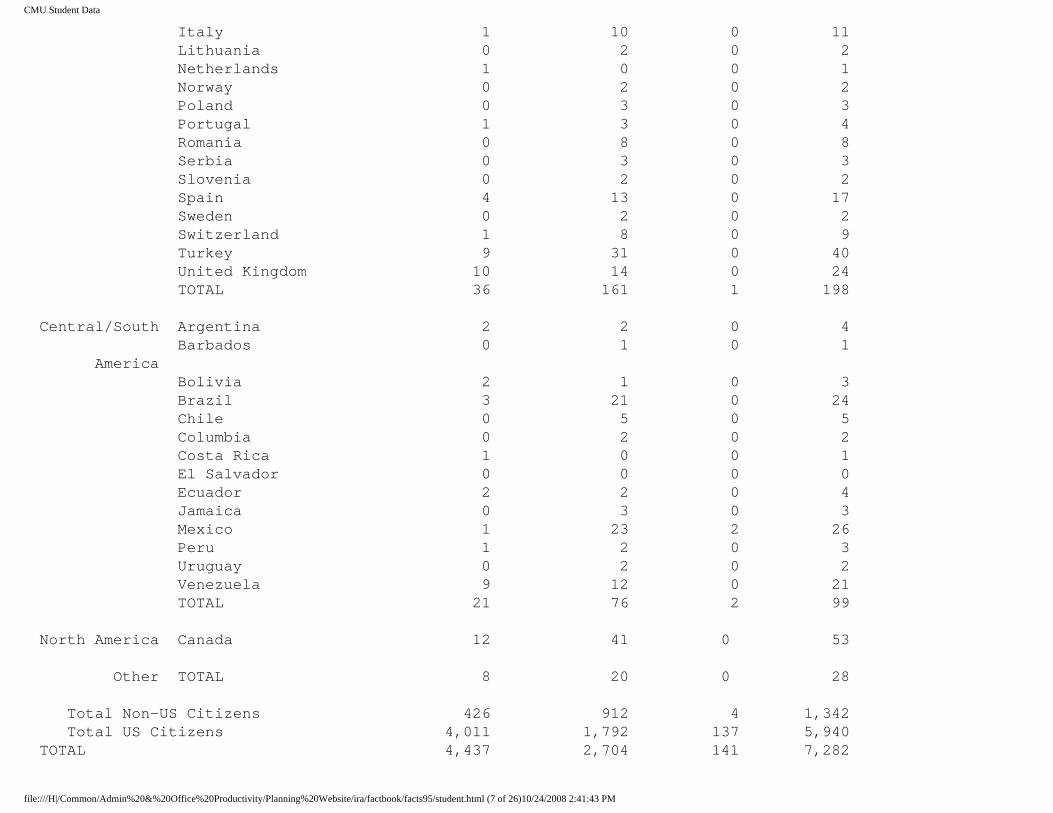
Headcount Enrollment By Continent and Country of Citizenship Fall Semester 1994
Continent Country Undergraduate Graduate Special Total Africa Algeria 0 1 0 1 Botswana 0 7 0 7 Cameroon 0 1 0 1 Egypt 2 5 0 7 Guinea 0 5 0 5 Kenya 2 0 0 2 Mali 0 1 0 1 Nigeria 2 3 0 5 South Africa 0 2 0 2 Upper Volta / 1 0 0 1 Burkina Faso TOTAL 7 25 0 32 Asia Armenia 0 1 0 1 Bangladesh 1 2 0 3
file:///H|/Common/Admin%20&%20Office%20Productivity/Planning%20Website/ira/factbook/facts95/student.html (5 of 26)10/24/2008 2:41:43 PM

CMU Student Data
Burma 0 1 0 1 China (PRC) 3 102 0 105 China (Taiwan) 31 86 1 118 Cyprus 0 3 0 3 Hong Kong 42 6 0 48 India 39 154 0 193 Indonesia 23 25 0 48 Iran 0 2 0 2 Israel 1 10 0 11 Japan 38 72 0 110 Kuwait 2 0 0 2 Malaysia 33 6 0 39 Maldives 1 0 0 1 Korea, Republic 48 42 0 90 Oman 1 6 0 7 Pakistan 11 5 0 16 Philippines 5 7 0 12 Russia 0 11 0 11 Ukraine 0 2 0 2 Saudi Arabia 2 6 0 8 Singapore 33 11 0 44 Sri Lanka 1 7 0 8 Thailand 26 16 0 42 TOTAL 341 583 1 925 Australia Australia 1 6 0 7 TOTAL 1 6 0 7 Europe Austria 6 1 0 7 Belgium 0 5 0 5 Bulgaria 0 3 0 3 Czech Republic 0 1 0 1 Denmark 0 4 0 4 Estonia 0 2 0 2 Finland 0 3 0 3 France 1 10 0 11 Germany 1 17 1 19 Greece 0 8 0 8 Hungary 1 1 0 2 Ireland 0 5 0 5
file:///H|/Common/Admin%20&%20Office%20Productivity/Planning%20Website/ira/factbook/facts95/student.html (6 of 26)10/24/2008 2:41:43 PM
CMU Student Data
Italy 1 10 0 11 Lithuania 0 2 0 2 Netherlands 1 0 0 1 Norway 0 2 0 2 Poland 0 3 0 3 Portugal 1 3 0 4 Romania 0 8 0 8 Serbia 0 3 0 3 Slovenia 0 2 0 2 Spain 4 13 0 17 Sweden 0 2 0 2 Switzerland 1 8 0 9 Turkey 9 31 0 40 United Kingdom 10 14 0 24 TOTAL 36 161 1 198 Central/South Argentina 2 2 0 4 Barbados 0 1 0 1 America Bolivia 2 1 0 3 Brazil 3 21 0 24 Chile 0 5 0 5 Columbia 0 2 0 2 Costa Rica 1 0 0 1 El Salvador 0 0 0 0 Ecuador 2 2 0 4 Jamaica 0 3 0 3 Mexico 1 23 2 26 Peru 1 2 0 3 Uruguay 0 2 0 2 Venezuela 9 12 0 21 TOTAL 21 76 2 99 North America Canada 12 41 0 53 Other TOTAL 8 20 0 28 Total Non-US Citizens 426 912 4 1,342 Total US Citizens 4,011 1,792 137 5,940 TOTAL 4,437 2,704 141 7,282
file:///H|/Common/Admin%20&%20Office%20Productivity/Planning%20Website/ira/factbook/facts95/student.html (7 of 26)10/24/2008 2:41:43 PM
CMU Student Data
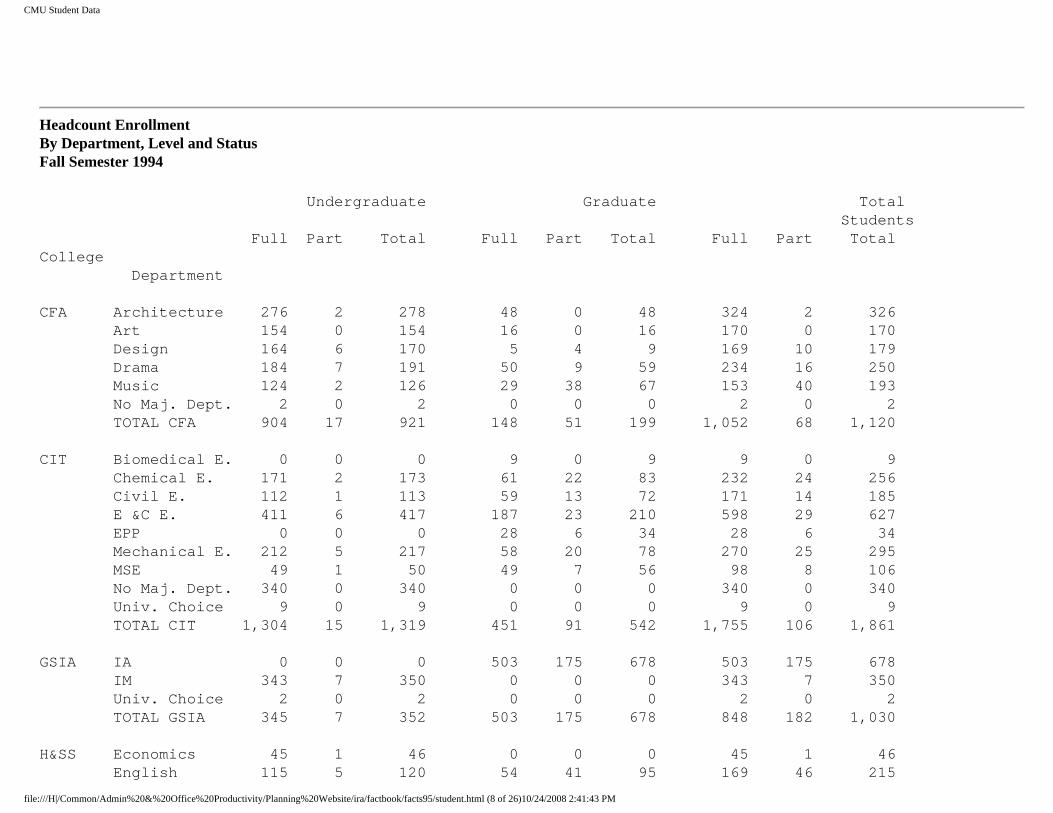
Headcount Enrollment By Department, Level and Status Fall Semester 1994
Undergraduate Graduate Total Students Full Part Total Full Part Total Full Part Total College Department CFA Architecture 276 2 278 48 0 48 324 2 326 Art 154 0 154 16 0 16 170 0 170 Design 164 6 170 5 4 9 169 10 179 Drama 184 7 191 50 9 59 234 16 250 Music 124 2 126 29 38 67 153 40 193 No Maj. Dept. 2 0 2 0 0 0 2 0 2 TOTAL CFA 904 17 921 148 51 199 1,052 68 1,120 CIT Biomedical E. 0 0 0 9 0 9 9 0 9 Chemical E. 171 2 173 61 22 83 232 24 256 Civil E. 112 1 113 59 13 72 171 14 185 E &C E. 411 6 417 187 23 210 598 29 627 EPP 0 0 0 28 6 34 28 6 34 Mechanical E. 212 5 217 58 20 78 270 25 295 MSE 49 1 50 49 7 56 98 8 106 No Maj. Dept. 340 0 340 0 0 0 340 0 340 Univ. Choice 9 0 9 0 0 0 9 0 9 TOTAL CIT 1,304 15 1,319 451 91 542 1,755 106 1,861 GSIA IA 0 0 0 503 175 678 503 175 678 IM 343 7 350 0 0 0 343 7 350 Univ. Choice 2 0 2 0 0 0 2 0 2 TOTAL GSIA 345 7 352 503 175 678 848 182 1,030 H&SS Economics 45 1 46 0 0 0 45 1 46 English 115 5 120 54 41 95 169 46 215
file:///H|/Common/Admin%20&%20Office%20Productivity/Planning%20Website/ira/factbook/facts95/student.html (8 of 26)10/24/2008 2:41:43 PM
CMU Student Data
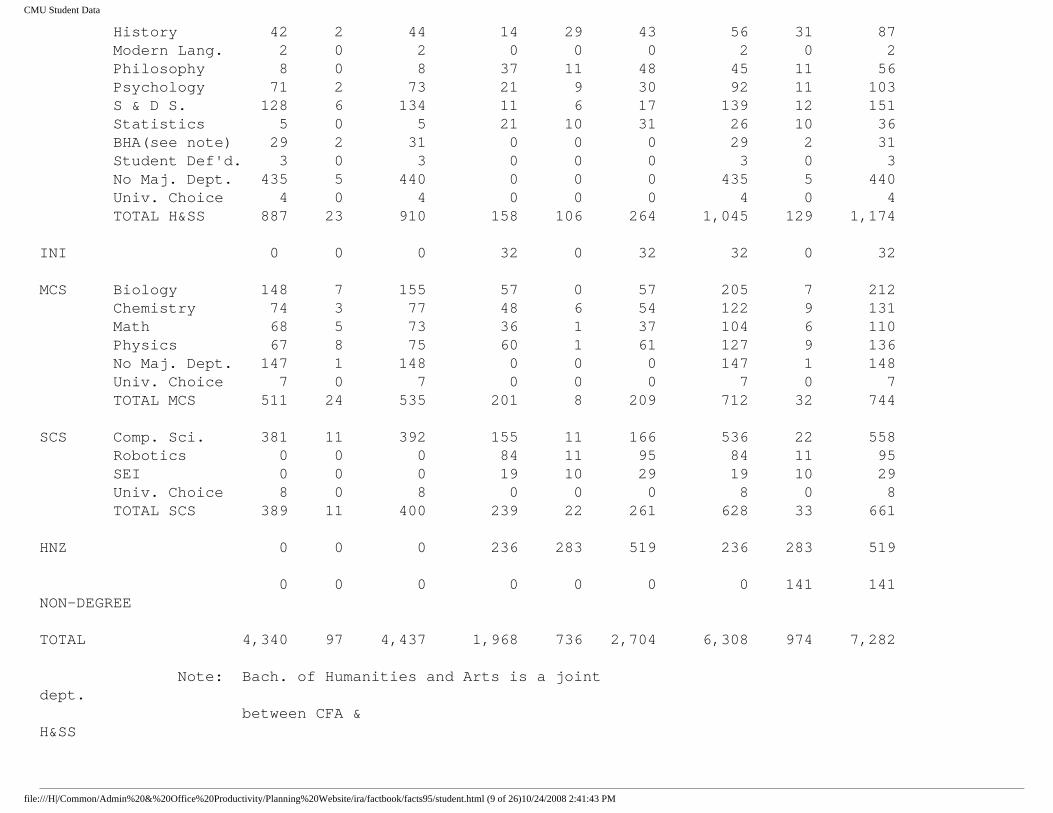
History 42 2 44 14 29 43 56 31 87 Modern Lang. 2 0 2 0 0 0 2 0 2 Philosophy 8 0 8 37 11 48 45 11 56 Psychology 71 2 73 21 9 30 92 11 103 S & D S. 128 6 134 11 6 17 139 12 151 Statistics 5 0 5 21 10 31 26 10 36 BHA(see note) 29 2 31 0 0 0 29 2 31 Student Def'd. 3 0 3 0 0 0 3 0 3 No Maj. Dept. 435 5 440 0 0 0 435 5 440 Univ. Choice 4 0 4 0 0 0 4 0 4 TOTAL H&SS 887 23 910 158 106 264 1,045 129 1,174 INI 0 0 0 32 0 32 32 0 32 MCS Biology 148 7 155 57 0 57 205 7 212 Chemistry 74 3 77 48 6 54 122 9 131 Math 68 5 73 36 1 37 104 6 110 Physics 67 8 75 60 1 61 127 9 136 No Maj. Dept. 147 1 148 0 0 0 147 1 148 Univ. Choice 7 0 7 0 0 0 7 0 7 TOTAL MCS 511 24 535 201 8 209 712 32 744 SCS Comp. Sci. 381 11 392 155 11 166 536 22 558 Robotics 0 0 0 84 11 95 84 11 95 SEI 0 0 0 19 10 29 19 10 29 Univ. Choice 8 0 8 0 0 0 8 0 8 TOTAL SCS 389 11 400 239 22 261 628 33 661 HNZ 0 0 0 236 283 519 236 283 519 0 0 0 0 0 0 0 141 141 NON-DEGREE TOTAL 4,340 97 4,437 1,968 736 2,704 6,308 974 7,282 Note: Bach. of Humanities and Arts is a joint dept. between CFA & H&SS
file:///H|/Common/Admin%20&%20Office%20Productivity/Planning%20Website/ira/factbook/facts95/student.html (9 of 26)10/24/2008 2:41:43 PM
CMU Student Data
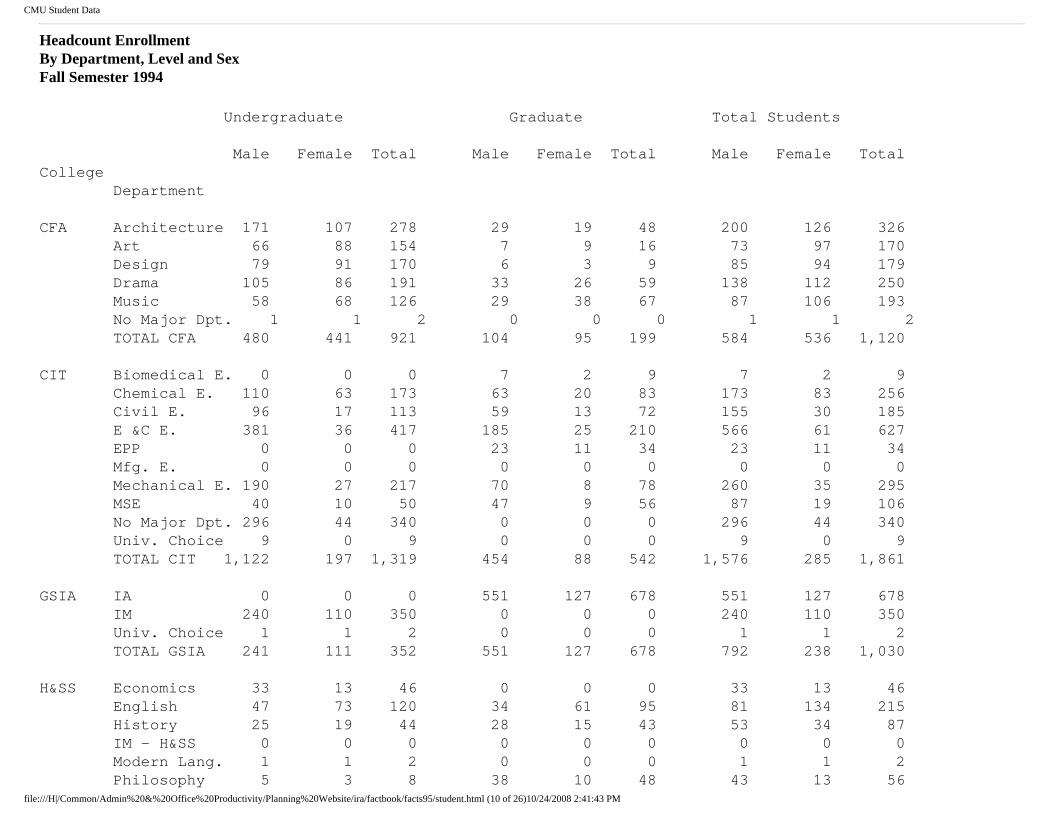
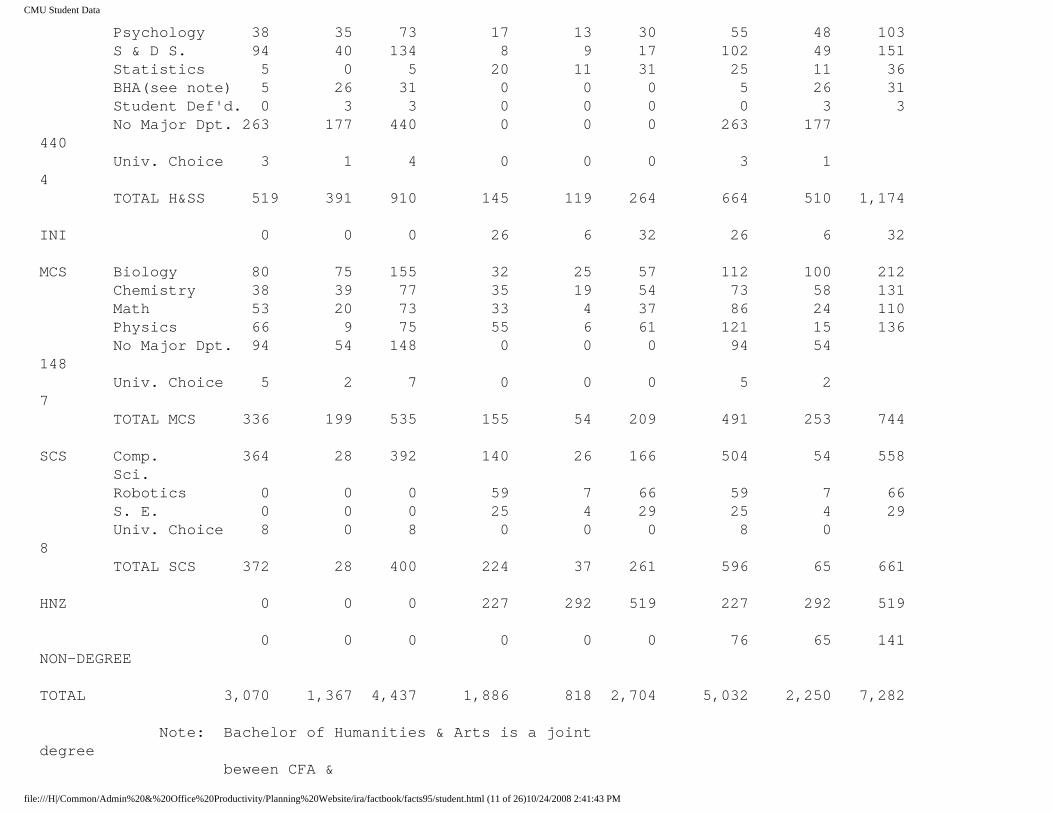
Headcount Enrollment By Department, Level and Sex Fall Semester 1994
Undergraduate Graduate Total Students Male Female Total Male Female Total Male Female Total College Department CFA Architecture 171 107 278 29 19 48 200 126 326 Art 66 88 154 7 9 16 73 97 170 Design 79 91 170 6 3 9 85 94 179 Drama 105 86 191 33 26 59 138 112 250 Music 58 68 126 29 38 67 87 106 193 No Major Dpt. 1 1 2 0 0 0 1 1 2 TOTAL CFA 480 441 921 104 95 199 584 536 1,120 CIT Biomedical E. 0 0 0 7 2 9 7 2 9 Chemical E. 110 63 173 63 20 83 173 83 256 Civil E. 96 17 113 59 13 72 155 30 185 E &C E. 381 36 417 185 25 210 566 61 627 EPP 0 0 0 23 11 34 23 11 34 Mfg. E. 0 0 0 0 0 0 0 0 0 Mechanical E. 190 27 217 70 8 78 260 35 295 MSE 40 10 50 47 9 56 87 19 106 No Major Dpt. 296 44 340 0 0 0 296 44 340 Univ. Choice 9 0 9 0 0 0 9 0 9 TOTAL CIT 1,122 197 1,319 454 88 542 1,576 285 1,861 GSIA IA 0 0 0 551 127 678 551 127 678 IM 240 110 350 0 0 0 240 110 350 Univ. Choice 1 1 2 0 0 0 1 1 2 TOTAL GSIA 241 111 352 551 127 678 792 238 1,030 H&SS Economics 33 13 46 0 0 0 33 13 46 English 47 73 120 34 61 95 81 134 215 History 25 19 44 28 15 43 53 34 87 IM - H&SS 0 0 0 0 0 0 0 0 0 Modern Lang. 1 1 2 0 0 0 1 1 2 Philosophy 5 3 8 38 10 48 43 13 56
file:///H|/Common/Admin%20&%20Office%20Productivity/Planning%20Website/ira/factbook/facts95/student.html (10 of 26)10/24/2008 2:41:43 PM
CMU Student Data
Psychology 38 35 73 17 13 30 55 48 103 S & D S. 94 40 134 8 9 17 102 49 151 Statistics 5 0 5 20 11 31 25 11 36 BHA(see note) 5 26 31 0 0 0 5 26 31 Student Def'd. 0 3 3 0 0 0 0 3 3 No Major Dpt. 263 177 440 0 0 0 263 177 440 Univ. Choice 3 1 4 0 0 0 3 1 4 TOTAL H&SS 519 391 910 145 119 264 664 510 1,174 INI 0 0 0 26 6 32 26 6 32 MCS Biology 80 75 155 32 25 57 112 100 212 Chemistry 38 39 77 35 19 54 73 58 131 Math 53 20 73 33 4 37 86 24 110 Physics 66 9 75 55 6 61 121 15 136 No Major Dpt. 94 54 148 0 0 0 94 54 148 Univ. Choice 5 2 7 0 0 0 5 2 7 TOTAL MCS 336 199 535 155 54 209 491 253 744 SCS Comp. 364 28 392 140 26 166 504 54 558 Sci. Robotics 0 0 0 59 7 66 59 7 66 S. E. 0 0 0 25 4 29 25 4 29 Univ. Choice 8 0 8 0 0 0 8 0 8 TOTAL SCS 372 28 400 224 37 261 596 65 661 HNZ 0 0 0 227 292 519 227 292 519 0 0 0 0 0 0 76 65 141 NON-DEGREE TOTAL 3,070 1,367 4,437 1,886 818 2,704 5,032 2,250 7,282 Note: Bachelor of Humanities & Arts is a joint degree beween CFA &
file:///H|/Common/Admin%20&%20Office%20Productivity/Planning%20Website/ira/factbook/facts95/student.html (11 of 26)10/24/2008 2:41:43 PM
CMU Student Data
H&SS
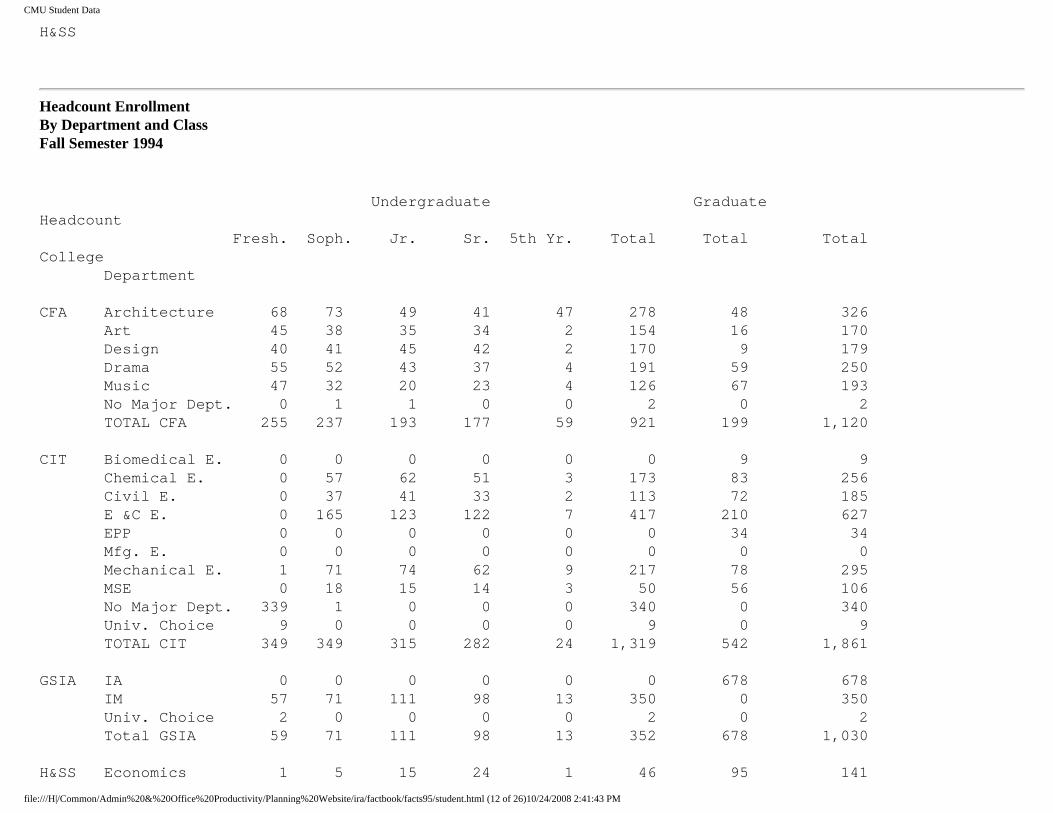
Headcount Enrollment By Department and Class Fall Semester 1994
Undergraduate Graduate Headcount Fresh. Soph. Jr. Sr. 5th Yr. Total Total Total College Department CFA Architecture 68 73 49 41 47 278 48 326 Art 45 38 35 34 2 154 16 170 Design 40 41 45 42 2 170 9 179 Drama 55 52 43 37 4 191 59 250 Music 47 32 20 23 4 126 67 193 No Major Dept. 0 1 1 0 0 2 0 2 TOTAL CFA 255 237 193 177 59 921 199 1,120 CIT Biomedical E. 0 0 0 0 0 0 9 9 Chemical E. 0 57 62 51 3 173 83 256 Civil E. 0 37 41 33 2 113 72 185 E &C E. 0 165 123 122 7 417 210 627 EPP 0 0 0 0 0 0 34 34 Mfg. E. 0 0 0 0 0 0 0 0 Mechanical E. 1 71 74 62 9 217 78 295 MSE 0 18 15 14 3 50 56 106 No Major Dept. 339 1 0 0 0 340 0 340 Univ. Choice 9 0 0 0 0 9 0 9 TOTAL CIT 349 349 315 282 24 1,319 542 1,861 GSIA IA 0 0 0 0 0 0 678 678 IM 57 71 111 98 13 350 0 350 Univ. Choice 2 0 0 0 0 2 0 2 Total GSIA 59 71 111 98 13 352 678 1,030 H&SS Economics 1 5 15 24 1 46 95 141
file:///H|/Common/Admin%20&%20Office%20Productivity/Planning%20Website/ira/factbook/facts95/student.html (12 of 26)10/24/2008 2:41:43 PM

CMU Student Data
English 0 28 48 37 7 120 0 120 History 0 6 17 17 4 44 43 87 IM-H&SS 0 0 0 0 0 0 0 0 Modern Lang. 0 1 0 0 1 2 0 2 Philosophy 0 2 2 3 1 8 48 56 Psychology 0 6 30 33 4 73 30 103 S & D S. 0 22 57 46 9 134 17 151 Statistics 0 1 0 4 0 5 31 36 BHA (see note) 12 10 7 2 31 0 31 Student Def'd. 0 0 0 2 1 3 0 3 No Major Dept. 256 158 22 4 0 440 0 440 Univ. Choice 4 0 0 0 0 4 0 4 TOTAL H&SS 273 239 198 172 28 910 264 1,174 INI 0 0 0 0 0 32 32 MCS Biology 0 68 38 44 5 155 57 212 Chemistry 0 31 28 16 2 77 54 131 Math 0 21 24 24 4 73 37 110 Physics 1 25 24 24 1 75 61 136 No Major Dept. 140 5 1 2 0 148 0 148 Univ. Choice 7 0 0 0 0 7 0 7 TOTAL MCS 148 150 115 110 12 535 209 744 SCS Comp. Sci. 98 121 73 89 11 392 166 558 Robotics 0 0 0 0 0 0 95 95 Univ. Choice 8 0 0 0 0 8 0 8 TOTAL SCS 106 121 73 89 11 400 261 661 HNZ 0 0 0 0 0 0 519 519 NON-DEGREE 0 0 0 0 0 0 0 141 TOTAL 1,190 1,167 1,005 928 147 4,437 2,704 7,282 Note: Bachelor of Humanities & Arts is a joint degree between CFA & H&SS
file:///H|/Common/Admin%20&%20Office%20Productivity/Planning%20Website/ira/factbook/facts95/student.html (13 of 26)10/24/2008 2:41:43 PM
CMU Student Data
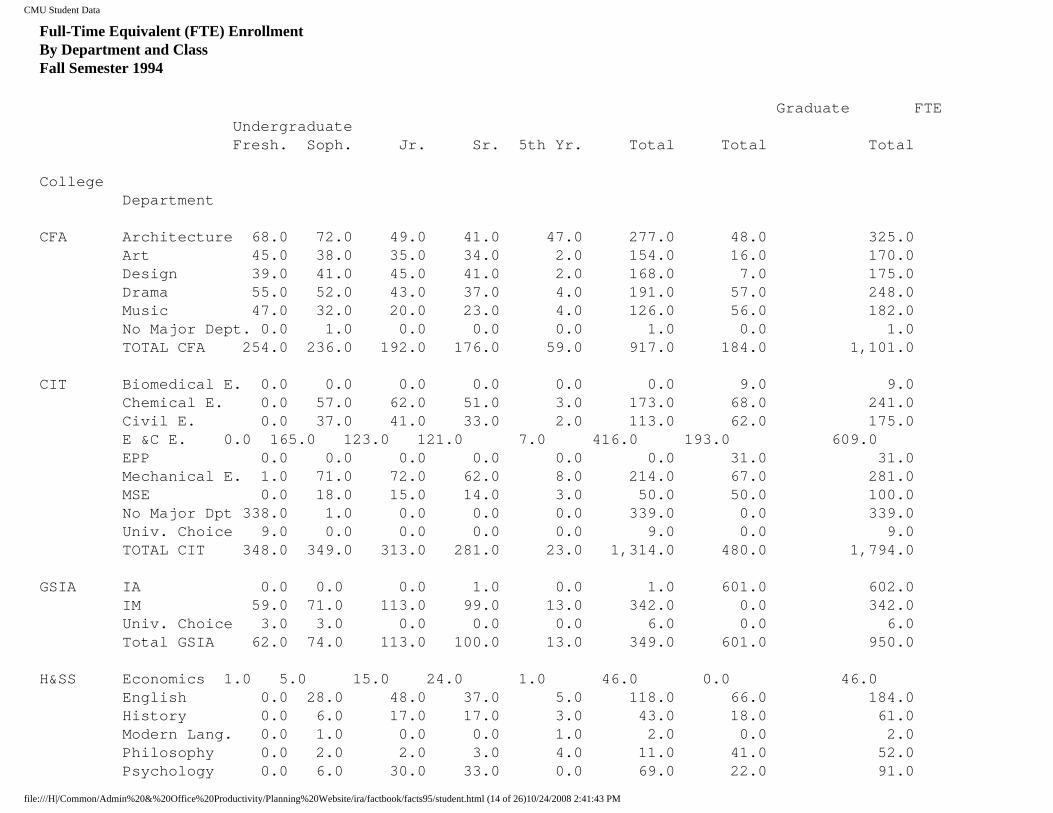
Full-Time Equivalent (FTE) Enrollment By Department and Class Fall Semester 1994
Graduate FTE Undergraduate Fresh. Soph. Jr. Sr. 5th Yr. Total Total Total College Department CFA Architecture 68.0 72.0 49.0 41.0 47.0 277.0 48.0 325.0 Art 45.0 38.0 35.0 34.0 2.0 154.0 16.0 170.0 Design 39.0 41.0 45.0 41.0 2.0 168.0 7.0 175.0 Drama 55.0 52.0 43.0 37.0 4.0 191.0 57.0 248.0 Music 47.0 32.0 20.0 23.0 4.0 126.0 56.0 182.0 No Major Dept. 0.0 1.0 0.0 0.0 0.0 1.0 0.0 1.0 TOTAL CFA 254.0 236.0 192.0 176.0 59.0 917.0 184.0 1,101.0 CIT Biomedical E. 0.0 0.0 0.0 0.0 0.0 0.0 9.0 9.0 Chemical E. 0.0 57.0 62.0 51.0 3.0 173.0 68.0 241.0 Civil E. 0.0 37.0 41.0 33.0 2.0 113.0 62.0 175.0 E &C E. 0.0 165.0 123.0 121.0 7.0 416.0 193.0 609.0 EPP 0.0 0.0 0.0 0.0 0.0 0.0 31.0 31.0 Mechanical E. 1.0 71.0 72.0 62.0 8.0 214.0 67.0 281.0 MSE 0.0 18.0 15.0 14.0 3.0 50.0 50.0 100.0 No Major Dpt 338.0 1.0 0.0 0.0 0.0 339.0 0.0 339.0 Univ. Choice 9.0 0.0 0.0 0.0 0.0 9.0 0.0 9.0 TOTAL CIT 348.0 349.0 313.0 281.0 23.0 1,314.0 480.0 1,794.0 GSIA IA 0.0 0.0 0.0 1.0 0.0 1.0 601.0 602.0 IM 59.0 71.0 113.0 99.0 13.0 342.0 0.0 342.0 Univ. Choice 3.0 3.0 0.0 0.0 0.0 6.0 0.0 6.0 Total GSIA 62.0 74.0 113.0 100.0 13.0 349.0 601.0 950.0 H&SS Economics 1.0 5.0 15.0 24.0 1.0 46.0 0.0 46.0 English 0.0 28.0 48.0 37.0 5.0 118.0 66.0 184.0 History 0.0 6.0 17.0 17.0 3.0 43.0 18.0 61.0 Modern Lang. 0.0 1.0 0.0 0.0 1.0 2.0 0.0 2.0 Philosophy 0.0 2.0 2.0 3.0 4.0 11.0 41.0 52.0 Psychology 0.0 6.0 30.0 33.0 0.0 69.0 22.0 91.0
file:///H|/Common/Admin%20&%20Office%20Productivity/Planning%20Website/ira/factbook/facts95/student.html (14 of 26)10/24/2008 2:41:43 PM

CMU Student Data
S & D S. 0.0 22.0 57.0 45.0 8.0 132.0 12.0 144.0 Statistics 0.0 1.0 0.0 4.0 0.0 5.0 23.0 28.0 Student Def'd 0.0 0.0 0.0 2.0 0.0 2.0 0.0 2.0 No Major Dpt 256.0 157.0 22.0 3.0 0.0 438.0 0.0 438.0 Univ. Choice 4.0 0.0 0.0 0.0 0.0 4.0 0.0 4.0 TOTAL H&SS261.0 228.0 191.0 168.0 22.0 870.0 182.0 1,052.0 INI 0.0 0.0 0.0 0.0 0.0 0.0 32.0 32.0 MCS Biology 0.0 68.0 38.0 42.0 3.0 151.0 57.0 208.0 Chemistry 0.0 31.0 27.0 16.0 2.0 76.0 50.0 126.0 Math 0.0 21.0 24.0 23.0 2.0 70.0 36.0 106.0 Physics 1.0 25.0 24.0 21.0 1.0 72.0 60.0 132.0 No Major Dpt 138.0 5.0 1.0 2.0 0.0 146.0 0.0 146.0 Univ. Choice 7.0 0.0 0.0 0.0 0.0 7.0 0.0 7.0 TOTAL MCS 146.0 150.0 114.0 104.0 8.0 522.0 203.0 725.0 SCS Comp. Sci. 99.0 124.0 75.0 89.0 9.0 396.0 159.0 555.0 Robotics 0.0 0.0 0.0 0.0 0.0 0.0 25.0 25.0 Univ. Choice 9.0 0.0 0.0 0.0 0.0 9.0 0.0 0.0 TOTAL SCS 108.0 124.0 75.0 89.0 9.0 396.0 184.0 580.0 HNZ 0.0 0.0 0.0 0.0 0.0 0.0 323.0 323.0 NON-DEGREE 0.0 0.0 0.0 0.0 0.0 0.0 0.0 68.5 TOTAL 1,179.0 1,161.0 998.0 918.0 134.0 4,368.0 2,189.0 6,625.5
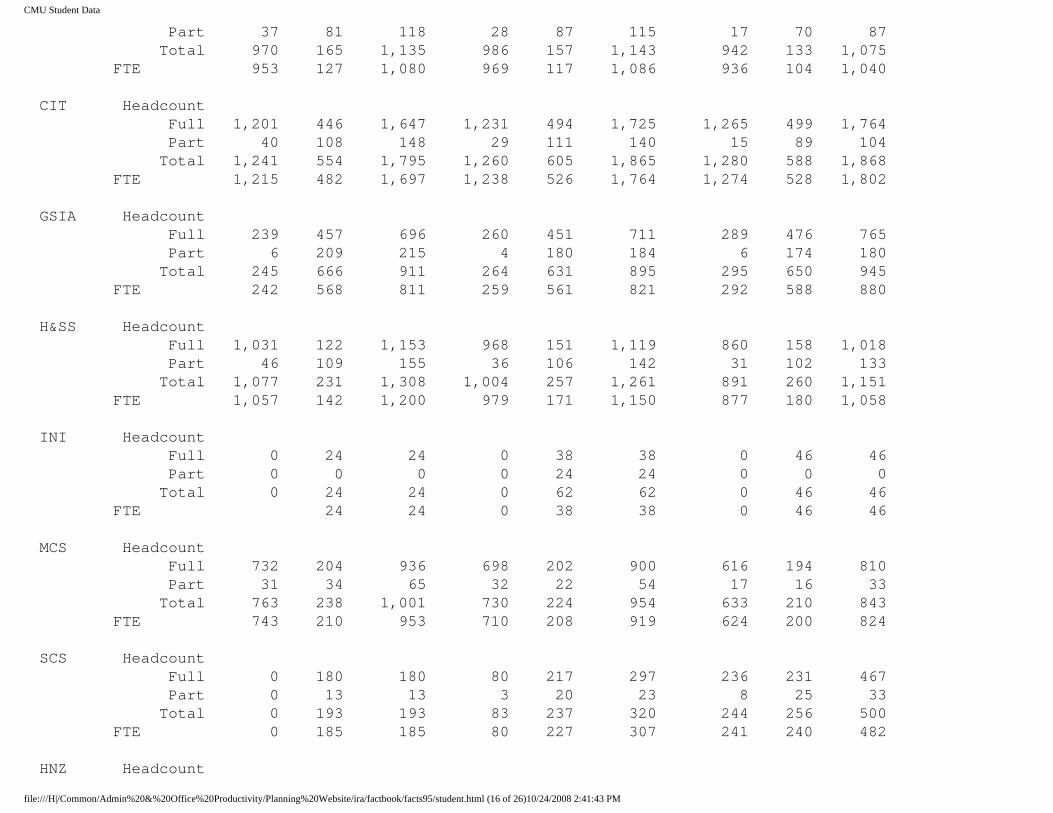
Headcount and FTE Enrollment By College, Level, and Status Fall Semesters 1989 to 1994
1989 1990 1991 College Undg. Grad. Total Undg. Grad. Total Undg. Grad. Total Status CFA Headcount Full 933 84 1,017 958 70 1,028 925 63 988
file:///H|/Common/Admin%20&%20Office%20Productivity/Planning%20Website/ira/factbook/facts95/student.html (15 of 26)10/24/2008 2:41:43 PM
CMU Student Data
Part 37 81 118 28 87 115 17 70 87 Total 970 165 1,135 986 157 1,143 942 133 1,075 FTE 953 127 1,080 969 117 1,086 936 104 1,040 CIT Headcount Full 1,201 446 1,647 1,231 494 1,725 1,265 499 1,764 Part 40 108 148 29 111 140 15 89 104 Total 1,241 554 1,795 1,260 605 1,865 1,280 588 1,868 FTE 1,215 482 1,697 1,238 526 1,764 1,274 528 1,802 GSIA Headcount Full 239 457 696 260 451 711 289 476 765 Part 6 209 215 4 180 184 6 174 180 Total 245 666 911 264 631 895 295 650 945 FTE 242 568 811 259 561 821 292 588 880 H&SS Headcount Full 1,031 122 1,153 968 151 1,119 860 158 1,018 Part 46 109 155 36 106 142 31 102 133 Total 1,077 231 1,308 1,004 257 1,261 891 260 1,151 FTE 1,057 142 1,200 979 171 1,150 877 180 1,058 INI Headcount Full 0 24 24 0 38 38 0 46 46 Part 0 0 0 0 24 24 0 0 0 Total 0 24 24 0 62 62 0 46 46 FTE 24 24 0 38 38 0 46 46 MCS Headcount Full 732 204 936 698 202 900 616 194 810 Part 31 34 65 32 22 54 17 16 33 Total 763 238 1,001 730 224 954 633 210 843 FTE 743 210 953 710 208 919 624 200 824 SCS Headcount Full 0 180 180 80 217 297 236 231 467 Part 0 13 13 3 20 23 8 25 33 Total 0 193 193 83 237 320 244 256 500 FTE 0 185 185 80 227 307 241 240 482 HNZ Headcount
file:///H|/Common/Admin%20&%20Office%20Productivity/Planning%20Website/ira/factbook/facts95/student.html (16 of 26)10/24/2008 2:41:43 PM
CMU Student Data
Full 0 226 226 0 226 226 0 231 231 Part 0 291 291 0 309 309 0 338 338 Total 0 517 517 0 535 535 0 569 569 FTE 0 312 312 0 322 322 0 339 339 TOTAL* Headcount Full 4,136 1,743 5,887 4,195 1,849 6,047 4,191 1,898 6,095 Part 160 845 1,203 132 859 1,169 94 814 1,053 Total 4,296 2,588 7,090 4,327 2,708 7,216 4,285 2,712 7,148 FTE 4,212 2,053 6,345 4,237 2,172 6,469 4,246 2,227 6,526 *Total includes Non-Degree Headcount and FTE Enrollment
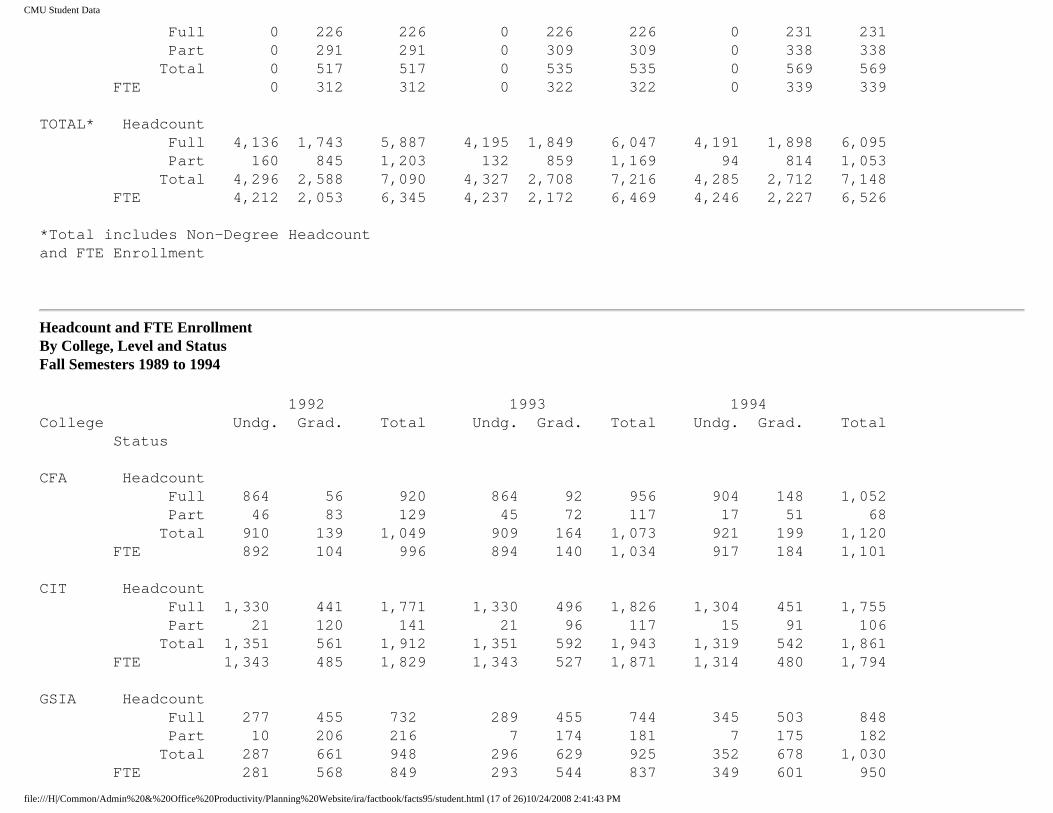
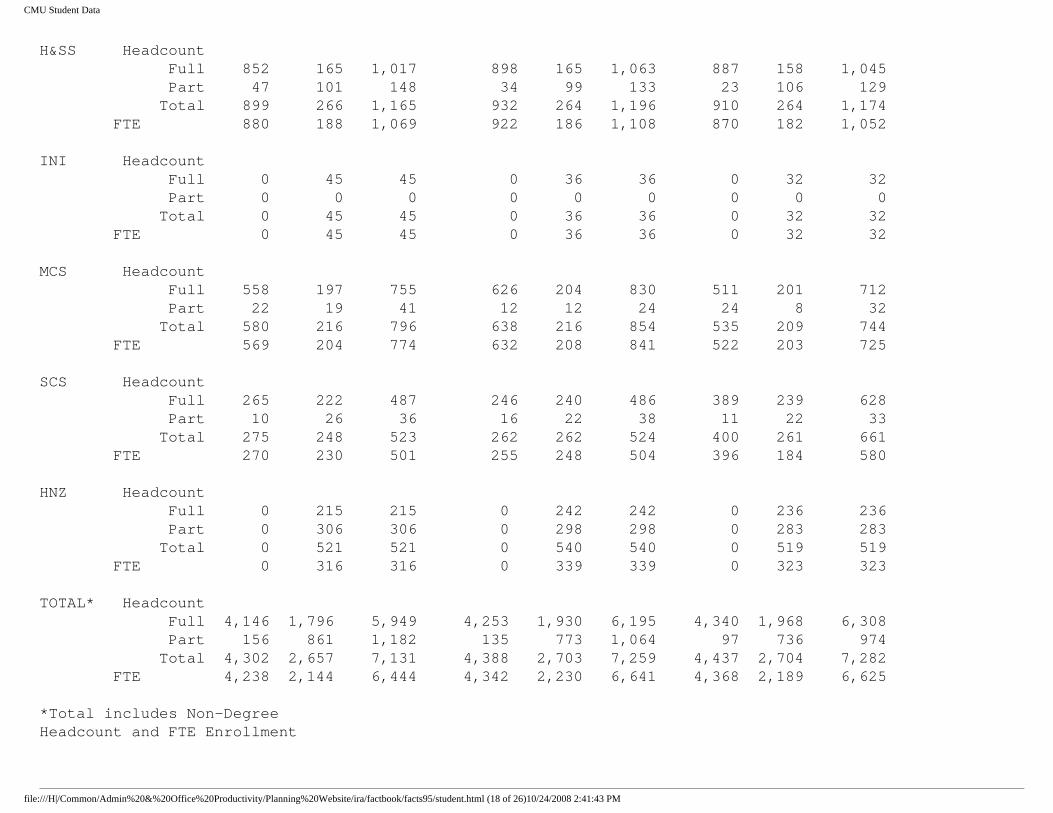
Headcount and FTE Enrollment By College, Level and Status Fall Semesters 1989 to 1994
1992 1993 1994 College Undg. Grad. Total Undg. Grad. Total Undg. Grad. Total Status CFA Headcount Full 864 56 920 864 92 956 904 148 1,052 Part 46 83 129 45 72 117 17 51 68 Total 910 139 1,049 909 164 1,073 921 199 1,120 FTE 892 104 996 894 140 1,034 917 184 1,101 CIT Headcount Full 1,330 441 1,771 1,330 496 1,826 1,304 451 1,755 Part 21 120 141 21 96 117 15 91 106 Total 1,351 561 1,912 1,351 592 1,943 1,319 542 1,861 FTE 1,343 485 1,829 1,343 527 1,871 1,314 480 1,794 GSIA Headcount Full 277 455 732 289 455 744 345 503 848 Part 10 206 216 7 174 181 7 175 182 Total 287 661 948 296 629 925 352 678 1,030 FTE 281 568 849 293 544 837 349 601 950
file:///H|/Common/Admin%20&%20Office%20Productivity/Planning%20Website/ira/factbook/facts95/student.html (17 of 26)10/24/2008 2:41:43 PM
CMU Student Data
H&SS Headcount Full 852 165 1,017 898 165 1,063 887 158 1,045 Part 47 101 148 34 99 133 23 106 129 Total 899 266 1,165 932 264 1,196 910 264 1,174 FTE 880 188 1,069 922 186 1,108 870 182 1,052 INI Headcount Full 0 45 45 0 36 36 0 32 32 Part 0 0 0 0 0 0 0 0 0 Total 0 45 45 0 36 36 0 32 32 FTE 0 45 45 0 36 36 0 32 32 MCS Headcount Full 558 197 755 626 204 830 511 201 712 Part 22 19 41 12 12 24 24 8 32 Total 580 216 796 638 216 854 535 209 744 FTE 569 204 774 632 208 841 522 203 725 SCS Headcount Full 265 222 487 246 240 486 389 239 628 Part 10 26 36 16 22 38 11 22 33 Total 275 248 523 262 262 524 400 261 661 FTE 270 230 501 255 248 504 396 184 580 HNZ Headcount Full 0 215 215 0 242 242 0 236 236 Part 0 306 306 0 298 298 0 283 283 Total 0 521 521 0 540 540 0 519 519 FTE 0 316 316 0 339 339 0 323 323 TOTAL* Headcount Full 4,146 1,796 5,949 4,253 1,930 6,195 4,340 1,968 6,308 Part 156 861 1,182 135 773 1,064 97 736 974 Total 4,302 2,657 7,131 4,388 2,703 7,259 4,437 2,704 7,282 FTE 4,238 2,144 6,444 4,342 2,230 6,641 4,368 2,189 6,625 *Total includes Non-Degree Headcount and FTE Enrollment
file:///H|/Common/Admin%20&%20Office%20Productivity/Planning%20Website/ira/factbook/facts95/student.html (18 of 26)10/24/2008 2:41:43 PM

CMU Student Data
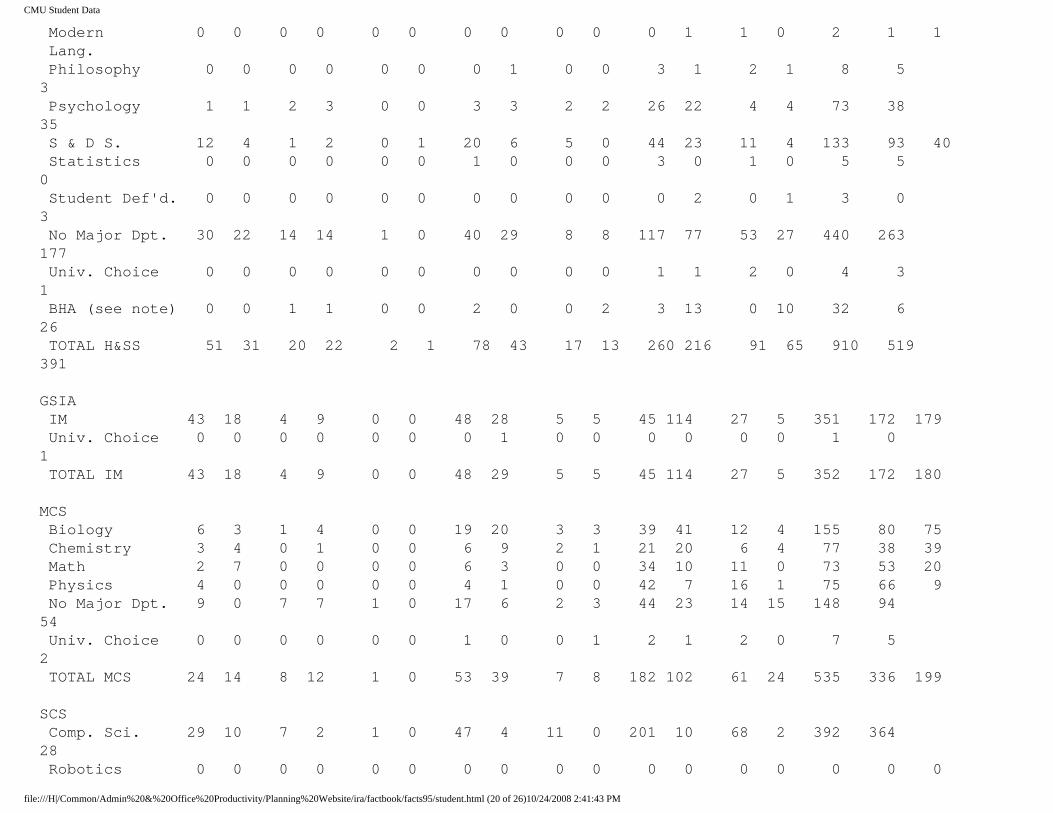
Undergraduate Headcount Enrollment By Department, Race and Sex Fall Semester 1994
College Department NRA Black AI/AN A/PI Hisp. White Unkn. CFA M F M F M F M F M F M F M F Total M F Architecture 14 8 2 5 0 1 30 26 9 2 87 46 29 19 278 171 107 Art 1 2 6 1 0 0 5 7 1 7 38 47 15 24 162 66 88 Design 7 3 3 0 0 0 11 12 2 4 46 50 10 22 170 79 91 Drama 2 1 4 7 0 0 3 2 3 5 73 51 20 20 191 105 86 Music 4 7 0 2 0 1 3 3 1 0 39 40 11 15 126 58 68 No Major Dpt. 0 0 1 1 0 0 0 0 0 0 0 0 0 0 2 1 1 TOTAL CFA 28 21 16 16 0 2 52 50 16 18 283 234 85 100 921 480 441 CIT Biomedical E. 0 0 0 0 0 0 0 0 0 0 0 0 0 0 0 0 0 Chemical E. 11 4 4 6 0 0 22 13 2 3 61 31 10 6 173 110 63 Civil E. 6 0 6 1 0 0 9 1 1 2 69 10 5 3 113 96 17 E &C E. 68 9 6 0 1 0 77 11 6 0 178 12 45 4 417 381 36 Mechanical E. 25 0 7 2 0 0 28 4 11 0 103 19 16 2 217 190 27 MSE 2 0 0 1 0 0 4 5 0 0 28 3 6 1 50 40 10 No Major Dpt. 30 2 16 4 0 0 43 5 17 3 144 22 46 8 340 296 44 Univ. Choice 0 0 0 0 0 0 0 0 0 0 9 0 0 0 9 9 0 TOTAL CIT 142 15 39 14 1 0 183 39 37 8 592 97 128 24 1,319 1,122 197 19 2 H&SS Economics 6 4 0 0 0 0 5 0 1 0 19 7 2 2 46 33 13 English 1 0 2 2 1 0 4 3 1 1 25 52 13 15 120 47 73 History 1 0 0 0 0 0 3 1 0 0 19 17 2 1 44 25 19
file:///H|/Common/Admin%20&%20Office%20Productivity/Planning%20Website/ira/factbook/facts95/student.html (19 of 26)10/24/2008 2:41:43 PM
CMU Student Data
Modern 0 0 0 0 0 0 0 0 0 0 0 1 1 0 2 1 1 Lang. Philosophy 0 0 0 0 0 0 0 1 0 0 3 1 2 1 8 5 3 Psychology 1 1 2 3 0 0 3 3 2 2 26 22 4 4 73 38 35 S & D S. 12 4 1 2 0 1 20 6 5 0 44 23 11 4 133 93 40 Statistics 0 0 0 0 0 0 1 0 0 0 3 0 1 0 5 5 0 Student Def'd. 0 0 0 0 0 0 0 0 0 0 0 2 0 1 3 0 3 No Major Dpt. 30 22 14 14 1 0 40 29 8 8 117 77 53 27 440 263 177 Univ. Choice 0 0 0 0 0 0 0 0 0 0 1 1 2 0 4 3 1 BHA (see note) 0 0 1 1 0 0 2 0 0 2 3 13 0 10 32 6 26 TOTAL H&SS 51 31 20 22 2 1 78 43 17 13 260 216 91 65 910 519 391 GSIA IM 43 18 4 9 0 0 48 28 5 5 45 114 27 5 351 172 179 Univ. Choice 0 0 0 0 0 0 0 1 0 0 0 0 0 0 1 0 1 TOTAL IM 43 18 4 9 0 0 48 29 5 5 45 114 27 5 352 172 180 MCS Biology 6 3 1 4 0 0 19 20 3 3 39 41 12 4 155 80 75 Chemistry 3 4 0 1 0 0 6 9 2 1 21 20 6 4 77 38 39 Math 2 7 0 0 0 0 6 3 0 0 34 10 11 0 73 53 20 Physics 4 0 0 0 0 0 4 1 0 0 42 7 16 1 75 66 9 No Major Dpt. 9 0 7 7 1 0 17 6 2 3 44 23 14 15 148 94 54 Univ. Choice 0 0 0 0 0 0 1 0 0 1 2 1 2 0 7 5 2 TOTAL MCS 24 14 8 12 1 0 53 39 7 8 182 102 61 24 535 336 199 SCS Comp. Sci. 29 10 7 2 1 0 47 4 11 0 201 10 68 2 392 364 28 Robotics 0 0 0 0 0 0 0 0 0 0 0 0 0 0 0 0 0
file:///H|/Common/Admin%20&%20Office%20Productivity/Planning%20Website/ira/factbook/facts95/student.html (20 of 26)10/24/2008 2:41:43 PM

CMU Student Data
Univ. Choice 0 0 1 0 0 0 2 0 0 0 2 0 3 0 8 8 0 TOTAL SCS 29 10 8 2 1 0 49 4 11 0 203 10 71 2 400 372 28 TOTAL 317 109 95 75 5 3 463 204 93 52 1,565 773 463 220 4,437 3,001 1,436
Note: Bachelor of Humanities and Arts is a joint department between CFA & H&SS
Distribution of Students By Housing Type, Level and Sex Fall Semester 1994
Carnegie Mellon Housing Fraternity Non-CMU On-Campus Off-Campus Total Sorority** Housing TOTAL Undergraduate Freshman Male 663 31 694 0 119 813 Female 335 10 345 0 32 377 TOTAL 998 41 1,039 0 151 *1,190 Sophomore Male 473 34 507 79 219 805 Female 233 22 255 18 89 362 TOTAL 706 56 762 97 308 1,167 Junior Male 256 36 292 125 264 681 Female 138 29 167 52 105 324 TOTAL 394 65 459 177 369 1,005 Senior
file:///H|/Common/Admin%20&%20Office%20Productivity/Planning%20Website/ira/factbook/facts95/student.html (21 of 26)10/24/2008 2:41:43 PM
CMU Student Data
Male 189 22 211 198 362 771 Female 73 16 89 68 147 304 TOTAL 262 38 300 266 509 1,075 Undergraduate Male 1,581 123 1,704 402 964 3,070 Female 779 77 856 138 373 1,367 TOTAL 2,360 200 2,560 540 1,337 4,437 Graduate Male 0 0 0 0 1,886 1,886 Female 0 0 0 0 818 818 TOTAL 0 0 0 0 2,704 2,704 Non-Degree Male 0 0 0 0 76 76 Female 0 0 0 0 65 65 TOTAL 0 0 0 0 141 141 TOTAL Male 1,581 123 1,704 402 2,926 5,032 Female 779 77 856 138 1,256 2,250 TOTAL 2,360 200 2,560 540 4,182 7,282
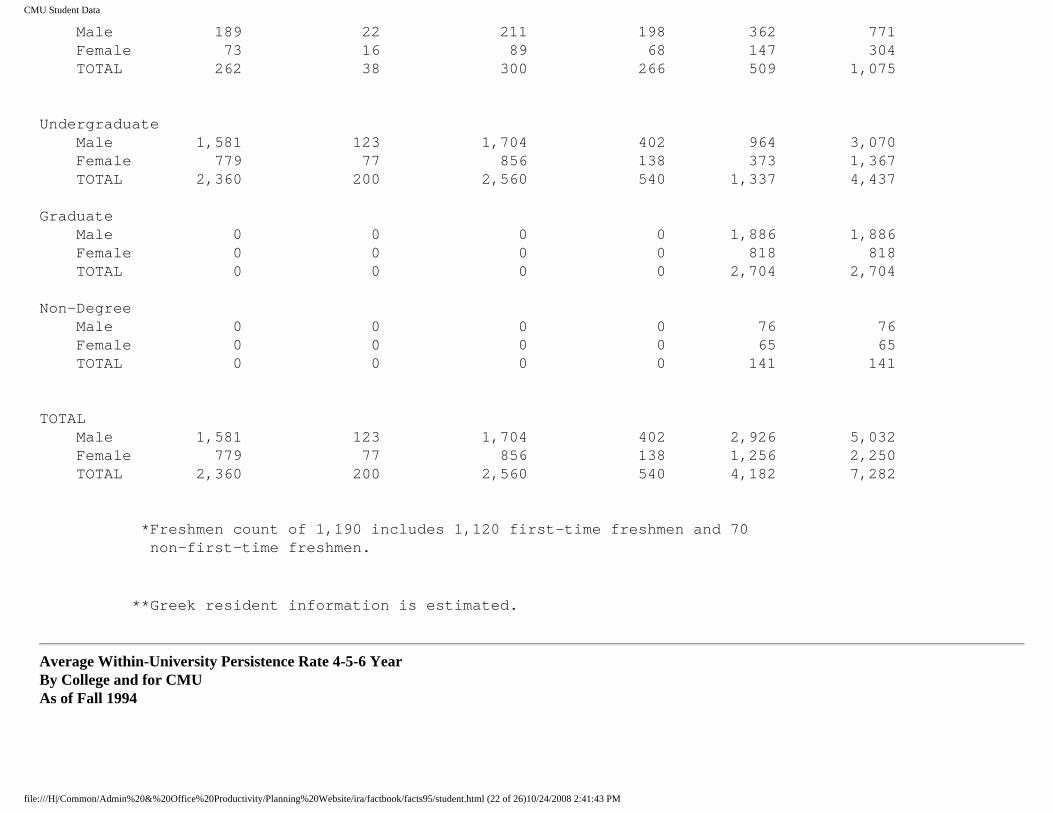
*Freshmen count of 1,190 includes 1,120 first-time freshmen and 70 non-first-time freshmen.
**Greek resident information is estimated.
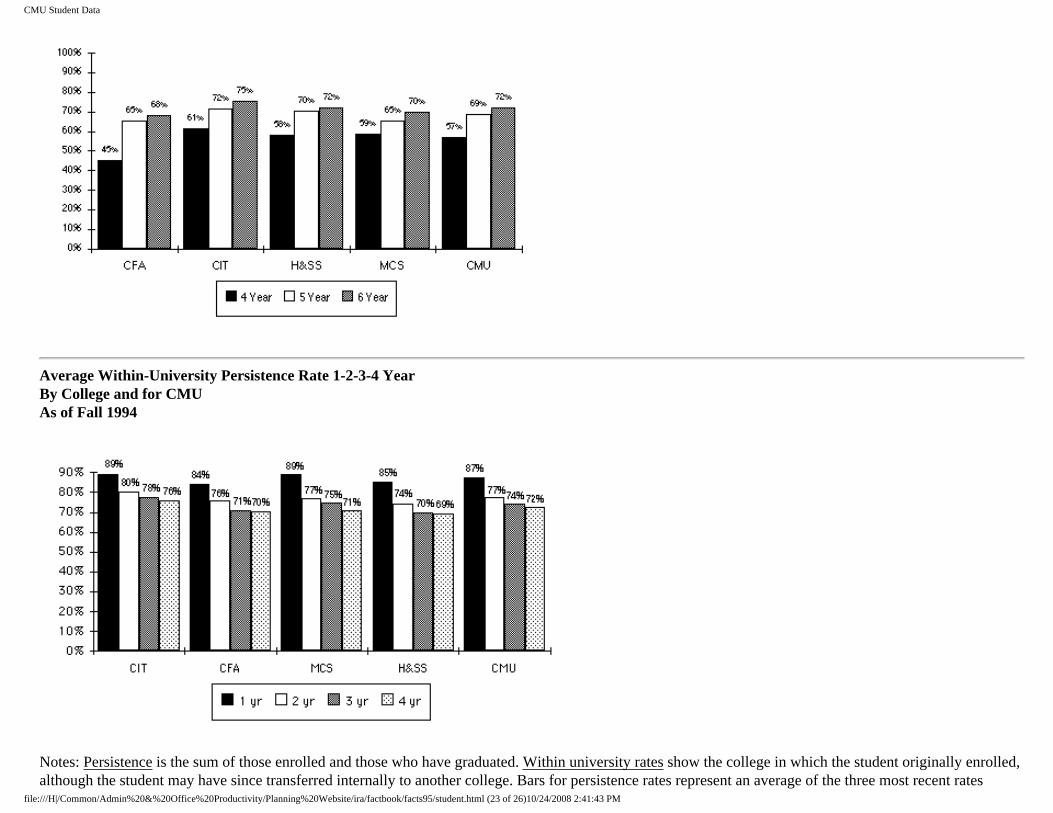
Average Within-University Persistence Rate 4-5-6 Year By College and for CMU As of Fall 1994
file:///H|/Common/Admin%20&%20Office%20Productivity/Planning%20Website/ira/factbook/facts95/student.html (22 of 26)10/24/2008 2:41:43 PM
CMU Student Data
Average Within-University Persistence Rate 1-2-3-4 Year By College and for CMU As of Fall 1994
Notes: Persistence is the sum of those enrolled and those who have graduated. Within university rates show the college in which the student originally enrolled, although the student may have since transferred internally to another college. Bars for persistence rates represent an average of the three most recent rates
file:///H|/Common/Admin%20&%20Office%20Productivity/Planning%20Website/ira/factbook/facts95/student.html (23 of 26)10/24/2008 2:41:43 PM

CMU Student Data
available: entering classes of 1991-93, 1990-92, 1989-91, 1988-90.
Total Degrees Granted By Department and Level Academic Year 1993-94
Bachelors Masters Doctorates TOTAL College Department CFA Architecture 40 13 2 55 Art 40 19 0 59 Design 38 0 0 38 Drama 33 14 0 47 Music 17 26 0 43 TOTAL CFA 168 72 2 242 CIT Biomed. E. 0 2 0 2 Chemical E. 53 9 10 72 Civil E. 34 13 8 55 E&CE. 129 31 38 198 E&PP 0 2 1 3 Mfg. E. 0 1 0 1 Mechanical E. 81 22 9 112 MSE 10 13 14 37 Eng. Other 0 15 1 16 TOTAL CIT 307 108 81 496 GSIA IA 0 253 15 268 IM 105 0 0 105 TOTAL GSIA 105 253 15 373 H&SS Economics 20 4 2 26 English 53 28 3 84 History 26 12 9 47 Modern Lang. 5 0 0
file:///H|/Common/Admin%20&%20Office%20Productivity/Planning%20Website/ira/factbook/facts95/student.html (24 of 26)10/24/2008 2:41:43 PM

CMU Student Data
5 Philosophy 3 13 0 16 Psychology 26 3 7 36 S&DS 24 1 2 27 Statistics 1 5 6 12 Student Defined 3 0 0 3 TOTAL H&SS 161 66 29 256 MCS Biology 35 1 6 42 Chemistry 15 7 5 27 Math 93 7 6 106 Physics 24 10 6 40 TOTAL MCS 167 25 23 215 SCS Comp. Sci. 30 69 16 115 Robotics 0 0 0 0 TOTAL SCS 30 69 16 115 HNZ 0 158 1 159 TOTAL 938 751 167 1856
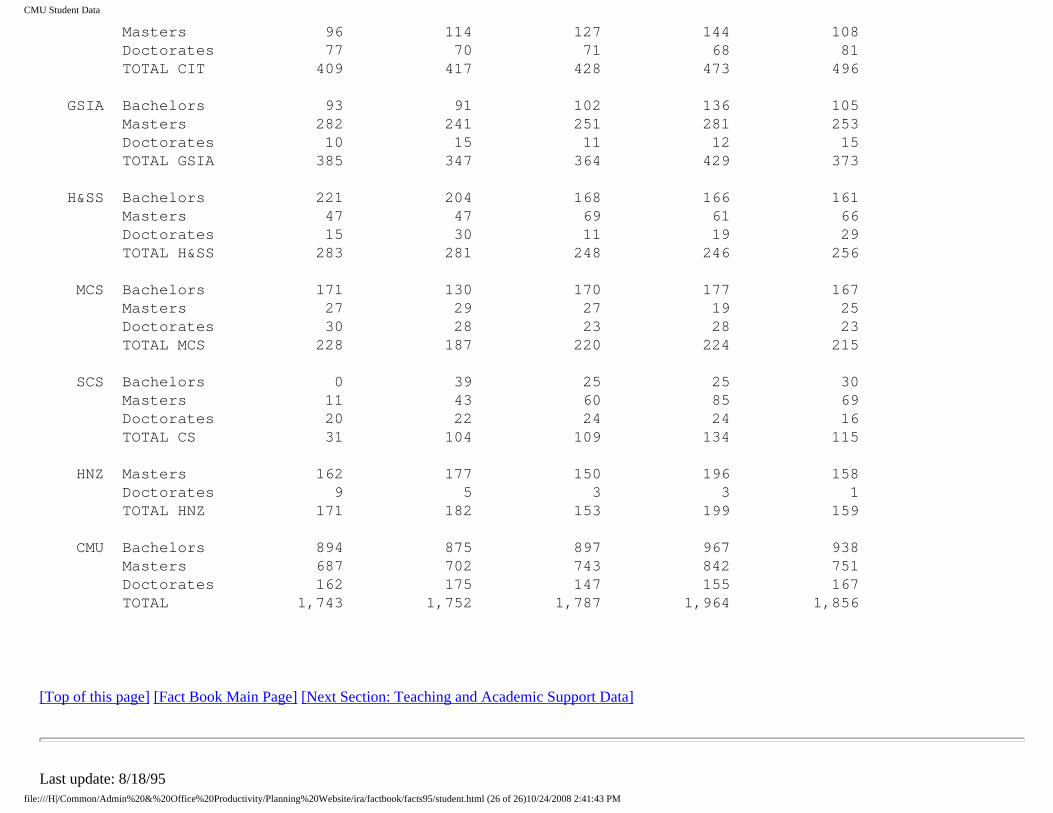
Total Degrees Granted By College and Level Academic Years 1989-90 and 1993-94
College 1989-90 1990-91 1991-92 1992-93 1993-94 Degrees CFA Bachelors 173 178 202 202 168 Masters 62 51 59 56 72 Doctorates 1 5 4 1 2 TOTAL CFA 236 234 265 259 242 CIT Bachelors 236 233 230 261 307
file:///H|/Common/Admin%20&%20Office%20Productivity/Planning%20Website/ira/factbook/facts95/student.html (25 of 26)10/24/2008 2:41:43 PM
CMU Student Data
Masters 96 114 127 144 108 Doctorates 77 70 71 68 81 TOTAL CIT 409 417 428 473 496 GSIA Bachelors 93 91 102 136 105 Masters 282 241 251 281 253 Doctorates 10 15 11 12 15 TOTAL GSIA 385 347 364 429 373 H&SS Bachelors 221 204 168 166 161 Masters 47 47 69 61 66 Doctorates 15 30 11 19 29 TOTAL H&SS 283 281 248 246 256 MCS Bachelors 171 130 170 177 167 Masters 27 29 27 19 25 Doctorates 30 28 23 28 23 TOTAL MCS 228 187 220 224 215 SCS Bachelors 0 39 25 25 30 Masters 11 43 60 85 69 Doctorates 20 22 24 24 16 TOTAL CS 31 104 109 134 115 HNZ Masters 162 177 150 196 158 Doctorates 9 5 3 3 1 TOTAL HNZ 171 182 153 199 159 CMU Bachelors 894 875 897 967 938 Masters 687 702 743 842 751 Doctorates 162 175 147 155 167 TOTAL 1,743 1,752 1,787 1,964 1,856
[Top of this page] [Fact Book Main Page] [Next Section: Teaching and Academic Support Data]
Last update: 8/18/95 file:///H|/Common/Admin%20&%20Office%20Productivity/Planning%20Website/ira/factbook/facts95/student.html (26 of 26)10/24/2008 2:41:43 PM
CMU Teaching and Academic Support Data
CMU Teaching and Academic Support Data
CONTENTS Units Taught by Department, Semester, and Level 1993-94. Units Taught by College and Level, 1989-90 to 1993-94. Computing Services Statistics, 1991 to 1994. Instructional Technology Statistics, 1991 to 1994. Library Collections and Utilization, 1992 to 1994. Teaching and Academic Support Additional Facts and Figures (PCHE, UTC).
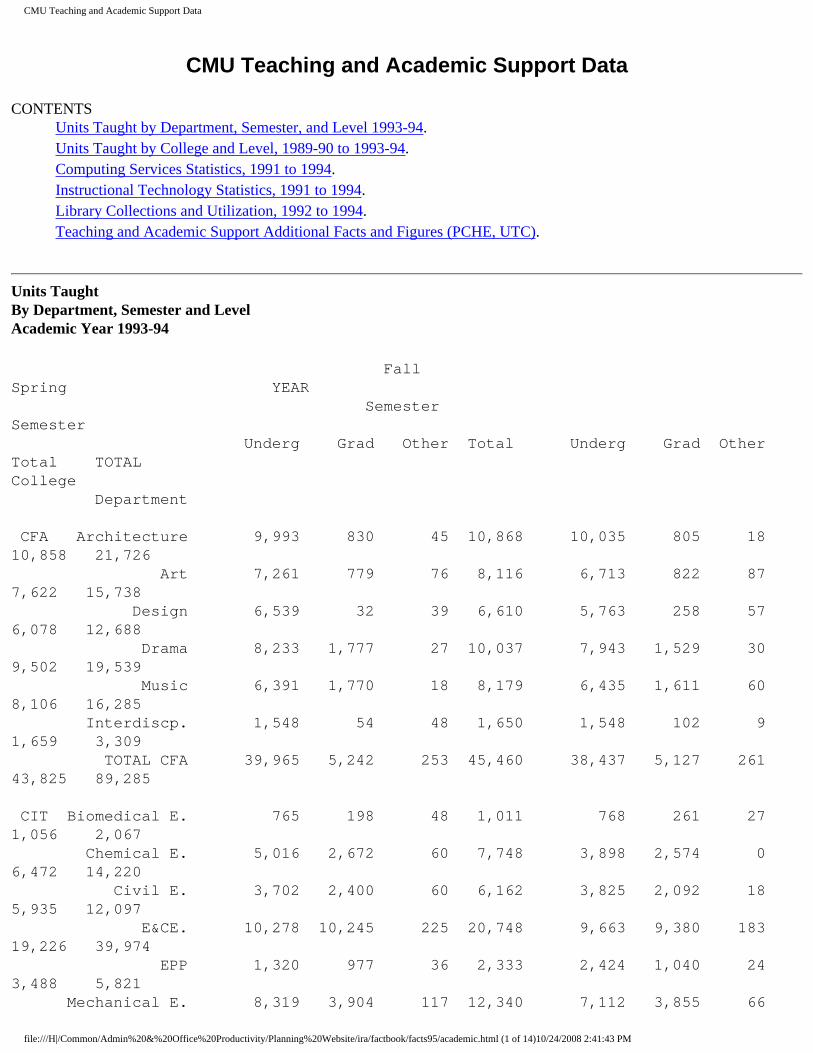
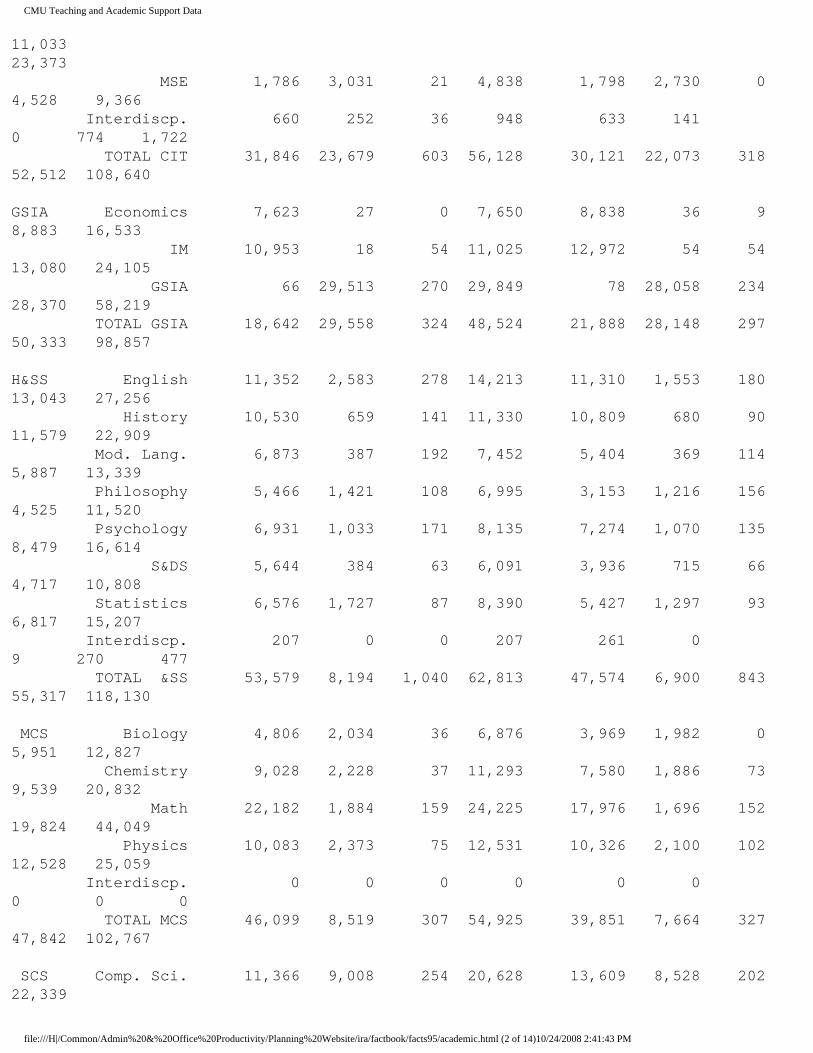
Units Taught By Department, Semester and Level Academic Year 1993-94
Fall Spring YEAR Semester Semester Underg Grad Other Total Underg Grad Other Total TOTAL College Department CFA Architecture 9,993 830 45 10,868 10,035 805 18 10,858 21,726 Art 7,261 779 76 8,116 6,713 822 87 7,622 15,738 Design 6,539 32 39 6,610 5,763 258 57 6,078 12,688 Drama 8,233 1,777 27 10,037 7,943 1,529 30 9,502 19,539 Music 6,391 1,770 18 8,179 6,435 1,611 60 8,106 16,285 Interdiscp. 1,548 54 48 1,650 1,548 102 9 1,659 3,309 TOTAL CFA 39,965 5,242 253 45,460 38,437 5,127 261 43,825 89,285 CIT Biomedical E. 765 198 48 1,011 768 261 27 1,056 2,067 Chemical E. 5,016 2,672 60 7,748 3,898 2,574 0 6,472 14,220 Civil E. 3,702 2,400 60 6,162 3,825 2,092 18 5,935 12,097 E&CE. 10,278 10,245 225 20,748 9,663 9,380 183 19,226 39,974 EPP 1,320 977 36 2,333 2,424 1,040 24 3,488 5,821 Mechanical E. 8,319 3,904 117 12,340 7,112 3,855 66
file:///H|/Common/Admin%20&%20Office%20Productivity/Planning%20Website/ira/factbook/facts95/academic.html (1 of 14)10/24/2008 2:41:43 PM
CMU Teaching and Academic Support Data
11,033 23,373 MSE 1,786 3,031 21 4,838 1,798 2,730 0 4,528 9,366 Interdiscp. 660 252 36 948 633 141 0 774 1,722 TOTAL CIT 31,846 23,679 603 56,128 30,121 22,073 318 52,512 108,640 GSIA Economics 7,623 27 0 7,650 8,838 36 9 8,883 16,533 IM 10,953 18 54 11,025 12,972 54 54 13,080 24,105 GSIA 66 29,513 270 29,849 78 28,058 234 28,370 58,219 TOTAL GSIA 18,642 29,558 324 48,524 21,888 28,148 297 50,333 98,857 H&SS English 11,352 2,583 278 14,213 11,310 1,553 180 13,043 27,256 History 10,530 659 141 11,330 10,809 680 90 11,579 22,909 Mod. Lang. 6,873 387 192 7,452 5,404 369 114 5,887 13,339 Philosophy 5,466 1,421 108 6,995 3,153 1,216 156 4,525 11,520 Psychology 6,931 1,033 171 8,135 7,274 1,070 135 8,479 16,614 S&DS 5,644 384 63 6,091 3,936 715 66 4,717 10,808 Statistics 6,576 1,727 87 8,390 5,427 1,297 93 6,817 15,207 Interdiscp. 207 0 0 207 261 0 9 270 477 TOTAL &SS 53,579 8,194 1,040 62,813 47,574 6,900 843 55,317 118,130 MCS Biology 4,806 2,034 36 6,876 3,969 1,982 0 5,951 12,827 Chemistry 9,028 2,228 37 11,293 7,580 1,886 73 9,539 20,832 Math 22,182 1,884 159 24,225 17,976 1,696 152 19,824 44,049 Physics 10,083 2,373 75 12,531 10,326 2,100 102 12,528 25,059 Interdiscp. 0 0 0 0 0 0 0 0 0 TOTAL MCS 46,099 8,519 307 54,925 39,851 7,664 327 47,842 102,767 SCS Comp. Sci. 11,366 9,008 254 20,628 13,609 8,528 202 22,339
file:///H|/Common/Admin%20&%20Office%20Productivity/Planning%20Website/ira/factbook/facts95/academic.html (2 of 14)10/24/2008 2:41:43 PM
CMU Teaching and Academic Support Data
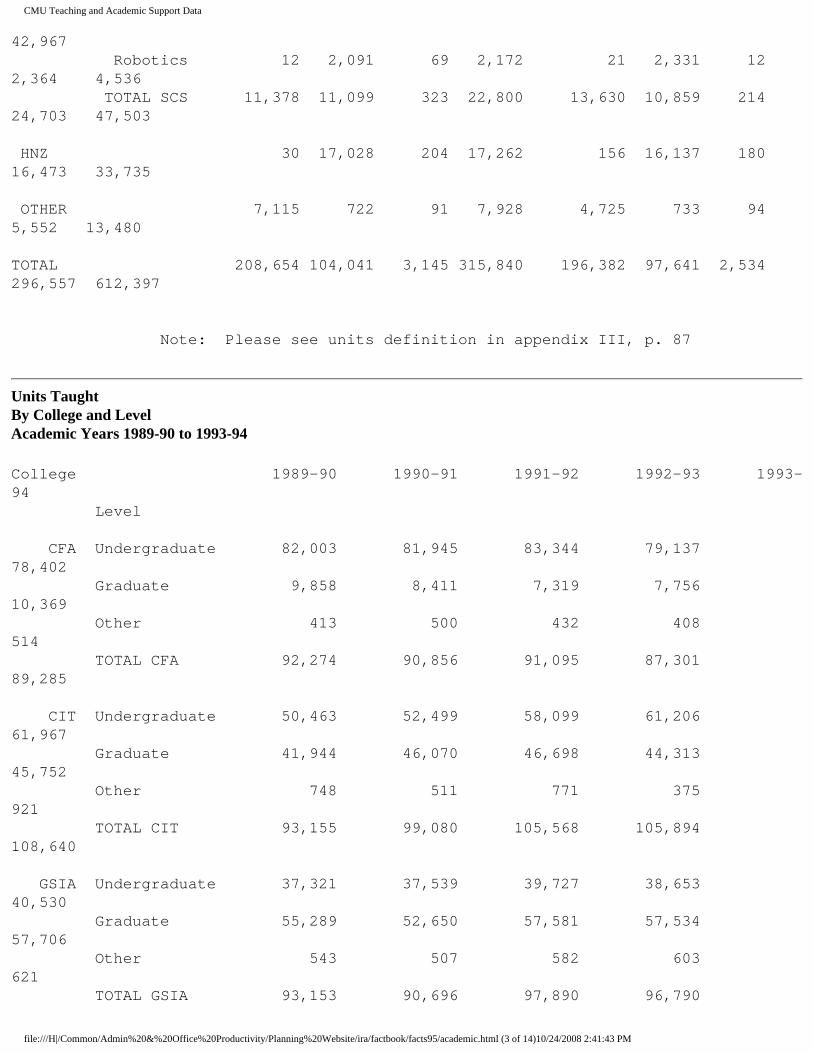
42,967 Robotics 12 2,091 69 2,172 21 2,331 12 2,364 4,536 TOTAL SCS 11,378 11,099 323 22,800 13,630 10,859 214 24,703 47,503 HNZ 30 17,028 204 17,262 156 16,137 180 16,473 33,735 OTHER 7,115 722 91 7,928 4,725 733 94 5,552 13,480 TOTAL 208,654 104,041 3,145 315,840 196,382 97,641 2,534 296,557 612,397
Note: Please see units definition in appendix III, p. 87
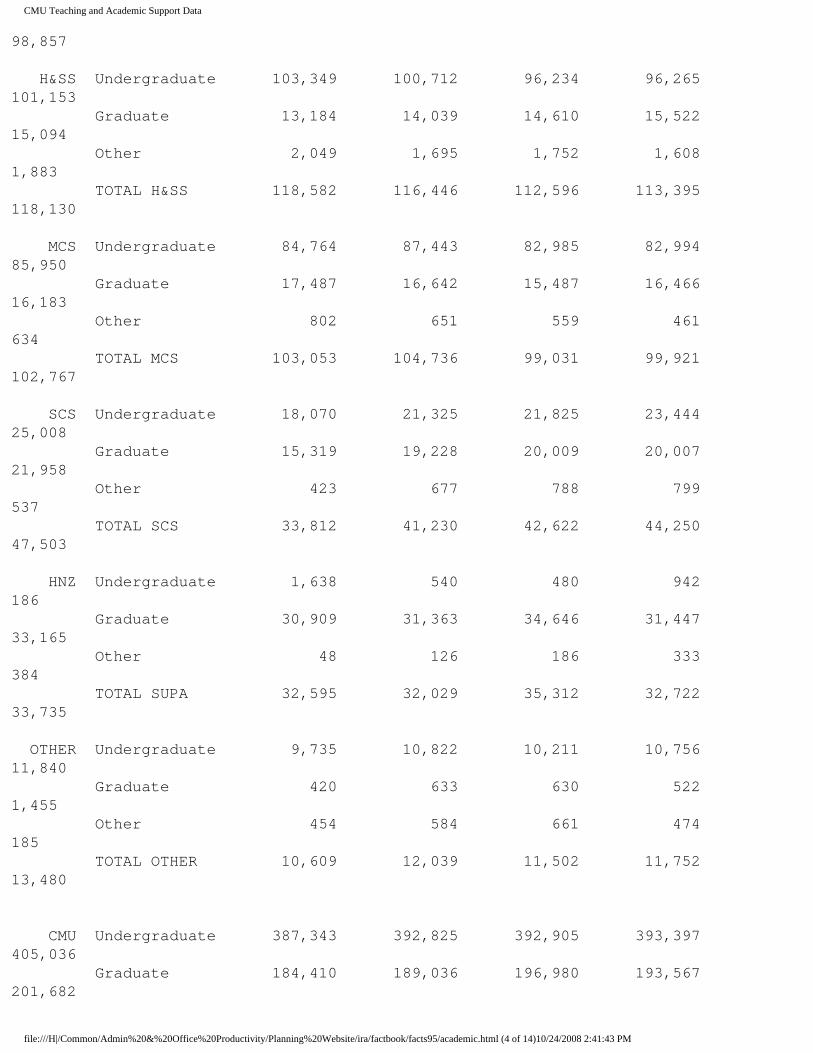
Units Taught By College and Level Academic Years 1989-90 to 1993-94
College 1989-90 1990-91 1991-92 1992-93 1993-94 Level CFA Undergraduate 82,003 81,945 83,344 79,137 78,402 Graduate 9,858 8,411 7,319 7,756 10,369 Other 413 500 432 408 514 TOTAL CFA 92,274 90,856 91,095 87,301 89,285 CIT Undergraduate 50,463 52,499 58,099 61,206 61,967 Graduate 41,944 46,070 46,698 44,313 45,752 Other 748 511 771 375 921 TOTAL CIT 93,155 99,080 105,568 105,894 108,640 GSIA Undergraduate 37,321 37,539 39,727 38,653 40,530 Graduate 55,289 52,650 57,581 57,534 57,706 Other 543 507 582 603 621 TOTAL GSIA 93,153 90,696 97,890 96,790
file:///H|/Common/Admin%20&%20Office%20Productivity/Planning%20Website/ira/factbook/facts95/academic.html (3 of 14)10/24/2008 2:41:43 PM
CMU Teaching and Academic Support Data
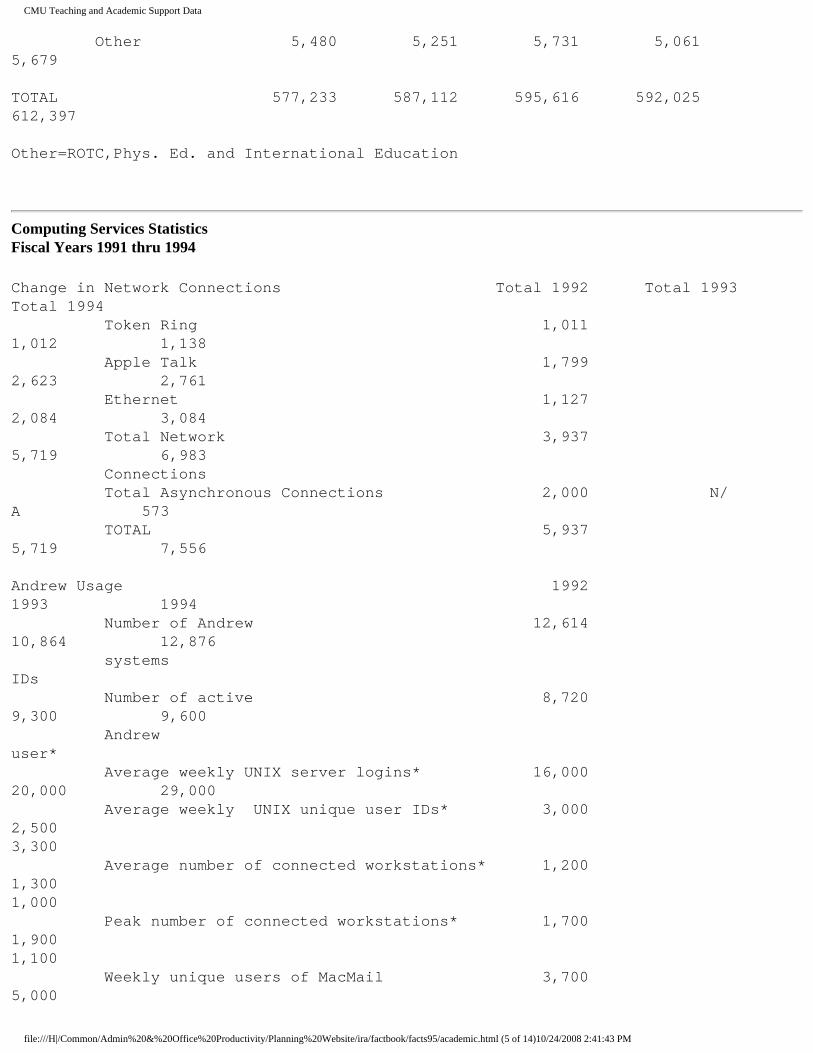
98,857 H&SS Undergraduate 103,349 100,712 96,234 96,265 101,153 Graduate 13,184 14,039 14,610 15,522 15,094 Other 2,049 1,695 1,752 1,608 1,883 TOTAL H&SS 118,582 116,446 112,596 113,395 118,130 MCS Undergraduate 84,764 87,443 82,985 82,994 85,950 Graduate 17,487 16,642 15,487 16,466 16,183 Other 802 651 559 461 634 TOTAL MCS 103,053 104,736 99,031 99,921 102,767 SCS Undergraduate 18,070 21,325 21,825 23,444 25,008 Graduate 15,319 19,228 20,009 20,007 21,958 Other 423 677 788 799 537 TOTAL SCS 33,812 41,230 42,622 44,250 47,503 HNZ Undergraduate 1,638 540 480 942 186 Graduate 30,909 31,363 34,646 31,447 33,165 Other 48 126 186 333 384 TOTAL SUPA 32,595 32,029 35,312 32,722 33,735 OTHER Undergraduate 9,735 10,822 10,211 10,756 11,840 Graduate 420 633 630 522 1,455 Other 454 584 661 474 185 TOTAL OTHER 10,609 12,039 11,502 11,752 13,480 CMU Undergraduate 387,343 392,825 392,905 393,397 405,036 Graduate 184,410 189,036 196,980 193,567 201,682
file:///H|/Common/Admin%20&%20Office%20Productivity/Planning%20Website/ira/factbook/facts95/academic.html (4 of 14)10/24/2008 2:41:43 PM
CMU Teaching and Academic Support Data
Other 5,480 5,251 5,731 5,061 5,679 TOTAL 577,233 587,112 595,616 592,025 612,397
Other=ROTC,Phys. Ed. and International Education
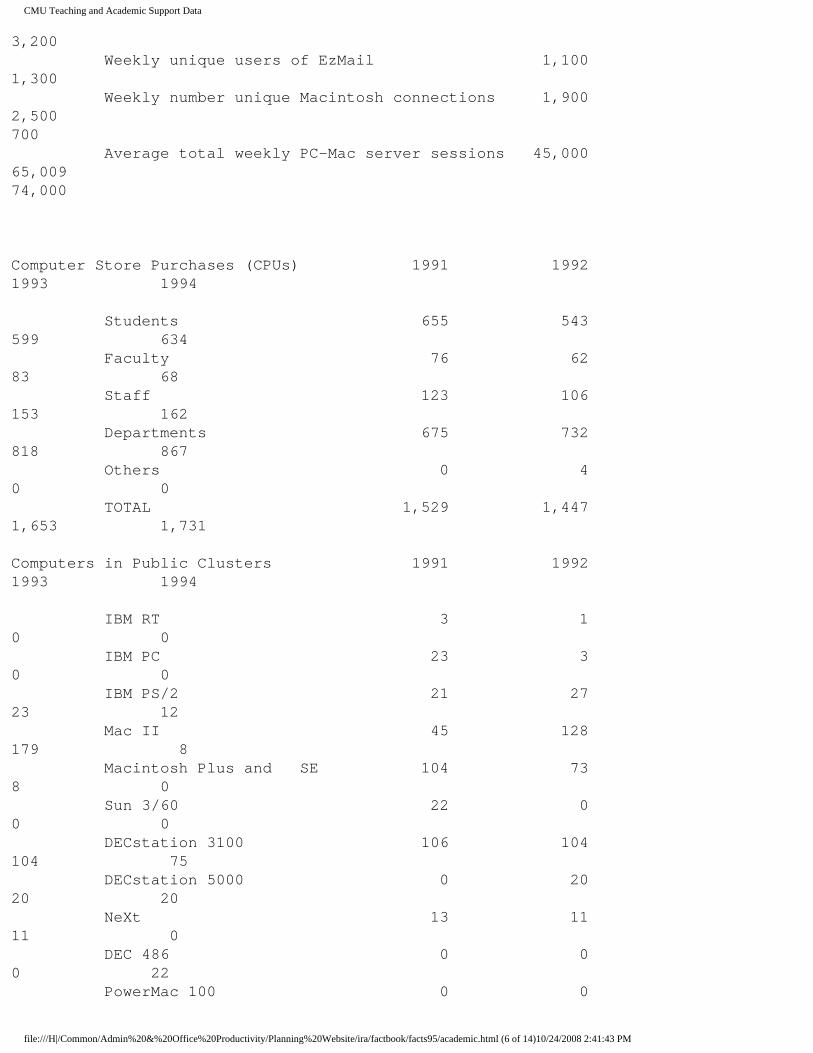
Computing Services Statistics Fiscal Years 1991 thru 1994
Change in Network Connections Total 1992 Total 1993 Total 1994 Token Ring 1,011 1,012 1,138 Apple Talk 1,799 2,623 2,761 Ethernet 1,127 2,084 3,084 Total Network 3,937 5,719 6,983 Connections Total Asynchronous Connections 2,000 N/A 573 TOTAL 5,937 5,719 7,556 Andrew Usage 1992 1993 1994 Number of Andrew 12,614 10,864 12,876 systems IDs Number of active 8,720 9,300 9,600 Andrew user* Average weekly UNIX server logins* 16,000 20,000 29,000 Average weekly UNIX unique user IDs* 3,000 2,500 3,300 Average number of connected workstations* 1,200 1,300 1,000 Peak number of connected workstations* 1,700 1,900 1,100 Weekly unique users of MacMail 3,700 5,000
file:///H|/Common/Admin%20&%20Office%20Productivity/Planning%20Website/ira/factbook/facts95/academic.html (5 of 14)10/24/2008 2:41:43 PM
CMU Teaching and Academic Support Data
3,200 Weekly unique users of EzMail 1,100 1,300 Weekly number unique Macintosh connections 1,900 2,500 700 Average total weekly PC-Mac server sessions 45,000 65,009 74,000
Computer Store Purchases (CPUs) 1991 1992 1993 1994
Students 655 543 599 634 Faculty 76 62 83 68 Staff 123 106 153 162 Departments 675 732 818 867 Others 0 4 0 0 TOTAL 1,529 1,447 1,653 1,731 Computers in Public Clusters 1991 1992 1993 1994
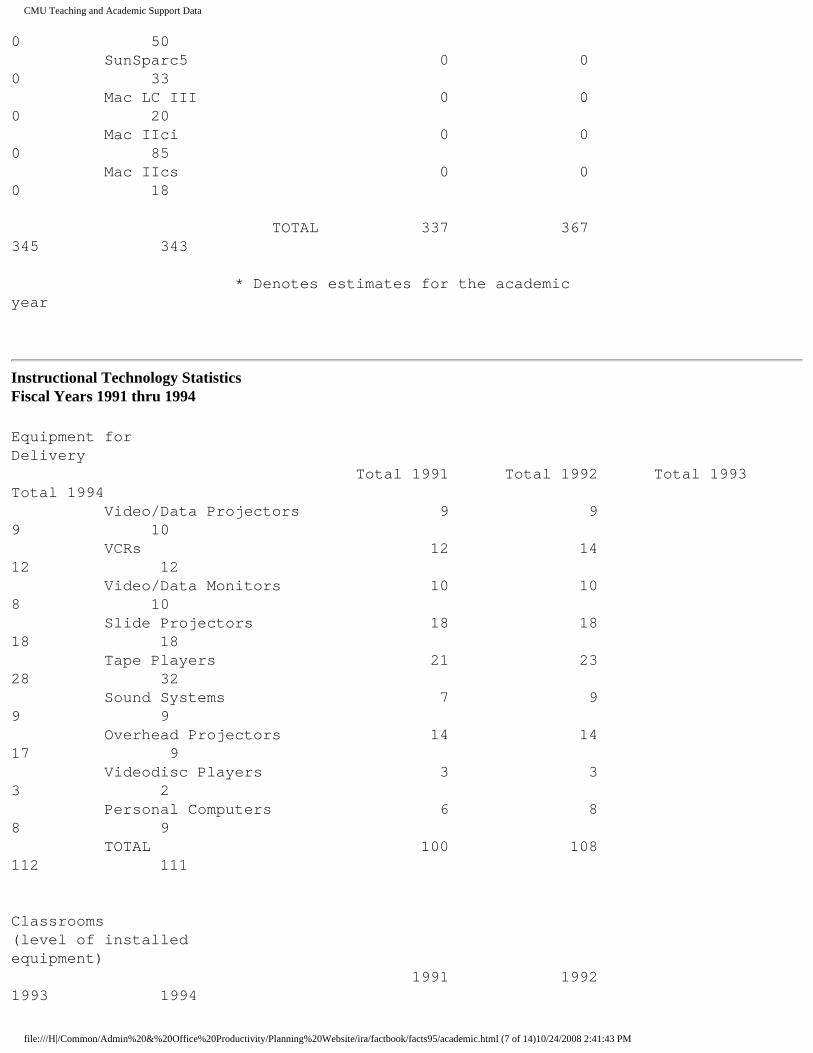
IBM RT 3 1 0 0 IBM PC 23 3 0 0 IBM PS/2 21 27 23 12 Mac II 45 128 179 8 Macintosh Plus and SE 104 73 8 0 Sun 3/60 22 0 0 0 DECstation 3100 106 104 104 75 DECstation 5000 0 20 20 20 NeXt 13 11 11 0 DEC 486 0 0 0 22 PowerMac 100 0 0
file:///H|/Common/Admin%20&%20Office%20Productivity/Planning%20Website/ira/factbook/facts95/academic.html (6 of 14)10/24/2008 2:41:43 PM
CMU Teaching and Academic Support Data
0 50 SunSparc5 0 0 0 33 Mac LC III 0 0 0 20 Mac IIci 0 0 0 85 Mac IIcs 0 0 0 18 TOTAL 337 367 345 343 * Denotes estimates for the academic year
Instructional Technology Statistics Fiscal Years 1991 thru 1994
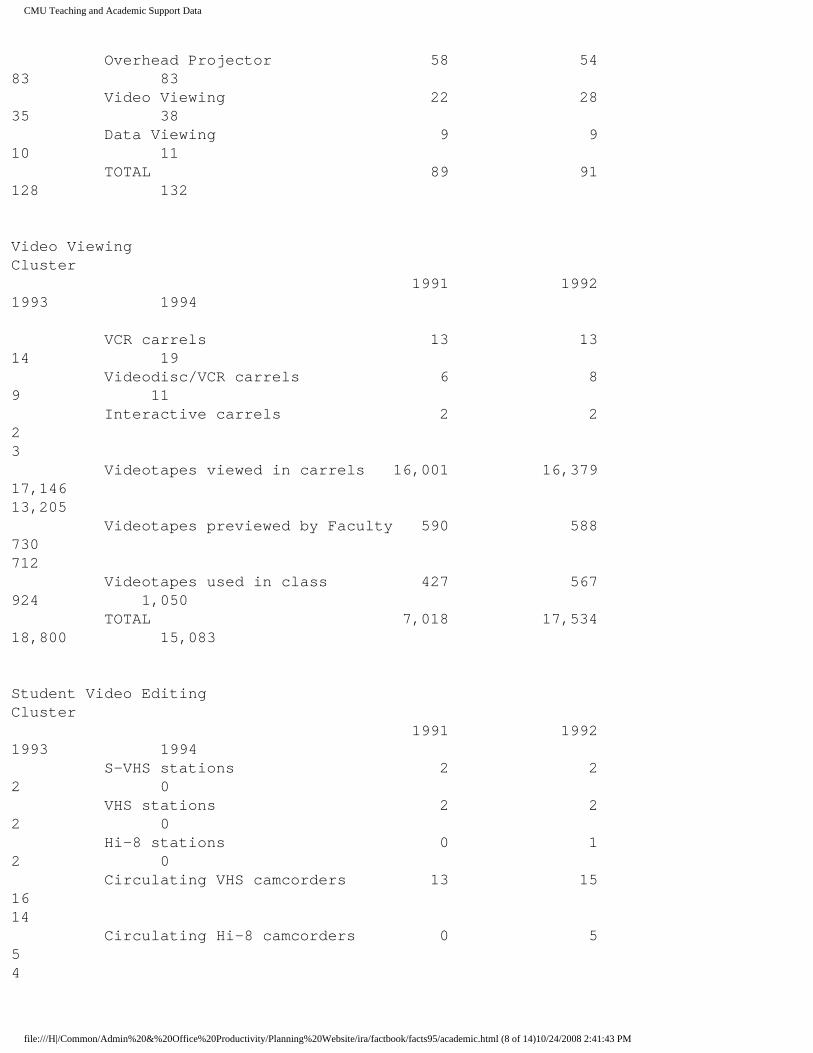
Equipment for Delivery Total 1991 Total 1992 Total 1993 Total 1994 Video/Data Projectors 9 9 9 10 VCRs 12 14 12 12 Video/Data Monitors 10 10 8 10 Slide Projectors 18 18 18 18 Tape Players 21 23 28 32 Sound Systems 7 9 9 9 Overhead Projectors 14 14 17 9 Videodisc Players 3 3 3 2 Personal Computers 6 8 8 9 TOTAL 100 108 112 111 Classrooms (level of installed equipment) 1991 1992 1993 1994
file:///H|/Common/Admin%20&%20Office%20Productivity/Planning%20Website/ira/factbook/facts95/academic.html (7 of 14)10/24/2008 2:41:43 PM
CMU Teaching and Academic Support Data
Overhead Projector 58 54 83 83 Video Viewing 22 28 35 38 Data Viewing 9 9 10 11 TOTAL 89 91 128 132 Video Viewing Cluster 1991 1992 1993 1994 VCR carrels 13 13 14 19 Videodisc/VCR carrels 6 8 9 11 Interactive carrels 2 2 2 3 Videotapes viewed in carrels 16,001 16,379 17,146 13,205 Videotapes previewed by Faculty 590 588 730 712 Videotapes used in class 427 567 924 1,050 TOTAL 7,018 17,534 18,800 15,083 Student Video Editing Cluster 1991 1992 1993 1994 S-VHS stations 2 2 2 0 VHS stations 2 2 2 0 Hi-8 stations 0 1 2 0 Circulating VHS camcorders 13 15 16 14 Circulating Hi-8 camcorders 0 5 5 4
file:///H|/Common/Admin%20&%20Office%20Productivity/Planning%20Website/ira/factbook/facts95/academic.html (8 of 14)10/24/2008 2:41:43 PM
CMU Teaching and Academic Support Data
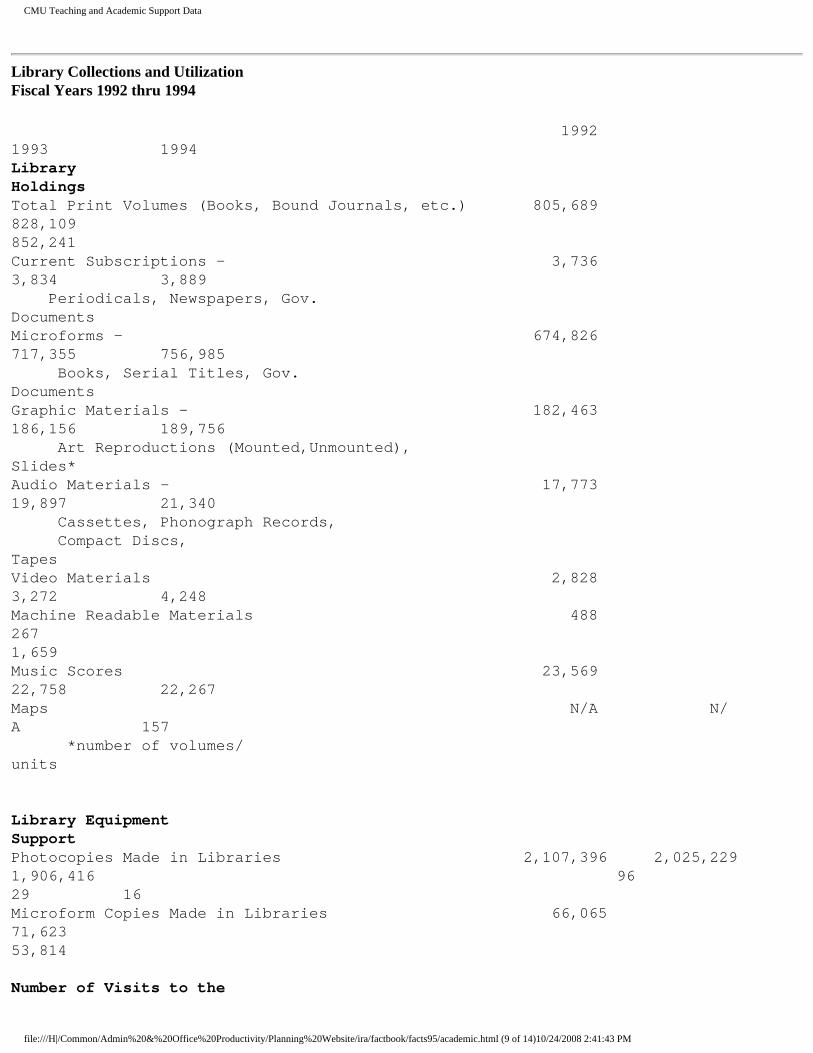
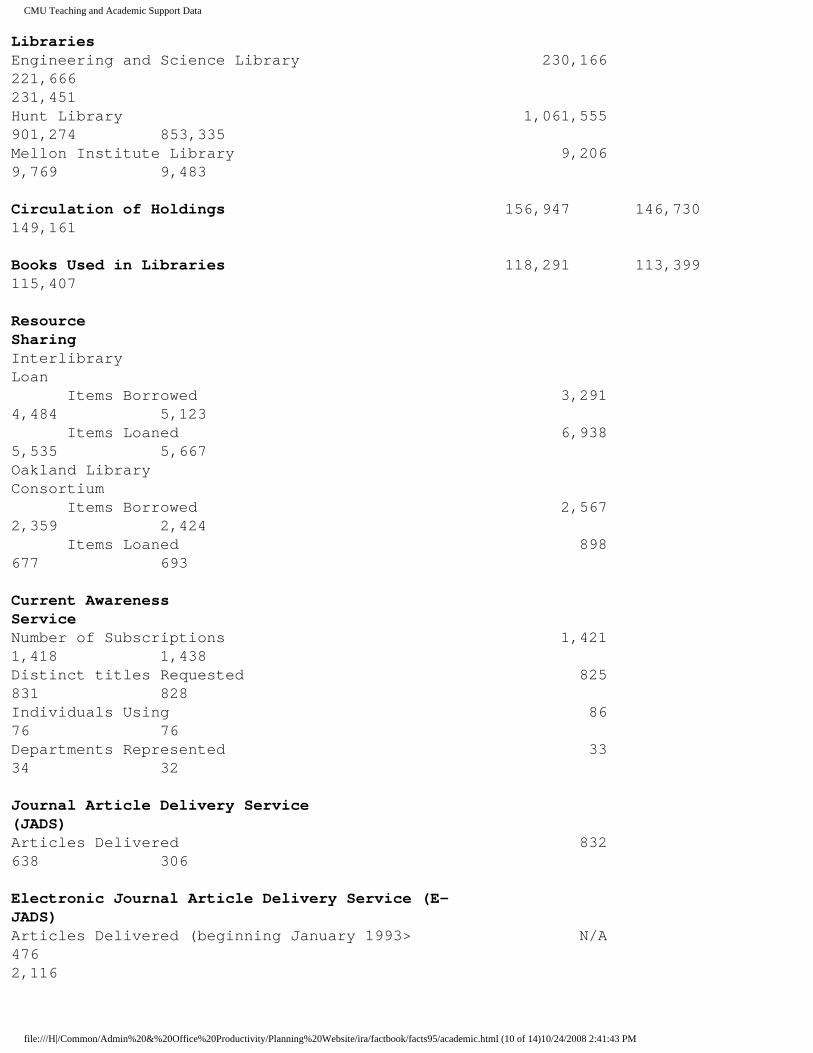
Library Collections and Utilization Fiscal Years 1992 thru 1994
1992 1993 1994 Library Holdings Total Print Volumes (Books, Bound Journals, etc.) 805,689 828,109 852,241 Current Subscriptions - 3,736 3,834 3,889 Periodicals, Newspapers, Gov. Documents Microforms - 674,826 717,355 756,985 Books, Serial Titles, Gov. Documents Graphic Materials - 182,463 186,156 189,756 Art Reproductions (Mounted,Unmounted), Slides* Audio Materials - 17,773 19,897 21,340 Cassettes, Phonograph Records, Compact Discs, Tapes Video Materials 2,828 3,272 4,248 Machine Readable Materials 488 267 1,659 Music Scores 23,569 22,758 22,267 Maps N/A N/A 157 *number of volumes/units Library Equipment Support Photocopies Made in Libraries 2,107,396 2,025,229 1,906,416 96 29 16 Microform Copies Made in Libraries 66,065 71,623 53,814 Number of Visits to the
file:///H|/Common/Admin%20&%20Office%20Productivity/Planning%20Website/ira/factbook/facts95/academic.html (9 of 14)10/24/2008 2:41:43 PM
CMU Teaching and Academic Support Data
Libraries Engineering and Science Library 230,166 221,666 231,451 Hunt Library 1,061,555 901,274 853,335 Mellon Institute Library 9,206 9,769 9,483 Circulation of Holdings 156,947 146,730 149,161 Books Used in Libraries 118,291 113,399 115,407 Resource Sharing Interlibrary Loan Items Borrowed 3,291 4,484 5,123 Items Loaned 6,938 5,535 5,667 Oakland Library Consortium Items Borrowed 2,567 2,359 2,424 Items Loaned 898 677 693 Current Awareness Service Number of Subscriptions 1,421 1,418 1,438 Distinct titles Requested 825 831 828 Individuals Using 86 76 76 Departments Represented 33 34 32 Journal Article Delivery Service (JADS) Articles Delivered 832 638 306 Electronic Journal Article Delivery Service (E-JADS) Articles Delivered (beginning January 1993> N/A 476 2,116
file:///H|/Common/Admin%20&%20Office%20Productivity/Planning%20Website/ira/factbook/facts95/academic.html (10 of 14)10/24/2008 2:41:43 PM
CMU Teaching and Academic Support Data
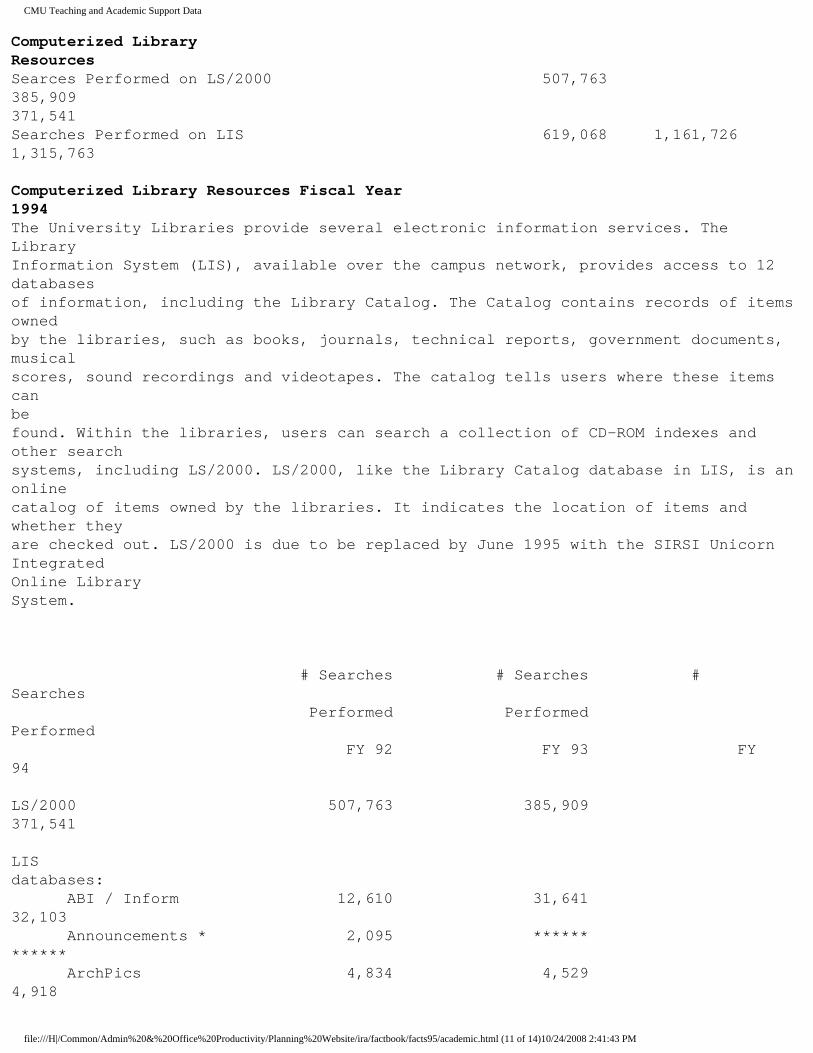
Computerized Library Resources Searces Performed on LS/2000 507,763 385,909 371,541 Searches Performed on LIS 619,068 1,161,726 1,315,763
Computerized Library Resources Fiscal Year 1994 The University Libraries provide several electronic information services. The Library Information System (LIS), available over the campus network, provides access to 12 databases of information, including the Library Catalog. The Catalog contains records of items owned by the libraries, such as books, journals, technical reports, government documents, musical scores, sound recordings and videotapes. The catalog tells users where these items can be found. Within the libraries, users can search a collection of CD-ROM indexes and other search systems, including LS/2000. LS/2000, like the Library Catalog database in LIS, is an online catalog of items owned by the libraries. It indicates the location of items and whether they are checked out. LS/2000 is due to be replaced by June 1995 with the SIRSI Unicorn Integrated Online Library System. # Searches # Searches # Searches Performed Performed Performed FY 92 FY 93 FY 94
LS/2000 507,763 385,909 371,541 LIS databases: ABI / Inform 12,610 31,641 32,103 Announcements * 2,095 ****** ****** ArchPics 4,834 4,529 4,918
file:///H|/Common/Admin%20&%20Office%20Productivity/Planning%20Website/ira/factbook/facts95/academic.html (11 of 14)10/24/2008 2:41:43 PM

CMU Teaching and Academic Support Data
Bibliographies * 2,948 ****** ****** Business * 3,982 ****** ****** Business Dateline N/A 11,097 24,657 Choice Book Reviews * N/A 2,587 99 Computer Database 16,298 18,563 18,464 Dictionary 31,905 52,340 64,352 Encyclopedia 46,152 48,058 52,890 ICPSR * 347 ****** ****** INSPEC 38,148 67,844 84,636 Journal List 34,882 49,921 59,470 Library Catalog 313,482 684,661 757,615 Magazine Index * 18,738 ****** ****** Management Contents * 2,267 ****** ****** Newspaper Index * 6,572 ****** ****** Newspaper Abstracts 10,699 30,238 30,947 Periodical Abstracts 30,874 83,535 96,834 Who's Who at CMU 47,802 76,712 82,759 Research Directory N/A N/A 4,121 Materials Science N/A N/A 1,898 TOTAL 624,635 1,161,726 1,315,763 * this database is no longer on LIS
Teaching and Academic Support Additional Facts and Figures
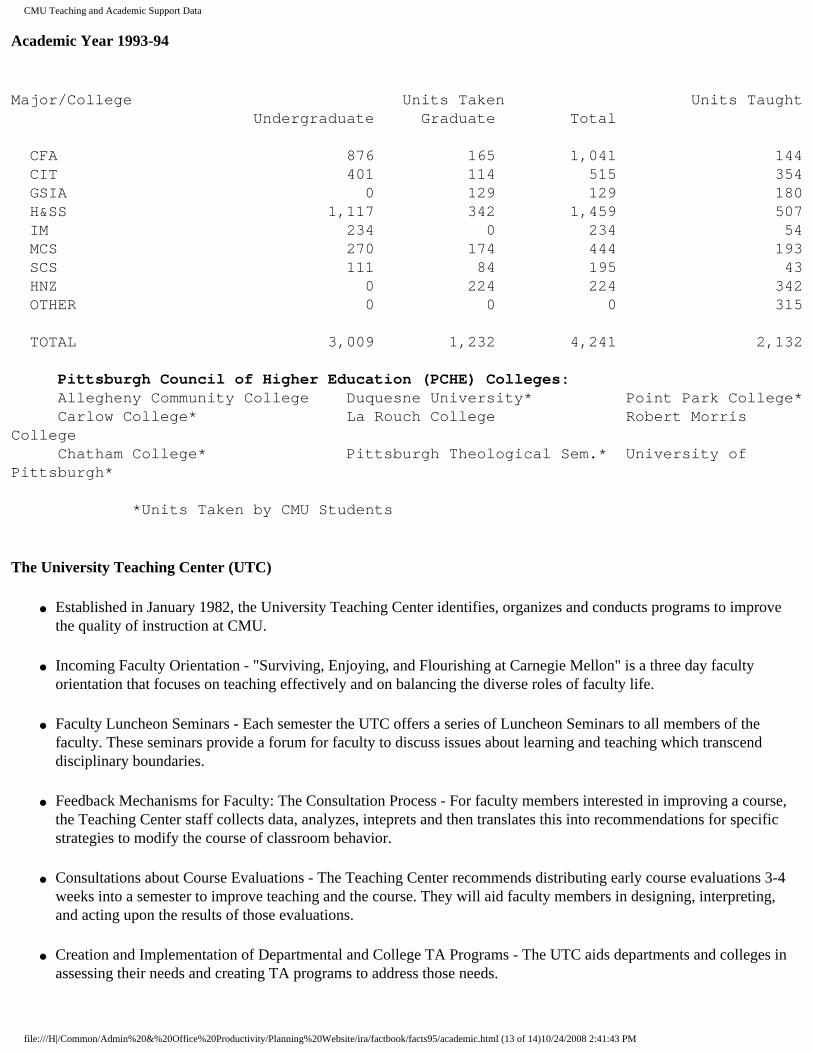
Pittsburgh Council of Higher Education (PCHE) Units Taken by CMU Students, By Level and College
file:///H|/Common/Admin%20&%20Office%20Productivity/Planning%20Website/ira/factbook/facts95/academic.html (12 of 14)10/24/2008 2:41:43 PM
CMU Teaching and Academic Support Data
Academic Year 1993-94
Major/College Units Taken Units Taught Undergraduate Graduate Total
CFA 876 165 1,041 144 CIT 401 114 515 354 GSIA 0 129 129 180 H&SS 1,117 342 1,459 507 IM 234 0 234 54 MCS 270 174 444 193 SCS 111 84 195 43 HNZ 0 224 224 342 OTHER 0 0 0 315
TOTAL 3,009 1,232 4,241 2,132
Pittsburgh Council of Higher Education (PCHE) Colleges: Allegheny Community College Duquesne University* Point Park College* Carlow College* La Rouch College Robert Morris College Chatham College* Pittsburgh Theological Sem.* University of Pittsburgh*
*Units Taken by CMU Students
The University Teaching Center (UTC)
● Established in January 1982, the University Teaching Center identifies, organizes and conducts programs to improve the quality of instruction at CMU.
● Incoming Faculty Orientation - "Surviving, Enjoying, and Flourishing at Carnegie Mellon" is a three day faculty orientation that focuses on teaching effectively and on balancing the diverse roles of faculty life.
● Faculty Luncheon Seminars - Each semester the UTC offers a series of Luncheon Seminars to all members of the faculty. These seminars provide a forum for faculty to discuss issues about learning and teaching which transcend disciplinary boundaries.
● Feedback Mechanisms for Faculty: The Consultation Process - For faculty members interested in improving a course, the Teaching Center staff collects data, analyzes, inteprets and then translates this into recommendations for specific strategies to modify the course of classroom behavior.
● Consultations about Course Evaluations - The Teaching Center recommends distributing early course evaluations 3-4 weeks into a semester to improve teaching and the course. They will aid faculty members in designing, interpreting, and acting upon the results of those evaluations.
● Creation and Implementation of Departmental and College TA Programs - The UTC aids departments and colleges in assessing their needs and creating TA programs to address those needs.
file:///H|/Common/Admin%20&%20Office%20Productivity/Planning%20Website/ira/factbook/facts95/academic.html (13 of 14)10/24/2008 2:41:43 PM
CMU Teaching and Academic Support Data
● Graduate Student Seminar Series - The UTC offers modules and special topic sessions on issues surrounding teaching and learning for those TA's currently teaching or planning to teach in the future.
● Response to the Changing Needs of Departments and College - The University Teaching Center offers expertise and resources to departments and colleges to meet their changing needs.
[Top of this page] [Fact Book Main Page] [Next Section: Faculty and Staff Data]
Last update: 7/12/95
file:///H|/Common/Admin%20&%20Office%20Productivity/Planning%20Website/ira/factbook/facts95/academic.html (14 of 14)10/24/2008 2:41:43 PM
CMU Faculty Data
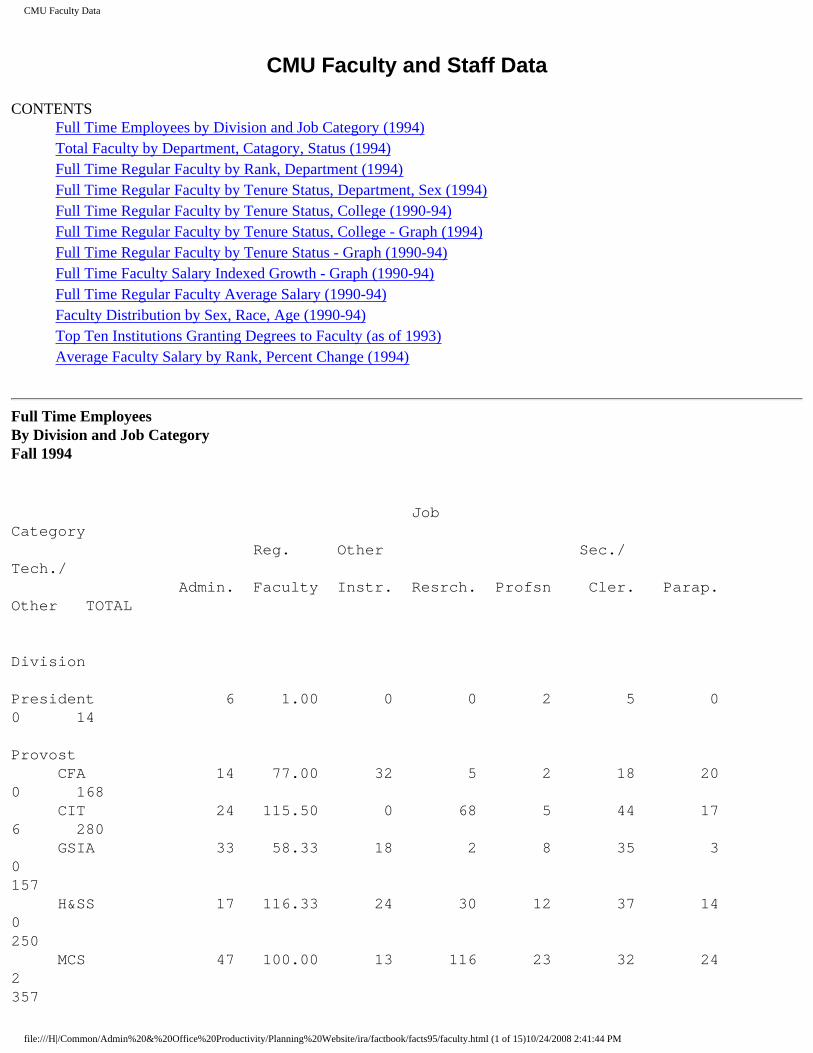
CMU Faculty and Staff Data
CONTENTS Full Time Employees by Division and Job Category (1994) Total Faculty by Department, Catagory, Status (1994) Full Time Regular Faculty by Rank, Department (1994) Full Time Regular Faculty by Tenure Status, Department, Sex (1994) Full Time Regular Faculty by Tenure Status, College (1990-94) Full Time Regular Faculty by Tenure Status, College - Graph (1994) Full Time Regular Faculty by Tenure Status - Graph (1990-94) Full Time Faculty Salary Indexed Growth - Graph (1990-94) Full Time Regular Faculty Average Salary (1990-94) Faculty Distribution by Sex, Race, Age (1990-94) Top Ten Institutions Granting Degrees to Faculty (as of 1993) Average Faculty Salary by Rank, Percent Change (1994)
Full Time Employees By Division and Job Category Fall 1994
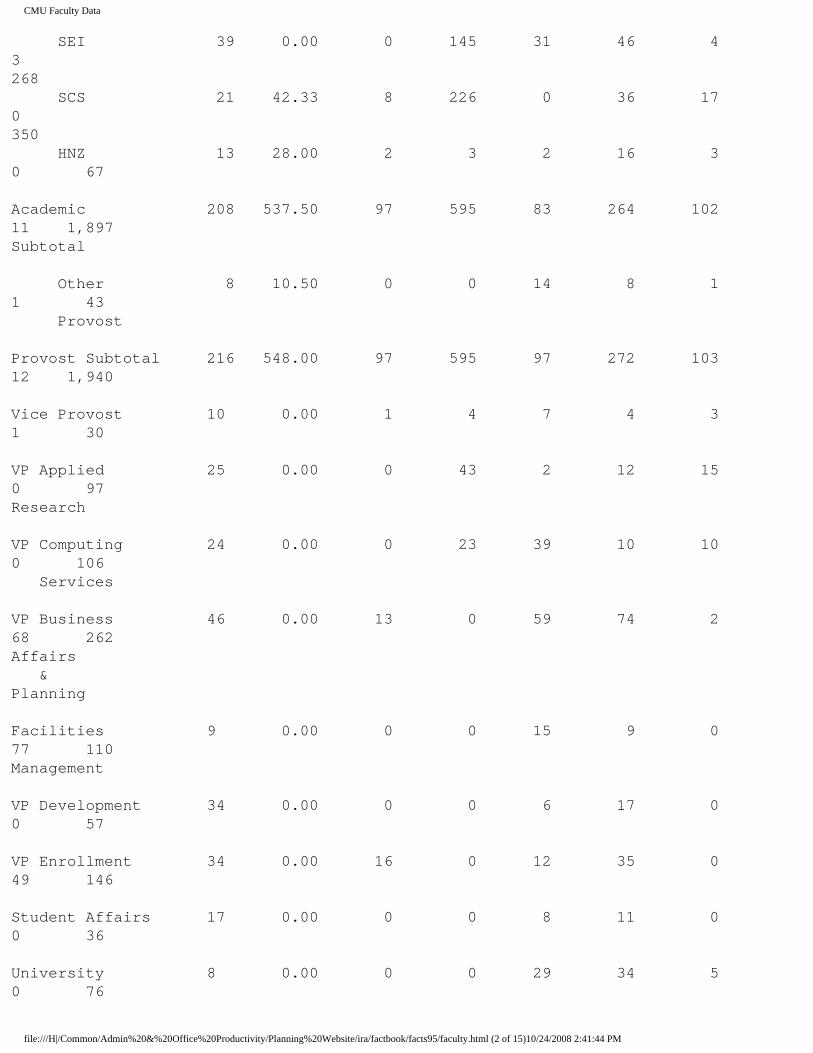
Job Category Reg. Other Sec./ Tech./ Admin. Faculty Instr. Resrch. Profsn Cler. Parap. Other TOTAL Division President 6 1.00 0 0 2 5 0 0 14 Provost CFA 14 77.00 32 5 2 18 20 0 168 CIT 24 115.50 0 68 5 44 17 6 280 GSIA 33 58.33 18 2 8 35 3 0 157 H&SS 17 116.33 24 30 12 37 14 0 250 MCS 47 100.00 13 116 23 32 24 2 357
file:///H|/Common/Admin%20&%20Office%20Productivity/Planning%20Website/ira/factbook/facts95/faculty.html (1 of 15)10/24/2008 2:41:44 PM
CMU Faculty Data
SEI 39 0.00 0 145 31 46 4 3 268 SCS 21 42.33 8 226 0 36 17 0 350 HNZ 13 28.00 2 3 2 16 3 0 67 Academic 208 537.50 97 595 83 264 102 11 1,897 Subtotal Other 8 10.50 0 0 14 8 1 1 43 Provost Provost Subtotal 216 548.00 97 595 97 272 103 12 1,940 Vice Provost 10 0.00 1 4 7 4 3 1 30 VP Applied 25 0.00 0 43 2 12 15 0 97 Research VP Computing 24 0.00 0 23 39 10 10 0 106 Services VP Business 46 0.00 13 0 59 74 2 68 262 Affairs & Planning Facilities 9 0.00 0 0 15 9 0 77 110 Management VP Development 34 0.00 0 0 6 17 0 0 57 VP Enrollment 34 0.00 16 0 12 35 0 49 146 Student Affairs 17 0.00 0 0 8 11 0 0 36 University 8 0.00 0 0 29 34 5 0 76
file:///H|/Common/Admin%20&%20Office%20Productivity/Planning%20Website/ira/factbook/facts95/faculty.html (2 of 15)10/24/2008 2:41:44 PM

CMU Faculty Data
Libraries VP University 12 0.00 1 0 17 22 9 0 61 Relations TOTAL 441 549 128 665 293 505 147 207 2,935
Total Faculty by Department, Category, and Status Fall Semester 1994
Regular Research TOTAL Faculty Faculty Special Faculty
College Full Full Full Part Total Department CFA Architecture 16.00 0.00 5.00 17.00 22.00 38.00 Art 16.00 0.00 7.00 18.00 25.00 41.00 Design 11.00 0.00 3.00 9.00 12.00 23.00 Drama 17.00 0.00 17.00 7.00 24.00 41.00 Music 16.00 0.00 4.00 51.00 55.00 71.00 Prep Sch 0.00 0.00 1.00 21.00 22.00 22.00 Ext Dean's Ofc. 1.00 0.00 0.00 2.00 2.00 3.00 TOTAL CFA 77.00 0.00 37.00 125.00 162.00 239.00 CIT Biomedical E. 0.00 0.00 1.00 2.00 3.00 3.00 Chemical E. 18.00 0.00 6.00 1.00 7.00 25.00 Civil E. 16.50 0.00 1.00 0.00 1.00 17.50 E & C E. 34.00 2.00 13.00 0.00 13.00 49.00
file:///H|/Common/Admin%20&%20Office%20Productivity/Planning%20Website/ira/factbook/facts95/faculty.html (3 of 15)10/24/2008 2:41:44 PM

CMU Faculty Data
EPP 6.00 4.00 1.00 0.00 1.00 11.00 Mechanical E. 24.00 0.00 9.00 2.00 11.00 35.00 MEMS 17.00 1.00 10.00 1.00 11.00 29.00 EDRC 0.00 5.00 0.00 0.00 0.00 5.00 Dean's Ofc. 0.00 0.00 0.00 0.00 0.00 0.00 TOTAL CIT 115.50 12.00 41.00 6.00 47.00 174.50 GSIA 58.33 0.00 23.00 11.00 34.00 92.33 H&SS English 25.00 0.00 5.00 13.00 18.00 43.00 History 18.00 0.00 1.00 2.00 3.00 21.00 Mod. Lang. 7.00 1.00 1.00 12.00 13.00 21.00 Philosophy 13.00 1.00 1.00 0.00 1.00 15.00 Psychology 24.00 0.00 18.00 1.00 19.00 43.00 S & D S. 15.33 0.00 0.00 2.00 2.00 17.33 Statistics 14.00 0.50 4.00 0.00 4.00 18.50 Acad Adv Ctr. 0.00 0.00 0.00 1.00 1.00 1.00 CAAE 0.00 0.00 0.00 1.00 1.00 1.00 TOTAL H&SS 16.33 2.50 30.00 32.00 62.00 180.83 MCS Biology 18.00 1.00 19.00 1.00 20.00 39.00 Chemistry 22.00 0.00 14.00 0.00 14.00 36.00 Math 26.00 0.00 14.00 1.00 15.00 41.00 Physics 34.00 0.00 9.00 0.00 9.00 43.00 STC 0.00 0.00 10.00 0.00 10.00 10.00 Dean's Ofc. 0.00 0.00 0.00 0.00 0.00 0.00 TOTAL MCS 100.00 1.00 66.00 2.00 68.00 169.00
file:///H|/Common/Admin%20&%20Office%20Productivity/Planning%20Website/ira/factbook/facts95/faculty.html (4 of 15)10/24/2008 2:41:44 PM
CMU Faculty Data
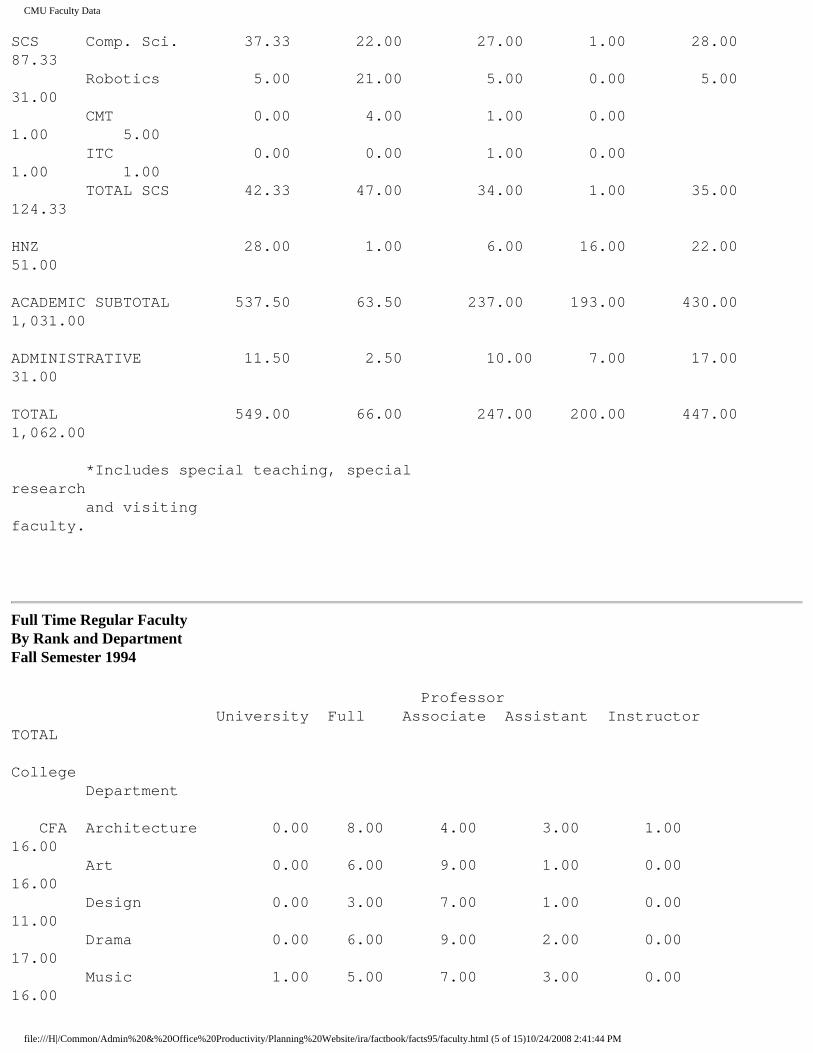
SCS Comp. Sci. 37.33 22.00 27.00 1.00 28.00 87.33 Robotics 5.00 21.00 5.00 0.00 5.00 31.00 CMT 0.00 4.00 1.00 0.00 1.00 5.00 ITC 0.00 0.00 1.00 0.00 1.00 1.00 TOTAL SCS 42.33 47.00 34.00 1.00 35.00 124.33 HNZ 28.00 1.00 6.00 16.00 22.00 51.00 ACADEMIC SUBTOTAL 537.50 63.50 237.00 193.00 430.00 1,031.00 ADMINISTRATIVE 11.50 2.50 10.00 7.00 17.00 31.00 TOTAL 549.00 66.00 247.00 200.00 447.00 1,062.00 *Includes special teaching, special research and visiting faculty.
Full Time Regular Faculty By Rank and Department Fall Semester 1994
Professor University Full Associate Assistant Instructor TOTAL
College Department CFA Architecture 0.00 8.00 4.00 3.00 1.00 16.00 Art 0.00 6.00 9.00 1.00 0.00 16.00 Design 0.00 3.00 7.00 1.00 0.00 11.00 Drama 0.00 6.00 9.00 2.00 0.00 17.00 Music 1.00 5.00 7.00 3.00 0.00 16.00
file:///H|/Common/Admin%20&%20Office%20Productivity/Planning%20Website/ira/factbook/facts95/faculty.html (5 of 15)10/24/2008 2:41:44 PM

CMU Faculty Data
Dean's Ofc. 0.00 0.00 0.00 1.00 0.00 1.00 TOTAL CFA 1.00 28.00 36.00 11.00 1.00 77.00 CIT Biomedical E. 0.00 0.00 0.00 0.00 0.00 0.00 Chemical E. 0.00 11.50 2.50 4.00 0.00 18.00 Civil E. 1.00 8.50 6.00 1.00 0.00 16.50 E & C E. 0.00 26.00 4.00 4.00 0.00 34.00 EPP 0.00 4.00 2.00 0.00 0.00 6.00 Mechanical E. 0.00 11.00 4.00 5.00 4.00 24.00 MEMS 1.00 10.00 2.00 4.00 0.00 17.00 Dean's Ofc. 0.00 0.00 0.00 0.00 0.00 0.00 TOTAL CIT 2.00 71.00 20.50 18.00 4.00 115.50 GSIA 4.00 16.33 17.00 18.00 3.00 58.33 H&SS English 0.00 11.00 6.00 8.00 0.00 25.00 History 0.00 9.00 6.00 3.00 0.00 18.00 Mod. Lang. 0.00 2.00 1.00 4.00 0.00 7.00 Philosophy 0.00 5.00 4.00 4.00 0.00 13.00 Psychology 1.00 13.00 3.00 7.00 0.00 24.00 S & D S. 2.00 4.33 3.00 6.00 0.00 15.33 Statistics 0.00 6.00 4.00 4.00 0.00 14.00 TOTAL H&SS 3.00 50.33 27.00 36.00 0.00 116.33 MCS Biology 0.00 8.00 7.00 3.00 0.00 18.00 Chemistry 0.00 11.00 5.00 6.00 0.00 22.00 Math 1.00 17.00 6.00 2.00 0.00 26.00 Physics 2.00 22.00 8.00 2.00 0.00 34.00
file:///H|/Common/Admin%20&%20Office%20Productivity/Planning%20Website/ira/factbook/facts95/faculty.html (6 of 15)10/24/2008 2:41:44 PM
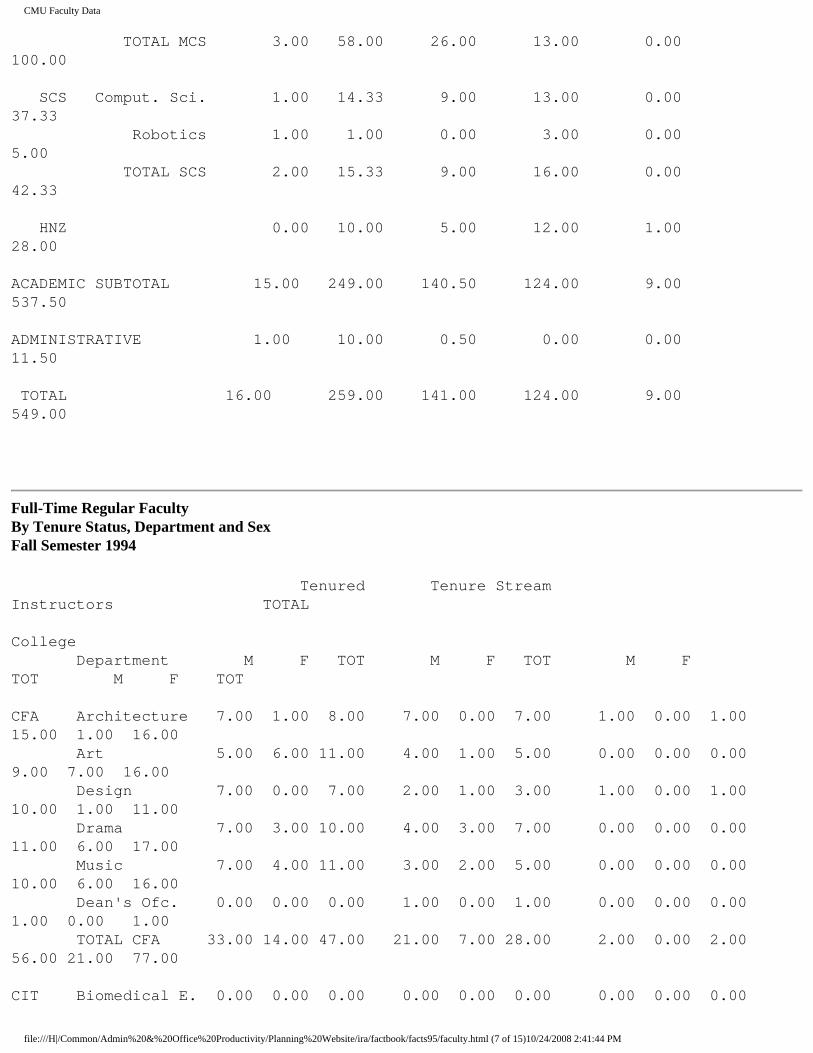
CMU Faculty Data
TOTAL MCS 3.00 58.00 26.00 13.00 0.00 100.00 SCS Comput. Sci. 1.00 14.33 9.00 13.00 0.00 37.33 Robotics 1.00 1.00 0.00 3.00 0.00 5.00 TOTAL SCS 2.00 15.33 9.00 16.00 0.00 42.33 HNZ 0.00 10.00 5.00 12.00 1.00 28.00 ACADEMIC SUBTOTAL 15.00 249.00 140.50 124.00 9.00 537.50 ADMINISTRATIVE 1.00 10.00 0.50 0.00 0.00 11.50 TOTAL 16.00 259.00 141.00 124.00 9.00 549.00
Full-Time Regular Faculty By Tenure Status, Department and Sex Fall Semester 1994
Tenured Tenure Stream Instructors TOTAL College Department M F TOT M F TOT M F TOT M F TOT CFA Architecture 7.00 1.00 8.00 7.00 0.00 7.00 1.00 0.00 1.00 15.00 1.00 16.00 Art 5.00 6.00 11.00 4.00 1.00 5.00 0.00 0.00 0.00 9.00 7.00 16.00 Design 7.00 0.00 7.00 2.00 1.00 3.00 1.00 0.00 1.00 10.00 1.00 11.00 Drama 7.00 3.00 10.00 4.00 3.00 7.00 0.00 0.00 0.00 11.00 6.00 17.00 Music 7.00 4.00 11.00 3.00 2.00 5.00 0.00 0.00 0.00 10.00 6.00 16.00 Dean's Ofc. 0.00 0.00 0.00 1.00 0.00 1.00 0.00 0.00 0.00 1.00 0.00 1.00 TOTAL CFA 33.00 14.00 47.00 21.00 7.00 28.00 2.00 0.00 2.00 56.00 21.00 77.00 CIT Biomedical E. 0.00 0.00 0.00 0.00 0.00 0.00 0.00 0.00 0.00
file:///H|/Common/Admin%20&%20Office%20Productivity/Planning%20Website/ira/factbook/facts95/faculty.html (7 of 15)10/24/2008 2:41:44 PM

CMU Faculty Data
0.00 0.00 0.00 Chemical E. 12.00 0.00 12.00 5.00 1.00 6.00 0.00 0.00 0.00 17.00 1.00 18.00 Civil E. 8.50 1.00 9.50 5.00 2.00 7.00 0.00 0.00 0.00 13.50 3.00 16.50 E & C E. 26.00 0.00 26.00 6.00 1.00 7.00 1.00 0.00 1.00 33.00 1.00 34.00 EPP 3.00 0.00 3.00 1.00 1.00 2.00 1.00 0.00 1.00 5.00 1.00 6.00 Mechanical E. 13.00 0.00 13.00 6.00 1.00 7.00 4.00 0.00 4.00 23.00 1.00 24.00 MEMS 10.00 0.00 10.00 5.00 1.00 6.00 1.00 0.00 1.00 16.00 1.00 17.00 Dean's Ofc. 0.00 0.00 0.00 0.00 0.00 0.00 0.00 0.00 0.00 0.00 0.00 0.00 TOTAL CIT 72.50 1.00 73.50 28.00 7.00 35.00 7.00 0.00 7.00 107.50 8.00 115.50 GSIA 24.33 1.00 25.33 25.00 4.00 29.00 3.00 1.00 4.00 52.33 6.00 58.33 H&SS English 11.00 5.00 16.00 2.00 7.00 9.00 0.00 0.00 0.00 13.00 12.00 25.00 History 12.00 2.00 14.00 1.00 3.00 4.00 0.00 0.00 0.00 13.00 5.00 18.00 Mod. Lang. 1.00 1.00 2.00 2.00 3.00 5.00 0.00 0.00 0.00 3.00 4.00 7.00 Philosophy 7.00 1.00 8.00 5.00 0.00 5.00 0.00 0.00 0.00 12.00 1.00 13.00 Psychology 11.00 5.00 16.00 4.00 4.00 8.00 0.00 0.00 0.00 15.00 9.00 24.00 S & D S. 6.33 2.00 8.33 6.00 1.00 7.00 0.00 0.00 0.00 12.30 3.00 15.33 Statistics 7.00 1.00 8.00 5.00 1.00 6.00 0.00 0.00 0.00 12.00 2.00 14.00 TOTAL H&SS 55.33 17.00 72.33 25.00 19.00 44.00 0.00 0.00 0.00 80.33 36.00 116.33 MCS Biology 13.00 1.00 14.00 4.00 0.00 4.00 0.00 0.00 0.00 17.00 1.00 18.00 Chemistry 15.00 0.00 15.00 5.00 2.00 7.00 0.00 0.00 0.00 20.00 2.00 22.00 Math 20.00 1.00 21.00 5.00 0.00 5.00 0.00 0.00 0.00 25.00 1.00 26.00 Physics 27.00 0.00 27.00 6.00 1.00 7.00 0.00 0.00 0.00 33.00 1.00 34.00 TOTAL MCS 75.00 2.00 77.00 20.00 3.00 23.00 0.00 0.00 0.00 95.00 5.00 100.00 SCS Comp. Sci. 18.33 2.00 20.33 15.00 2.00 17.00 0.00 0.00 0.00 33.33 4.00 37.33
file:///H|/Common/Admin%20&%20Office%20Productivity/Planning%20Website/ira/factbook/facts95/faculty.html (8 of 15)10/24/2008 2:41:44 PM
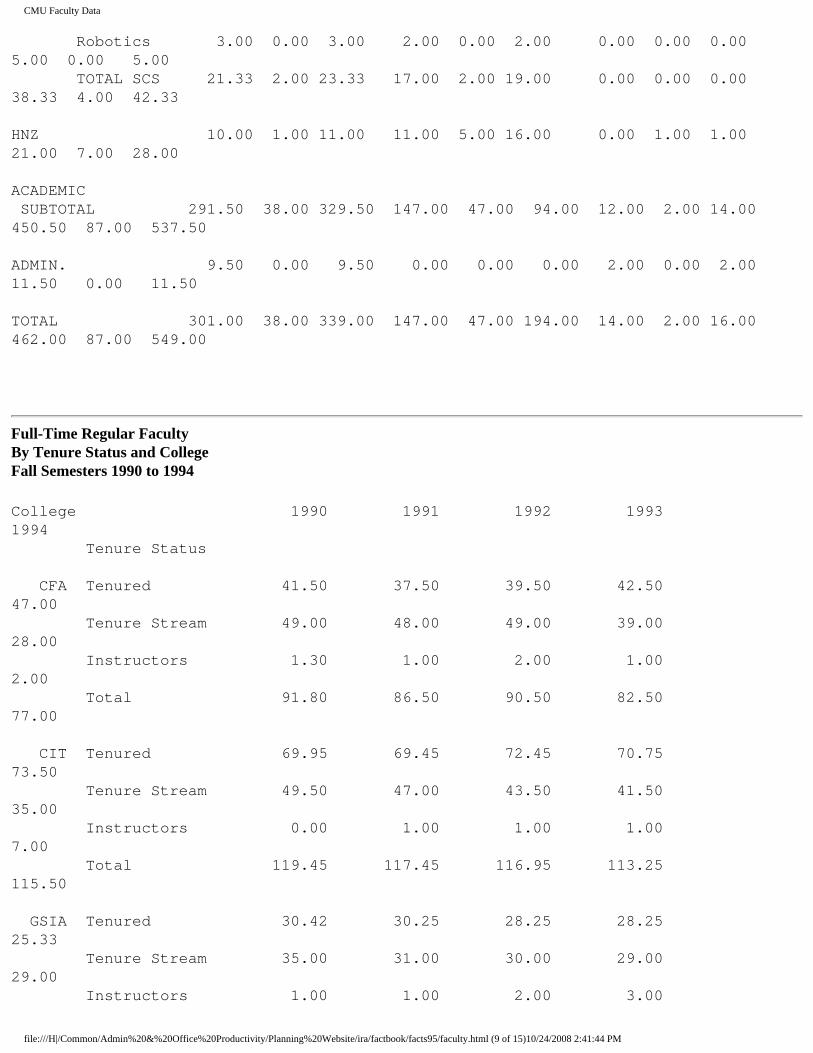
CMU Faculty Data
Robotics 3.00 0.00 3.00 2.00 0.00 2.00 0.00 0.00 0.00 5.00 0.00 5.00 TOTAL SCS 21.33 2.00 23.33 17.00 2.00 19.00 0.00 0.00 0.00 38.33 4.00 42.33 HNZ 10.00 1.00 11.00 11.00 5.00 16.00 0.00 1.00 1.00 21.00 7.00 28.00 ACADEMIC SUBTOTAL 291.50 38.00 329.50 147.00 47.00 94.00 12.00 2.00 14.00 450.50 87.00 537.50 ADMIN. 9.50 0.00 9.50 0.00 0.00 0.00 2.00 0.00 2.00 11.50 0.00 11.50 TOTAL 301.00 38.00 339.00 147.00 47.00 194.00 14.00 2.00 16.00 462.00 87.00 549.00
Full-Time Regular Faculty By Tenure Status and College Fall Semesters 1990 to 1994
College 1990 1991 1992 1993 1994 Tenure Status CFA Tenured 41.50 37.50 39.50 42.50 47.00 Tenure Stream 49.00 48.00 49.00 39.00 28.00 Instructors 1.30 1.00 2.00 1.00 2.00 Total 91.80 86.50 90.50 82.50 77.00 CIT Tenured 69.95 69.45 72.45 70.75 73.50 Tenure Stream 49.50 47.00 43.50 41.50 35.00 Instructors 0.00 1.00 1.00 1.00 7.00 Total 119.45 117.45 116.95 113.25 115.50 GSIA Tenured 30.42 30.25 28.25 28.25 25.33 Tenure Stream 35.00 31.00 30.00 29.00 29.00 Instructors 1.00 1.00 2.00 3.00
file:///H|/Common/Admin%20&%20Office%20Productivity/Planning%20Website/ira/factbook/facts95/faculty.html (9 of 15)10/24/2008 2:41:44 PM

CMU Faculty Data
4.00 Total 66.42 62.25 60.25 60.25 58.33 H&SS Tenured 65.25 62.50 68.75 70.00 72.33 Tenure Stream 41.00 46.00 38.50 39.50 44.00 Instructors 0.00 1.00 0.00 1.00 0.00 Total 106.25 109.50 107.25 110.50 116.33 MCS Tenured 74.30 72.30 76.30 76.00 77.00 Tenure Stream 25.00 23.00 21.00 22.00 23.00 Instructors 0.00 0.00 0.00 0.00 0.00 Total 99.30 95.30 97.30 98.00 100.00 SCS Tenured 19.50 18.00 18.00 21.00 23.33 Tenure Stream 20.00 15.00 21.00 22.00 19.00 Instructors 0.00 0.00 1.00 0.00 0.00 Total 39.50 33.00 40.00 43.00 42.33 HNZ Tenured 10.58 8.50 8.75 12.00 11.00 Tenure Stream 14.50 19.00 18.00 16.00 16.00 Instructors 1.70 0.00 0.00 1.00 1.00 Total 26.78 27.50 26.75 29.00 28.00 ACADEMIC SUBTOTAL Tenured 311.50 298.50 312.00 320.50 329.50 Tenure Stream 234.00 229.00 221.00 209.00 194.00 Instructors 4.00 4.00 6.00 7.00 14.00 Total 549.50 531.50 539.00 536.50 537.50 ADMINISTRATIVE
file:///H|/Common/Admin%20&%20Office%20Productivity/Planning%20Website/ira/factbook/facts95/faculty.html (10 of 15)10/24/2008 2:41:44 PM
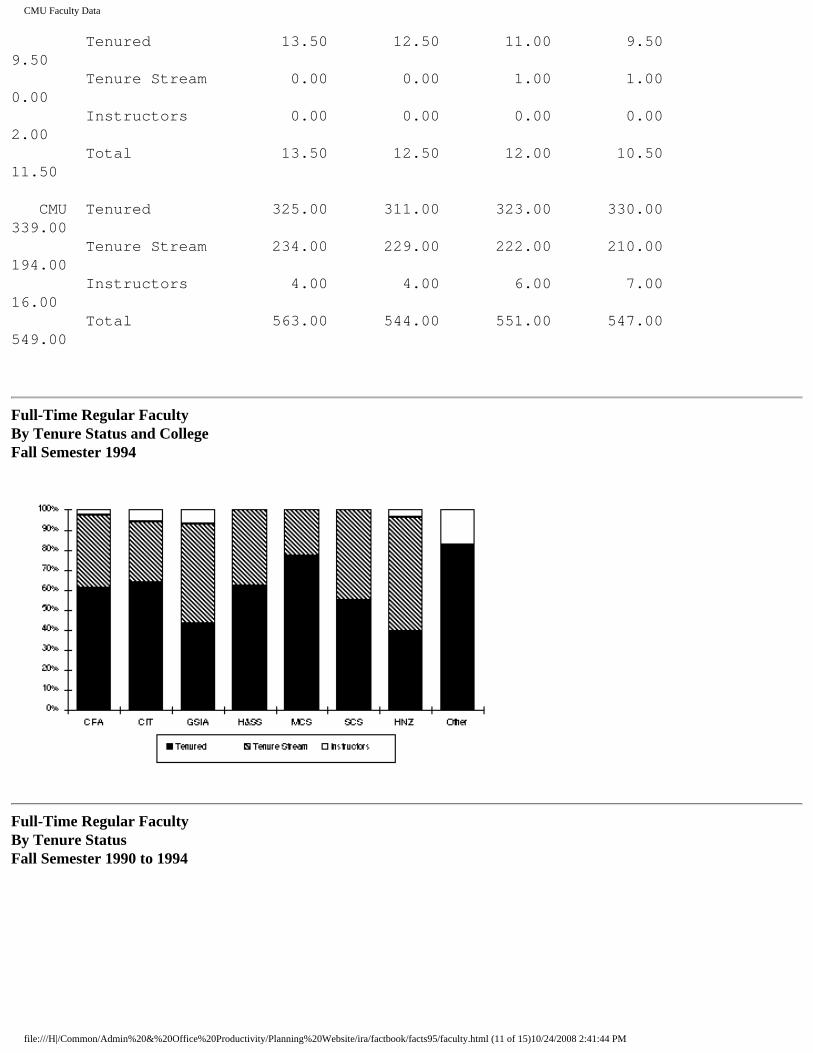
CMU Faculty Data
Tenured 13.50 12.50 11.00 9.50 9.50 Tenure Stream 0.00 0.00 1.00 1.00 0.00 Instructors 0.00 0.00 0.00 0.00 2.00 Total 13.50 12.50 12.00 10.50 11.50 CMU Tenured 325.00 311.00 323.00 330.00 339.00 Tenure Stream 234.00 229.00 222.00 210.00 194.00 Instructors 4.00 4.00 6.00 7.00 16.00 Total 563.00 544.00 551.00 547.00 549.00
Full-Time Regular Faculty By Tenure Status and College Fall Semester 1994
Full-Time Regular Faculty By Tenure Status Fall Semester 1990 to 1994
file:///H|/Common/Admin%20&%20Office%20Productivity/Planning%20Website/ira/factbook/facts95/faculty.html (11 of 15)10/24/2008 2:41:44 PM
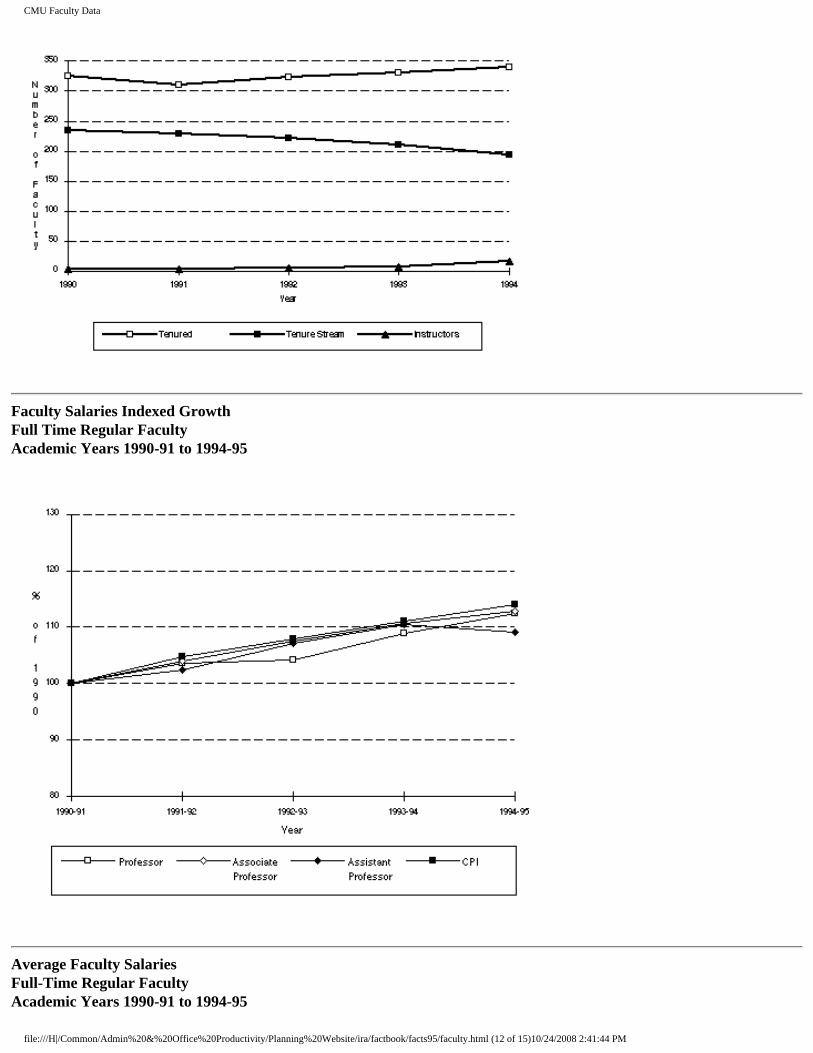
CMU Faculty Data
Faculty Salaries Indexed Growth Full Time Regular Faculty Academic Years 1990-91 to 1994-95
Average Faculty Salaries Full-Time Regular Faculty Academic Years 1990-91 to 1994-95
file:///H|/Common/Admin%20&%20Office%20Productivity/Planning%20Website/ira/factbook/facts95/faculty.html (12 of 15)10/24/2008 2:41:44 PM

CMU Faculty Data
1990-91 1991-92 1992-93 1993-94 1994-95 Professor $76,100 $78,900 $79,300 $82,900 $85,500 Associate Professor $51,100 $53,100 $55,000 $56,600 $57,700 Assistant Professor $46,100 $47,200 $49,400 $50,900 $50,300
Regular Faculty Additional Facts and Figures
Distribution by Sex, Race, and Age Fall 1990 to 1994
Percent of Faculty by Sex 1990 1991 1992 1993 1994
Male 85% 85% 84% 84% 84% Female 15% 15% 16% 16% 16%
Percent of Faculty by Race
Asian 4% 3% 3% 3% 3% Black 1% 1% 1% 1% 1% Hispanic 1% 1% 1% 1% 1% White 77% 77% 77% 76% 77% Non-U.S. ‚itizen 17% 18% 18% 19% 18%
Percent of Faculty by Age
Under 30 4% 4% 3% 1% 1% 30 to 39 36% 34% 34% 32% 33% 40 to 49 31% 31% 33% 35% 34% 50 to 59 17% 19% 18% 20% 20% 60 and over 12% 12% 12% 12% 12%
Top Ten Institutions Granting Degrees to Faculty Fall 1993
Carnegie Mellon University 52 University of Michigan, Ann Arbor 18
file:///H|/Common/Admin%20&%20Office%20Productivity/Planning%20Website/ira/factbook/facts95/faculty.html (13 of 15)10/24/2008 2:41:44 PM
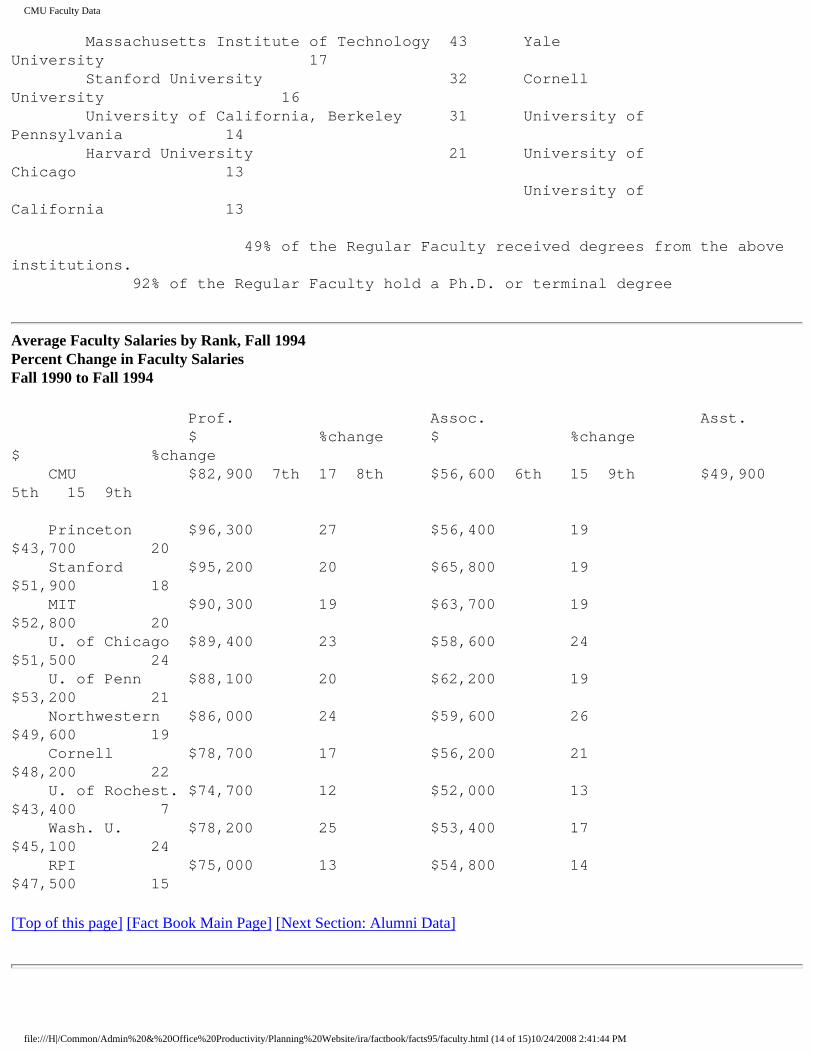
CMU Faculty Data
Massachusetts Institute of Technology 43 Yale University 17 Stanford University 32 Cornell University 16 University of California, Berkeley 31 University of Pennsylvania 14 Harvard University 21 University of Chicago 13 University of California 13
49% of the Regular Faculty received degrees from the above institutions. 92% of the Regular Faculty hold a Ph.D. or terminal degree
Average Faculty Salaries by Rank, Fall 1994 Percent Change in Faculty Salaries Fall 1990 to Fall 1994
Prof. Assoc. Asst. $ %change $ %change $ %change CMU $82,900 7th 17 8th $56,600 6th 15 9th $49,900 5th 15 9th
Princeton $96,300 27 $56,400 19 $43,700 20 Stanford $95,200 20 $65,800 19 $51,900 18 MIT $90,300 19 $63,700 19 $52,800 20 U. of Chicago $89,400 23 $58,600 24 $51,500 24 U. of Penn $88,100 20 $62,200 19 $53,200 21 Northwestern $86,000 24 $59,600 26 $49,600 19 Cornell $78,700 17 $56,200 21 $48,200 22 U. of Rochest. $74,700 12 $52,000 13 $43,400 7 Wash. U. $78,200 25 $53,400 17 $45,100 24 RPI $75,000 13 $54,800 14 $47,500 15
[Top of this page] [Fact Book Main Page] [Next Section: Alumni Data]
file:///H|/Common/Admin%20&%20Office%20Productivity/Planning%20Website/ira/factbook/facts95/faculty.html (14 of 15)10/24/2008 2:41:44 PM

CMU Faculty Data
Last update: 7/12/95
file:///H|/Common/Admin%20&%20Office%20Productivity/Planning%20Website/ira/factbook/facts95/faculty.html (15 of 15)10/24/2008 2:41:44 PM
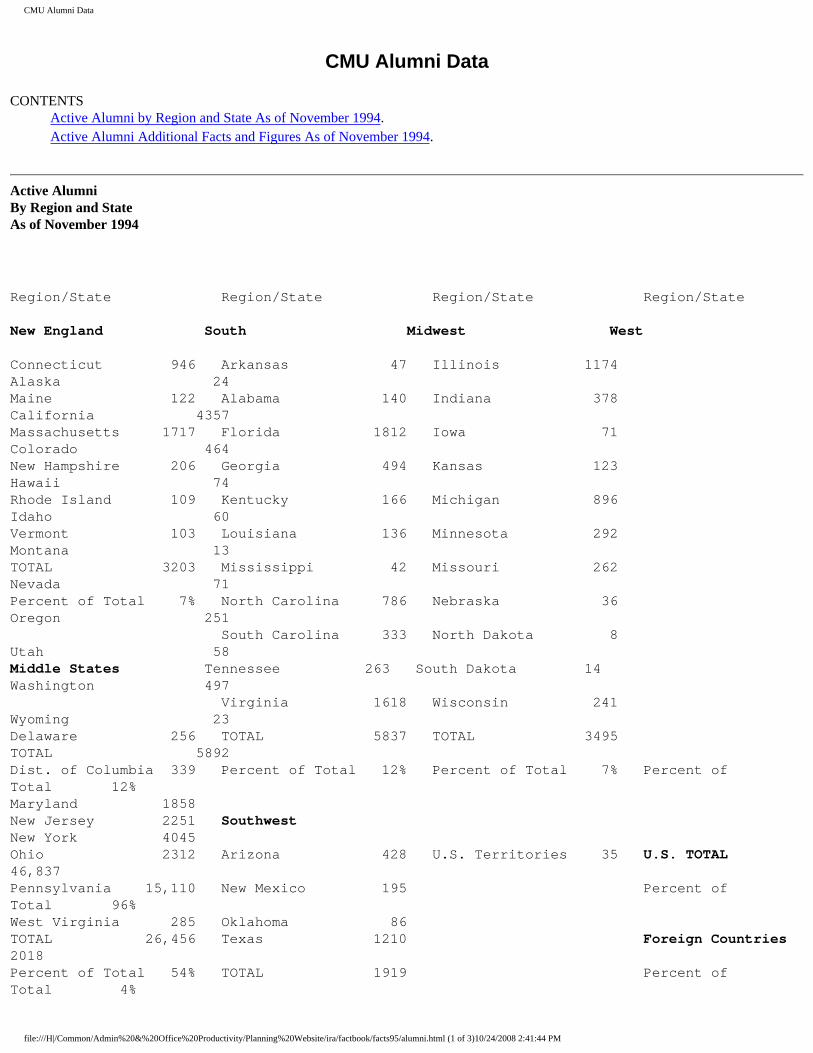
CMU Alumni Data
CMU Alumni Data
CONTENTS Active Alumni by Region and State As of November 1994. Active Alumni Additional Facts and Figures As of November 1994.
Active Alumni By Region and State As of November 1994
Region/State Region/State Region/State Region/State
New England South Midwest West
Connecticut 946 Arkansas 47 Illinois 1174 Alaska 24 Maine 122 Alabama 140 Indiana 378 California 4357 Massachusetts 1717 Florida 1812 Iowa 71 Colorado 464 New Hampshire 206 Georgia 494 Kansas 123 Hawaii 74 Rhode Island 109 Kentucky 166 Michigan 896 Idaho 60 Vermont 103 Louisiana 136 Minnesota 292 Montana 13 TOTAL 3203 Mississippi 42 Missouri 262 Nevada 71 Percent of Total 7% North Carolina 786 Nebraska 36 Oregon 251 South Carolina 333 North Dakota 8 Utah 58Middle States Tennessee 263 South Dakota 14 Washington 497 Virginia 1618 Wisconsin 241 Wyoming 23 Delaware 256 TOTAL 5837 TOTAL 3495 TOTAL 5892 Dist. of Columbia 339 Percent of Total 12% Percent of Total 7% Percent of Total 12% Maryland 1858 New Jersey 2251 SouthwestNew York 4045 Ohio 2312 Arizona 428 U.S. Territories 35 U.S. TOTAL 46,837 Pennsylvania 15,110 New Mexico 195 Percent of Total 96% West Virginia 285 Oklahoma 86 TOTAL 26,456 Texas 1210 Foreign Countries 2018 Percent of Total 54% TOTAL 1919 Percent of Total 4%
file:///H|/Common/Admin%20&%20Office%20Productivity/Planning%20Website/ira/factbook/facts95/alumni.html (1 of 3)10/24/2008 2:41:44 PM
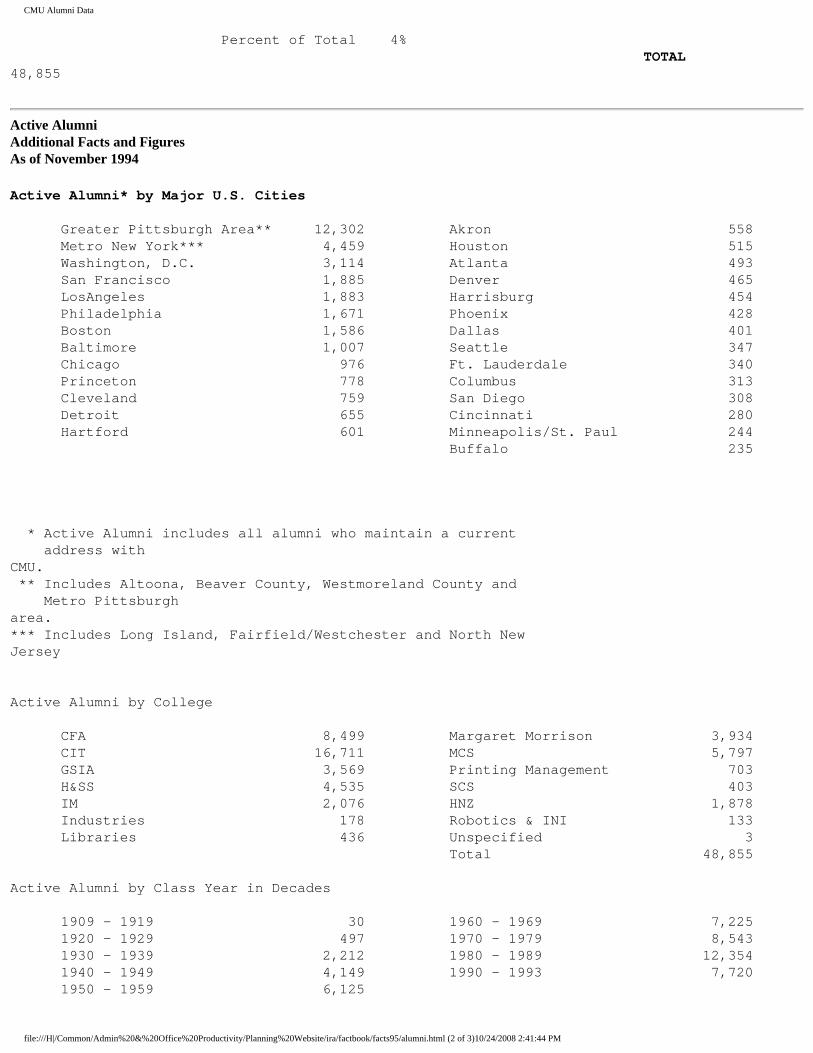
CMU Alumni Data
Percent of Total 4% TOTAL 48,855
Active Alumni Additional Facts and Figures As of November 1994
Active Alumni* by Major U.S. Cities Greater Pittsburgh Area** 12,302 Akron 558 Metro New York*** 4,459 Houston 515 Washington, D.C. 3,114 Atlanta 493 San Francisco 1,885 Denver 465 LosAngeles 1,883 Harrisburg 454 Philadelphia 1,671 Phoenix 428 Boston 1,586 Dallas 401 Baltimore 1,007 Seattle 347 Chicago 976 Ft. Lauderdale 340 Princeton 778 Columbus 313 Cleveland 759 San Diego 308 Detroit 655 Cincinnati 280 Hartford 601 Minneapolis/St. Paul 244 Buffalo 235 * Active Alumni includes all alumni who maintain a current address with CMU. ** Includes Altoona, Beaver County, Westmoreland County and Metro Pittsburgh area. *** Includes Long Island, Fairfield/Westchester and North New Jersey Active Alumni by College CFA 8,499 Margaret Morrison 3,934 CIT 16,711 MCS 5,797 GSIA 3,569 Printing Management 703 H&SS 4,535 SCS 403 IM 2,076 HNZ 1,878 Industries 178 Robotics & INI 133 Libraries 436 Unspecified 3 Total 48,855 Active Alumni by Class Year in Decades 1909 - 1919 30 1960 - 1969 7,225 1920 - 1929 497 1970 - 1979 8,543 1930 - 1939 2,212 1980 - 1989 12,354 1940 - 1949 4,149 1990 - 1993 7,720 1950 - 1959 6,125
file:///H|/Common/Admin%20&%20Office%20Productivity/Planning%20Website/ira/factbook/facts95/alumni.html (2 of 3)10/24/2008 2:41:44 PM
CMU Alumni Data
Total 48,855
[Top of this page] [Fact Book Main Page] [Next Section: Financial Data]
Last update: 7/12/95
file:///H|/Common/Admin%20&%20Office%20Productivity/Planning%20Website/ira/factbook/facts95/alumni.html (3 of 3)10/24/2008 2:41:44 PM
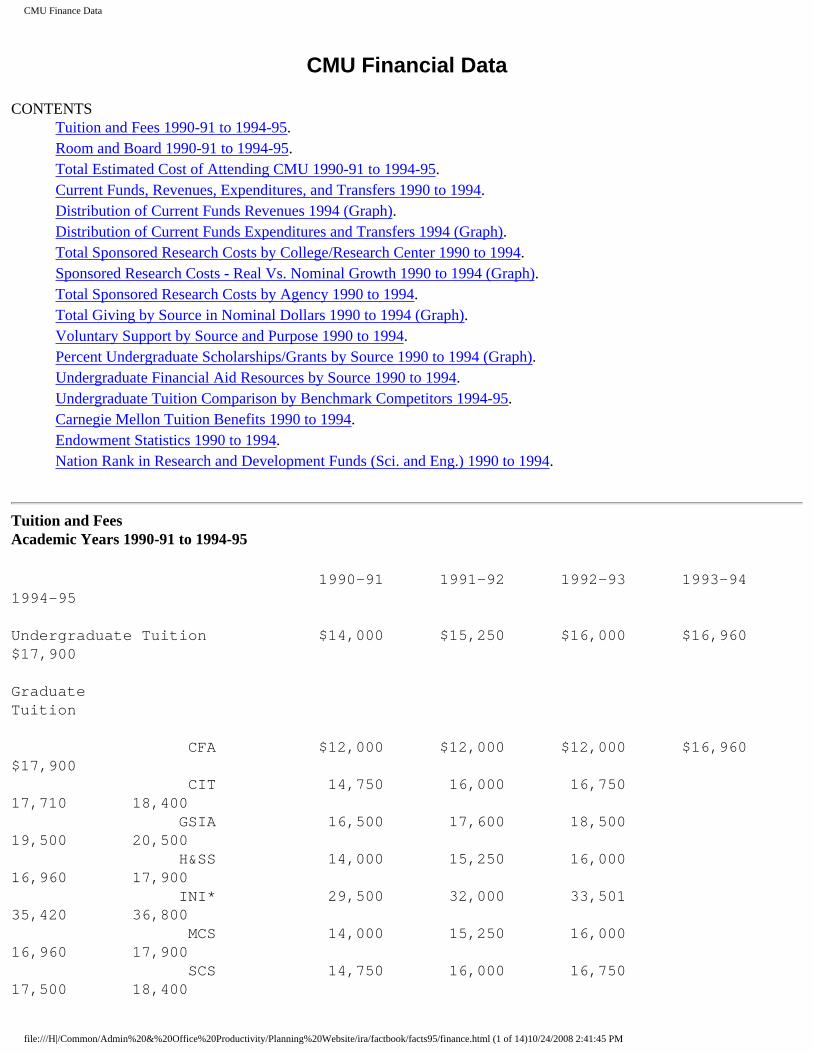
CMU Finance Data
CMU Financial Data
CONTENTS Tuition and Fees 1990-91 to 1994-95. Room and Board 1990-91 to 1994-95. Total Estimated Cost of Attending CMU 1990-91 to 1994-95. Current Funds, Revenues, Expenditures, and Transfers 1990 to 1994. Distribution of Current Funds Revenues 1994 (Graph). Distribution of Current Funds Expenditures and Transfers 1994 (Graph). Total Sponsored Research Costs by College/Research Center 1990 to 1994. Sponsored Research Costs - Real Vs. Nominal Growth 1990 to 1994 (Graph). Total Sponsored Research Costs by Agency 1990 to 1994. Total Giving by Source in Nominal Dollars 1990 to 1994 (Graph). Voluntary Support by Source and Purpose 1990 to 1994. Percent Undergraduate Scholarships/Grants by Source 1990 to 1994 (Graph). Undergraduate Financial Aid Resources by Source 1990 to 1994. Undergraduate Tuition Comparison by Benchmark Competitors 1994-95. Carnegie Mellon Tuition Benefits 1990 to 1994. Endowment Statistics 1990 to 1994. Nation Rank in Research and Development Funds (Sci. and Eng.) 1990 to 1994.
Tuition and Fees Academic Years 1990-91 to 1994-95
1990-91 1991-92 1992-93 1993-94 1994-95 Undergraduate Tuition $14,000 $15,250 $16,000 $16,960 $17,900 Graduate Tuition CFA $12,000 $12,000 $12,000 $16,960 $17,900 CIT 14,750 16,000 16,750 17,710 18,400 GSIA 16,500 17,600 18,500 19,500 20,500 H&SS 14,000 15,250 16,000 16,960 17,900 INI* 29,500 32,000 33,501 35,420 36,800 MCS 14,000 15,250 16,000 16,960 17,900 SCS 14,750 16,000 16,750 17,500 18,400
file:///H|/Common/Admin%20&%20Office%20Productivity/Planning%20Website/ira/factbook/facts95/finance.html (1 of 14)10/24/2008 2:41:45 PM
CMU Finance Data
HNZ 14,200 15,000 15,500 16,700 17,900
* Tuition is for a 14 month program.
Student Activities Fee $90 $100 $100 $100 $100
Room and Board Academic Years 1990-91 to 1994-95
1990-91 1991-92 1992-93 1993-94 1994-95 Average Room (Standard Double) $2,800 $3,010 $3,210 $3,400 $3,510 Average Board $2,006 $2,126 $2,000 $2,100 $2,170 (19 Meal Plan 90-91, 91-92) (Constant Pass 1992-93 through 1994-95)
Total Estimated Cost* of Attending CMU Academic Years 1990-91 to 1994-95
1990-91 1991-92 1992-93 1993-94 1994-95 Resident $20,200 $21,910 $22,560 $23,630 $24,540 Commuter $16,300 $18,050 $18,890 $20,105 $21,050 *Cost includes: tuition and activities fee, books and supplies, incidentals,
file:///H|/Common/Admin%20&%20Office%20Productivity/Planning%20Website/ira/factbook/facts95/finance.html (2 of 14)10/24/2008 2:41:45 PM

CMU Finance Data
room and board for on-campus residents and lunches and transportation for commuters.
Current Funds, Revenues, Expenditures, and Transfers Fiscal Years 1990 to 1994
Current Funds Revenues Revenues 1990 1991 1992 1993 1994 Tuition and Fees $87,994 $95,731 $103,958 $108,256 $118,988 Endowment Distribution $15,429 $18,081 $20,934 $22,898 $22,434 Current Fund Investments/Earnings $3,631 $3,198 $2,568 $2,334 $2,414 Gifts & Grants $15,864 $16,964 $18,248 $15,455 $18,035 Sponsored Research $122,613 $127,829 $136,904 $146,727 $150,709 Auxiliary Services $23,358 $25,123 $26,315 $26,826 $27,279 Miscellaneous Income $13,191 $15,674 $16,530 $15,066 $18,978 TOTAL REVENUES $282,080 $302,600 $325,457 $337,562 $358,837 Current Funds Expenditures and Transfers 1990 1991 1992 1993 1994 Expenditures (by Functions) Instruction & Department Research $81,305 $89,827 $93,702 $101,466 $108,998 Academic Support $19,250 $19,325 $20,688 $21,022 $23,775 Sponsored Research - Direct Costs $94,163 $98,744 $104,295 $109,238
file:///H|/Common/Admin%20&%20Office%20Productivity/Planning%20Website/ira/factbook/facts95/finance.html (3 of 14)10/24/2008 2:41:45 PM

CMU Finance Data
$114,853 Student Aid $17,574 $18,403 $21,366 $23,682 $28,944 Campus Operation $7,622 $6,953 $7,111 $6,782 $7,227 Utilities $5,624 $5,468 $5,895 $5,477 $5,826 Administration $11,150 $11,934 $13,253 $13,114 $13,600 Student Services $7,326 $8,193 $8,655 $9,191 $9,884 General Institutional $6,653 $7,640 $4,706 $5,064 $3,751 Auxiliary Services $23,361 $25,732 $26,587 $26,618 $27,060 TOTAL $274,028 $292,219 $306,258 $321,654 $343,918 Transfers Capital $9,859 $8,616 $14,536 $13,739 $14,182 Other ($658) $278 $666 $355 ($1,607) TOTAL $9,201 $8,894 $15,202 $14,094 $12,575 TOTAL EXPENDITURES and TRANSFERS $283,229 $301,113 $321,460 $335,748 $356,493
Distribution of Current Funds Revenues Fiscal Year 1994 (Total = $358,837,000)
file:///H|/Common/Admin%20&%20Office%20Productivity/Planning%20Website/ira/factbook/facts95/finance.html (4 of 14)10/24/2008 2:41:45 PM
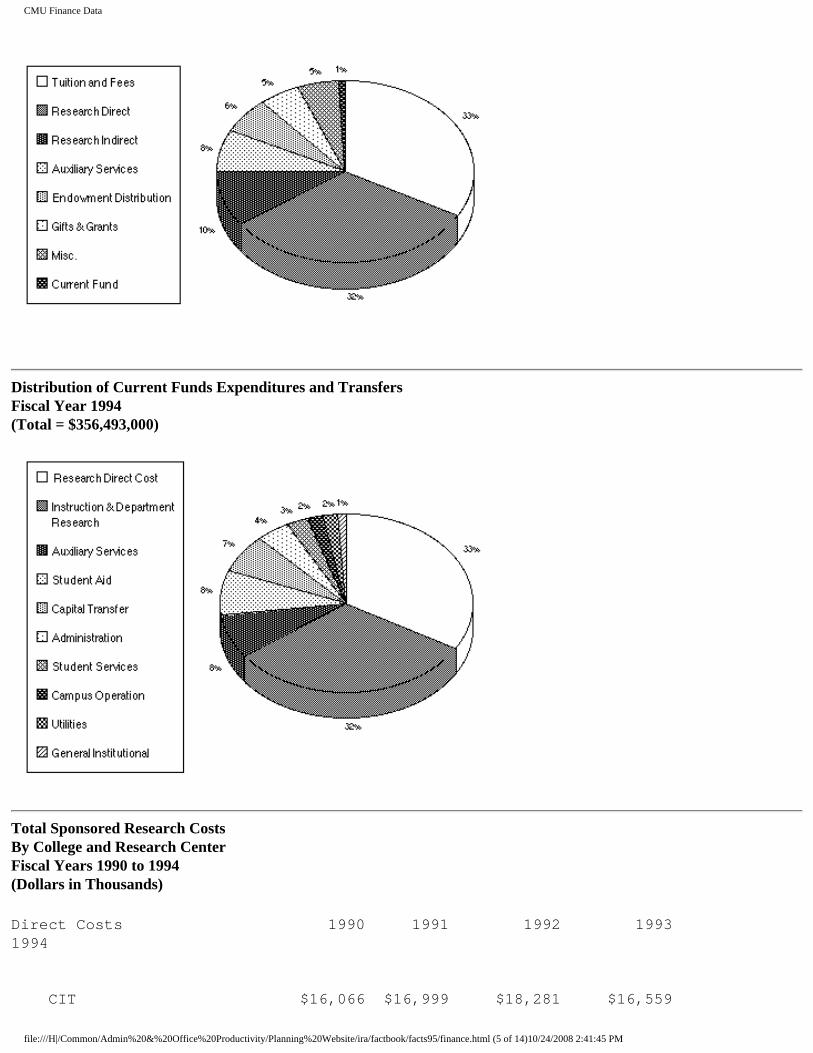
CMU Finance Data
Distribution of Current Funds Expenditures and Transfers Fiscal Year 1994 (Total = $356,493,000)
Total Sponsored Research Costs By College and Research Center Fiscal Years 1990 to 1994 (Dollars in Thousands)
Direct Costs 1990 1991 1992 1993 1994 CIT $16,066 $16,999 $18,281 $16,559
file:///H|/Common/Admin%20&%20Office%20Productivity/Planning%20Website/ira/factbook/facts95/finance.html (5 of 14)10/24/2008 2:41:45 PM
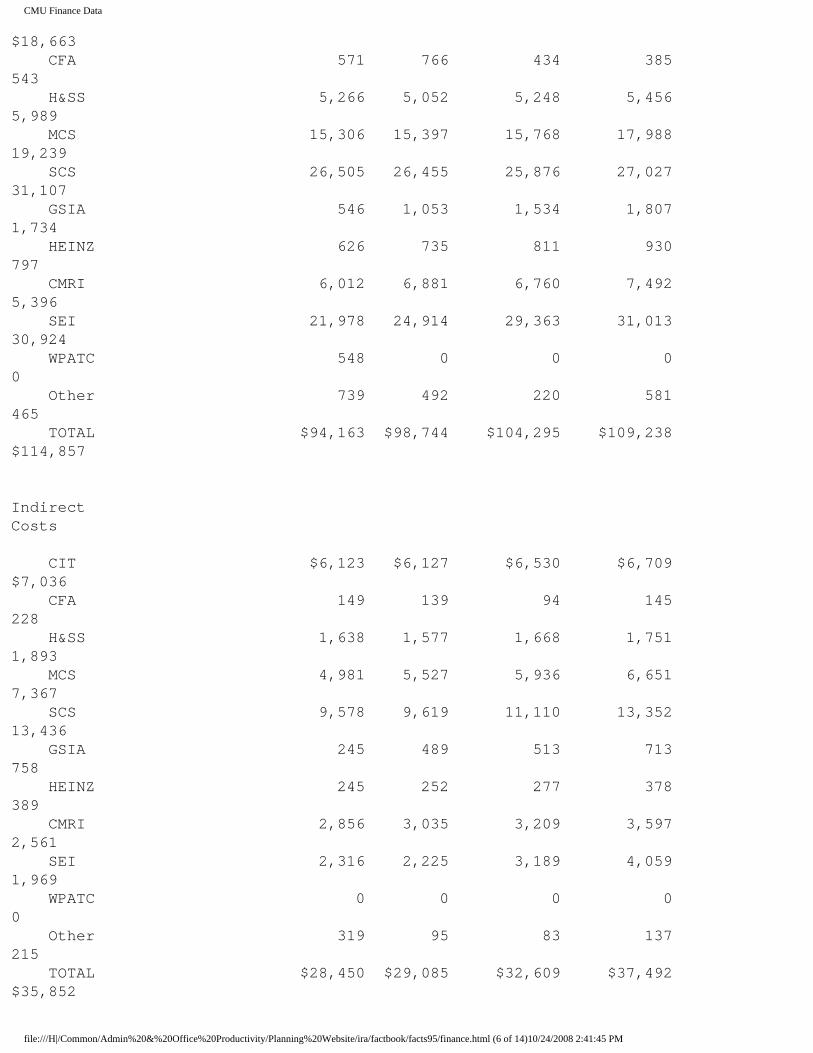
CMU Finance Data
$18,663 CFA 571 766 434 385 543 H&SS 5,266 5,052 5,248 5,456 5,989 MCS 15,306 15,397 15,768 17,988 19,239 SCS 26,505 26,455 25,876 27,027 31,107 GSIA 546 1,053 1,534 1,807 1,734 HEINZ 626 735 811 930 797 CMRI 6,012 6,881 6,760 7,492 5,396 SEI 21,978 24,914 29,363 31,013 30,924 WPATC 548 0 0 0 0 Other 739 492 220 581 465 TOTAL $94,163 $98,744 $104,295 $109,238 $114,857 Indirect Costs CIT $6,123 $6,127 $6,530 $6,709 $7,036 CFA 149 139 94 145 228 H&SS 1,638 1,577 1,668 1,751 1,893 MCS 4,981 5,527 5,936 6,651 7,367 SCS 9,578 9,619 11,110 13,352 13,436 GSIA 245 489 513 713 758 HEINZ 245 252 277 378 389 CMRI 2,856 3,035 3,209 3,597 2,561 SEI 2,316 2,225 3,189 4,059 1,969 WPATC 0 0 0 0 0 Other 319 95 83 137 215 TOTAL $28,450 $29,085 $32,609 $37,492 $35,852
file:///H|/Common/Admin%20&%20Office%20Productivity/Planning%20Website/ira/factbook/facts95/finance.html (6 of 14)10/24/2008 2:41:45 PM

CMU Finance Data
Total Sponsored Research Costs CIT $22,189 $23,126 $24,811 $23,268 $25,699 CFA 720 905 528 530 771 H&SS 6,904 6,629 6,916 7,207 7,882 MCS 20,287 20,924 21,704 24,639 26,606 SCS 36,083 36,074 36,986 40,379 44,543 GSIA 791 1,542 2,047 2,520 2,492 HEINZ 871 987 1,088 1,308 1,186 CMRI 8,868 9,916 9,969 11,089 7,957 SEI 24,294 27,139 32,552 35,072 32,893 WPATC 548 0 0 0 0 Other 1,058 587 303 718 680 TOTAL $122,613 127,829 $136,904 $146,730 $150,709
Sponsored Research Costs Real versus Nominal Growth Fiscal Years 1990 to 1994
file:///H|/Common/Admin%20&%20Office%20Productivity/Planning%20Website/ira/factbook/facts95/finance.html (7 of 14)10/24/2008 2:41:45 PM
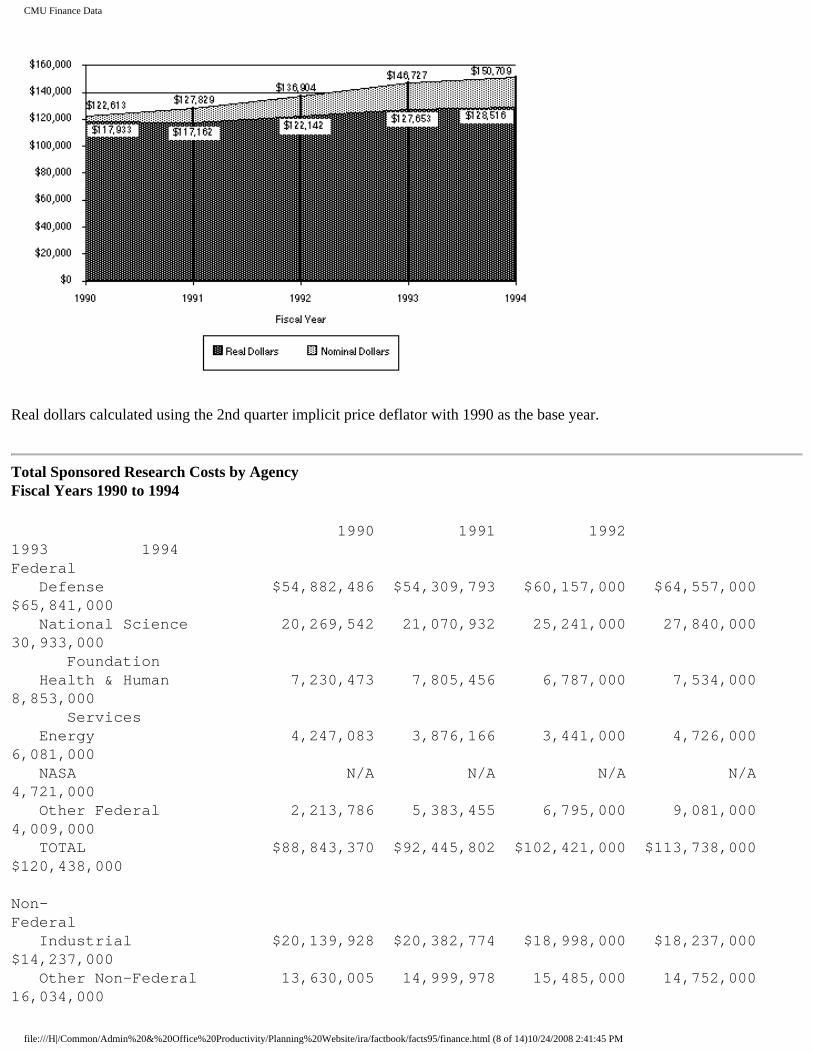
CMU Finance Data
Real dollars calculated using the 2nd quarter implicit price deflator with 1990 as the base year.
Total Sponsored Research Costs by Agency Fiscal Years 1990 to 1994
1990 1991 1992 1993 1994 Federal Defense $54,882,486 $54,309,793 $60,157,000 $64,557,000 $65,841,000 National Science 20,269,542 21,070,932 25,241,000 27,840,000 30,933,000 Foundation Health & Human 7,230,473 7,805,456 6,787,000 7,534,000 8,853,000 Services Energy 4,247,083 3,876,166 3,441,000 4,726,000 6,081,000 NASA N/A N/A N/A N/A 4,721,000 Other Federal 2,213,786 5,383,455 6,795,000 9,081,000 4,009,000 TOTAL $88,843,370 $92,445,802 $102,421,000 $113,738,000 $120,438,000 Non-Federal Industrial $20,139,928 $20,382,774 $18,998,000 $18,237,000 $14,237,000 Other Non-Federal 13,630,005 14,999,978 15,485,000 14,752,000 16,034,000
file:///H|/Common/Admin%20&%20Office%20Productivity/Planning%20Website/ira/factbook/facts95/finance.html (8 of 14)10/24/2008 2:41:45 PM

CMU Finance Data
TOTAL $33,769,933 $35,382,752 $34,483,000 $32,989,000 $30,271,000 TOTAL $122,613,303 $127,828,554 $136,904,000 $146,727,000 $150,709,000
Total Giving by Source Nominal Dollars Fiscal Years 1990 to 1994
Voluntary Support By Source and Purpose Fiscal Years 1990 to 1994
1990 1991 1992 1993 1994 Current Operations Alumni N/A $4,366,563 $4,786,556 $1,955,531 $2,430,340 Other Individuals N/A 1,329,170 1,555,594 1,132,022 747,679 (Includes Parents N/A N/A N/A 159,808 168,893 of Students) Foundations & Other N/A 5,433,231 4,569,194 4,754,060 4,777,616 Corporations N/A 4,390,435 4,609,945 3,291,248 3,819,643 TOTAL $12,424,910 $15,519,399 $15,521,289 $11,132,861
file:///H|/Common/Admin%20&%20Office%20Productivity/Planning%20Website/ira/factbook/facts95/finance.html (9 of 14)10/24/2008 2:41:45 PM
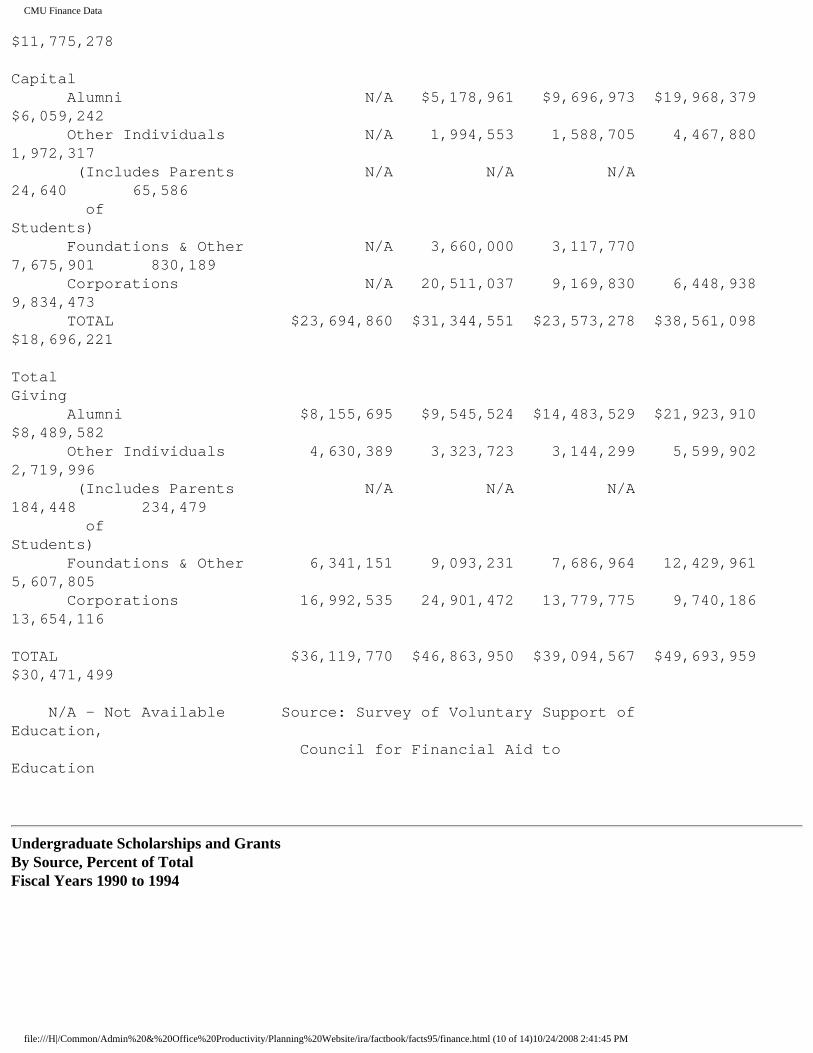
CMU Finance Data
$11,775,278 Capital Alumni N/A $5,178,961 $9,696,973 $19,968,379 $6,059,242 Other Individuals N/A 1,994,553 1,588,705 4,467,880 1,972,317 (Includes Parents N/A N/A N/A 24,640 65,586 of Students) Foundations & Other N/A 3,660,000 3,117,770 7,675,901 830,189 Corporations N/A 20,511,037 9,169,830 6,448,938 9,834,473 TOTAL $23,694,860 $31,344,551 $23,573,278 $38,561,098 $18,696,221 Total Giving Alumni $8,155,695 $9,545,524 $14,483,529 $21,923,910 $8,489,582 Other Individuals 4,630,389 3,323,723 3,144,299 5,599,902 2,719,996 (Includes Parents N/A N/A N/A 184,448 234,479 of Students) Foundations & Other 6,341,151 9,093,231 7,686,964 12,429,961 5,607,805 Corporations 16,992,535 24,901,472 13,779,775 9,740,186 13,654,116 TOTAL $36,119,770 $46,863,950 $39,094,567 $49,693,959 $30,471,499 N/A - Not Available Source: Survey of Voluntary Support of Education, Council for Financial Aid to Education
Undergraduate Scholarships and Grants By Source, Percent of Total Fiscal Years 1990 to 1994
file:///H|/Common/Admin%20&%20Office%20Productivity/Planning%20Website/ira/factbook/facts95/finance.html (10 of 14)10/24/2008 2:41:45 PM

CMU Finance Data
*All other includes Federal, State and Other Grant Resources
Undergraduate Financial Aid Resources By Source Fiscal Years 1990 to 1994 (Dollars In Thousands)
1990 1991 1992 1993 1994 Scholarships & Grants Federal - PELL $1,085 $1,018 $1,231 $1,361 $1,470 Federal - SEOG 1,677 1,684 1,745 1,819 1,987 State - PHEAA 1,434 1,462 1,492 1,501 1,527 Other State Grants 153 114 108 150 105 CMU E&GO 9,785 11,000 12,758 14,398 17,923 CMU Endowed 1,547 1,463 2,243 2,313 3,419 CMU Gifts and Grants 289 312 274 231 166 ROTC 1,901 2,255 2,610 2,673 2,070 Other Grant Resources 2,596 1,941 2,682 2,345 2,214 TOTAL $20,467 $21,249 $25,143 $26,791 $30,881 Self-Help
file:///H|/Common/Admin%20&%20Office%20Productivity/Planning%20Website/ira/factbook/facts95/finance.html (11 of 14)10/24/2008 2:41:45 PM
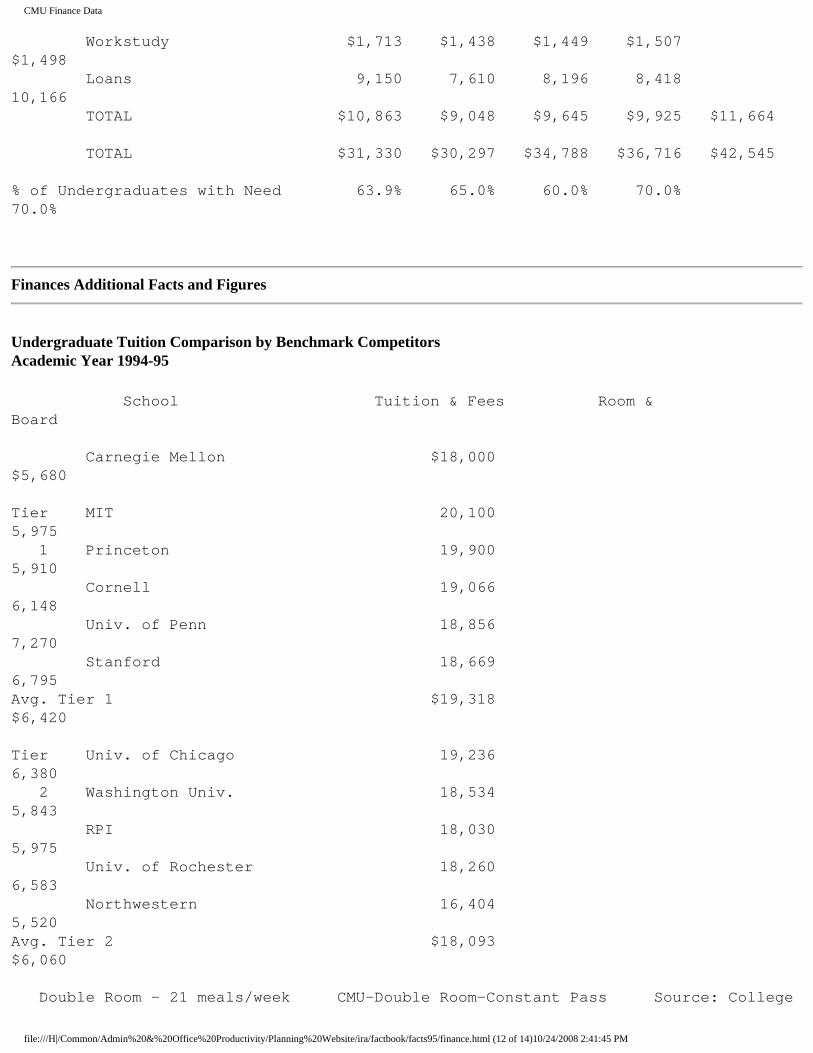
CMU Finance Data
Workstudy $1,713 $1,438 $1,449 $1,507 $1,498 Loans 9,150 7,610 8,196 8,418 10,166 TOTAL $10,863 $9,048 $9,645 $9,925 $11,664 TOTAL $31,330 $30,297 $34,788 $36,716 $42,545 % of Undergraduates with Need 63.9% 65.0% 60.0% 70.0% 70.0%
Finances Additional Facts and Figures
Undergraduate Tuition Comparison by Benchmark Competitors Academic Year 1994-95
School Tuition & Fees Room & Board Carnegie Mellon $18,000 $5,680
Tier MIT 20,100 5,975 1 Princeton 19,900 5,910 Cornell 19,066 6,148 Univ. of Penn 18,856 7,270 Stanford 18,669 6,795 Avg. Tier 1 $19,318 $6,420 Tier Univ. of Chicago 19,236 6,380 2 Washington Univ. 18,534 5,843 RPI 18,030 5,975 Univ. of Rochester 18,260 6,583 Northwestern 16,404 5,520 Avg. Tier 2 $18,093 $6,060 Double Room - 21 meals/week CMU-Double Room-Constant Pass Source: College
file:///H|/Common/Admin%20&%20Office%20Productivity/Planning%20Website/ira/factbook/facts95/finance.html (12 of 14)10/24/2008 2:41:45 PM
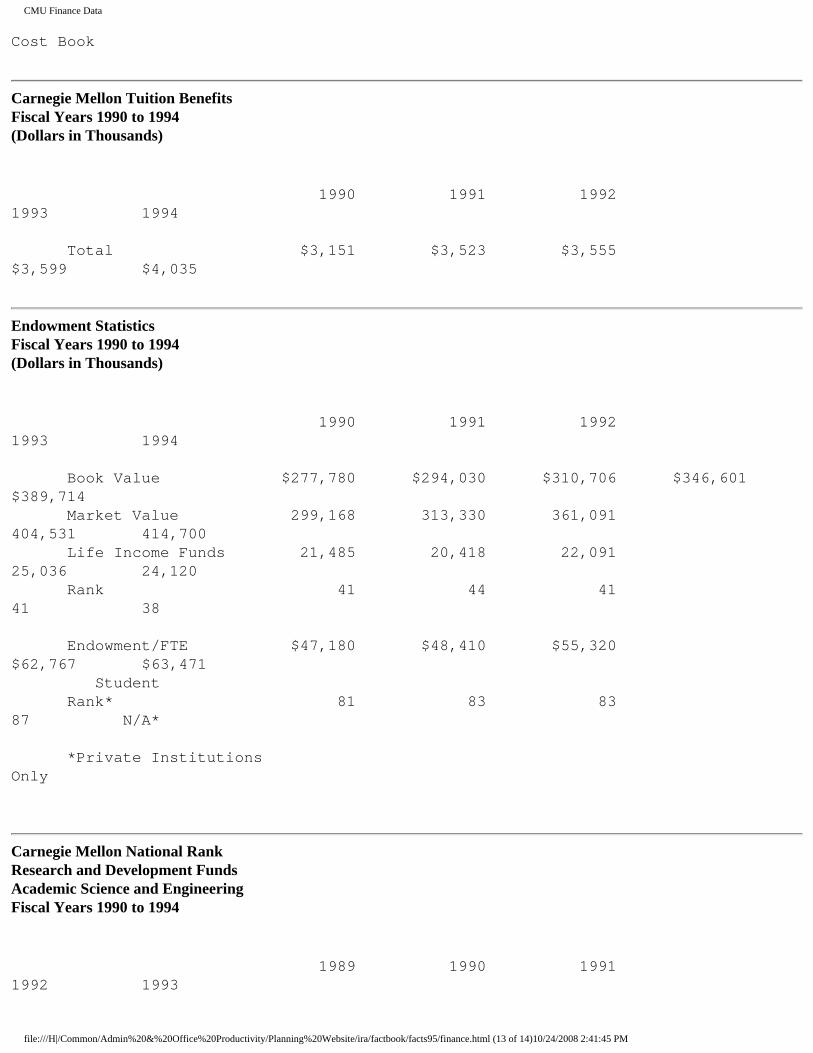
CMU Finance Data
Cost Book
Carnegie Mellon Tuition Benefits Fiscal Years 1990 to 1994 (Dollars in Thousands)
1990 1991 1992 1993 1994 Total $3,151 $3,523 $3,555 $3,599 $4,035
Endowment Statistics Fiscal Years 1990 to 1994 (Dollars in Thousands)
1990 1991 1992 1993 1994 Book Value $277,780 $294,030 $310,706 $346,601 $389,714 Market Value 299,168 313,330 361,091 404,531 414,700 Life Income Funds 21,485 20,418 22,091 25,036 24,120 Rank 41 44 41 41 38 Endowment/FTE $47,180 $48,410 $55,320 $62,767 $63,471 Student Rank* 81 83 83 87 N/A*
*Private Institutions Only
Carnegie Mellon National Rank Research and Development Funds Academic Science and Engineering Fiscal Years 1990 to 1994
1989 1990 1991 1992 1993
file:///H|/Common/Admin%20&%20Office%20Productivity/Planning%20Website/ira/factbook/facts95/finance.html (13 of 14)10/24/2008 2:41:45 PM
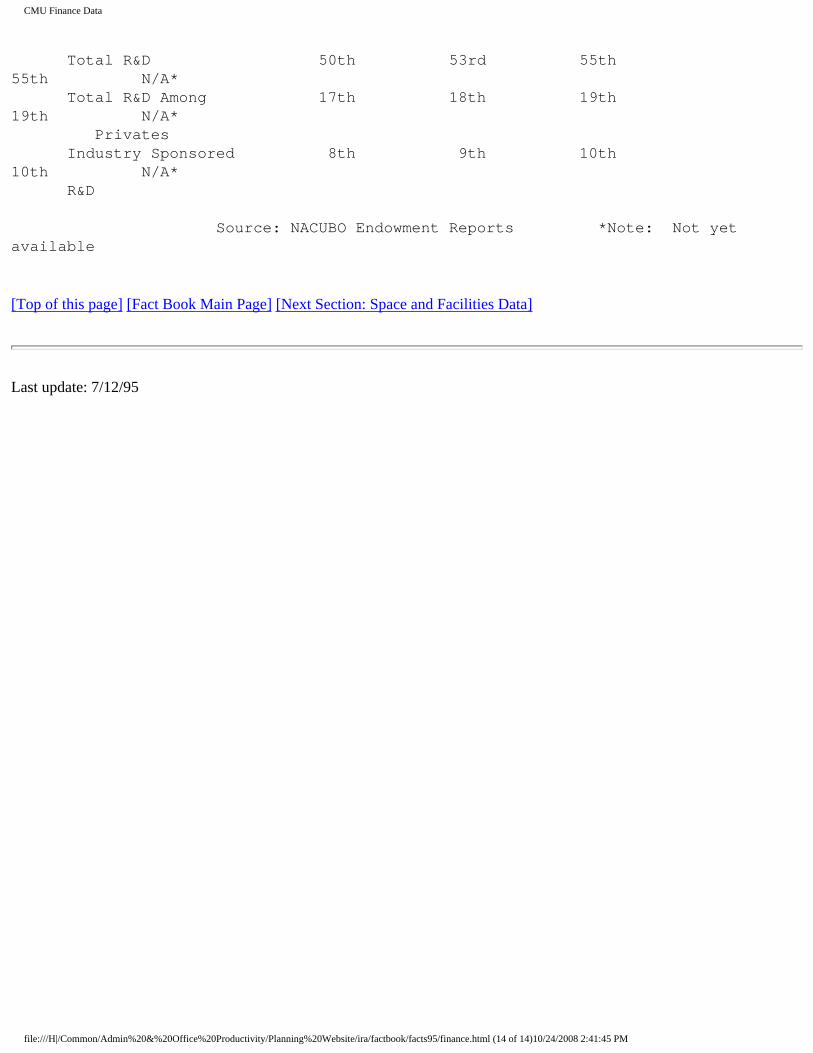
CMU Finance Data
Total R&D 50th 53rd 55th 55th N/A* Total R&D Among 17th 18th 19th 19th N/A* Privates Industry Sponsored 8th 9th 10th 10th N/A* R&D Source: NACUBO Endowment Reports *Note: Not yet available
[Top of this page] [Fact Book Main Page] [Next Section: Space and Facilities Data]
Last update: 7/12/95
file:///H|/Common/Admin%20&%20Office%20Productivity/Planning%20Website/ira/factbook/facts95/finance.html (14 of 14)10/24/2008 2:41:45 PM

CMU Space and Facilities Data
CMU Space and Facilities Data
CONTENTS Total Space in Square Footage By Major Division, College/Division, and Use. Total Space in Square Footage By Major Division, College/Division, and Building. Net Assignable Space By Major Use and Division (Graph). Parking Capacity 1991 to 1995. Housing Capacity By Units, Beds Available and Filled.
Total Space in Square Footage By Major Division, College/Division, and Use Catagory
Use Catagory Classroom Labs Office Conf./Mtg. Food/Lnge. Study Shops/Veh. Housing Other TOTAL & Serv. Studios & Serv. Asmbly./Exh. Merch./Serv. Data Proc. Food & Gen. & Serv. & Serv. & Serv. Storage & Serv.Major Division College/Division
President 0 0 4,005 1,235 0 0 12 0 0 5,252
Provost CIT 1,179 111,281 90,192 6,296 5,622 6,134 10,698 0 9,698 241,090 CFA 16,651 105,290 36,589 12,502 181 2,453 11,381 0 1,522 186,569 HSS 1,910 13,815 65,181 3,099 1,266 1,173 1,187 0 173 87,804 MCS 1,105 132,287 74,321 4,779 1,996 5,886 11,229 0 2,152 233,755 SCS 4,692 38,389 75,183 7,473 1,986 12,755 2,045 0 729 143,252 GSIA 12,694 2,033 34,788 2,251 5,031 8,177 155 0 0 65,129 HNZ 577 3,127 19,741 1,157 1,306 49 0 0 856 26,813 CMRI 0 23,330 34,337 306 0 176 11,587 0 1,881 71,617 SEI 0 0 63,692 11,889 2,996 11,527 4,108 0 4,546 98,758 Other 889 9,088 36,621 15,330 4,333 95,831 10,926 0 60,885 233,903 TOTAL 39,697 438,640 530,645 65,082 24,717 144,161 63,306 0 82,440 1,388,688
file:///H|/Common/Admin%20&%20Office%20Productivity/Planning%20Website/ira/factbook/facts95/space.html (1 of 8)10/24/2008 2:41:45 PM
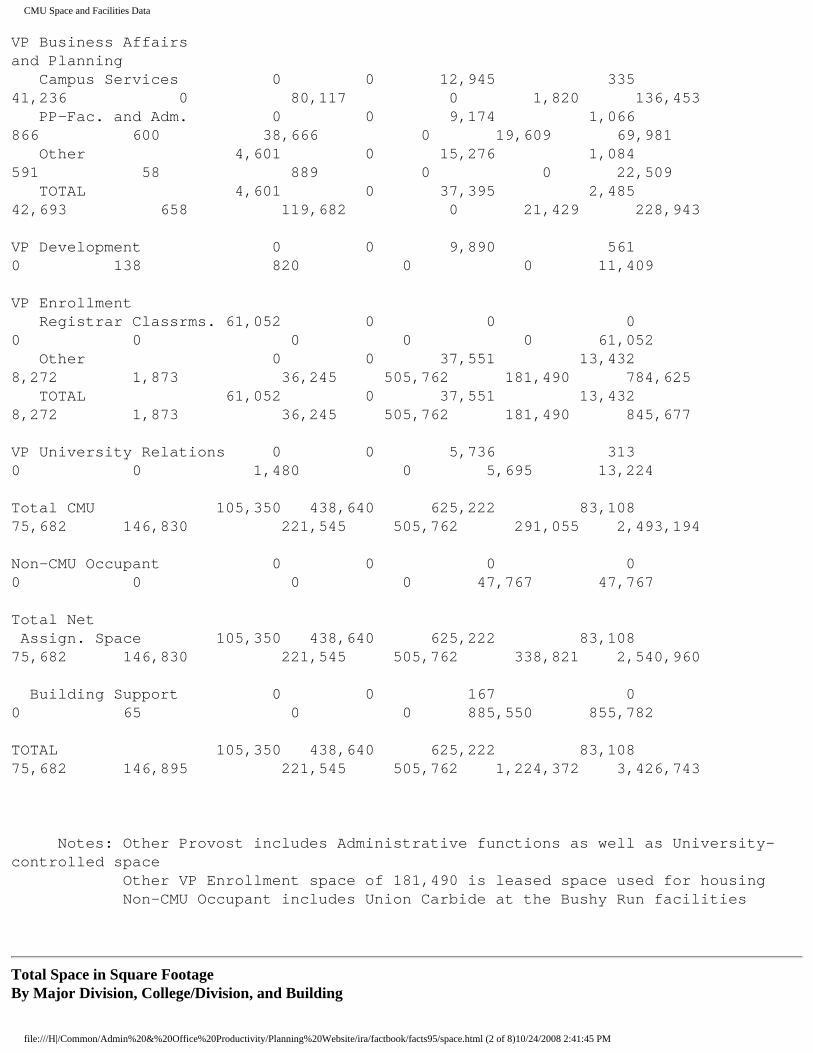
CMU Space and Facilities Data
VP Business Affairsand Planning Campus Services 0 0 12,945 335 41,236 0 80,117 0 1,820 136,453 PP-Fac. and Adm. 0 0 9,174 1,066 866 600 38,666 0 19,609 69,981 Other 4,601 0 15,276 1,084 591 58 889 0 0 22,509 TOTAL 4,601 0 37,395 2,485 42,693 658 119,682 0 21,429 228,943
VP Development 0 0 9,890 561 0 138 820 0 0 11,409
VP Enrollment Registrar Classrms. 61,052 0 0 0 0 0 0 0 0 61,052 Other 0 0 37,551 13,432 8,272 1,873 36,245 505,762 181,490 784,625 TOTAL 61,052 0 37,551 13,432 8,272 1,873 36,245 505,762 181,490 845,677
VP University Relations 0 0 5,736 313 0 0 1,480 0 5,695 13,224
Total CMU 105,350 438,640 625,222 83,108 75,682 146,830 221,545 505,762 291,055 2,493,194
Non-CMU Occupant 0 0 0 0 0 0 0 0 47,767 47,767
Total Net Assign. Space 105,350 438,640 625,222 83,108 75,682 146,830 221,545 505,762 338,821 2,540,960
Building Support 0 0 167 0 0 65 0 0 885,550 855,782
TOTAL 105,350 438,640 625,222 83,108 75,682 146,895 221,545 505,762 1,224,372 3,426,743
Notes: Other Provost includes Administrative functions as well as University-controlled space Other VP Enrollment space of 181,490 is leased space used for housing Non-CMU Occupant includes Union Carbide at the Bushy Run facilities
Total Space in Square Footage By Major Division, College/Division, and Building
file:///H|/Common/Admin%20&%20Office%20Productivity/Planning%20Website/ira/factbook/facts95/space.html (2 of 8)10/24/2008 2:41:45 PM
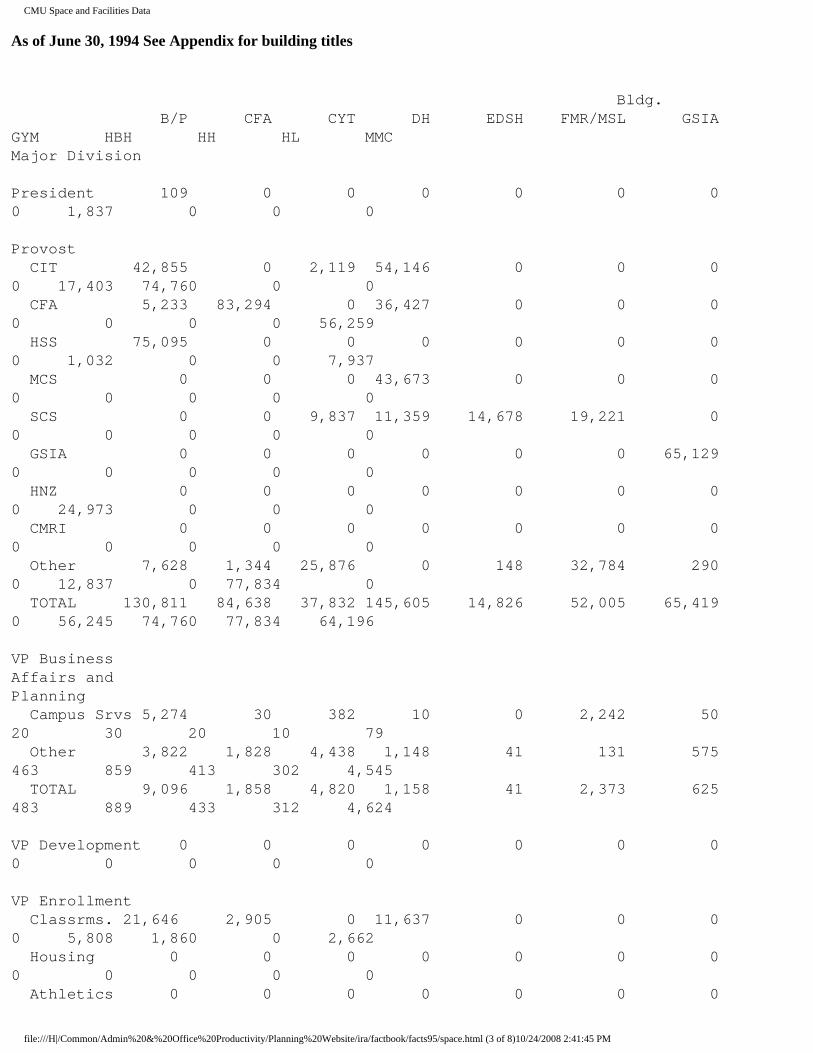
CMU Space and Facilities Data
As of June 30, 1994 See Appendix for building titles
Bldg. B/P CFA CYT DH EDSH FMR/MSL GSIA GYM HBH HH HL MMCMajor Division President 109 0 0 0 0 0 0 0 1,837 0 0 0
Provost CIT 42,855 0 2,119 54,146 0 0 0 0 17,403 74,760 0 0 CFA 5,233 83,294 0 36,427 0 0 0 0 0 0 0 56,259 HSS 75,095 0 0 0 0 0 0 0 1,032 0 0 7,937 MCS 0 0 0 43,673 0 0 0 0 0 0 0 0 SCS 0 0 9,837 11,359 14,678 19,221 0 0 0 0 0 0 GSIA 0 0 0 0 0 0 65,129 0 0 0 0 0 HNZ 0 0 0 0 0 0 0 0 24,973 0 0 0 CMRI 0 0 0 0 0 0 0 0 0 0 0 0 Other 7,628 1,344 25,876 0 148 32,784 290 0 12,837 0 77,834 0 TOTAL 130,811 84,638 37,832 145,605 14,826 52,005 65,419 0 56,245 74,760 77,834 64,196
VP BusinessAffairs andPlanning Campus Srvs 5,274 30 382 10 0 2,242 50 20 30 20 10 79 Other 3,822 1,828 4,438 1,148 41 131 575 463 859 413 302 4,545 TOTAL 9,096 1,858 4,820 1,158 41 2,373 625 483 889 433 312 4,624
VP Development 0 0 0 0 0 0 0 0 0 0 0 0
VP Enrollment Classrms. 21,646 2,905 0 11,637 0 0 0 0 5,808 1,860 0 2,662 Housing 0 0 0 0 0 0 0 0 0 0 0 0 Athletics 0 0 0 0 0 0 0
file:///H|/Common/Admin%20&%20Office%20Productivity/Planning%20Website/ira/factbook/facts95/space.html (3 of 8)10/24/2008 2:41:45 PM
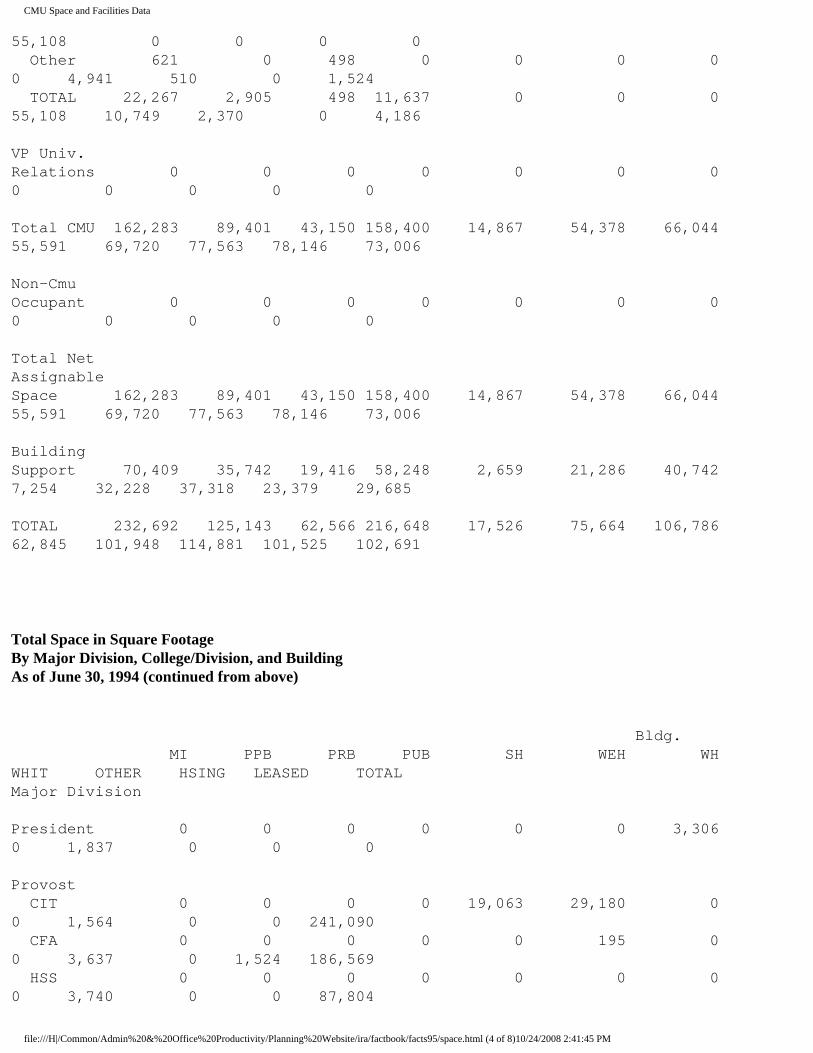
CMU Space and Facilities Data
55,108 0 0 0 0 Other 621 0 498 0 0 0 0 0 4,941 510 0 1,524 TOTAL 22,267 2,905 498 11,637 0 0 0 55,108 10,749 2,370 0 4,186
VP Univ.Relations 0 0 0 0 0 0 0 0 0 0 0 0
Total CMU 162,283 89,401 43,150 158,400 14,867 54,378 66,044 55,591 69,720 77,563 78,146 73,006
Non-CmuOccupant 0 0 0 0 0 0 0 0 0 0 0 0
Total NetAssignableSpace 162,283 89,401 43,150 158,400 14,867 54,378 66,044 55,591 69,720 77,563 78,146 73,006
BuildingSupport 70,409 35,742 19,416 58,248 2,659 21,286 40,742 7,254 32,228 37,318 23,379 29,685
TOTAL 232,692 125,143 62,566 216,648 17,526 75,664 106,786 62,845 101,948 114,881 101,525 102,691
Total Space in Square Footage By Major Division, College/Division, and Building As of June 30, 1994 (continued from above)
Bldg. MI PPB PRB PUB SH WEH WH WHIT OTHER HSING LEASED TOTALMajor Division President 0 0 0 0 0 0 3,306 0 1,837 0 0 0
Provost CIT 0 0 0 0 19,063 29,180 0 0 1,564 0 0 241,090 CFA 0 0 0 0 0 195 0 0 3,637 0 1,524 186,569 HSS 0 0 0 0 0 0 0 0 3,740 0 0 87,804
file:///H|/Common/Admin%20&%20Office%20Productivity/Planning%20Website/ira/factbook/facts95/space.html (4 of 8)10/24/2008 2:41:45 PM

CMU Space and Facilities Data
MCS 137,969 1,286 0 0 1,403 49,424 0 0 0 0 0 233,755 SCS 0 0 6,140 0 0 82,017 0 0 0 0 0 143,252 GSIA 0 0 0 0 0 0 0 0 0 0 0 65,129 HNZ 0 0 0 0 0 0 0 0 0 0 1,840 26,813 CMRI 35,432 0 0 0 0 0 0 0 0 0 36,185 71,617 Other 21,873 0 0 0 0 19,003 4,667 68 26,658 0 101,652 332,661 TOTAL 195,274 1,286 6,140 0 20,465 179,819 4,667 68 35,599 0 141,201 1,388,688
VP BusinessAffairs andPlanning Campus Srvs 4,822 990 0 10 20 70 830 4,616 116,948 0 0 136,453 Other 8,020 28,024 0 0 443 2,812 2,281 3,958 27,900 0 487 92,490 TOTAL 12,842 29,014 0 10 463 2,882 3,111 8,574 144,848 0 487 228,943
VP Development 0 0 0 0 0 0 5,388 0 6,021 0 0 11,409
VP Enrollment Classrms. 1,125 0 0 0 4,939 6,413 0 0 2,057 0 0 61,052 Housing 0 0 0 0 0 0 0 0 0 542,055 110,986 653,041 Athletics 0 0 0 0 0 0 0 0 16,180 0 0 71,288 Other 160 584 904 0 0 0 16,805 0 33,749 0 0 60,296 TOTAL 1,285 584 904 0 4,939 6,413 16,805 0 51,986 542,055 110,986 845,677
VP Univ.Relations 313 0 0 9,254 0 0 0 0 3,657 0 0 13,224
Total CMU 209,714 30,884 7,044 9,264 25,867 189,114 33,277 8,642 242,111 542,055 252,674 2,493,194
Non-CmuOccupant 0 0 0 0 0 0 0 0 47,767 0 0 47,767
Total Net
file:///H|/Common/Admin%20&%20Office%20Productivity/Planning%20Website/ira/factbook/facts95/space.html (5 of 8)10/24/2008 2:41:45 PM
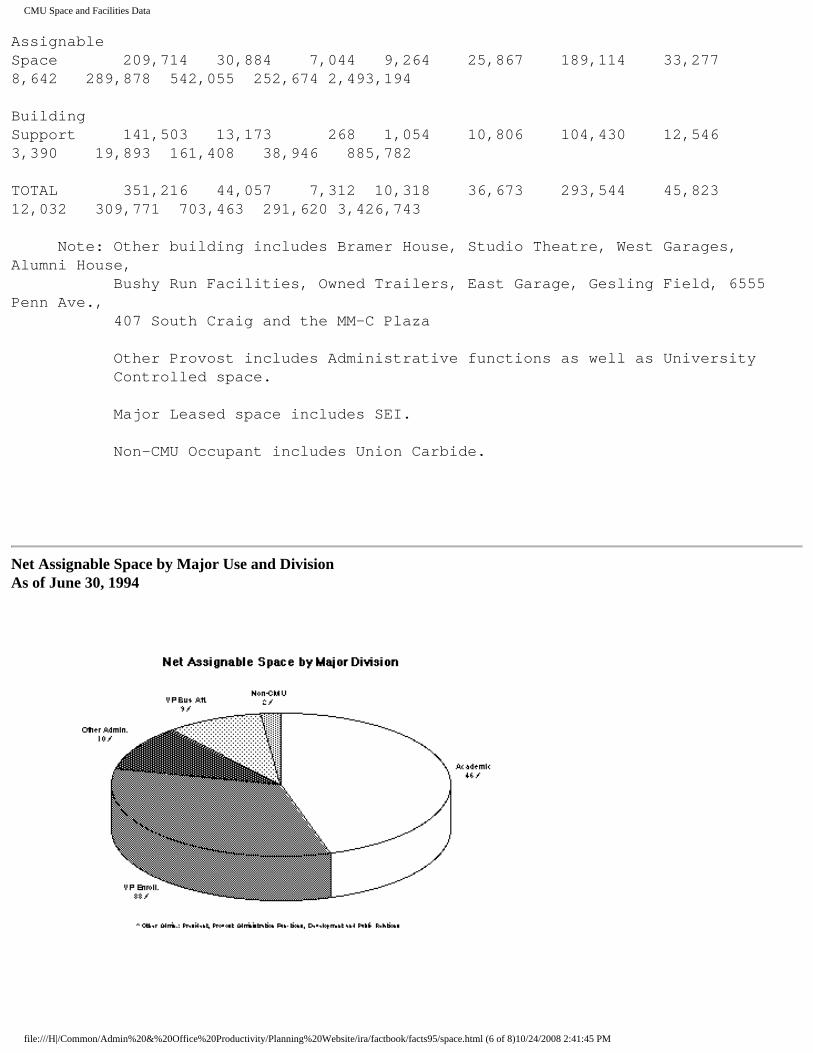
CMU Space and Facilities Data
AssignableSpace 209,714 30,884 7,044 9,264 25,867 189,114 33,277 8,642 289,878 542,055 252,674 2,493,194
BuildingSupport 141,503 13,173 268 1,054 10,806 104,430 12,546 3,390 19,893 161,408 38,946 885,782
TOTAL 351,216 44,057 7,312 10,318 36,673 293,544 45,823 12,032 309,771 703,463 291,620 3,426,743
Note: Other building includes Bramer House, Studio Theatre, West Garages, Alumni House, Bushy Run Facilities, Owned Trailers, East Garage, Gesling Field, 6555 Penn Ave., 407 South Craig and the MM-C Plaza
Other Provost includes Administrative functions as well as University Controlled space.
Major Leased space includes SEI.
Non-CMU Occupant includes Union Carbide.
Net Assignable Space by Major Use and Division As of June 30, 1994
file:///H|/Common/Admin%20&%20Office%20Productivity/Planning%20Website/ira/factbook/facts95/space.html (6 of 8)10/24/2008 2:41:45 PM

CMU Space and Facilities Data
Parking Capacity Fiscal Years 1991 to 1995
1991 1992 1993 1994 1995 Spaces Spaces Spaces Spaces Spaces
Permit Parking 2,001 2,203 2,214 2,242 2,114 Visitor Parking 32 39 33 33 28 Meter Parking 87 194 213 231 168 Utility Parking 80 18 15 15 15 Campus Street 301 301 301 301 301 CMU Area Total 2,501 2,755 2,776 2,822 2,626 Total Permits 2,393 2,611 2,621 2,553 2,416 Issued
Housing Capacity By Units, Beds Available and Filled Fall Semester 1994
file:///H|/Common/Admin%20&%20Office%20Productivity/Planning%20Website/ira/factbook/facts95/space.html (7 of 8)10/24/2008 2:41:45 PM
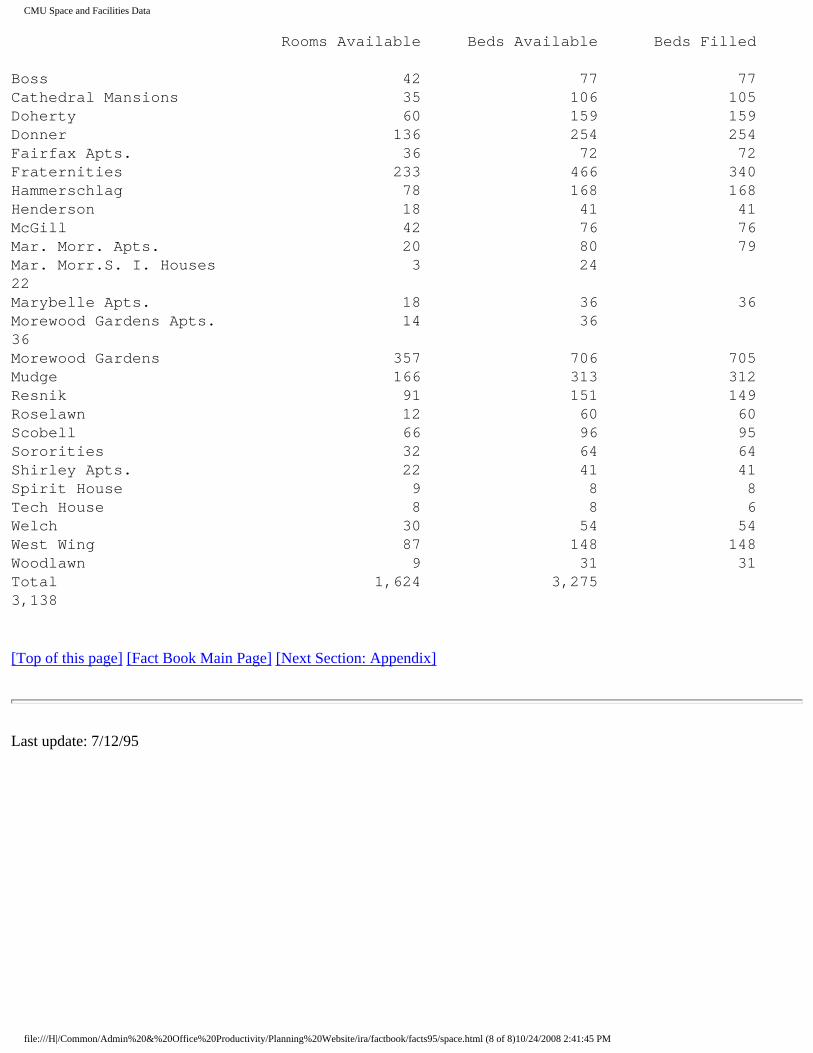
CMU Space and Facilities Data
Rooms Available Beds Available Beds Filled
Boss 42 77 77 Cathedral Mansions 35 106 105 Doherty 60 159 159 Donner 136 254 254 Fairfax Apts. 36 72 72 Fraternities 233 466 340 Hammerschlag 78 168 168 Henderson 18 41 41 McGill 42 76 76 Mar. Morr. Apts. 20 80 79 Mar. Morr.S. I. Houses 3 24 22 Marybelle Apts. 18 36 36 Morewood Gardens Apts. 14 36 36 Morewood Gardens 357 706 705 Mudge 166 313 312 Resnik 91 151 149 Roselawn 12 60 60 Scobell 66 96 95 Sororities 32 64 64 Shirley Apts. 22 41 41 Spirit House 9 8 8 Tech House 8 8 6 Welch 30 54 54 West Wing 87 148 148 Woodlawn 9 31 31 Total 1,624 3,275 3,138
[Top of this page] [Fact Book Main Page] [Next Section: Appendix]
Last update: 7/12/95
file:///H|/Common/Admin%20&%20Office%20Productivity/Planning%20Website/ira/factbook/facts95/space.html (8 of 8)10/24/2008 2:41:45 PM
CMU Fact Index
CMU Fact Book Appendix
CONTENTS
I. College and Department Listings Carnegie Institute of Technology (CIT) College of Fine Arts (CFA) Humanities and Social Sciences (HSS) Information Networking Institute (INI) Mellon College of Science (MCS) School of Computer Science (SCS) Graduate School of Industrial Administration (GSIA) The Heinz School (HNZ) Carnegie Mellon Research Institute (CMRI) Software Engineering Institute (SEI) Administration (ADMIN)
III. Definition of Terms Students Teaching Staff Faculty Alumni Finances Space and Facilities CMU Facts Questionnaire
I. COLLEGE AND DEPARTMENT LISTING
College Department/Unit Abbreviation Notes
CARNEGIE INSTITUTE OF TECHNOLOGY CIT Undergraduate and graduate college.
Biomedical Engineering (Biomedical E.) Chemical Engineering (Chemical E.)
file:///H|/Common/Admin%20&%20Office%20Productivity/Planning%20Website/ira/factbook/facts95/appendix.html (1 of 11)10/24/2008 2:41:46 PM
CMU Fact Index
Civil Engineering (Civil E.) Electrical and Computer Engineering (E & C E.) Engineering and Public Policy (EPP) Manufacturing Engineering (Mfg. E.) Mechanical Engineering (Mechanical E.) Materials Science and Engineering (MSE) Engineering Design Research Center (EDRC) -- Research Center
ADDITIONAL UNITS:
Nuclear Engineering (Nuclear E.) -- This is no longer formally a department, but a few students are still finishing or graduating from the program.
No Major Department (No Major Dept.) -- Students do not declare majors until their sophomore year.
Interdisciplinary (Interdiscp.) -- Interdisciplinary units are jointly taught among departments.
Dean's Office (Dean's Ofc.) -- Some faculty with administrative responsibility are located in the the Dean's office.
University Choice Program (Univ. Choice)
COLLEGE OF FINE ARTS CFA Undergraduate and graduate college.
Architecture Art Design Drama Music Studio for Creative Inquiry (SFCI) -- Research Center
ADDITIONAL UNITS:
Interdisciplinary (Interdiscp.) -- Interdisciplinary units are jointly taught among departments.
Dean's Office (Dean's Ofc.) -- Some faculty with administrative responsibility are located in the Dean's office.
Pre-College Art (Pre-Col. Art) -- Year-round program for pre-college art students and CMU
file:///H|/Common/Admin%20&%20Office%20Productivity/Planning%20Website/ira/factbook/facts95/appendix.html (2 of 11)10/24/2008 2:41:46 PM
CMU Fact Index
students who are not art majors.
Pre-College Music (Pre-Col. Mus.) -- Year-round program for pre-college music students and CMU students who are not music majors.
Humanities and Arts (BHA MAM) -- Students may now participate in a degree program combining humanities and arts curriculum
COLLEGE OF HUMANITIES AND SOCIAL SCIENCES H&SS Undergraduate and graduate college.
English History Modern Languages Philosophy Psychology Social and Decision Sciences (S&DS.) Statistics
ADDITIONAL UNITS:
Economics -- The student major Economics is housed in H&SS.
Industrial Management in H&SS (IM - H&SS) -- Some freshmen and sophomores take the H&SS core before being accepted into the IM major.
Student Defined Major (Student Def'd) -- Some students in H&SS define individualized interdisciplinary majors.
No Major Department (No Major Dept.) -- Students do not declare majors until their junior year.
Dean's Office (Dean's Ofc.) -- Some faculty with administrative responsibility are located in the the Dean's office.
University Choice Program (Univ. Choice).
INFORMATION NETWORKING INSTITUTE INI Joint academic program between CIT, GSIA, and SCS.
file:///H|/Common/Admin%20&%20Office%20Productivity/Planning%20Website/ira/factbook/facts95/appendix.html (3 of 11)10/24/2008 2:41:46 PM
CMU Fact Index
MELLON COLLEGE OF SCIENCE MCS Undergraduate and graduate college.
Biological Sciences (Biology) Chemistry (Chem) Mathematics (Math) Physics (Phy)
ADDITIONAL UNITS:
No Major Department (No Major Dept.) -- Students do not declare majors until their sophomore year.
Dean's Office (Dean's Ofc.) -- Some faculty with administrative responsibility are located in the Dean's office.
Interdisciplinary (Interdiscp.) -- Interdisciplinary units are jointly taught among departments.
University Choice Program (Univ. Choice)
SCHOOL OF COMPUTER SCIENCE SCS Undergraduate and graduate college.
Computer Science (Comp. Sci.) Robotics (Rob) Center for Machine Translation (CMT) -- Research Center Information Technology Center (ITC) -- Research Center Software Engineering (SE)
GRADUATE SCHOOL OF INDUSTRIAL ADMINISTRATION GSIA Undergraduate and Graduate College.
ADDITIONAL UNITS:
Economics -- Most Economics courses are taught by GSIA faculty.
Industrial Management (IM) -- Most IM courses are taught by GSIA faculty.
file:///H|/Common/Admin%20&%20Office%20Productivity/Planning%20Website/ira/factbook/facts95/appendix.html (4 of 11)10/24/2008 2:41:46 PM

CMU Fact Index
THE HEINZ SCHOOL HNZ Graduate College.
CARNEGIE MELLON RESEARCH INSTITUTE CMRI Research Center.
SOFTWARE ENGINEERING INSTITUTE SEI Research Center.
ADMINISTRATION ADMIN
NOTE: The category of NON-DEGREE students is often listed as a Department in tables showing student enrollment. These non-degree seeking students are not affiliated with any Department or College (see Students section).
II. TIME PERIODS
Fall Semester - Data are as of the 15th day in the Fall Semester (except Units Taught, which are end of semester counts). Academic Year - Data are the addition of Fall and Spring Semester totals. Fiscal Year - Data are for the period July 1 to June 30 of the indicated year.
III. DEFINITION OF TERMS
STUDENTS
FRESHMEN Applied - Individuals who completed the Admissions process. Admitted - Applicants who were admitted to Carnegie Mellon. Enrolled - Applicants who were admitted and actually enrolled. Yield - Enrolled as a percent of Admitted freshmen. Competing Schools - The top 15 schools to which students admitted to Carnegie Mellon also submitted applications. The source of this data is the Admissions Office Admitted Student Questionaire.
ENROLLMENT Students by Level:
file:///H|/Common/Admin%20&%20Office%20Productivity/Planning%20Website/ira/factbook/facts95/appendix.html (5 of 11)10/24/2008 2:41:46 PM
CMU Fact Index
Undergraduate - Freshman, Sophomore, Junior, Senior Graduate - Students enrolled in Master's or Doctoral programs. Non-Degree - Special students who are not enrolled in a degree program.
Headcount - Each student, full or part time, is counted once. Full-Time Equivalent (FTE) - Each full-time student is counted once; part-time students are counted based on the percentage of full-time tuition paid to cover their current courses.
HOUSING TYPE University Housing:
On-Campus - CMU owned dormitories physically located on the campus. Off-Campus - CMU controlled off-campus housing. Fraternity/Sorority - Fraternity or Sorority controlled housing.
Non-University Housing - All other student residence arrangements.
PERSISTENCE
The percentage of students from an entering cohort who are enrolled in a particular year plus those who have graduated.
DEGREES
Bachelors - B.A., B.S., BFA, B.H.A, B.Arch. Masters - M.A., M.S., M.E., MFA, M.A.M., M.P.M, M.S.I.A. Doctorates - D.A., Ph.D.
All degrees are shown by the Department from which they were earned, rather than the particular program or emphasis listed on the individual's degree. All degree programs are listed in the front of this booklet.
RACE
NRA - Non Resident Aliens AI/AN - American Indian/Alaskan Native A/PI - Asian/Pacific Islander Hisp. - Hispanic Unkn. - Unknown
TEACHING
file:///H|/Common/Admin%20&%20Office%20Productivity/Planning%20Website/ira/factbook/facts95/appendix.html (6 of 11)10/24/2008 2:41:46 PM
CMU Fact Index
UNITS
A student at CMU earns a specified number of units for each course taken at the University. Three (3) units are the equivalent of one (1) credit hour. The total units taught by a department is calculated by summing the units taken by each student for each course taught by the department.
Other - Includes units taught to Non-Degree students and students from other colleges attending CMU through the Pennsylvania Council of Higher Education (PCHE) agreement.
STAFF
Full-time employees includes those on leave and visiting research professionals. Visiting faculty are excluded.
FACULTY
Total Faculty includes three categories of faculty members. They are:
Regular Faculty - Regular faculty are comprised of four ranks of permanent faculty members (subject to the rules of the tenure process): Professor, Associate Professor, Assistant Professor, and Instructor. Professors and some Associate Professors are tenured; the rest of the Associate Professors and Assistant Professors are eligible for tenure, or in the Tenure Stream; and Instructors are eligible for promotion into the tenure stream. Instructors are part of the regular faculty for whom the tenure probationary period has not yet begun.
Research Faculty - Research faculty are comprised of several ranks of faculty-equivalent research positions of scientists and engineers.
Special Faculty - Special faculty are comprised of several ranks of part-time or temporary, instructional, and research faculty including active Faculty Emeriti, Adjunct Faculty, Instructional Staff, Lecturers, Visiting Faculty, Special Research Faculty, and Post-Doctoral Associates. Administrators with Special Faculty appointments are excluded.
Method of counting - Regular and Research faculty may have contractual joint appointments in one or more departments, and are split between these appointments accordingly. Special Faculty are counted in the department in which they have their primary appointment.
Terminal degree - Terminal degrees are typically recognized in a field as the highest level of education attainable. Professional fields often have terminal degrees that are not PhD's, e.g.MFA for studio/performance, DA (doctorate of Arts)and DrI (Dr. of engineering from Italy).
file:///H|/Common/Admin%20&%20Office%20Productivity/Planning%20Website/ira/factbook/facts95/appendix.html (7 of 11)10/24/2008 2:41:46 PM
CMU Fact Index
ALUMNI
Includes all living persons who attended the university as degree candidates.
FINANCES
TUITION AND FEES
Undergraduate Tuition - Tuition charged to full-time undergraduate students. This is established at the university level.
Graduate Tuition - Tuition charged to full-time graduate students. This is established by each college.
Average Room - The annual charge for a standard double room. Other options for university housing include: Standard and Prime rooms for one, three or four students, and several apartment, townhouse or separate house alternatives.
Average Board - Constant Pass Plus. The annual charge for unlimited access to Highlander Cafe + 50 block meals per semester.
Total Estimated Cost of Attending CMU - This includes tuition and activities fee, books and supplies, incidentals, room and board for residents and lunches and transportation for Commuters. This is computed each year by the Financial Aid Office.
UNDERGRADUATE FINANCIAL AID RESOURCES
Federal Aid: PELL - Federal entitlement grant program. SEOG - Supplemental Education Opportunity Grant.
State Aid: PHEAA - Pennsylvania Higher Education Assistance Agency.
Other State Aid: Aid from states other than Pennsylvania. CMU E&GO - Aid provided from Carnegie Mellon Educational and General Operating Expenses. CMU Endowed Aid - provided from income from the Carnegie Mellon University Endowment Fund. CMU Gifts & Grants - Aid provided through gifts and grants to the University for this purpose. ROTC - Money from the Air Force, Army and Navy ROTC programs. Other Grant Resources - Aid from all other sources, primarily scholarships.
file:///H|/Common/Admin%20&%20Office%20Productivity/Planning%20Website/ira/factbook/facts95/appendix.html (8 of 11)10/24/2008 2:41:46 PM

CMU Fact Index
GENERAL FUNDS INCOME, EXPENDITURES, AND TRANSFERS
GENERAL FUNDS - These funds are divided intoUnrestricted Funds that can be used for any University purpose, Designated Funds that have been set aside for particular purposes such as the Summer School program, and Restricted Funds which have been given for a specific purpose, such as research projects by the donor or granting agency. The General Funds support teaching, research, support programs,student services, student aid, administrative and business operations, physical plant operations and maintenance and public service.
INCOME
Tuition & Fees - Payments made by undergraduate, graduate and special students in accordance with University tuition and fee schedules. Endowment Income - Income derived from endowment investments. Current Fund Investments - Earnings derived from Current Fund balances. Gifts and Grants - Restricted and unrestricted gifts given to the university. Sponsored Research - Restricted income given for a specific research project by the donor or granting agency. Auxiliary Services - Income from Auxiliary Services (i.e., housing, food services, parking.) Misc. Income - Includes interest on operating funds and reserve holdings, interest on university internal loans and miscellaneous charges.
EXPENDITURES
Instruction & Dept.Research - Expenditures supporting the academic programs and operations in the colleges. Carnegie Mellon Research Institute - Expenditures from Carnegie Mellon Research Institute. Academic Support - Includes: Audio Visual Aids and Computing and Info Services. Sponsored Research - Expenditures from restricted funds for research. Student Aid - Restricted and unrestricted aid supporting undergraduates. Libraries - Expenditures from the libraries. Campus Operations - Operation and maintenance of physical plant. Utilities - Expenditures for utilities and steam. Administration - Expenses supporting administrative units. Student Services - Includes Enrollment Planning, Athletics and Student Affairs. General Institutional - Includes insurance, legal and investment agent fees. Auxiliary Services - Expenditures for the operation of Auxiliary Services units. Total Transfers - Includes transfers to capital, debt service, and college reserves.
RESEARCH COSTS
file:///H|/Common/Admin%20&%20Office%20Productivity/Planning%20Website/ira/factbook/facts95/appendix.html (9 of 11)10/24/2008 2:41:46 PM
CMU Fact Index
In the listing by College and Research Center Other includes: Academic Computing, Computing Systems, Hunt Institute for Botanical Documentation, Center for the Design of Educational Computing, Office of the Provost, Office of the Vice President for Enrollment and General Institutional.
VOLUNTARY SUPPORT
Voluntary Support - Contributions supporting the University, excluding: income from endowment and other invested funds, and support from federal, state and local governments and their agencies.
TUITION BENEFITS
Money paid to CMU faculty, staff and their dependents to take courses at CMU or other universities.
SPACE AND FACILITIES
USE CATEGORIES
Classroom - Includes all rooms used for classrooms. Laboratory/Studio - Includes laboratory and studio facilities, used both as classrooms and for research. Office - Includes offices, office support areas and office-related conference rooms. Other - Includes Special Use Facilities (e.g. the gym), General Use Facilities (e.g., lounge or dining facilities), Support Facilities (e.g. computer, shop and storage rooms) and Health Care Facilities. Building Support - Includes circulation, mechanical and structural areas. Univ. Controlled - Represents primarily public spaces which are not under the control of any individual department, as well as unassigned space held in reserve by the university to allow for future departmental expansion, or for temporary allocation during renovations.
BUILDING ABBREVIATIONS
B/P - Baker/Porter CFA - College of Fine Arts CYH - Cyert Hall DH - Doherty Hall EDSH - Elliott Dunlap Smith Hall FMR/MSL - Field & Mobile Robotics Building / Mine Safety Laboratory Building GSIA - Graduate School of Industrial Administration G - Gym
file:///H|/Common/Admin%20&%20Office%20Productivity/Planning%20Website/ira/factbook/facts95/appendix.html (10 of 11)10/24/2008 2:41:46 PM
CMU Fact Index
HBH - Hamburg Hall HH - Hammerschlag Hall HL - Hunt Library MMC - Margaret Morrison Carnegie Hall MI - Mellon Institute PPB - Physical Plant Building PRB - Planetary Robotics Building SCRG - 407 South Craig SH - Scaife Hall SKIBO - Skibo WEH - Wean Hall WH - Warner Hall WHIT - Whitfield Hall
CARNEGIE MELLON FACTS 1995
Questionnaire
1. What additional information would you like to see in Carnegie Mellon Facts next year?
2. What information or tables should be excluded?
3. Do you find the information readable? Would you like to see more graphs or other visual aids? Please elaborate.
4. Did you find any of the titles, information, symbols or tables to be confusing? Please explain.
5. Please add any other relevant comments here.
(Optional)
Name:
Department:
[Top of this page] [Fact Book Main Page]
Last update: 7/12/95
file:///H|/Common/Admin%20&%20Office%20Productivity/Planning%20Website/ira/factbook/facts95/appendix.html (11 of 11)10/24/2008 2:41:46 PM