
Carnarvon A Case Study of Increasing Levels of PV...
49
April, 2012 Author: Simon Lewis, CEEM, University of NSW With funding support from the Australian Solar Institute Carnarvon A Case Study of Increasing Levels of PV Penetration in an Isolated Electricity Supply System
Transcript of Carnarvon A Case Study of Increasing Levels of PV...

April, 2012
Author: Simon Lewis, CEEM, University of NSW
With funding support from the Australian Solar Institute
Carnarvon
A Case Study of Increasing Levels of PV Penetration in an Isolated Electricity
Supply System


REPORT PREPARATION AND CONTACT INFORMATION
Report Prepared For:
The Australian Photovoltaic Association (APVA) ABN 91 006 005 190 www.apva.org.au
Contact:
Dr. Muriel Watt APVA Chair [email protected]
Report Funded by:
The Australian Solar Institute 10 Murray Dwyer Circuit Mayfield West NSW 2304
Report Prepared By
The Centre for Energy and Environmental Markets (CEEM) University of New South Wales Sydney 2052 Australia Ph: +61 2 9385 4920 www.ceem.unsw.edu.au
Contact: Associate Professor Iain MacGill Joint Director (Engineering) [email protected]
Report Author: Simon Lewis CEEM Researcher [email protected]
With the Active Involvement of:
Horizon Power PO Box 1066 18 Brodie Hall Drive Bentley DC, Western Australia 6102 Australia www.horizonpower.com.au
Contact:
Dr. James Darbyshire Power Systems Engineer [email protected]
This report should be referenced as: "APVA/CEEM (2012) Carnarvon: A Case Study of Increasing Levels of PV Penetration in an Isolated Electricity Supply System, a report by the UNSW Centre for Energy and Environmental Markets for the Australian PV Association".

ACKNOWLEDGEMENTS
The APVA and CEEM would like to acknowledge and thank all who contributed to this report. In particular the following people and their organisations deserve special mention for the support, time and effort they provided while undertaking the case study and during the preparation of this report:
APVA o Muriel Watt o Anna Bruce
CEEM o Iain MacGill
ASI o Mark Hancock
Horizon Power o James Darbyshire o Bruce Blechynden o David Stephens o Ross Bowden o David Edwards o Scott Davis o James Chow o Eddie Smith o Mark Bruce
Carnarvon Community o David Kearney o Brad Cox o Alexander Fullarton o Shire of Carnarvon Airport
EMC o John Davidson
UNLTD Energy o Max Willrath o Kieron D’Arcy
Sunpower o Wilf Johnston
SMA o Prateek Chourdia
The APVA and CEEM would particularly like to thank James Darbyshire and Bruce Blechynden of Horizon Power for their extensive efforts in assisting with the completion of this report.
This project has been financially supported by the Australian Government through the Australian Solar Institute (ASI), part of the Clean Energy Initiative. The Australian Government, through the ASI, is supporting Australian research and development in solar photovoltaic and solar thermal technologies to help solar power become cost competitive with other energy sources.
Disclaimer: While considerable efforts have been made to ensure that the information contained in this report is fair and accurate, the University of New South Wales as represented by its Centre for Energy and Environmental Markets (CEEM), the Australian PV Association Inc. (APVA) and any other persons involved in the preparation of this report (a) exclude all warranties and representations, express or implied, whether statutory or otherwise, with respect to the information contained in this report; and (b) assume no liabilities with respect to any loss or damage suffered as a result of the use of or reliance on any information in this report. The views expressed herein are not necessarily the views of the Australian Government, and the Australian Government does not accept responsibility for any information or advice contained herein.

TABLE OF CONTENTS
1 EXECUTIVE SUMMARY ............................................................................................................................. 4
2 INTRODUCTION ........................................................................................................................................ 8
3 CASE STUDY APPROACH ......................................................................................................................... 10
4 THE CARNARVON ELECTRICITY SUPPLY SYSTEM AND PV PENETRATION LEVELS .................................. 12
4.1 The Carnarvon Electricity Supply System ..................................................................................... 13
4.2 Policy Influences of PV in Carnarvon ............................................................................................ 17
4.3 PV Systems in Carnarvon .............................................................................................................. 17
4.4 PV System Arrangement ............................................................................................................... 20
5 KEY EXPERIENCES TO DATE WITH INCREASING PV PENETRATION LEVELS ............................................ 24
5.1 Network level PV System Impacts ................................................................................................ 24
5.2 Distribution Level PV System Impacts .......................................................................................... 29
5.3 Power System Benefits From PV Integration ............................................................................... 35
5.4 Summary of Key Experiences ....................................................................................................... 37
6 Conclusions and future work ................................................................................................................. 40
6.1 Conclusions ................................................................................................................................... 40
6.2 Future Work for the Carnarvon Network ..................................................................................... 41
6.3 Next Steps ..................................................................................................................................... 42
APPENDIX 1 - IEA PVPS TASK 14 ....................................................................................................................... 43
APPENDIX 2 – Further High PV Penetration Information Resources ............................................................... 44
APPENDIX 3 – Individual Contributors to the Report ....................................................................................... 45
APPENDIX 4 – Carnarvon PV System Distribution ............................................................................................ 47

PV Penetration Case Study - Carnarvon (April 2012) Page 4
1 EXECUTIVE SUMMARY
The Case Study
This report presents the results of a case study undertaken into the technical challenges posed by the growing photovoltaic (PV) penetration in the Carnarvon electricity supply network. This case study is the second in a series of case studies aimed to give Australian and international audiences insights into some of the key technical challenges and management options to facilitate high PV penetrations in Australian electricity networks. These case studies are being undertaken as a part of the broader Australian research project entitled “Support for Australian participation in an international RD&D collaboration on Photovoltaics – IEA PVPS Task 14: High Penetration of Photovoltaic systems in electricity grids”. It is hoped that this research project will ultimately establish methods to facilitate higher PV penetrations in Australia and internationally.
Carnarvon
The Carnarvon distribution network is an isolated gas/diesel generation grid with a relatively high penetration of dispersed embedded PV systems by the current Australian experience. This high PV penetration is coupled with a strong solar resource (an average daily solar insolation of 6.2kWh/m2). PV penetration is estimated to peak at 13% of system load at midday in both summer and winter. Consequently, impacts on the distribution network due to PV systems are starting to emerge. In 2011 the concerns about these impacts were sufficient enough for Horizon Power (the utility that owns and operates the Carnarvon distribution network) to apply a limit of 1.15MWp of distributed PV system capacity on the distribution network. Given strong community support for PV in Carnarvon this has understandably created concerns regarding possible future PV deployment. Horizon Power is seeking to better understand the potential impacts of PV on the Carnarvon grid and their potential management, including facilitating the APVA and CEEM to undertake this case study.
The Carnarvon distribution network is primarily radial in nature with some long rural feeders, and comprises in total of some 200km of overhead lines servicing approximately 5300 people. The peak system load to date is 11600kW and the average system midday loads are approximately 6800kW in summer and 5000kW in winter, 60% of the peak demand is from commercial/industrial loads with the remaining 40% resulting from residential loads. The power station in Carnarvon is also owned and operated by Horizon Power and comprises 13 generator sets which are predominantly dual fuelled by gas and diesel and have a nominal rating of 22100kW which is derated to 15900kW in summer. The generating strategy in Carnarvon is to operate with enough spinning reserve to cover the loss the largest online generator. This also sets the limit for the amount of distributed PV in the town given the concern that some power system events might see all PV disconnect from the system at the same time when generating at maximum output.
Currently there is 1090kWp of nominal PV capacity connected to the distribution network. The majority (57%) of the systems were installed in 2010 in part due to policy drivers such as a significant State feed in tariff for PV, which was subsequently discontinued due to far greater than expected PV system uptake. The average size of a PV system connected to the distribution network is 8.30kWp despite there being only one commercially sized system (60kW), this is significantly higher than the average system size seen on the main grid within Australia. The PV distribution in Carnarvon is also quite clustered with one medium voltage feeder loaded to 39% of its average midday load and distribution transformers loaded up to 70% of the rated capacity of the transformer.
Key Experiences to date
In general this case study found that there were some instances of system wide and localised challenges in the Carnarvon distribution network associated with the PV systems connected to the grid. Horizon Power is undertaking network studies and trials in order to permit further distributed PV systems to connect to the distribution network, whilst maintaining a reliable and safe supply. It is

PV Penetration Case Study - Carnarvon (April 2012) Page 5
possible that these trials will show that regulations, such as the 20% connection limit on distribution transformers, can be relaxed. If the trials and mitigation strategies prove to be successful a relaxation of the hosting capacity may be possible, however if this is the case it is recommended that further PV systems are installed in a controlled and monitored fashion. There are some key current and proposed strategies to mitigate the negative effects found due to PV systems and Table 1 below summarises these for the identified PV integration challenges. Benefits associated with PV integration in Carnarvon are also presented in the table.
PV Penetration
Experience
System
wide or
localised
Summary of the experience
Current/Proposed Management
Strategies
PV systems
impact on
network
stability due to
inverter anti
islanding
protection
detecting
significant
frequency
deviations
System There has been one recorded
instance of multiple PV systems
disconnecting due to a system
wide frequency disturbance,
resulting in additional load for
the central generator to cover
rapidly. A lack of standardisation
amongst inverter anti islanding
protection settings within
AS4777 is also a concern.
Current:
Operating the network with
sufficient spinning reserve to
maintain the network if PV
systems disconnect
Trial:
Dispatchable load trial to
increase system capability to
respond to such disturbances
Proposed:
Review of and PV inverter
protection settings
Community solar farms with
feed in management
Voltage rise in
LV networks
Localised There have been two recorded
instances of significant LV
network voltage rises have been
identified in Carnarvon. Both
problems have been resolved
and the networks brought back
within acceptable limits by
reconfiguring the distribution
transformer tap changer or line
augmentations.
Current:
Rectification of phase
imbalance with respect to
both loads and PV system
connections
Distribution transformer tap
setting changes
Load shifting.
Network augmentation
Trial:
Voltage regulation technology
PV system
impacts on
network
stability due to
cloud
fluctuations
System There have been no recorded
system-wide fluctuations in load
due to PV output variability.
However significant fluctuations
have been observed on a
localised level. It is possible that
with increased PV penetration
this effect will be more evident
on the supply network.
Current:
Operating the network with
sufficient spinning reserve to
maintain network stability
with PV system fluctuations
Trials:
Cloud sensor technology
Proposed:
Further monitoring of system
loads and PV generation

PV Penetration Case Study - Carnarvon (April 2012) Page 6
PV Penetration
Experience
System
wide or
localised
Summary of the experience
Current/Proposed Management
Strategies
Fires due to PV
systems
Localised There has been one reported
instance of a fire caused by a PV
system, made even more serious
due to continued PV generation
during the fire.
Current:
Management procedures are
in place to ensure correct
panel installations
Proposed:
Extended fire fighter training
Change to problematic
junction box designs.
PV system
impact on
planning
strategies
System
and
localised
The variability of PV system
output makes it difficult to plan
for system peak loads as seen by
the dispatchable generation.
There is also a push for more
commercial sized systems to
connect to the network.
Current:
Work is being undertaken on
forecasting the impact of PV
systems on the network load
levels
Trial:
Horizon Power is trialling a
feed in management system
for a 300kW system installed
Feb 2012.
System
Islanding
System
and
Localised
Investigation has been
undertaken into the possibility of
network islanding due to PV
systems and has concluded that
it is extremely unlikely to occur
in the current configuration.
Current:
LV network is earthed prior to
work
Proposed:
PV inverter protection
settings are being reviewed in
line with the impact on
system stability and in line
with studies mentioned
above. Horizon Power would
prefer that all inverters are
set to a fixed value rather
than be variable inside a
range.
System
Harmonics
from PV
inverters
Localised Past investigations on the
Carnarvon network have
indicated no prior problems with
harmonics. Results examined in
this case study reinforce that PV
systems are having little effect
on network harmonics.
Proposed:
Monitoring at higher PV
system penetrations is
important to ensure that the
PV systems don’t affect
network harmonics into the
future

PV Penetration Case Study - Carnarvon (April 2012) Page 7
PV Penetration
Experience
System
wide or
localised
Summary of the experience
Current/Proposed Management
Strategies
Reverse Power
Flow
Localised Currently PV systems are causing
localised backfeeding through
some distribution transformers
but no significant effects are
visible on the 22kV network.
Proposed:
Monitoring at higher PV
system penetrations and a
review of protection schemes
is needed to prevent
potential future problems
Reduction in
generator fuel
use
System The current PV system
generation in the network is
resulting in a generator fuel
saving which is equivalent to
approximately 830 tonnes CO2
per annum.
Benefit:
There is potentially significant
value in such fuel savings
depending on gas/diesel
prices. The value of climate
change abatement with PV is
also potentially significant. By
managing the spinning
reserve strategy effectively
and increasing the amount of
PV in the system these
benefits can be maximised.
Offsetting of
peak summer
loads with PV
generation
System PV generation generally
corresponds well with the peak
system loads implying possible
deferral of network upgrades,
and benefits can be further
maximised by adjusting
customer loads.
Benefit:
Analysis is currently being
undertaken to estimate the
amount that the PV systems
can contribute to peak
demand reduction in order to
fully realise this benefit in
terms of system planning
Table 1: Summary of the key findings of the Carnarvon Case study
Figure 1: 5kW system on the roof of the Horizon Power depot

PV Penetration Case Study - Carnarvon (April 2012) Page 8
2 INTRODUCTION
This report presents the technical experiences of key stakeholders resulting from the integration of a high penetration of photovoltaic (PV) systems in an isolated electricity grid. The report focuses on the electricity grid in the Australian town of Carnarvon in Western Australia. Key stakeholders consulted during the case study included the network supply utility (Horizon Power), local PV system installers, commercial PV system installers, local PV system owners, and local community PV advocates.
This case study is the second in a series of case studies to be undertaken as part of a broader Australian research project titled “Support for Australian participation in an international RD&D collaboration on Photovoltaics – IEA PVPS Task 14: High Penetration of Photovoltaic systems in electricity grids”. This research project is being co-ordinated by the Australian Photovoltaic Association (APVA1), in conjunction with the Centre for Energy and Environmental Markets (CEEM2) at the University of New South Wales, and with funding from the Australian Solar Institute (ASI3). The initial case study was on the Alice Springs electricity supply system in the Northern Territory of Australia; a copy of this report can be found at the APVA website1.
The broad aims of the overarching AVPA research project are to:
Enhance understanding of the technical, economic and regulatory requirements needed to facilitate high levels of PV penetration in electricity grids in Australia; and
Support Australia’s active participation in the International Energy Agency’s Photovoltaic Power Systems Program Task 14 (IEA PVPS Task 144), which provides a forum for all IEA countries to share knowledge and experiences on the integration of high levels of PV into electricity grids.
Other sites with significant or rapidly increasing PV penetration currently being considered for case studies are:
Magnetic Island (near Townsville, QLD)
Norfolk Island (~1,500km east of Brisbane)
Newington Olympic Village (Sydney)
Blacktown Solar City (Sydney)
More detailed information on the IEA Task 14 program is provided in Appendix 1, while Appendix 2 contains links to further information resources on the integration of high levels of PV into electricity grids.
Carnarvon was selected for this case study for the following reasons:
Carnarvon is a small isolated grid with a relatively high density of PV as a function of system load (13% approx. of summer and winter midday loads). This relatively high level of PV penetration presents particular technical integration challenges that will likely emerge in the future for other isolated grids in Australia and internationally as the fuel and emissions savings of PV become increasingly valuable. The case study therefore has the potential to provide learnings that are widely applicable.
Growing concerns about the potential impacts of high PV penetrations has led Horizon Power (the utility that owns and operates the Carnarvon network) to apply a limit to the
1 www.apva.org.au
2 www.ceem.unsw.edu.au
3 www.australiansolarinstitute.com.au
4 www.iea-pvps.org/index.php?id=58

PV Penetration Case Study - Carnarvon (April 2012) Page 9
total distributed PV allowed in Carnarvon. Other reasons for the limitation of PV systems on the Carnarvon network include the lack of resources available for the connection of the systems and Horizon Powers regulatory/commercial obligations. An improved understanding of these PV impacts will facilitate Horizon Power, local communities, and the operators of other isolated grids, in understanding and managing key challenges associated with higher PV penetrations, and possibly lead to higher hosting capacities in the future.
Similarly to Alice Springs, Carnarvon has a small isolated supply system, with centralised diesel/gas generators and long rural feeders, providing an opportunity to consolidate and compare findings related to this type of grid. The higher PV penetration in Carnarvon is also likely to present increased challenges, providing a logical progression from the previous case study.
Community involvement with PV systems has been a major driving force behind the large penetration of PV in Carnarvon, allowing for productive engagement with multiple stakeholders.
Horizon Power has been actively pursuing options to increase hosting capacity to allow more PV installations to connect to its networks. The thinking behind these trials will be useful to examine as possible enablers for higher PV penetrations on isolated grids.
In light of the above unique attributes of the Carnarvon case study the specific aims of this case study are to:
Document the technical experiences of various stakeholders in integrating high levels of PV into the Carnarvon grid, particularly those of Horizon Power the generator and network operator.
Investigate any effects the high penetration of PV may be having on the stable operation of the Carnarvon network in line with its nature as an isolated grid.
Investigate whether the existing levels of PV penetration on Carnarvon’s LV networks are causing power quality issues.
Present actions being taken by key stakeholders to facilitate successful PV integration.
The remainder of this report will follow the structure outlined below:
Case study approach
The details of the case study area, including the supply system and the PV penetration levels
The technical issues and benefits identified in the grid that are attributed to the influence of the PV systems and strategies undertaken to manage the issues
Conclusions based on the findings and recommended future work

PV Penetration Case Study - Carnarvon (April 2012) Page 10
3 CASE STUDY APPROACH
The steps taken in developing the case study were to:
engage key stakeholders,
undertake a site visit to interview all relevant stakeholders and discuss their experiences with PV integration,
gather and process data to investigate technical issues, and
compile all information into a report, which is to be disseminated to an Australian and international audience via the Australian PV Association, the Australian Solar Institute and IEA PVPS Task 14.
Questions asked of stakeholders were focused on the technical challenges associated with integrating a high penetration of PV systems in Carnarvon. The main issues covered in discussions are listed below. Every effort was made to engage a variety of stakeholders in order to deliver a complete and independent report.
PV power output variability (e.g. rapid PV power fluctuations due to clouds affecting generation and/or distribution network)
Network voltage management (e.g. higher voltage on feeders due to high PV power injection)
PV systems dropping out (e.g. multiple inverters cutting out due to high/low network voltage or frequency)
Reverse power flow through network equipment (e.g. through zone sub transformers)
Reduced peak load pressures on network (e.g. from reduced summer daytime demand)
Reduced fuel/generator use (e.g. from increased PV energy contribution)
Power factor management (e.g. power factor support/problems)
System frequency management (e.g. harmonics from inverters)
Protection issues (e.g. protection equipment not operating due to PV systems feeding faults)
Islanding (i.e. stand-alone operation of part of the network in the event of a network failure)
Other network operational issues (e.g. tap-changer cycling, inverter behaviour during recloser operation)
Some background on key stakeholders and a summary of their contributions are presented below. Appendix 3 presents more information on individuals who contributed to this report.
Horizon Power o Horizon Power is the generator and network supply utility in Carnarvon, which was
instrumental in providing the network data and information required to compile this report. Engineering sections were engaged to give their opinion on the technical issues the network is experiencing and how the network can be managed in light of these issues. Local network operators were also engaged to reveal the issues experienced on the network first hand and give insight into how the network is operated. Strategies for further PV system integration were also discussed.
Local PV system installer o This stakeholder was the major PV system installer in Carnarvon and provided first-
hand information concerning the issues the inverters were having staying connected to the network, and any problems the PV systems were experiencing that required repairs.
Commercial PV system installers o Various PV system installers based in the state capital city, Perth, were interviewed
to get further information into the connection process from a non-utility point of view. Drivers and barriers for PV system integration were discussed along with integration strategies which could benefit all stakeholders
Local PV system owners

PV Penetration Case Study - Carnarvon (April 2012) Page 11
o The stakeholders engaged here were able to give insights into the performance of their PV systems and any connection issues they were experiencing. The individuals who were visited had experienced some issues and also had PV system performance data available.
Local community PV advocates o The local community has played a vital role in driving the uptake of PV systems in
the Carnarvon region. This engagement provided an alternative view of the connection issues faced and also provided insight into strategies to deliver a higher penetration of PV systems
Figure 2: Side view of one row of a Horizon customer (Lex Fullarton)’s 47kWp PV array

PV Penetration Case Study - Carnarvon (April 2012) Page 12
4 THE CARNARVON ELECTRICITY SUPPLY SYSTEM AND PV PENETRATION LEVELS
Carnarvon is a town of approximately 53005 people situated on the western coast of Australia, 906km NW of Perth at the mouth of the Gascoyne River.
Carnarvon primarily has a subtropical climate, with predominately sunny weather and a prevalence of strong winds in the afternoon. Additionally, the summer months usually experience heavy rains, with the possibility of cyclones. Figure 3 below depicts average temperature and humidity in Carnarvon over a 12 month period.
Figure 3: Average temperature and humidity readings from 1945 to the present. Data is from the Bureau of Meteorology6 weather station at Carnarvon Airport.
Carnarvon has a very rich solar resource averaging 211 sunny days per year, with an average solar exposure of 22 MJ/m2/day (or 6.24 kWh/m2/day), as is shown in Figure 4 below. By comparison, Sydney has an average solar exposure of 16.9 MJ/m2/day. It should also be noted here that Carnarvon is located on a similar latitude to Alice Springs and has similar solar irradiation levels allowing some parallels to be drawn with the previous case study, additionally average daily winter sun exposure is less than half that of the peak summer month.
5Australian Bureau of statistics: 2006 Census QuickStats : Carnarvon (Urban Centre/Locality),
http://www.censusdata.abs.gov.au/ABSNavigation/prenav/LocationSearch?collection=Census&period=2006&areacode=UCL504000&producttype=QuickStats&breadcrumb=PL&action=401 2007
6 Australian Government Bureau of Meteorology: Carnarvon, Western Australia January 2012 Daily Weather
Observations http://www.bom.gov.au/climate/dwo/IDCJDW6024.latest.shtml retrieved Dec 2011

PV Penetration Case Study - Carnarvon (April 2012) Page 13
Figure 4: Carnarvon mean daily solar exposure. There are implications for lower PV generation in the winter months due to a lower mean solar exposure.7
4.1 The Carnarvon Electricity Supply System
The Carnarvon electricity supply system is quite diverse. The distribution system is radial in nature and comprises of a mixture of rural and urban feeders, including some long rural feeders, as is shown in Figure 5 below. The system is entirely overhead and consists of 205km of supply lines. The supply system voltage levels include 6.6kV for the centralised generator, 22kV for the medium voltage network and a typical Australian 415V LV system which is supplied by 47 distribution transformers. The distribution network is entirely owned and operated by Horizon Power.
7Australian Government Bureau of Meteorology: Climate statistics for Australian locations
http://www.bom.gov.au/jsp/ncc/cdio/cvg/av?p_stn_num=006011&p_prim_element_index=31&p_display_type=statGraph&period_of_avg=ALL&normals_years=allYearOfData&staticPage retrieved Dec 2011

PV Penetration Case Study - Carnarvon (April 2012) Page 14
Figure 5: The Carnarvon medium voltage (22kV) network. Note the city centre urban type network at the mouth of the river compared to the rural type network out of town.
The generation plant in Carnarvon is also owned and operated by Horizon Power. The day time spinning reserve is the current limit for distributed PV systems in Carnarvon, which is currently 1.15MWp. This also allows for the loss of the largest online generator without enacting any pro-active load shedding. Arrangements have also been made with customers with large loads (in particular a nearby salt mine) to provide warning on the timing of the start-up of these loads to allow for the spinning reserve to be appropriately adjusted for increased load and thus maintain stable and economic operation of the centralised generators. The impact of the PV systems on the generation requirements is discussed in further detail in section 5.1 of this report.
The centralised generation consists of the generator sets listed in Table 2. The generator operating strategy is generally to use the mobile sets to provide base load power, with the Wartsila sets providing the rest of the load requirements. The Allen and Mirrlees generator sets are ageing assets and are only operated if the network urgently requires them.
A new power station is currently under construction in Carnarvon to replace the existing power station. The new station will be phased into the network over a period of time, eventually allowing the existing power station to be transformed to a network substation. The new station is located to the south east approximately 6km south of town and will be joined to the existing power station by dual 22kV underground cables. The motivation behind the construction of the new power station is to relocate the centralised generation to a more suitable location out of town to reduce noise and also to replace the existing assets.
Key:
South River Feeder
Town Feeder
North River Feeder
Babbage Island Feeder
South Carnarvon Feeder

PV Penetration Case Study - Carnarvon (April 2012) Page 15
Generator Set Description Quantity Generator Speed (rpm)
Fuel Type Nominal rating (kWp)
Summer rating level
(kWp)
Mobile Sets Cummins QSK45
5 1500 Diesel 1120 800
Mobile Set Detroit 1 1500 Diesel 1200 800
Wartsila 12V25SG 3 1000 Gas/Diesel hybrid
2340 1500
Allen GBC-8S37E 1 600 Gas/Diesel Hybrid
1200 1200
Mirrlees KP8-major 1 500 Gas/Diesel Hybrid
2240 1800
Mirrlees KP8-major 1 500 Gas/Diesel Hybrid
2500 1800
Mirrlees KP8-major 1 500 Gas/Diesel Hybrid
2305 1800
Totals 13 N/A N/A 22065 15900
Table 2: Description of the generator sets utilised in the existing Carnarvon power station. Note that the sets are derated in summer to meet generator heat level requirements
The peak load profile is predominately commercial/industrial (approximately 60% of the 1:30pm peak) including a salt mine which has a relatively large impact on system load profiles. The system load levels are shown below in Table 3. Additionally, Figure 6 and Figure 7 below depict the summer and winter peak and average day load profiles. What is of particular interest here is the extent of PV generation correlating with summer peak load.
System Load Description Time of Day Value (kW) % of Generation Capacity
Summer Peak Load 15:00 11560 72%
Summer Average Day Peak Load 14:00 7000 45%
Summer Average Day Midday Load 12:00 6842 43%
Winter Peak Load 18:00 7570 34%
Winter Average Day Peak Load 19:00 6000 27%
Winter Average Day Midday Load 12:00 5000 23%
Table 3: System load summary. The underlying data is taken at 5 minute increments and the peak loads shown are the highest loads recorded since 2006.

PV Penetration Case Study - Carnarvon (April 2012) Page 16
Figure 6: Carnarvon average peak day and average load profile in summer over the period 2006-2011 with estimated aggregate PV system output
Figure 7: Carnarvon average peak day and average load profile in winter over the period 2006-2011 with estimated aggregate PV system output 8
8 To construct the average day, loads are averaged at each 5 minute period for all days since 2006. The peak
loads are the average of the peak days recorded each year since 2006. The PV system generation is estimated aggregate output based on PV system data in Carnarvon and PV system modelling.

PV Penetration Case Study - Carnarvon (April 2012) Page 17
4.2 Policy Influences of PV in Carnarvon
State and federal government policies have been a major driver for PV system uptake in Carnarvon. Table 4 below depicts a summary of the State Government Feed in Tariff (FiT) and Horizon Power’s Renewable Energy Buyback Scheme (REBS)9, which have both been major drivers for PV uptake. Other schemes of note are the federal government’s RRPGP10 scheme, the of the Renewable Energy Target scheme (certificates for each MWh deemed to be generated by systems up to 20 kWp) and the solar credit multiplier (until 2013, a multiplier, stepping down over time from 5x to 2x, applies to the first 20 kWp of PV installed )11.
Date Details
27/5/2010 58.93c/KWh net feed in tariff announced by the state government – commenced 1/8/2010. Composed of 40c/KWh FiT and 18.93c/KWh from REBS in the Horizon Power area only, different tariffs applied for the Western Power jurisdiction.
1/7/2011 (Announced on 19/5/2011)
FiT reduced from 40c/KWh to 20c/KWh thus reducing the total scheme to 38.96c/KWh. This is due to the rapid PV uptake in the state over the calendar year to total 70MWp installed capacity. A FiT cap of 150MWp across WA was also introduced at this time, however the hosting capacity in Carnarvon was reached prior to the 1st of July.
22/8/2011 FiT suspended as the quota has been met. The tariff benefits available in Carnarvon from installed PV has reverted back to REBS 18.93c/KWh
Table 4: Summary of State and Utility Feed in Tariff changes by date in Carnarvon.
Also of note here is the policy implemented by Horizon Power in 2011 to limit PV in the Carnarvon network on the basis of potential PV impacts on network power quality and security of supply. As of 20/7/2011 no new renewable energy systems (regardless of size) were allowed to be connected in Carnarvon due to an applied total PV hosting capacity of 1.15MWp, unless connected under a Power Purchase Agreement (PPA) with Horizon Power. This would allow Horizon Power a degree of control over the output of the system if required to maintain power quality and reliability. It should also be noted here that Horizon Power has committed to reviewing this decision with the aim of potentially connecting additional PV systems to the network, provided that the network is deemed to be capable of accommodating them.
4.3 PV Systems in Carnarvon
Penetration has rapidly increased since 2006, with peaks in 2008 and 2010-11, as is shown in Figure 8 below. Government incentives for PV customers, rising electricity prices and decreasing prices for PV systems have caused strong growth in uptake of PV systems in Carnarvon. The community in general has also strongly advocated for the installation of PV, which has resulted in a culture that is supportive of PV development. Interviews with the community in Carnarvon indicate that this manifests itself in the demand for PV systems (despite the current limit) as well as a friendly competitive atmosphere that sees individuals striving for higher PV system performance.
9 Horizon Power: Renewable Energy Systems
http://www.horizonpower.com.au/documents/REBS_FACTSHEET3406467.PDF retrieved Dec 2011
10 Australian Government Department of Climate Change and Energy Effieciency: Renewable Remote Power
Generation Program (RRPGP) http://www.climatechange.gov.au/what-you-need-to-know/renewable-energy/rrpg-program.aspx 2011
11 Australian Government Office of the Renewable Energy Regulator: Solar Credits
http://www.orer.gov.au/sgu/solarcredits.html Dec 2011.

PV Penetration Case Study - Carnarvon (April 2012) Page 18
Figure 8: Timeline of installed PV in Carnarvon. There is a high prevalence of large PV systems in Carnarvon; in fact the average nominal system size on the network is 8.30kWp compared to a 2.2kWp average PV system size in Australia12. The only commercial scale system currently connected to the network is a 67kWp hybrid PV and wind turbine system (51kWp of PV and 3 x 5kWp wind systems). This system is also the only PV system currently connected with more than 10kWp per phase; this level is mainly due to the REBS eligibility limits on system size. A large number of the systems visited during the case study were installed on sheds/roofs which offered relatively flat mounting space (beneficial as Carnarvon is above the tropic so the sun is in the southern part of the sky in summer and the northern part of the sky in winter) and the panels were generally unshaded. A small number of residents have experimented with single and dual axis tracking systems. Table 5 below summarises the range of PV systems on the network.
Category # Nominal Capacity
(kWp)
% of installed
capacity
Estimated annual energy production
(MWh)
Residential Systems
0-10kW 89 448 41 856
10-30kW 38 577 53 1105
Total Residential 127 1025 94 1961
Commercial Systems
Total Commercial 1 67 6 127
Currently Installed PV Systems 128 1092 100 2088
Table 5: Summary of the range of PV systems connected to the Carnarvon network. Note that the estimated daily energy production is 5.24kWh/kW and this figure was derived from the data
supplied by Horizon Power.
12
Australian PV Association: Impacts of Photovoltaic Systems and Feed-In Tariffs on Australian Residential Electricity http://www.ata.org.au/wp-content/projects/apva_fit_report.pdf May 2011

PV Penetration Case Study - Carnarvon (April 2012) Page 19
It should be noted here that at the time this report was being compiled EMC solar were installing a 300kWp PV system in Carnarvon under the RRPGP scheme. This system was connected to the network in early January of 2012 and Horizon Power is currently collecting data from the installation. The system has 100kWp of single axis tracking PV panels with the other 200kWp being fixed PV panels. There is scope in the future of the project to implement a solar thermal storage system with the view of using the storage to reduce the variability of the systems output and provide power outside of sunshine hours. Whilst the installation of this system causes the total installed capacity to significantly exceed the nominal 1.15MWp limit dictated by Horizon Power the connection was allowed due to an agreement over the amount of operational control Horizon Power will have over the system and the implementation of grid support measures. Further discussion on the feed in management system associated with this project is found in section 5 of this report.
The current nominal PV system capacity on the network is 1087kWp, but the data analysis has indicated that the estimated average daily peak production value is approximately 775kW. The peak power produced is lower than the nominal capacity due to the normal losses expected from PV systems in the field13. The calculation of the aggregated PV system production utilised the average of modelled PV system output from the NREL model SAM14 with satellite derived weather data from the Australian Bureau of Meterology15 as an input, measured data from four 5kWp systems oriented NE and NW, and measured data from a 2.5kWp system oriented North. The non-optimal orientation of the 5kWp systems reflects the expected non-optimal orientations typically encountered in some rooftop PV installations and the methodology results in a performance ratio of approximately 70%. Table 6 below gives an overview of estimated PV performance in different weather conditions whilst Table 7 below summarises the PV penetration levels on the network given average and peak system loads.
Season Weather Average midday temperature ( 0C )
Rated Capacity
(kWp)
PV Performance
Ratio (%)
Estimated PV
Production (kW)
Summer Sunny 33 1087 83 899
Cloudy 34 1087 38 417
Winter Sunny 23 1087 60 651
Cloudy 21 1087 13 137
Table 6: Estimated values of PV output in different weather conditions, based on data gathered during the case study.
13
PV modules have a nominal capacity (measured in Wp), which is measured at standard test conditions, under solar radiation of 1000W/m
2 and at a cell temperature of 25°C. PV system output is reduced compared
to rated capacity by solar insolation levels being lower than the standard test conditions, non-optimal tilt and orientation angles, cells operating at higher than 25°C, inverter and wiring inefficiencies, module soiling and module ageing in the field. 14
https://sam.nrel.gov/ 15
As per the method described in Elliston, B., Diesendorf, M. and MacGill, I., Simulations of Scenarios with 100% Renewable Electricity in the National Electricity Market, at the Australian Solar Energy Society Conference, Sydney, 1 Dec 2011

PV Penetration Case Study - Carnarvon (April 2012) Page 20
PV Penetration Measure
PV Measure
Estimated Value
System Measure
Value % PV Pen.
PV Capacity Penetration
Installed Nominal PV Capacity
1087 kWp Peak Load 11560 kW 9%
PV Peak Power Penetration -
Summer
Est. Summer Midday PV Peak
Power
899 kW Ave. Summer Midday Load
Demand
6842 kW 13%
PV Peak Power Penetration -
Winter
Est. Winter Midday PV Peak Power
651 kW Ave. Winter Midday Load
Demand
5000 kW 13%
PV Peak Power Penetration -
Average
Est. Average Midday PV Peak
Power
775 kW Average Midday Load
Demand
5921 kW 13%
PV Annual Energy Penetration
Est. Annual PV Energy
1.5 GWh Annual Gross System Load
49 GWh 3%
Table 7: Summary of the PV penetration and load levels on the Carnarvon network.
4.4 PV System Arrangement
The majority of the PV systems in Carnarvon are within a 24km2 area representing the urban part of the township. Within this area there are clusters of PV systems where neighbours have been encouraged to install PV systems. The remaining systems outside this area tend to be larger and separated over rural feeders. Figure 9 below depicts the current clustering of PV systems in Carnarvon.
Figure 9: The spatial arrangement of PV systems in Carnarvon. Note the clustering of systems in the urban area of town. Appendix 4 shows a larger version of this map.

PV Penetration Case Study - Carnarvon (April 2012) Page 21
This clustering of systems has implications for system stability as passing cloud cover has the potential have a very rapid and highly correlated effect on the majority of systems connected to the grid resulting in a change in generation which is seen by the central generator as a step load change. This effect is discussed further in section 5.1.2 of this report. PV systems are generally spread out fairly evenly amongst the 22kV feeders in Carnarvon with the exception of the South River Feeder which hosts 467kW nominal PV system capacity as is shown in Table 8 below. Table 9 contains a further analysis of the South River, indicating the extent of the highest localised penetration in the distribution network. Figure 10 below compares cloudy and sunny load profiles on the South River Feeder in summer. It can be seen that the effect of increased load, likely due primarily to air conditioning use on sunny days, outweighs the effect of the PV systems on the feeder load. Note that the 300kWp system that is being installed will be connected to the South River Feeder, which will significantly increase the amount of PV installed on the feeder.
22kV Feeders
Feeder Rating (kW)
Nominal PV System
capacity (kWp)
% of Feeder
Cap
Number of PV
systems
CRN 502.0 SOUTH RIVER FEEDER 5716 467 8% 48
CRN 504.0 TOWN FEEDER 5716 183 3% 29
CRN 509.0 NORTH RIVER FEEDER 5716 155 3% 11
CRN 510.0 BABBAGE ISLAND FEEDER 5716 129 2% 16
CRN 507.0 SOUTH CARNARVON FEEDER 5716 123 2% 23
Table 8: PV distribution on 22kV feeders in Carnarvon
Feeder rating 5716 kW
Nominal PV system capacity on feeder 467 kWp
Nominal PV capacity penetration 8%
Estimated PV Peak Output 327 kW
Average Midday Load on feeder 1200 kW
Indicative PV peak power/load penetration 39%
Table 9: Breakdown of the PV system penetration on the South River Feeder. Estimated values are given for summer on a sunny day.

PV Penetration Case Study - Carnarvon (April 2012) Page 22
Figure 10: Comparison of cloudy and sunny days during January on the South River Feeder. Note that sunny day load is higher at midday when PV is producing (effectively reducing the net load on
the feeder) than if it is cloudy, suggested that the increased cooling/irrigation load has a more significant effect on the 22kV load profile, than the PV generation.
The distribution transformers in Carnarvon show a more unequal PV system distribution than the 22kV feeders. The most highly loaded distribution transformers (the top 15 out of 47) are shown in Table 10 below the remaining transformers have a penetration less than 10%. Note that the smaller transformers are generally connected to rural feeders which host larger system sizes, hence the higher probability of having a large PV system capacity. PV penetration on the Gibson has been shown to be high enough to cause backfeeding to the 22kV network as is shown in Figure 11.

PV Penetration Case Study - Carnarvon (April 2012) Page 23
Distribution Transformer Transformer Rating (kVA)
PV System nominal
capacity (kWp)
PV Capacity as a % of Transformer
Capacity
GIBSON 315 221 70%
NR122/6 63 40 63%
NR67/17/106 50 26 53%
NR129 63 30 48%
NR67/17/18 100 40 40 %
BILCICH 63 20 32%
CARNARVON PONY CLUB 200 60 30%
NR90A/4 100 29 29%
FINNERTY 100 29 29%
CARNARVON CHRISTIAN SCHOOL 100 21 21%
RICHARDSON 200 35 17%
NELSON 200 30 15%
ANGELO NORTH 200 30 15%
SILVER CITY 100 12 12%
MUNGULLAH 200 20 10%
Table 10: Top 15 highly penetrated distribution transformers in Carnarvon.
Figure 11: Snap shot of real power on the Gibson transformer for one day in February. Note that during the middle of the day the load is low enough and penetration high enough to cause
backfeeding to the 22kV network.

PV Penetration Case Study - Carnarvon (April 2012) Page 24
5 KEY EXPERIENCES TO DATE WITH INCREASING PV PENETRATION LEVELS
The purpose of this section is to outline the technical experiences of the key stakeholders in regards to increasing penetrations of PV on the Carnarvon network. In summary the current experience highlights that Horizon Power are already experiencing some power quality and security issues with the existing PV penetration on the network and expect these challenges to escalate with an increased penetration of PV systems unless appropriate management strategies are in place. Additionally some customers with PV systems have experienced instances where their inverters have disconnected from the network due to network frequency/voltage fluctuations with implications both to the customers in terms of financial returns from their generation, as well as Horizon Power in terms of system management. Growing concerns, in conjunction with resourcing and regulatory constraints, resulted in Horizon Power enacting a 1.15MW limit on the amount of PV allowed to be connected to the network unless connected with generation management that provides Horizon Power with suitable monitoring and control of system operation. This has in turn resulted in community concerns regarding their options for supporting greater PV deployment and made the prospect of installing PV on the network more challenging for installers due to the extra technical requirements that Horizon Power imposes before permitting connection.
There are two types of PV system integration technical challenges currently being experienced on the Carnarvon network. The first is whole system network level PV system impacts, which includes impacts that are evident at the central generator and have implications for system stability. The other is distribution networks level PV system impacts, which includes impacts that are isolated to localised LV networks and do not translate into problems for the entire network. The sections below discuss each PV system impact, show how the impact has manifested itself in the network using specific examples, discuss the implications of the impact for the stakeholders and discuss strategies that are being implemented to mitigate the problems. The PV systems also have associated benefits with their interconnection and these are outlined in section 5.3. Additionally section 5.4 contains a summary of the experiences with PV systems in Carnarvon in tabular form.
5.1 Network level PV System Impacts
5.1.1 PV Impact on Network Stability Due to Passive Anti Islanding Protection
As per AS4777, every PV system inverter must have anti islanding protection capabilities. The passive component of this protection requires the inverter to disconnect from the network if the voltage or frequency exceeds inverter set points. AS4777 dictates that the set points have to be within the range as shown in Table 11. The Carnarvon network is isolated from the main grid and as such is more susceptible to frequency deviations then large interconnected grids, to maintain grid stability Horizon Power set voltage and frequency limits which are enforced by network protection schemes, these limits are also shown in Table 11. It is clear that if the ranges on the inverters are set within Horizon Power’s allowable ranges, although they will still be in compliance with AS4777, there will be instances where the inverters will disconnect during normal network operation. For example, many European inverters have default frequency set points of 50+/-0.25Hz, which is allowable according to AS4777, and falls inside of Horizon Power’s allowable frequency range of 47.5-52Hz. However, a frequency of 51Hz, for example, would be within Horizon Power’s power quality standards and would therefore cause inverter disconnection during normal network operation. In addition, if a system disturbance occurs, such as a fault on the network, it is likely that an excursion in frequency or voltage will occur, resulting in disconnection of PV systems from the network.
A survey was undertaken as a part of this case study of the types of inverters and the corresponding frequency and voltage set points. A large proportions of inverters in Carnarvon were SMA type and the Australian settings on this inverter are in line with normal network operation and are shown in Table 11.

PV Penetration Case Study - Carnarvon (April 2012) Page 25
LV Parameter Min Max
AS4777 Voltage 200-230V 230-270V
Horizon Power Voltage 225.6V 254.4V
Default SMA Voltage protection set points in Australia
200V 270V
AS4777 Frequency 45-50Hz 50-55Hz
Horizon Power Frequency16 47.5Hz 52Hz
Default SMA frequency protection set points in Australia
45Hz 55Hz
Table 11: Allowable voltage and frequency ranges as per AS4777 and Horizon Power connection guidelines. Note that an installer can modify the default inverter protection set points.
Of particular concern for network stability is the frequency anti islanding protection. This is because voltage excursions are more likely to be localised, only affect a small number of inverters and thus won’t show as a large load fluctuations from the perspective of the power station. Section 5.2.1 of this report has further information on this disconnection mode. Conversely the frequency is constant throughout the network and as such a frequency excursion will be visible to all inverters connected to the network. This has implications for network stability as the simultaneous disconnection of all inverters on the network at times of high sunshine and hence high PV generation will look approximately like a 700kW load switching on to the power station. In the event of a system disturbance the generators are likely to be stressed by continuing operation through the disturbance, resulting in frequency deviations. When the frequency deviation is upwards (representing excess generation to demand) the disconnection of PV might assist in system management although the step change involved will invariably raise control issues. For downwards frequency deviations representing a deficit of generation, the addition of an effective 700kW of load when the inverters switch off is likely to exacerbate the problem, and in extreme cases might even result in widespread failure to meet load. Also as a side note the disconnection of inverters from the network will impact on consumer energy production and thus reduce their financial returns from their PV systems.
Figure 12 below shows frequency readings on the Carnarvon network over a period of 12 months throughout 2010-2011. Whilst the readings show limited excursions from the nominal frequency it should be noted here that a 15 minute data resolution is insufficient to capture the frequency fluctuations which are of the most importance. The lack of specific high resolution data makes it difficult to identify this issue. Routine collection of high resolution system frequency data will help networks understand how inverters are behaving on the network and develop appropriate strategies to prevent simultaneous inverter disconnection.
16
Western Power & Horizon Power: Western Australian Distribution Connections Manual http://www.westernpower.com.au/documents/WA_Distribution_Connections_Manual.pdf 2011

PV Penetration Case Study - Carnarvon (April 2012) Page 26
Figure 12: Frequency measurements taken at 15min intervals from the Carnarvon network over a 12 month period from 2010-2011
There has been one recorded instances where the frequency has deviated outside of the 47.5-52Hz range and activated load shedding protection. During these events load variations were detected which were of a comparable size to the PV penetration on the feeder. It is difficult without high resolution data to identify what caused the frequency deviation and how low the frequency got and for what period of time, however it is possible that the load increases were due to the inverter anti islanding protection disconnecting from the network, but this can not be confirmed. In this instance the additional strain on the generator was manageable possibly due to the relatively low penetration of PV on the network. Anecdotal evidence from community members has suggested multiple events such as this has occurred, leading to the disconnection of all PV systems on the network however network data has been unable to confirm these instances. Further studies are needed in this area to confirm this effect and to clarify the stability implications.
Horizon Power is currently managing this potential impact with their central generator spinning reserve strategy. As mentioned in section 4.1 the current strategy is to operate under n-1 conditions, i.e. the spinning reserve will be enough to cover the load if a main central generator is lost or the simultaneous loss of all PV generators occurs, but not both. This policy reduces the value of PV to power system operation as sufficient central generators are still running, albeit at reduced load, to cover the possible loss of the PV generation. This results in lower efficiency of operation of the central generating sets as well as higher maintenance costs than if the strategy could assume that the PV systems would stay connected at times of downward frequency excursions.
There is also a review underway into the under frequency load shedding procedure being undertaken by Horizon Power. One part of the aims of this review is to check all inverter anti islanding set points in the network and ensure that they are outside network protection settings. For example by having the inverter under frequency disconnection levels at 48Hz and the feeder under frequency load shedding protection at 48.5Hz then in an under frequency event instance the load will be shed before the inverters are, thus easing the strain on the central generators rather than exacerbating it. The community has expressed interest in assisting in this directive as they envisage that common anti islanding set points will allow for the connection of more PV systems.
Another mitigation strategy being trialled by Horizon Power is a customer dispatchable PV/load system. In this scheme a non critical load, comparable in size to the PV system (such as an air conditioner), is connected to the network via a frequency controlled switch. In the instance that the PV systems cut off, the device can instantaneously disconnect a load of a similar size and thus make the net load effect seen by the central generators close to zero. For example a 1kW air conditioner is connected to the network with a 1kWp PV system. If a frequency event causes the PV system to disconnect, the central generator sees a 1kW effective load rise. However, by disconnecting the air conditioner at the same time the central generator sees no net load change, assuming the device was operating and hence consuming power at that moment in time.
PV Penetration Case Study - Carnarvon (April 2012) Page 27
5.1.2 PV System Impacts on System Stability from Cloud Fluctuations
The output of PV systems is subject to variability with changes in solar irradiation. When the systems are highly clustered together (such as in the Carnarvon network), it is possible that large clouds can effectively reduce a large proportion of PV generation in a short period of time. Added into the equation is the cloud edge effect where the power output from PV can increase when cloud is approaching the system as solar irradiation is increased by reflection and refraction from the approaching cloud. The combination of these effects is that passing cloud cover has the potential to cause large and rapid variation in PV system output and when this effect is aggregated on a clustered network the PV output variation appears as rapid load variation to the central generator. Depending on generator ramp rates and spinning reserve there are implications for system stability. This effect is also known as cloud shear.
Currently in the Carnarvon network it is not known if the aggregated effects of these fluctuations have been visible to the central generators. This is due to the limited time resolution in generator measurements, as the fluctuations in output from the PV systems are very rapid, and it is difficult to differentiate PV system fluctuations from load fluctuations. Discussion with the Carnarvon power system operators indicated that it was known that the generators have been exposed to load changes of up to 500kW in a matter of minutes but it is uncertain whether or not these are actual load changes or PV generation fluctuation, or some combination of both of these factors. It is suspected that this load fluctuation is predominately due to the large load imposed by the nearby salt mine.
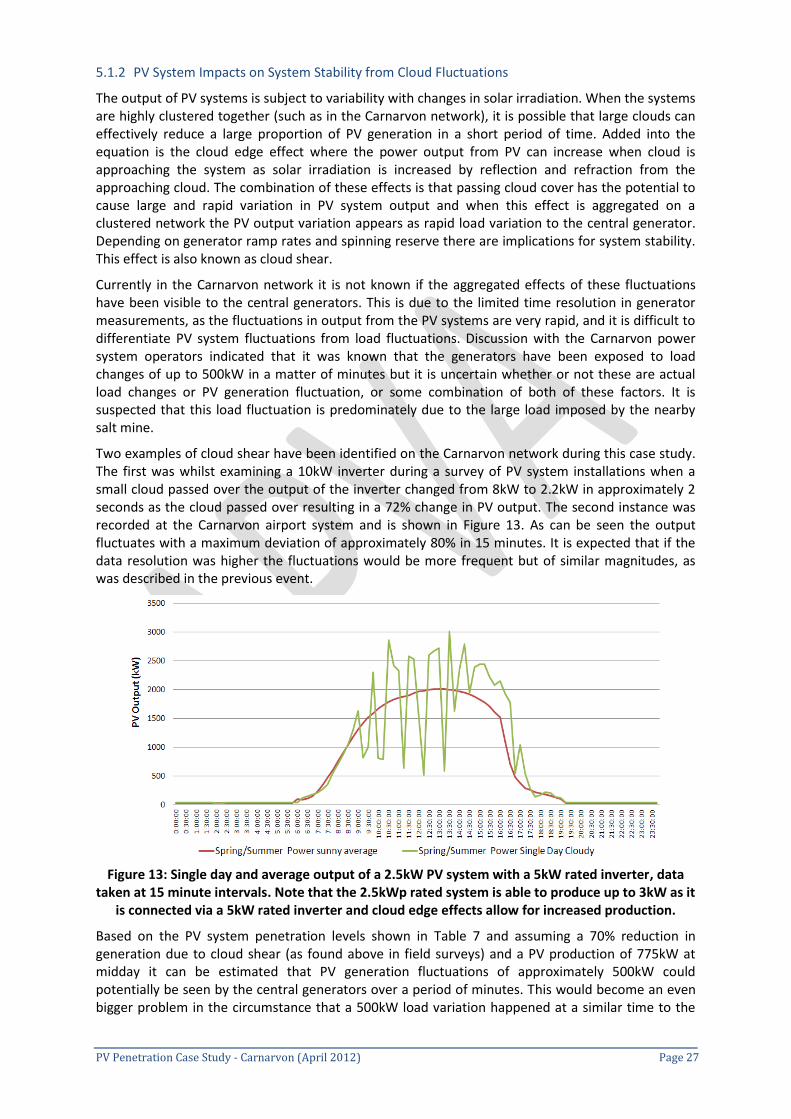
Two examples of cloud shear have been identified on the Carnarvon network during this case study. The first was whilst examining a 10kW inverter during a survey of PV system installations when a small cloud passed over the output of the inverter changed from 8kW to 2.2kW in approximately 2 seconds as the cloud passed over resulting in a 72% change in PV output. The second instance was recorded at the Carnarvon airport system and is shown in Figure 13. As can be seen the output fluctuates with a maximum deviation of approximately 80% in 15 minutes. It is expected that if the data resolution was higher the fluctuations would be more frequent but of similar magnitudes, as was described in the previous event.
Figure 13: Single day and average output of a 2.5kW PV system with a 5kW rated inverter, data taken at 15 minute intervals. Note that the 2.5kWp rated system is able to produce up to 3kW as it
is connected via a 5kW rated inverter and cloud edge effects allow for increased production.
Based on the PV system penetration levels shown in Table 7 and assuming a 70% reduction in generation due to cloud shear (as found above in field surveys) and a PV production of 775kW at midday it can be estimated that PV generation fluctuations of approximately 500kW could potentially be seen by the central generators over a period of minutes. This would become an even bigger problem in the circumstance that a 500kW load variation happened at a similar time to the

PV Penetration Case Study - Carnarvon (April 2012) Page 28
passing cloud cover, which could result in an approximate 1MW apparent load change as seen by the central generators. However in saying this it is difficult to provide an accurate estimation of the level and speed of potential aggregated fluctuations, predominately due to the geographical diversity of the systems.
Horizon Power’s current strategy for mitigating this issue is to ensure that the generators have sufficient spinning reserve capabilities to accept this change in the load levels whilst keeping the network stable. This strategy is the same as the one described in section 5.1.1.
Horizon Power is also currently undertaking studies into the speed and level of PV output fluctuation that the passing clouds may induce, and developing smarter system operations. The trial being undertaken is to utilise a solar irradiation sensor array in addition to a sky camera to monitor the cloud cover in the area and use this gathered data attempt to forecast the availability of solar irradiation for PV systems. Using this data alongside modelled aggregated PV output will allow the power system operators to potentially predict load fluctuations on the network due to the PV systems and thus be able to dynamically adjust the spinning reserve of the generators in a similar way to how they adjust the reserve in response to forewarning of the connection of large loads to the network. In this way the additional costs currently incurred by running full spinning reserve all of the time can be minimised.
5.1.3 PV System Impact on Power System Planning Strategies
The high and somewhat uncertain variability in PV system output also has implications for power system planning in Carnarvon. This variability introduces difficulties in forecasting peak system loads and designing the network accordingly. In addition to this there is a desire by PV installers to be able to connect large commercial PV systems to the network, such as the 300kWp system in Carnarvon. There are particular challenges when introducing such systems to the network because of the significant network investigation that is often required to determine the suitability of the system and proposed network connection point. Also applications of this type often currently require a large amount of administrative procedures and there has been concern over the lack of a standardised process amongst all Australian utilities to facilitate the connection of commercial PV systems. The current process and potential network augmentation costs introduce a large level of commercial risk to these projects and the current lack of uniform procedure across Australia is a deterrent to a large scale system business case.
Forecasting specialists have to be able to calculate the effect of the PV systems on the network and separate the load profile into “influenced” (load profile with PV) and “uninfluenced” (load profile without PV). Then using probabilistic methods a likely load forecast is established and decisions are made for the network based on the level of risk and likelihood of peak loads. In this process there is a possibility to utilise the PV input to defer network expenditure however there is a level of risk involved in deferring network augmentation due to the variability of the output of the PV systems.
One strategy being proposed for the 300kWp system currently being installed in Carnavon is a feed in management system that will include network reactive power support by the inverter, and utility control whereby the utility has the capability to reduce power output or disconnect the system from the grid as appropriate. This level of control allows the utility to manage output in response to system stability concerns. For example, if cloud cover is approaching Carnarvon the PV system output can be slowly limited in order that the variations due to clouds seen by the power system operators are minimised and therefore made more manageable. The reactive power support is useful in managing feeder voltage levels and system power factor, and the fault ride through capability allows the PV system to provide support to the central generators under fault conditions.
This feed in management system implementation should facilitate the deployment of larger systems on the network. This raises another possible management solution for system stability issues in general, which are community owned solar farms. This is a model currently being examined by Horizon Power whereby interested customers can buy a share of a large and utility managed PV system as an alternative to connecting a small PV system at their houses. This has potential benefits

PV Penetration Case Study - Carnarvon (April 2012) Page 29
for the utility who can appropriately locate and operate the PV system with regard to power system issues, whilst customers can benefit from having a well maintained system that they can buy into with minimum risk.
5.2 Distribution Level PV System Impacts
5.2.1 Voltage Rise in LV Networks The rural nature of some of the feeders where PV systems are installed in Carnarvon and the clustered nature of the urban installations are both situations that are conducive to voltage rise problems on the various LV networks in the area. This is a problem because over voltage on the network can impact on utility regulatory compliance, cause problems with some equipment (both for the network and the customer), increase equipment power consumption and cause the PV inverters to disconnect from the network, as discussed in section 5.1.1.
Results from surveys in Carnarvon as well as discussion with power quality personnel indicated that individual customers with large services on rural mains were not seeing problems with voltage rise as might have been expected, i.e. voltage rise at individual customer’s switchboards were generally within acceptable limits. This is most likely due to a Horizon Power policy that every two years the consumer service mains are inspected and sized appropriately to reduce voltage drop/rise to the customer along with a stringent connection inspection for any large PV systems being installed. The result of this policy is generally low impedance service mains resulting in a small voltage rise from the network to the customer switchboard. There is also a possibility that high voltage situations are arising but not being recorded and reported.
There have been two reported instances where over voltages have caused multiple PV inverters to disconnect from the network. This has not been due to individual PV systems but rather is due to the aggregated effect of a cluster of PV systems and low load on a distribution transformer causing the network voltage level to rise beyond inverter cutoff limits. The first of these instances was on the Richardson 1 distribution transformer (17% nominal PV penetration of the capacity of the transformer). There was no detailed study into this instance as the impression of the local network operators was that it was an isolated instance with the root cause being unknown due to lack of information on the effects of PV systems at the time. In this instance a load imbalance was identified where one phase had low load and a high amount of generation and the problem was rectified by switching customers to different phases to balance the load.
The second instance was a voltage rise at the Gibson transformer (70% nominal penetration of transformer capacity) on the 8/2/2011. This event was subject to a detailed network study and the following conclusions were reached. The root cause of the problem was that a normally open point was moved resulting in more generation being connected to the one transformer. The result of this was a high network voltage which is shown in Figure 14. Note the high customer voltages further from the distribution transformer, which were exposed to higher levels of generation. The solution to this problem was to move the open point back to the original position thus removing some generation from the transformer and lowering the voltage. There was also a recommendation to replace the consumer mains in the area and move the large PV system onto a dedicated transformer.

PV Penetration Case Study - Carnarvon (April 2012) Page 30
Figure 14: Voltage levels on the LV network during a voltage rise event according the Horizon Power incident report (8/2/11)
Following the open point being changed back to the original position power quality measurement equipment was placed on the distribution transformer. Whilst the position of this equipment at the transformer is not ideal to measure the extent of the voltage rise on the network, it does represent a worst case scenario for the voltage profile of the network, and is shown in Figure 15. The median voltage is 243V which is similar to the voltage levels recorded in Figure 14 and thus it is likely if more PV is connected that over voltages could become more frequent.
Figure 15: Voltages recorded at the Gibson distribution transformer following the rectification of an over voltage issue. Data was taken in 30s increments
Also of a concern is the unbalance that can be caused by the connection of PV systems. The Richardson transformer example above shows that there are instances where PV systems
243 V
251 V
258 V
Gibson Transformer
PV systems on Gibson Transformer
10kW
10kW 12kW
10kW
10kW
6kW 6kW
~50kW

PV Penetration Case Study - Carnarvon (April 2012) Page 31
accentuate voltage unbalance problems due to their effect on system voltage. The Gibson transformer has also shown slightly higher volts on B phase, indicating a possibility that PV is unbalanced on the network. There was another case where a customer was reporting problems with his PV system due to neutral unbalance currents. It is unclear as to whether this neutral problem was caused by unbalanced voltage due to the PV system or whether it is the local network, but there is the potential for this type of problem to be caused or exacerbated by PV systems.
The problems with over voltage can be exacerbated by a high underlying grid voltage independent of any PV impacts. Australian utilities have traditionally set the voltages on the network relatively high within the specified voltage range in order to accommodate voltage drops to the load. This is evident in the Gibson transformer case with 95% of the recorded voltages at the transformer being greater than the nominal 240V. It is also expected that load variations would make the voltage at the load more variable. The presence of PV systems in a network having an already high grid voltage can cause more frequent over voltages for the consumer. Additionally the AS4777 anti islanding voltage set points are established assuming a 230V nominal voltage as per the new AS61000.3.100 standard, so high voltages are more likely to lead to inverter disconnections.
During interviews for the case study members of the community have expressed a willingness to help Horizon Power to change inverter disconnection settings in order to stop the inverter disconnecting due to high voltages. Changing such settings to allow network voltages outside equipment ratings and network standards risks potential damage to equipment as it will be exposed to higher voltages, and may also have implications for the passive anti islanding protection schemes. Thus it is important to ensure that the utility manages the voltage levels in the network to remove incentives for PV inverters to be set outside Australian voltage regulation standards, and that measures are put in place to prevent modification by untrained personnel.
Currently the options available to Horizon Power to rectify voltage problems on the network these are listed below.
Change the phase of connection. o As discussed above by balancing the load on the transformer the PV generation and
thus voltage rise is more evenly distributed over the phases and in most cases this will be sufficient to keep the network within mandated values. Ideally the phase of connection would be chosen during installation rather than as a response to a voltage problem, however this is not always possible due to company procedures. This approach is a low cost option as it only requires a network study to determine the extent of the load unbalance when PV is generating and a short amount of time for field staff to change the connection. It can also be quite effective but depends on the existing level of unbalance in the network.
Lower the distribution tap setting o Many Australian utilities have traditionally tapped the transformer high to
accommodate for losses in distribution lines, especial in rural type areas, resulting in disconnection of inverters even in periods of low generation. By lowering the tap of the transformer the network voltage is lowered and this means that there is room for the PV systems to raise the voltage and stay within regulated standards. This is another low-cost option as it again only requires a network study and a small amount of hours of field staff time to change the tap. However a potential negative outcome with this approach is that network voltages at times of peak load (and low PV generation) might result in voltage drops below the network standards. Network studies would need to be undertaken to ensure that this won’t be the case.
Augment the network o Undertaking works to upgrade the service mains in an area in order to lower the
impedance is a proven way to decrease the effects of voltage drop/rise in a network. This approach is expensive in comparison to the other options and is generally used as a last resort.
Load Shifting

PV Penetration Case Study - Carnarvon (April 2012) Page 32
o By shifting large non essential loads, such as commercial and irrigation systems, to the middle of the day when the PV systems are producing power the effects on the network can be minimised. This requires community involvement and possibly incentives to change current behaviours.
Implement voltage regulation technology o Voltage regulation technology such as distributed capacitor banks, reactive power
support by inverters/STATCOM devices in conjunction with technology such as storage is currently under investigation. It is hoped that these technologies will provide a cost effective way to defer network expenditure associated with PV system voltage rise. Note that many modern inverters have the capability to regulate voltage, and are currently being utilised in such a way in countries such as Germany.
5.2.2 Network Power Flow If the penetration levels of PV systems in a network are high enough, they can cause power to flow from the loads back through the MV network. The main problem in this scenario is the stability issues discussed in section 5.1. Other problems are: reduced efficiency of distribution transformers and central generators, reactive power flow and network fault protection.
In Carnarvon there have been isolated instances of reverse power flow through the distribution transformers as was shown in Figure 11, which occurred with a nominal PV system capacity of 70% of that particular distribution transformer’s capacity. Additionally the PF has been seen to drop to very low values as the majority of the real power required by the load is being supplied by the PV systems leaving the network to supply the reactive power. This does have an impact on system efficiency but is not currently seen as a significant problem by Horizon Power.
It is predicted that backfeeding through the other distribution transformers is unlikely to occur in the short term due to their relatively lower PV penetrations and thus won’t have a significant effect on the 22kV network. This prediction is validated by load analysis of the highly penetrated South River Feeder as was shown in Figure 10. This shows that even on sunny days in summer the load on the 22kV feeder is significantly greater than the potential generation from the PV systems. However the connection of the 300kW feeder in February 2012 may cause this to change and should be monitored.
If PV penetrations increase in Carnarvon there is a possibility that reverse power flow through the 22kV system could impact on the protection relays and schemes. Horizon Power is of the impression that if penetrations did increase to the level that would allow backfeeding through the 22kV network then the protection schemes would have to be modified slightly to adjust to these circumstances, but this would not be a significant problem. Additionally, it is unlikely that the PV systems would mask fault currents from the generators due to the reactive power component of the fault which is not currently being supplied by the PV systems. In conclusion at current penetrations the 22kV networks are very unlikely to see reverse power flows. Isolated distribution transformers may see reverse power flow which has implications for efficiency but in general PV-related network power flows in Carnarvon are not seen as a significant impact. As such, there is no need for current actions in this area, as modifications to the network to make small increases in efficiency due to reverse power flow are not seen to be cost effective. Additionally, if reactive power support is introduced for PV systems, care must be taken to ensure that small faults are not masked by PV systems as the network will no longer have to supply the full reactive component of the fault.
Figure 16: The south river 22kV feeder at the site of the new
300kW system

PV Penetration Case Study - Carnarvon (April 2012) Page 33
5.2.3 PV System Islanding
There has been some discussion in section 5.1 on the use of more relaxed inverter anti islanding protection set points to assist in power system management. However, care needs to be undertaken to ensure that the limits, including the network parameters, are appropriate to avoid the situation where PV systems stay connected to the network when the main supply is disconnected and also that manufacturer’s warranty is voided.
Currently Horizon Power’s view is that islanding due to the PV systems is unlikely to occur as long as the inverter anti islanding protection is set appropriately in line with their network protection settings. This is mainly due to the load reactive power requirements and load levels. As discussed in section 5.1.1, it is important to set the inverter anti islanding protection limits outside of system protection limits to prevent impacts on system stability however it is important to ensure the inverters disconnect at appropriate times. Of particular concern here is when customers have the ability to change the set limits as this might potentially lead to an island being created. The majority of inverters are either password protected or accessible by specific cables making this difficult for customers to do.
Currently Horizon Power has implemented a strategy when working on de-energised LV networks that should prevent PV system islanded networks and thus protect the safety of line workers. It is company policy that when working on de-energised low voltage networks they are short circuited and earthed at the points of isolation. This earth will force the inverter anti islanding protection to activate and disconnect the PV system from the network, thus protecting the safety of the workers.
The Western Australian Connection Manual17 states that, as a guideline PV system penetration should be limited to 20% of the distribution transformer’s capacity. The reasoning behind the limit is stated that as being to prevent an islanding scenario, and this is because a 20% limit should theoretically prevent the PV system generation from matching the localised load, which is normally 20% of the distribution transformer’s capacity, and this match is necessary to facilitate islanding. This policy also prevents any backfeeding through the distribution transformer. However, as mentioned before even in the case that the PV system generation is matched to the load the load reactive power requirements will make any islanding scenario unstable and cause the inverter protection to activate. If this should fail, the earthing will cause the protection to activate. Horizon Power has in isolated cases allowed the 20% limit to be breached to gain an understanding of any possible issues. So far no significant issues have been found.
5.2.4 System Harmonics from PV Inverters
AS4777 limits the current harmonic output to 5% THD for individual inverters. Due to the comparatively small outputs of the PV systems compared to the loads, this 5% limit is usually sufficient to stop any significant harmonics being seen on LV networks. A problem may occur when the aggregate effect of a large number of systems causes the harmonics to be significant. If this is the case, the current harmonics can induce voltage harmonics and cause over heating in equipment such as transformers and customer motors and also may cause neutral currents.
Horizon Power hasn’t seen significant current or voltage harmonics in their network to date. Recent recordings taken on the highly penetrated Gibson St transformer are shown in Figure 17. Apart from an unknown system event the voltage harmonics are generally less than 2%. Additionally it appears that the voltage harmonics decrease around midday, when the PV systems are generating, implying that the effect of the PV systems, or the lower load, results in lower harmonics. It is possible that the PV systems generate harmonics which are required by the loads, meaning that the harmonics are no longer required to be drawn from network; however this cannot be confirmed with the given data. Regardless, the measurements to date imply that the impact of PV systems on the harmonic content
17
Western Power & Horizon Power: Western Australian Distribution Connections Manual http://www.westernpower.com.au/documents/WA_Distribution_Connections_Manual.pdf 2011

PV Penetration Case Study - Carnarvon (April 2012) Page 34
of the network is minimal. It should be noted here that the harmonic levels would be higher at the load than at the transformer where these measurements were taken however the levels should still be within acceptable limits.
Figure 17: Voltage harmonics recorded at the Gibson St transformer.
Horizon Power has the point of view that the harmonic impact of the PV systems is minimal and has no plans to implement any management strategies. However, if penetration increases it is possible that the harmonic content of the network could increase. Thus it is important to monitor the harmonic levels to ensure they stay within acceptable ranges.
5.2.5 Fires due to PV systems
Fires in houses with PV systems are potentially highly dangerous because of the electrical output of the PV systems. Unless the system is covered during a fire there is no way to stop the generation from the panel even if it is isolated in the switchboard. This has implications for fire fighter safety when trying to put out the blaze as the water may give a path for the DC current to flow, resulting in the possibility of electrocutions. In addition to this the rapid increase in the installation of PV systems has led to national problems with correct installation practices in line with AS4777.1 and AS3000. Incorrect installation can be a source of fire within a residence.
There has been one instance in Carnarvon where a fire has resulted from a PV system installation. The fire originated from a defective junction box of a rooftop solar system and was due to a level of moisture ingress. Thankfully the fire was quickly contained and the level of damage to the property was minimised after the DC circuit was broken.
Current practice is that utilities, including Horizon Power, require any connection to the electricity network to be completed by accredited personnel. PV system installers are registered with the Clean Energy Council18 and Horizon Power’s policy states that installation of the PV system should be undertaken by qualified personnel. Potential problems with installations should be minimised with
18
http://www.solaraccreditation.com.au/acccec.html

PV Penetration Case Study - Carnarvon (April 2012) Page 35
correct procedure and when undertaken by accredited personnel. Additionally it is recommended that defective equipment, such as this brand of junction box, be identified and removed.
5.3 Power System Benefits From PV Integration
5.3.1 Generator Fuel Savings and Carbon Dioxide Offset
Running a conventional diesel/gas power station incurs costs from the purchase of fuel to run the power station as well as maintenance of the generating units, and results in the emission of significant greenhouse gases, predominantly CO2. PV systems may offer the utility the advantage of cost savings through the reduction in generator fuel use as well as the offsetting of green house gas production.
The estimated fuel savings and carbon dioxide offsets in Carnarvon are presented below in Table 12. The following assumptions were made to reach these conclusions:
The calculations are based on annual system diesel/gas fuel consumption figures. Savings due to PV systems are calculated by assuming the PV generation offsets a portion of generator loading and that this translates directly to fuel savings.
The central utility operates of a mixture of diesel and gas generating sets and produces 49GWh per annum whilst the PV systems produce and aggregate output of 1.4GWh.
We assume that the generator operating strategy is also constant and a constant number of generating sets are utilised. It is known that the operating strategy can change given different load situations (and variable PV system generation) and this will have an impact on fuel consumption and generator efficiency. It is hoped that with the implementation of a dynamic spinning reserve strategy savings would be maximised, however for the purposes of these calculations we are unable to dynamically estimate the generator fuel consumption with the data provided.
We assume the diesel generators operate at 0.26l/kWh (1MW generation per unit) and produce 1.22kg/kWh of carbon dioxide emissions. We assume the gas generators consume 0.24m3/kWh and produce 0.46kg/kWh of carbon dioxide emissions19. It is assumed that given the constant operating strategy that these figures remain constant.
Fuel Type
Volume used per annum for load
(kUnits)
Volume offset by
PV systems (kUnits)
Carbon Dioxide produced by load
requirements (tonnes)
Carbon dioxide offset by PV systems (tonnes)
Diesel 1,561 51 7,369 242
Gas 10,146 308 19,506 591
Table 12: Generator fuel savings and carbon dioxide offsets in the Carnarvon network due to PV systems. Units for Diesel are litres and for gas are m3.
19
Diesel Fuel Consumption from: Cummins: Engine Datasheet DS-6317-LP http://rieanpishroco.com/cummins/QSK45-G4.pdf (2003) and gas consumption is calculated based on fuel consumption data supplied by Horizon Power. Carbon emission factors from: Australian Government Department of Climate Change and Energy Efficiency: National Greenhouse Gas Accounts Factors http://www.climatechange.gov.au/~/media/publications/greenhouse-acctg/national-greenhouse-accounts-factors-july-2011.pdf (July 2011) using stationary combustion of natural gas and diesel factors.

PV Penetration Case Study - Carnarvon (April 2012) Page 36
Based on this analysis we can conclude that the current penetration of PV systems are playing a role in both reducing the amount of fuel being consumed on the network as well as reducing carbon dioxide emissions. This has twin benefits of both saving Horizon Power operating costs as well as potentially assisting the environment by reducing greenhouse gas emissions. It should be noted here that actual financial savings are difficult to calculate due to the potential costs (maintenance and reduction in generator efficiency) associated with the current spinning reserve strategy which is designed to allow for the loss of PV generation, as well as the variable nature of PV output.
It is obvious that increasing the penetration of PV systems will also increase the fuel savings and will be of benefit to the utility and the community. The introduction of a carbon price in Australia in 2012, starting at $23/tonne, may also increase the value of the savings to the utility.
5.3.2 Peak Load Shaving
Utilities need to design size their networks and generation for the expected peak system loads (and some margin for potentially higher loads than this), in order to ensure reliable and secure delivery of power to customers. There is considerable potential value in strategies to reduce peak loads (more specifically peak loads as a proportion of average load) so that the network is used efficiently throughout the day, rather than having a large amount of infrastructure used near full capacity for only a small proportion of the time. If the peak load occurs during sunlight hours then the PV systems will have an effect in reducing this peak demand and thus assist the utility in operating the network more efficiently.
In the Carnarvon network the peak loads occur at 2pm in summer and 7pm in winter on average. The summer peak load is greater than the winter so the network is designed to meet this peak load of 10.7MW in an average year. Furthermore, thermal limits on wires and network equipment are more problematic in the higher ambient temperatures of summer. Summer PV generation on a sunny day at 2pm is approximately 580kW and thus can contribute towards reducing the system peak loads.
This has particular relevance for the generating sets, which are derated in summer due to the ambient temperatures. A reduction in demand during the day will lower the heating on the generators and allow them to better meet demand even outside of the sunlight hours. In addition to this the contribution of the PV systems may also offset the need to purchase other equipment, such as circuit breakers, whose loadings are also close to the rated values during the summer peaks.
Historically the deration of the generating sets, particularly during February, has led to power outages in the town predominately due to the commercial bore fields sight connected to the grid. There is evidence from the community that suggests the frequency of these outages has decreased dramatically since the connection of 500kWp of solar in 2010 as this approximately matches the size of the bore field load. The reduction in the need to compensate for this large load by disconnecting customers has obvious benefits for customer satisfaction and network outage limits. By also adjusting other loads, such as irrigation pumping, peaks can be further shaved maximising the economic benefits for the utility.
It is important to note that care must be taken in deferring network expenditure due to the variable output of the PV systems. For example, it is possible to envisage periods of very high summer, air-conditioning driven demand, where rapid clouding over Carnarvon might rapidly decrease PV generation whilst the cooling load takes considerably longer to reduce. As mentioned in section 5.1.3 probabilistic methods will be required in calculating the amount of weight that can be applied to the PV system’s contribution to peak load shaving. If care is taken in this process the benefits of PV systems can be better utilised.
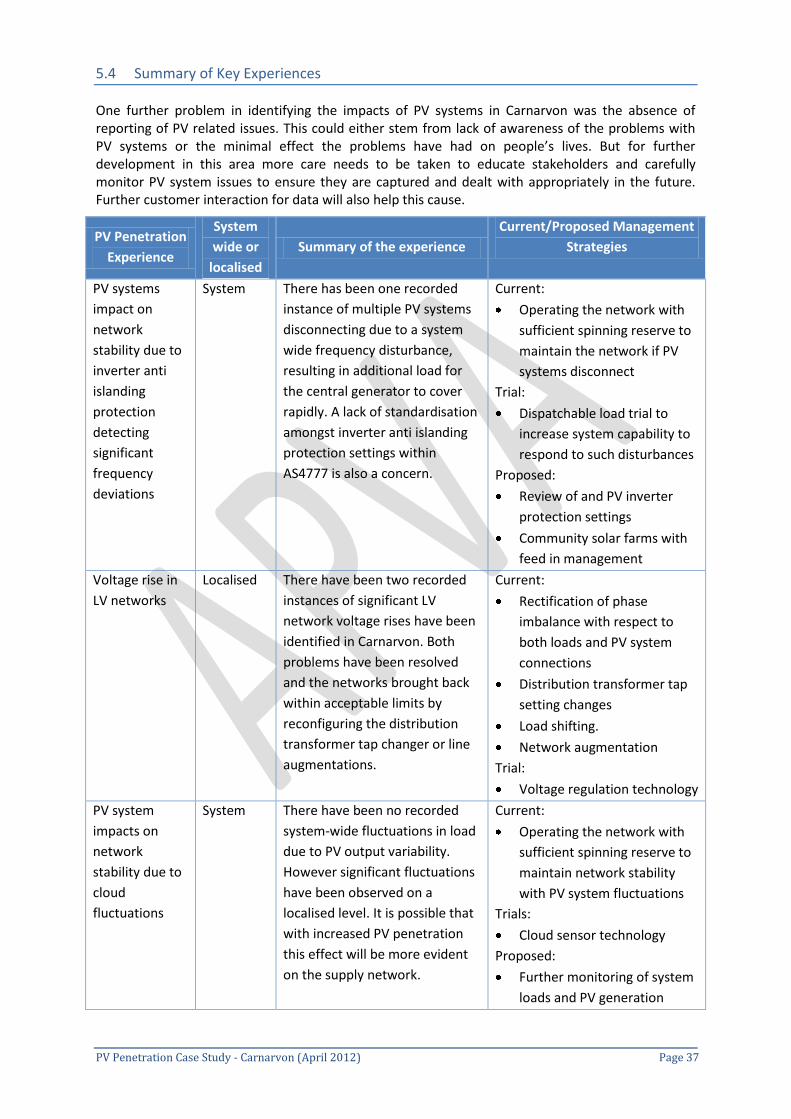
PV Penetration Case Study - Carnarvon (April 2012) Page 37
5.4 Summary of Key Experiences
One further problem in identifying the impacts of PV systems in Carnarvon was the absence of reporting of PV related issues. This could either stem from lack of awareness of the problems with PV systems or the minimal effect the problems have had on people’s lives. But for further development in this area more care needs to be taken to educate stakeholders and carefully monitor PV system issues to ensure they are captured and dealt with appropriately in the future. Further customer interaction for data will also help this cause.
PV Penetration
Experience
System
wide or
localised
Summary of the experience
Current/Proposed Management
Strategies
PV systems
impact on
network
stability due to
inverter anti
islanding
protection
detecting
significant
frequency
deviations
System There has been one recorded
instance of multiple PV systems
disconnecting due to a system
wide frequency disturbance,
resulting in additional load for
the central generator to cover
rapidly. A lack of standardisation
amongst inverter anti islanding
protection settings within
AS4777 is also a concern.
Current:
Operating the network with
sufficient spinning reserve to
maintain the network if PV
systems disconnect
Trial:
Dispatchable load trial to
increase system capability to
respond to such disturbances
Proposed:
Review of and PV inverter
protection settings
Community solar farms with
feed in management
Voltage rise in
LV networks
Localised There have been two recorded
instances of significant LV
network voltage rises have been
identified in Carnarvon. Both
problems have been resolved
and the networks brought back
within acceptable limits by
reconfiguring the distribution
transformer tap changer or line
augmentations.
Current:
Rectification of phase
imbalance with respect to
both loads and PV system
connections
Distribution transformer tap
setting changes
Load shifting.
Network augmentation
Trial:
Voltage regulation technology
PV system
impacts on
network
stability due to
cloud
fluctuations
System There have been no recorded
system-wide fluctuations in load
due to PV output variability.
However significant fluctuations
have been observed on a
localised level. It is possible that
with increased PV penetration
this effect will be more evident
on the supply network.
Current:
Operating the network with
sufficient spinning reserve to
maintain network stability
with PV system fluctuations
Trials:
Cloud sensor technology
Proposed:
Further monitoring of system
loads and PV generation

PV Penetration Case Study - Carnarvon (April 2012) Page 38
PV Penetration
Experience
System
wide or
localised
Summary of the experience
Current/Proposed Management
Strategies
Fires due to PV
systems
Localised There has been one reported
instance of a fire caused by a PV
system, made even more serious
due to continued PV generation
during the fire.
Current:
Management procedures are
in place to ensure correct
panel installations
Proposed:
Extended fire fighter training
Change to problematic
junction box designs.
PV system
impact on
planning
strategies
System
and
localised
The variability of PV system
output makes it difficult to plan
for system peak loads as seen by
the dispatchable generation.
There is also a push for more
commercial sized systems to
connect to the network.
Current:
Work is being undertaken on
forecasting the impact of PV
systems on the network load
levels
Trial:
Horizon Power is trialling a
feed in management system
for a 300kW system installed
Feb 2012.
System
Islanding
System
and
Localised
Investigation has been
undertaken into the possibility of
network islanding due to PV
systems and has concluded that
it is extremely unlikely to occur
in the current configuration.
Current:
LV network is earthed prior to
work
Proposed:
PV inverter protection
settings are being reviewed in
line with the impact on
system stability and in line
with studies mentioned
above. Horizon Power would
prefer that all inverters are
set to a fixed value rather
than be variable inside a
range.
System
Harmonics
from PV
inverters
Localised Past investigations on the
Carnarvon network have
indicated no prior problems with
harmonics. Results examined in
this case study reinforce that PV
systems are having little effect
on network harmonics.
Proposed:
Monitoring at higher PV
system penetrations is
important to ensure that the
PV systems don’t affect
network harmonics into the
future

PV Penetration Case Study - Carnarvon (April 2012) Page 39
PV Penetration
Experience
System
wide or
localised
Summary of the experience
Current/Proposed Management
Strategies
Reverse Power
Flow
Localised Currently PV systems are causing
localised backfeeding through
some distribution transformers
but no significant effects are
visible on the 22kV network.
Proposed:
Monitoring at higher PV
system penetrations and a
review of protection schemes
is needed to prevent
potential future problems
Reduction in
generator fuel
use
System The current PV system
generation in the network is
resulting in a generator fuel
saving which is equivalent to
approximately 830 tonnes CO2
per annum.
Benefit:
There is potentially significant
value in such fuel savings
depending on gas/diesel
prices. The value of climate
change abatement with PV is
also potentially significant. By
managing the spinning
reserve strategy effectively
and increasing the amount of
PV in the system these
benefits can be maximised.
Offsetting of
peak summer
loads with PV
generation
System PV generation generally
corresponds well with the peak
system loads implying possible
deferral of network upgrades,
and benefits can be further
maximised by adjusting
customer loads.
Benefit:
Analysis is currently being
undertaken to estimate the
amount that the PV systems
can contribute to peak
demand reduction in order to
fully realise this benefit in
terms of system planning
Table 13: Summary of the PV system experiences in Carnarvon to date

PV Penetration Case Study - Carnarvon (April 2012) Page 40
6 Conclusions and future work
This section summarises the key conclusions from the Carnarvon case study in the context of the IEA PVPS Task 14 framework and presents areas requiring further investigation. In general the high PV penetration issues identified in the Carnarvon case study, whilst being present and potentially challenging to reliable and efficiency operation of the network, have all have been shown to have avenues to manage their negative effects, following the trial of new strategies.
6.1 Conclusions
Carnarvon is an isolated network supplying approximately 5000 people via 205km of overhead lines, with an average load of approximately 8MW in summer, 11 MW peak and 7MW in winter with a 4.5 MW low.
Figure 18: Depicting the solar and wind generation that makes up Lex Fullarton’s
60kW system
Carnarvon enjoys a relatively high penetration of PV systems by Australian standards (approximately 13% of network capacity) and coupled with a strong solar resource, this has resulted in some challenges for operation of the network.
Due to the particular technical characteristics of relatively small and isolated grids, the key concerns in Carnarvon to date have related to the impact of the PV systems on system stability, in particular the effects of mass inverter disconnections as a result of anti islanding protection settings, and the potential effects of cloud shear.
o Whilst there has been one instance of inverter anti islanding protection schemes increasing the load on generators during fault conditions, with correct management of PV systems in the network as well as appropriate management of the central generator operating strategy, it would seem that this potential impact can be effectively managed. There is a number of promising options for managing higher penetrations through, for example, the islanding settings of the inverters of PV systems connected to the grid.
o Whilst not observed to date on a system wide level, operational data from some individual PV systems indicates that cloud shear effects might have an adverse on the network with higher penetrations. The extent of this potential issue could be better understood with more and better time resolution PV system performance data – an issue that is now being addressed by Horizon Power. Trials into technology such as storage and cloud sensing equipment are a promising prospect for understanding this issue and minimising any problems for the network.
The other prominent issue in the Carnarvon case study is the potential impact of PV systems on the LV voltage levels. There have been specific instances of problems on the network however, Horizon Power’s current management framework appears to have has been effective in adjusting the network to deal with these issues. There are promising options including active and reactive power management within the PV inverters for achieving higher localised PV penetrations.
Other impacts include PV system planning, fires due to PV systems installations, impact on planning strategies, PV system islanding, harmonics and reverse power flow. These are all

PV Penetration Case Study - Carnarvon (April 2012) Page 41
either considered not to be of high impact to the network or currently would seem to have effective management strategies available.
The benefits that the PV systems are currently providing is a reduction in generator fuel that is equivalent to approximately 830 tonnes of CO2 per annum and also the PV system output correlates with summer peak load which has the potential to defer the upgrade of network assets and remove the need for outages on the network to accommodate peak loads when the generators are derated.
At present Horizon Power has limited the distributed PV (non-utility monitored and dispatched) hosting capacity of the network to 1.15MWp. Fundamentally the limit is set to conform to the Carnarvon Power Stations nominal spinning reserve requirement. This requirement seeks to balance system stability and security concerns against the desire to minimise power station running costs. Other Horizon Power concerns for limiting the total levels of distributed PV include power quality and network management issues as noted in this report.
Currently Horizon Power, in conjunction with the local community, are investigating ways to increase the hosting capacity of the network and realise the connection of additional PV systems to the network. The first significant result of these efforts was the commissioning of the 300kW system in February 2012. The success of this project and the results from further trials discussed in this report will assist Horizon Power in determining whether to increase their current PV limit for the Carnarvon network. The results of the trials may show that an increased hosting capacity is possible and lead to a relaxation of other regulations, such as the 20% connection limit on distribution transformers, imposed on Horizon Power. It is important to note that if the hosting capacity is increased further installation of PV connections should be undertaken with careful management to maximise the benefits of their deployment. At the very least the trials will give greater insights into methodologies available for increasing PV system hosting capacity of isolated networks.
6.2 Future Work for the Carnarvon Network
As mentioned above there are a number of trials currently being undertaken which have significant implications for facilitating increased PV penetration levels in the Carnarvon network. It is expected that these outcomes will also provide a greater understanding of PV integration challenges and opportunities elsewhere in Australia. More generally, there are many isolated diesel grid networks around the world and there are growing concerns regarding the future availability and hence cost of diesel fuel, as well as the associated greenhouse emissions associated with such power generation. PV systems present an increasingly attractive opportunity to save on fuel and emissions. Lessons learnt from Carnarvon can contribute to our understanding of the potential challenges as well as opportunities that such PV deployment will present. The trials currently being undertaken or proposed by Horizon Power to manage the challenges associated with large scale PV integration in remote grids are listed below for reference:
Review of system and inverter protection schemes
Dispatchable load trial
Feed in management system trial
Cloud sensor technology trial. In addition to these trials additional avenues for further research have become evident from investigations during this case study.
Horizon Power is currently developing a network model to investigate how to incorporate PV systems in the network effectively. The results of this modelling is expected to reveal options to better manage the PV systems in the network and potentially increase the PV penetration in the network
Alongside the feed in management system being implemented with the new 300kW system in Carnarvon there is an increased level of power quality monitoring being installed. It is hoped that the results from this modelling will provide insights into the impacts discussed above from the customer’s point of view and these insights will provide further information

PV Penetration Case Study - Carnarvon (April 2012) Page 42
on both impacts and management strategies including the success of the feed in management system.
Investigation into a small grid with a higher penetration (such as Norfolk Island) will be conducive to revealing further Australian experiences. If such a case study can be undertaken, we will get an idea of the effects from relatively low, medium and high penetrations of PV systems on isolated networks.
A standard document which outlines how to integrate PV systems into Australian grids should be considered. This should take into account different grid types, specify expected problems and how to deal with them, cover commercial size PV systems.
Whilst not a technical outcome it is increasingly apparent that the current commercial arrangements for PV systems in most jurisdictions are not particularly conducive to appropriate PV deployment at high penetrations. This case study and wider work on PV integration in Australia and worldwide highlights that the challenges as penetrations increase are not only ones of technical feasibility but, instead, economic in terms of the costs (and potential benefits) of appropriate management of such penetrations. Key stakeholders therefore need support and appropriate incentives to assist in managing high penetrations. For example, under some metering and tariff arrangements it is possible for a PV system to reduce network revenue for utilities without reducing required network expenditure and, at high penetrations, potentially increasing the amount of network expenditure required. Policy support such as net feed-in tariffs can also encourage PV deployment and customer behaviours that potentially increase network integration challenges by encouraging households to maximise export onto the grid. In the longer term and as penetrations increase there is a clear need for tariff arrangements that facilitate PV deployment in a way that appropriately recognises its economic and environmental value whilst ensuring that other key industry stakeholders are not unreasonably impacted. This could include a wide range of incentives such as those being implemented in some jurisdictions to promote self-consumption of household PV generation and encourage the provision of reactive power support. Another key issue are appropriate network tariff arrangements. Whilst these issues lie beyond the scope of this technically focussed report, the findings of this case study support the need for such work.
6.3 Next Steps
As stated in the introduction following the international distribution of this report, the APVA and CEEM plan to undertake further PV penetration case studies on selected electricity networks in Australia. Following completion of these case studies an overall report will be compiled outlining the findings from all studies and it is intended this will be sent to the participants in each of the individual case studies, as well as to the international audience.
Figure 19: The construction site of the new 300kW system

PV Penetration Case Study - Carnarvon (April 2012) Page 43
APPENDIX 1 - IEA PVPS TASK 14
The International Energy Agency (IEA) Photovoltaic Power Systems Programme (PVPS) conducts joint projects in the application of photovoltaic conversion of solar energy into electricity (see www.iea-pvps.org/). Currently seven research projects, so-called Tasks, are established within the IEA PVPS Programme: Tasks 1, 8, 9, 11, 12, 13 and 14.
The recently initiated (in 2010) IEA PVPS Task 14 (www.iea-pvps.org/index.php?id=58#c92) provides a forum for all IEA countries to share knowledge on the grid integration of PV in High Penetration scenarios. Currently, experts from research and industry in Australia, Austria, Canada, China, Denmark, France, Germany, Italy, Israel, Japan, Norway, Portugal, the U.S.A, Spain, Sweden and Switzerland are participating in Task 14. The work to be undertaken in Task 14 will be in the areas shown in the diagram below.
Specific activities planned within each area include:
Cross-cutting subtask: Information Gathering, Analysis and Outreach o Setup a repository for information and exchange of models. o Collect and analyse state of the art information about existing high penetration PV
installations. o Gather a collection of existing modelling information. o Select and refine a set of pertinent cases for publication.
Subtask 1: PV generation in correlation to energy demand o Development of Prediction Tools o Network driven demand side management.
Subtask 2: High penetration PV in local distribution grids o Review of State-of-the-Art. o Optimized Reactive Power Balancing. o Optimized Active Power Control Strategies. o Change from Distribution to Supply Grids, and Dynamic Studies.
Subtask 3: High penetration solutions for centralised PV generation scenarios o System-wide PV generation analysis and forecast. o Power system operation planning with PV integration. o Power system augmentation planning with PV integration.
Subtask 4: Smart inverter technology for high penetration of PV o Opportunities for Smart PV inverters in High-Penetration scenarios. o Technical capabilities and Inverter Topologies. o Remote control and communication for Smart Inverters.

PV Penetration Case Study - Carnarvon (April 2012) Page 44
APPENDIX 2 – Further High PV Penetration Information Resources
The following is a selection of further information resources on the integration of high levels of PV penetration into electricity grids.
International
IEA PVPS Task 14 High PV Penetration Workshop Presentations (Colorado, USA, Dec 2010; Portugal, May 2011):
o http://www.iea-pvps.org/index.php?id=9&tx_damfrontend_pi1[setCatList]=61-85
NREL (USA) Solar Energy Systems Integration Program – contains various High PV Penetration resources including presentations from a number of US stakeholder High PV Penetration workshops:
o http://www.nrel.gov/eis/renewable_energy_integration.html
US Department of Energy Systems Integration for Solar Technologies Program – contains various information and resources on High PV Integration activities in the US:
o http://www1.eere.energy.gov/solar/systems_integration_program.html o https://solarhighpen.energy.gov/
CEEM Website
Australia
APVA/CEEM (2011) Alice Springs: A Case Study of Increasing Levels of PV Penetration in an Electricity Supply System, a report by the UNSW Centre for Energy and Environmental Markets for the Australian PV Association
o http://www.apva.org.au/AliceSpringsPVReport
Energy Networks of Australia (ENA) Report 2011 - Impacts and Benefits of Embedded Generation in Australian Electricity Generation Networks:
o http://www.ena.asn.au/

PV Penetration Case Study - Carnarvon (April 2012) Page 45
APPENDIX 3 – Individual Contributors to the Report
Person(s) Organisation Title Project Role
Associate Professor Iain
MacGill
CEEM Joint Director (Engineering)
Joint Project Director
Dr. Muriel Watt APVA Chair Joint Project Director
Simon Lewis CEEM Researcher Main report writer and case study investigator
Anna Bruce UNSW Lecturer Overarching Research Project Co-ordinator Provided expert input and assistance
throughout the case study
Mark Hancock Formerly CEEM
Researcher As the author of the Alice Springs case study report Mark provided valuable
experience and extensive input.
Dr. James Darbyshire
Horizon Power
Project lead from Horizon Power
Provided extensive support with data, feedback and Horizon Power’s perspective
on increased PV levels in Carnarvon
Bruce Blechynden
Horizon Power Power Systems Engineer
Provided extensive support with data, feedback and Horizon Power’s perspective
on increased PV levels in Carnarvon
David Stephens Horizon Power Manager Energy Systems Planning
Provided input into Horizon Powers motivations and current problems
Ross Bowden Horizon Power Power system forecasting
Gave data and background on forecasting with PV system input
David Edwards Horizon Power Senior engineer generation technology
Provided information on management strategies that Horizon Power is planning
to implement
Lex Fullarton Solex and Community Group “The Fruitloops”
Owner and operator of Solex,
head of community group
and politician
Active community member, owns and operates a 60kW wind/solar hybrid system
to produce ice. Provided extensive information on the communities PV
experiences.
David Kearney CEC accredited system
designer and installer.
N/A Installer of the majority of systems in town. Gave information on the problems with
various inverters and other general information on PV in Carnarvon
Brad Cox, Carnarvon
Airport
Customers with installed PV systems
N/A Provided PV generation data and general experiences with their PV systems
John Davidson EMC Managing director
Installer of 300kW system, gave experience concerning installation of a large system in
Carnarvon
Jason Masierowski
Horizon Power Power quality investigator
Provided information on voltage investigations in Carnarvon as well as
general power quality information
Eddie Smith Horizon Power Power system officer
Provided information about the Carnarvon generation strategy and PV system effects

PV Penetration Case Study - Carnarvon (April 2012) Page 46
Person(s) Organisation Title Project Role
Prateek Chourdia
SMA N/A Provided information on SMA inverter set points in an Australian context
Kieron D’Arcy and Max Willrath
Unltd energy Director and project manager
Provided information about general experiences connecting residential and
commercial PV systems to electricity grids.
Wilf Johnson Sunpower Manager commercial
projects
Provided information about general experiences connecting residential and
commercial PV systems to electricity grids.

PV Penetration Case Study - Carnarvon (April 2012) Page 47
APPENDIX 4 – Carnarvon PV System Distribution


![UITNODIGING ]Pv} ]vPu]o }Pv] À ]u ] u v v u v ]v ]u Ç · } }( }Pv] }vv ]Pv} ] ]v ]u Ç v (} ÁÇ }]u }À Z ] v . }v }( } o Á] Z }Pv] À ]u ] u v } u v ÁZ}uÇ v . ( }u u oÇ X](https://static.fdocuments.in/doc/165x107/5d4ff7c788c993af2a8b78b0/uitnodiging-pv-vpuo-pv-a-u-u-v-v-u-v-v-u-c-pv-vv-pv-.jpg)


