Seismometer CMG-3T & 3ESPc (120s) Accelerometer CMG-5T Digitiser DM24 (6 components)
CaRMS Forum
April 29, 2018
CaRMS ForumApril 29, 2018
The Canadian Resident Matching Service
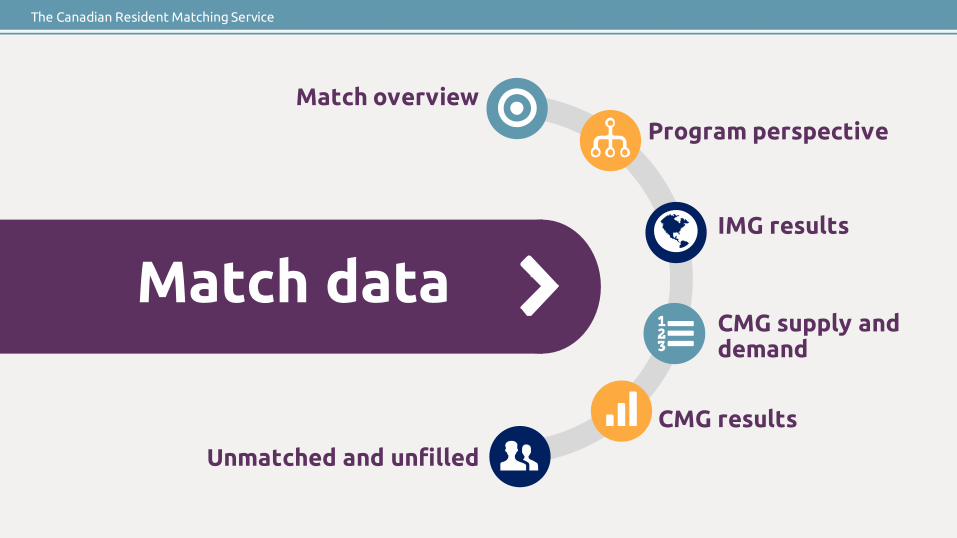
Match data >
CMG results
CMG supply and demand
Program perspectiveMatch overview
Unmatched and unfilled
IMG results
The Canadian Resident Matching Service
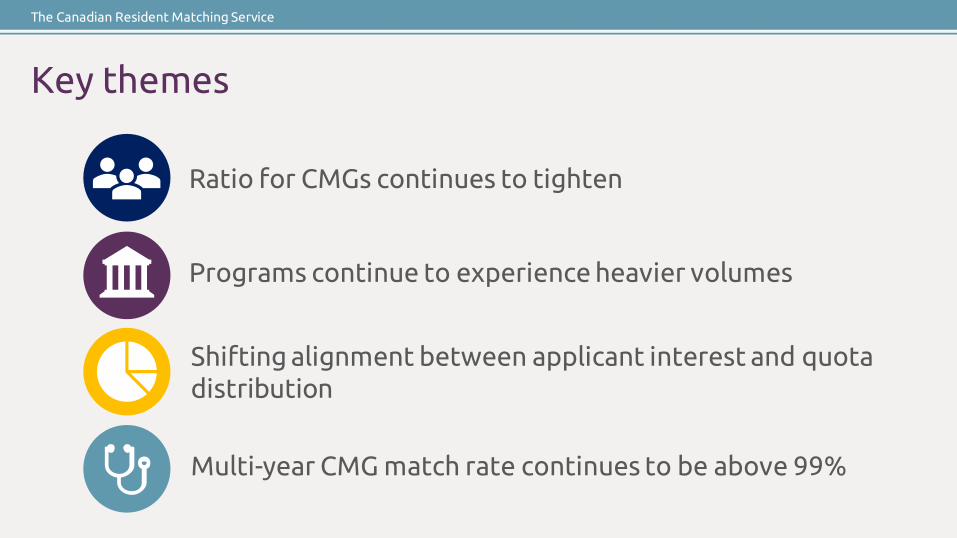
Ratio for CMGs continues to tighten
Multi-year CMG match rate continues to be above 99%
Shifting alignment between applicant interest and quota distribution
Programs continue to experience heavier volumes
Key themes

Match overview
The Canadian Resident Matching Service
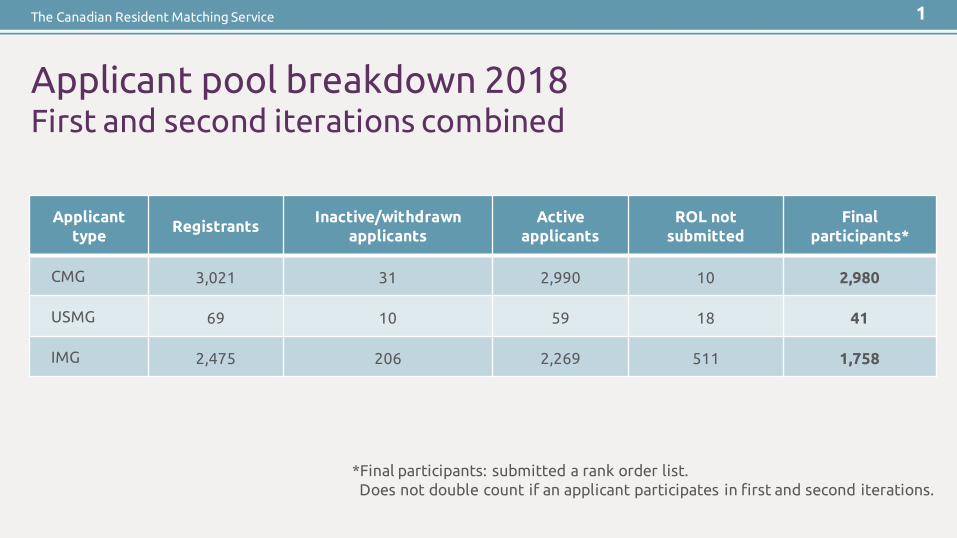
Applicant pool breakdown 2018First and second iterations combined
*Final participants: submitted a rank order list. Does not double count if an applicant participates in first and second iterations.
Applicanttype
RegistrantsInactive/withdrawn
applicantsActive
applicantsROL not
submittedFinal
participants*
CMG 3,021 31 2,990 10 2,980
USMG 69 10 59 18 41
IMG 2,475 206 2,269 511 1,758
1
The Canadian Resident Matching Service
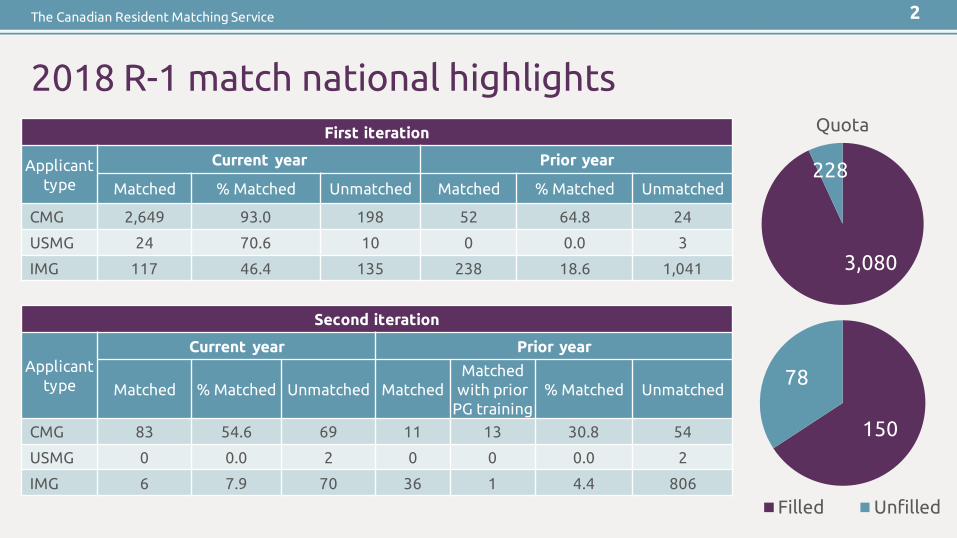
2018 R-1 match national highlights First iteration
Applicant type
Current year Prior year
Matched % Matched Unmatched Matched % Matched Unmatched
CMG 2,649 93.0 198 52 64.8 24
USMG 24 70.6 10 0 0.0 3
IMG 117 46.4 135 238 18.6 1,041
2
Second iteration
Applicant type
Current year Prior year
Matched % Matched Unmatched MatchedMatched
with prior PG training
% Matched Unmatched
CMG 83 54.6 69 11 13 30.8 54
USMG 0 0.0 2 0 0 0.0 2
IMG 6 7.9 70 36 1 4.4 806
3,080
228
150
78
Filled Unfilled
Quota
The Canadian Resident Matching Service
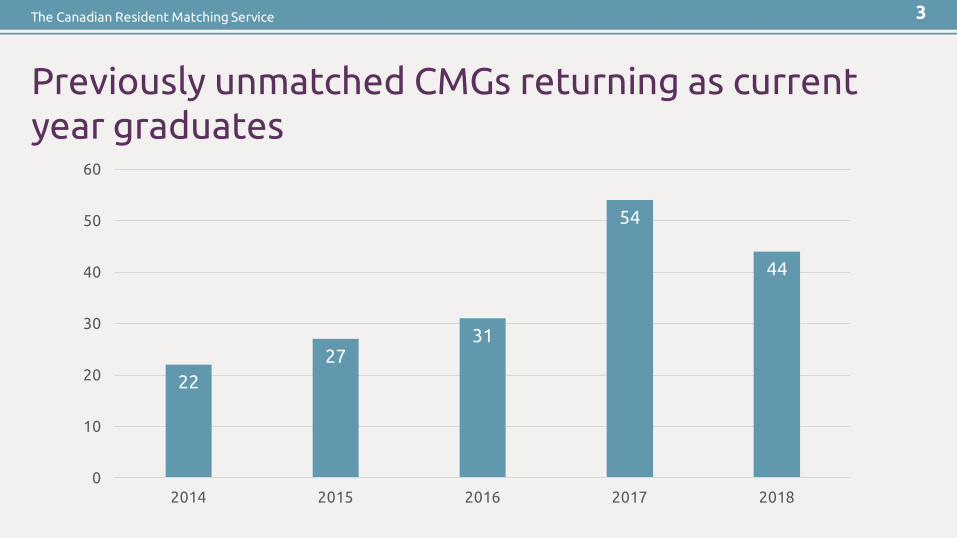
Previously unmatched CMGs returning as current year graduates
3
2227
31
54
44
0
10
20
30
40
50
60
2014 2015 2016 2017 2018
The Canadian Resident Matching Service
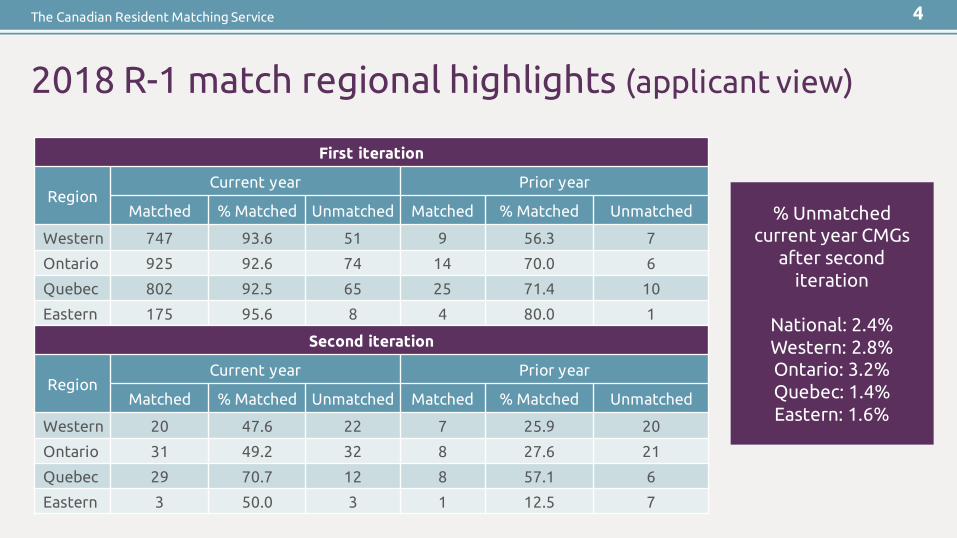
2018 R-1 match regional highlights (applicant view)
First iteration
RegionCurrent year Prior year
Matched % Matched Unmatched Matched % Matched Unmatched
Western 747 93.6 51 9 56.3 7
Ontario 925 92.6 74 14 70.0 6
Quebec 802 92.5 65 25 71.4 10
Eastern 175 95.6 8 4 80.0 1
% Unmatched current year CMGs
after second iteration
National: 2.4%Western: 2.8%Ontario: 3.2%Quebec: 1.4%Eastern: 1.6%
4
Second iteration
RegionCurrent year Prior year
Matched % Matched Unmatched Matched % Matched Unmatched
Western 20 47.6 22 7 25.9 20
Ontario 31 49.2 32 8 27.6 21
Quebec 29 70.7 12 8 57.1 6
Eastern 3 50.0 3 1 12.5 7

The Canadian Resident Matching Service
2018 R-1 match highlights by region (program quota view)
Western Ontario Quebec Eastern
Firstiteration
Second iteration
90.95%fill rate
100% total fill rate
5
927
64
57
7
1,155
35
33
2
807
110
41
69
191
19
19
88.00%fill rate
97.06%fill rate
93.54%fill rate
92.47% total fill rate
99.83% total fill rate
99.29% total fill rate
Filled positions Unfilled positions
The Canadian Resident Matching Service
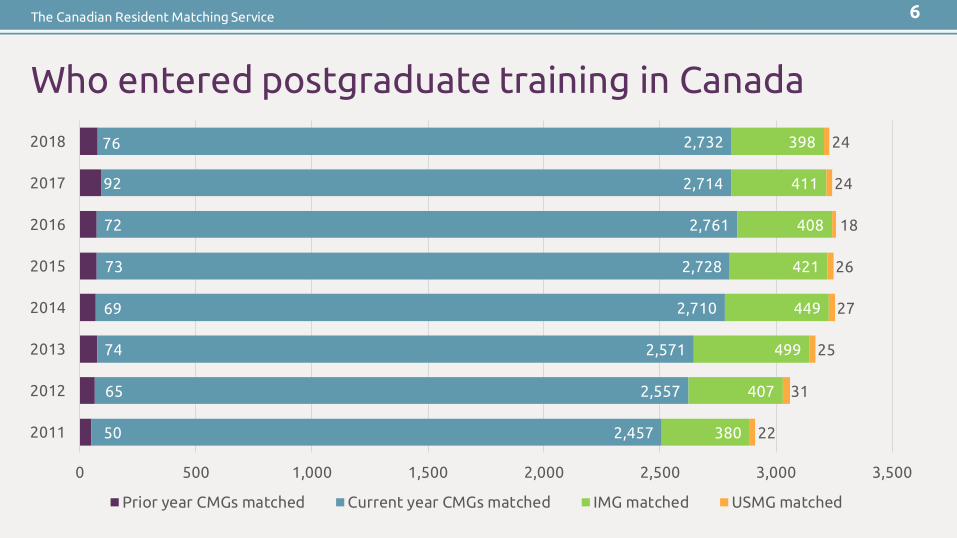
Who entered postgraduate training in Canada
6
50
65
74
69
73
72
92
76
2,457
2,557
2,571
2,710
2,728
2,761
2,714
2,732
380
407
499
449
421
408
411
398
22
31
25
27
26
18
24
24
0 500 1,000 1,500 2,000 2,500 3,000 3,500
2011
2012
2013
2014
2015
2016
2017
2018
Prior year CMGs matched Current year CMGs matched IMG matched USMG matched

Program perspective
The Canadian Resident Matching Service
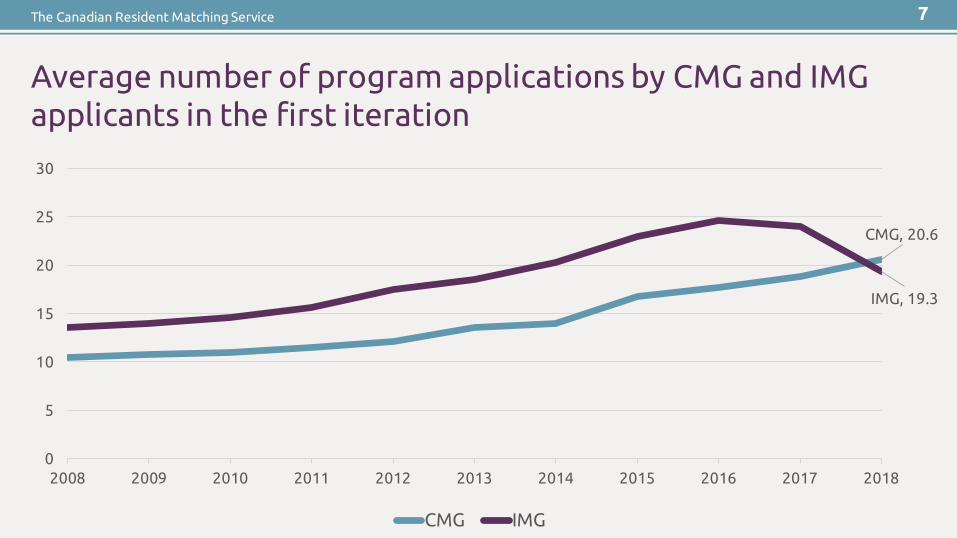
Average number of program applications by CMG and IMG applicants in the first iteration
7
CMG, 20.6
IMG, 19.3
0
5
10
15
20
25
30
2008 2009 2010 2011 2012 2013 2014 2015 2016 2017 2018
CMG IMG

The Canadian Resident Matching Service
Number of applications submitted by CMGs
8
34
0
63
0
1,1
06
48
8
18
5 12
2
34
5
54
3
1,1
28
51
7
23
6
14
6
18
7
59
0
1,2
03
51
4
22
3
18
9
13
4
45
7
1,2
00
63
7
27
1
23
2
0
200
400
600
800
1,000
1,200
1,400
< 5 Applications 6-10Applications
11-20Applications
21-30Applications
31-40Applications
> 40Applications
Nu
mb
er o
f C
MG
s
Number of applications
2015
2016
2017
2018
The Canadian Resident Matching Service 9
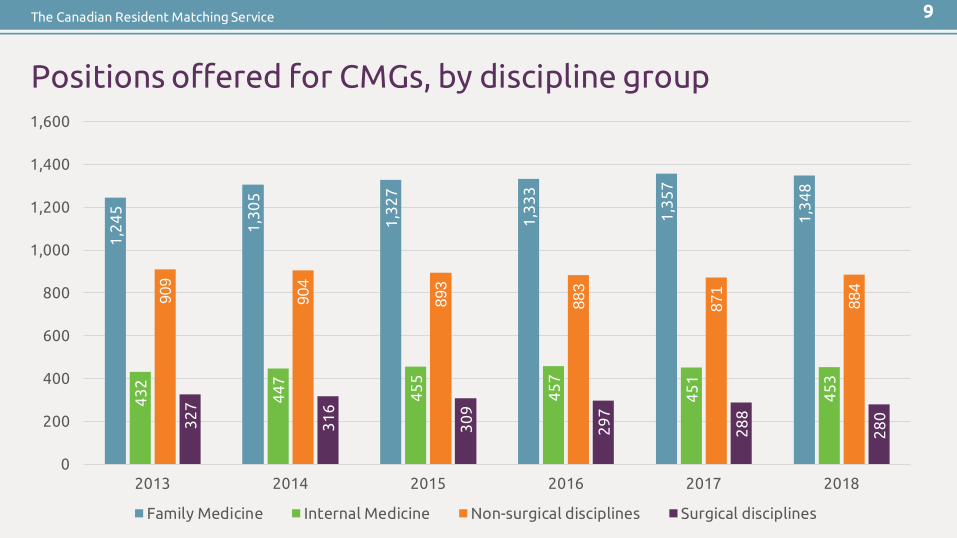
Positions offered for CMGs, by discipline group1
,24
5
1,3
05
1,3
27
1,3
33
1,3
57
1,3
48
43
2
44
7
45
5
45
7
45
1
45
3
909
904
893
883
871
884
32
7
31
6
30
9
29
7
28
8
28
0
0
200
400
600
800
1,000
1,200
1,400
1,600
2013 2014 2015 2016 2017 2018
Family Medicine Internal Medicine Non-surgical disciplines Surgical disciplines
The Canadian Resident Matching Service
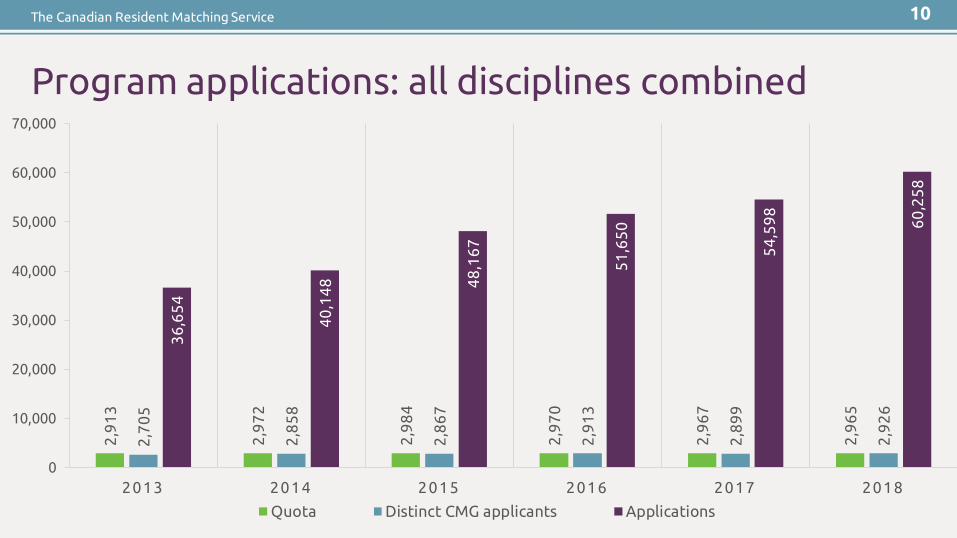
Program applications: all disciplines combined
10
2,9
13
2,9
72
2,9
84
2,9
70
2,9
67
2,9
65
2,7
05
2,8
58
2,8
67
2,9
13
2,8
99
2,9
26
36
,65
4
40
,14
8 48
,16
7
51
,65
0
54
,59
8
60
,25
8
0
10,000
20,000
30,000
40,000
50,000
60,000
70,000
2013 2014 2015 2016 2017 2018
Quota Distinct CMG applicants Applications

The Canadian Resident Matching Service
Program applications: Family Medicine
11
11
2
12
0
12
9
13
4
13
5
14
31,2
45
1,3
05
1,3
27
1,3
33
1,3
57
1,3
48
1,7
62
1,9
12
1,9
85
2,0
05
1,8
80
1,9
92
16
,10
8
19
,07
2
26
,34
4
27
,69
9
29
,21
8 32
,94
0
0
5,000
10,000
15,000
20,000
25,000
30,000
35,000
2013 2014 2015 2016 2017 2018
Program sites Quota Distinct CMG applicants Applications
The Canadian Resident Matching Service
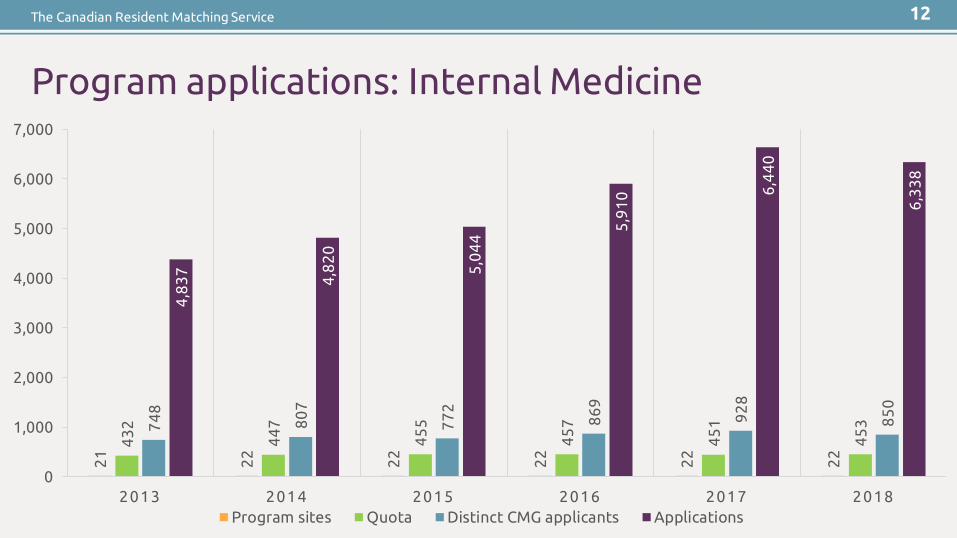
Program applications: Internal Medicine
12
21 22
22
22
22
22
43
2
44
7
45
5
45
7
45
1
45
374
8
80
7
77
2
86
9
92
8
85
0
4,8
37
4,8
20
5,0
44
5,9
10 6
,44
0
6,3
38
0
1,000
2,000
3,000
4,000
5,000
6,000
7,000
2013 2014 2015 2016 2017 2018Program sites Quota Distinct CMG applicants Applications

IMG results
The Canadian Resident Matching Service
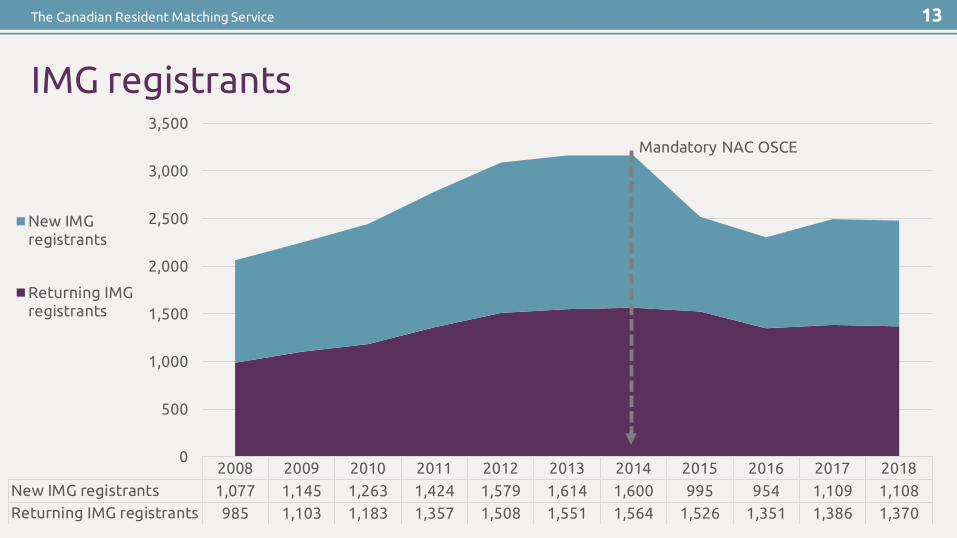
2008 2009 2010 2011 2012 2013 2014 2015 2016 2017 2018New IMG registrants 1,077 1,145 1,263 1,424 1,579 1,614 1,600 995 954 1,109 1,108Returning IMG registrants 985 1,103 1,183 1,357 1,508 1,551 1,564 1,526 1,351 1,386 1,370
0
500
1,000
1,500
2,000
2,500
3,000
3,500
New IMGregistrants
Returning IMGregistrants
Mandatory NAC OSCE
IMG registrants
13
The Canadian Resident Matching Service
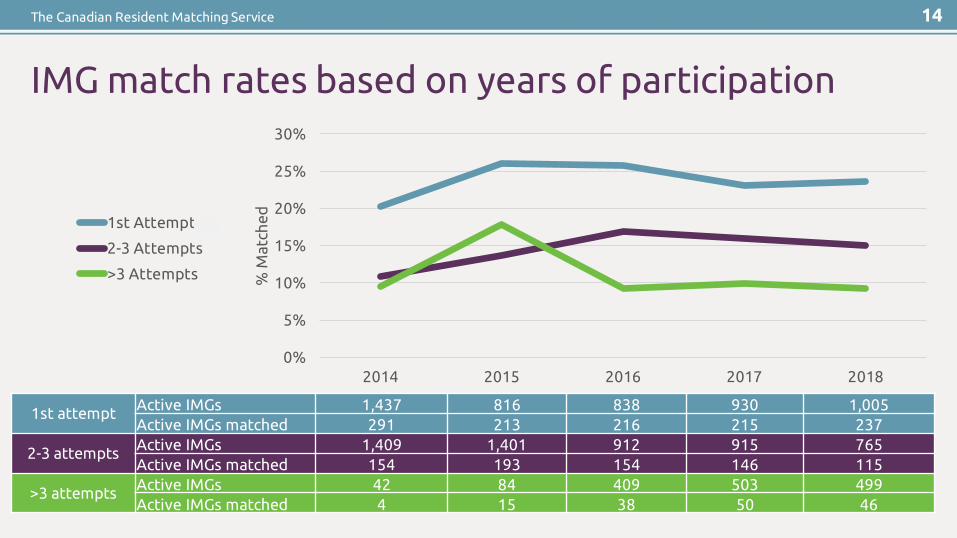
IMG match rates based on years of participation
14
0%
5%
10%
15%
20%
25%
30%
2014 2015 2016 2017 2018
% M
atch
ed1st Attempts
2-3 Attempts
>3 Attempts
1st attempt Active IMGs 1,437 816 838 930 1,005Active IMGs matched 291 213 216 215 237
2-3 attempts Active IMGs 1,409 1,401 912 915 765Active IMGs matched 154 193 154 146 115
>3 attempts Active IMGs 42 84 409 503 499Active IMGs matched 4 15 38 50 46

The Canadian Resident Matching Service
Regional IMG match results
Region Final participation % matched
Africa 252 15%
Asia 363 13%
Central America/Caribbean 373 18%
Europe 415 41%
Middle East 272 16%
North America 4 0%
Oceania/Pacific Islands 34 53%
South America 45 24%
15

CMG Supply and demand
Supply: available quota in discipline
Demand: applicant first choice interest in discipline
The Canadian Resident Matching Service
0
50
100
150
200
250
300
0
500
1,000
1,500
2,000
2,500
3,000
3,500
2008 2009 2010 2011 2012 2013 2014 2015 2016 2017 2018
Un
mat
ched
cu
rren
t ye
ar C
MG
s
Par
tici
pat
ion
an
d q
uo
ta
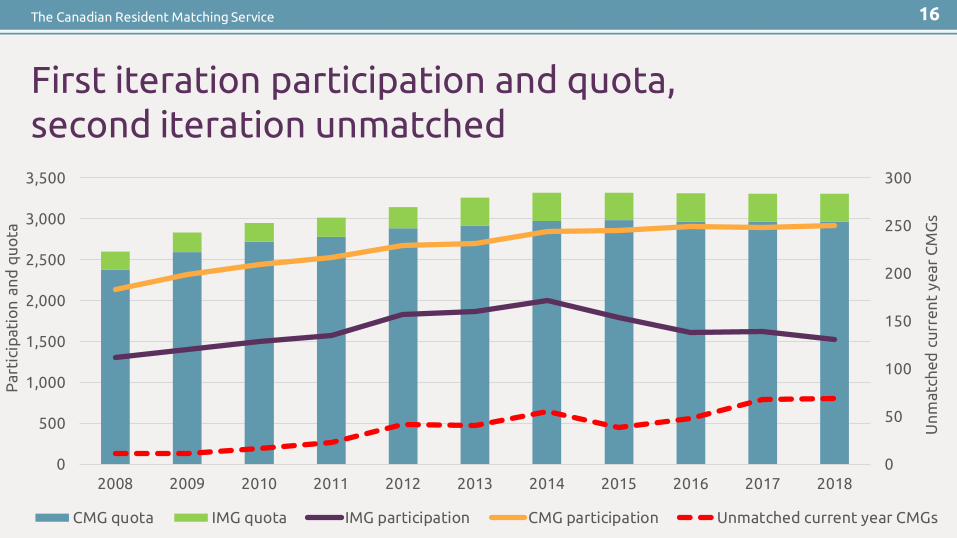
CMG quota IMG quota IMG participation CMG participation Unmatched current year CMGs
First iteration participation and quota, second iteration unmatched
16
The Canadian Resident Matching Service
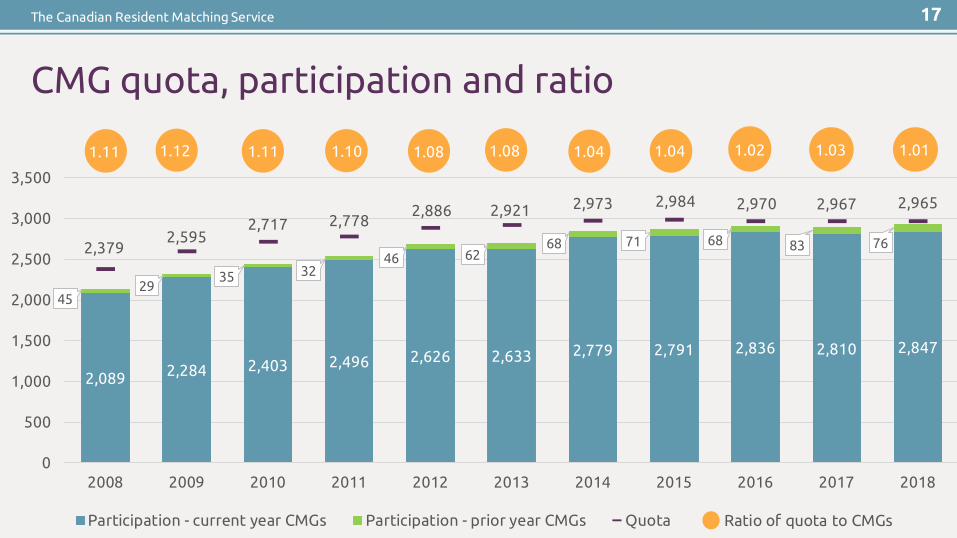
2,089 2,284 2,403 2,496 2,626 2,633 2,779 2,791 2,836 2,810 2,847
4529
35 3246 62
68 71 68 83 762,3792,595
2,717 2,7782,886 2,921 2,973 2,984 2,970 2,967 2,965
0
500
1,000
1,500
2,000
2,500
3,000
3,500
2008 2009 2010 2011 2012 2013 2014 2015 2016 2017 2018
Participation - current year CMGs Participation - prior year CMGs Quota
CMG quota, participation and ratio
1.11 1.12 1.11 1.10 1.08 1.021.04 1.041.08 1.03
Ratio of quota to CMGs
17
1.01
The Canadian Resident Matching Service
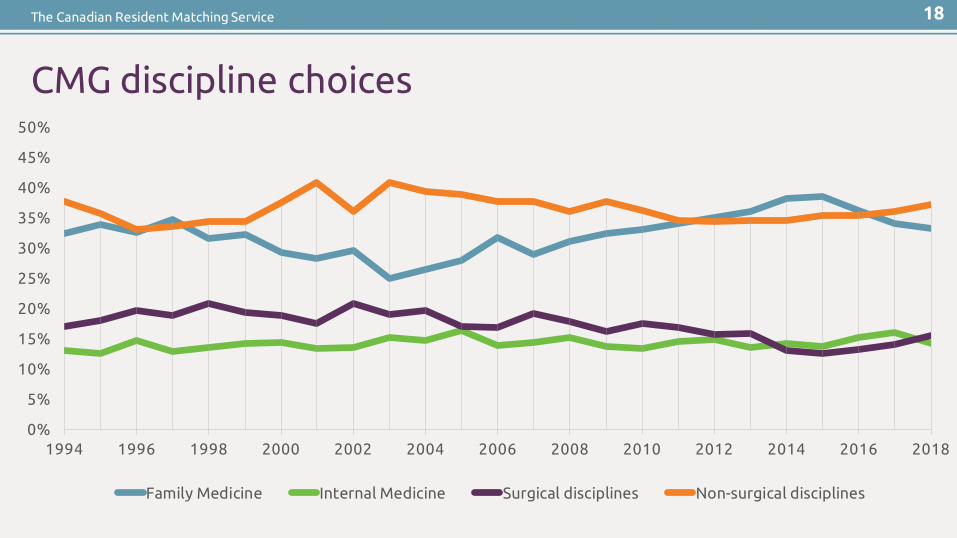
CMG discipline choices
18
0%
5%
10%
15%
20%
25%
30%
35%
40%
45%
50%
1994 1996 1998 2000 2002 2004 2006 2008 2010 2012 2014 2016 2018
Family Medicine Internal Medicine Surgical disciplines Non-surgical disciplines

The Canadian Resident Matching Service
Top 10 CMG discipline choices
First choice disciplines 2016 2017 2018 Change from 2016
Family Medicine 35.7% 33.4% 33.2% -2.5%
Internal Medicine 15.2% 16.0% 14.2% -1.0%
Psychiatry 5.8% 6.2% 6.5% 0.7%
Pediatrics 5.7% 5.9% 5.3% -0.4%
Anesthesiology 4.8% 4.7% 5.0% 0.2%
Emergency Medicine 4.4% 4.1% 4.2% -0.2%
Obstetrics & Gynecology 3.8% 3.9% 3.8% 0.0%
Diagnostic Radiology 2.6% 3.1% 2.8% 0.2%
General Surgery 3.4% 3.7% 4.1% 0.7%
Ophthalmology 1.9% 1.7% 2.4% 0.5%
19
The Canadian Resident Matching Service
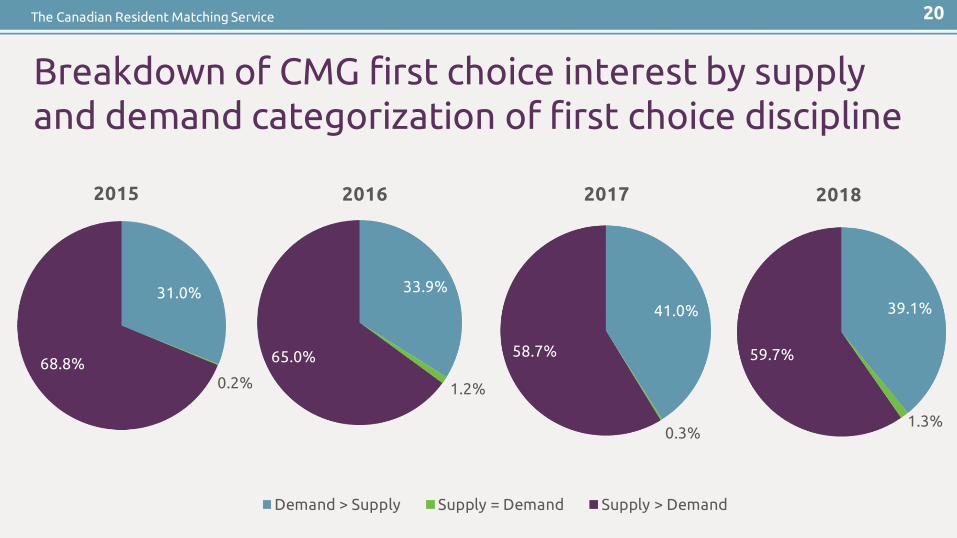
39.1%
1.3%
59.7%
2018
Demand > Supply Supply = Demand Supply > Demand
41.0%
0.3%
58.7%
2017
33.9%
1.2%
65.0%
2016
Breakdown of CMG first choice interest by supply and demand categorization of first choice discipline
20
31.0%
0.2%68.8%
2015
The Canadian Resident Matching Service
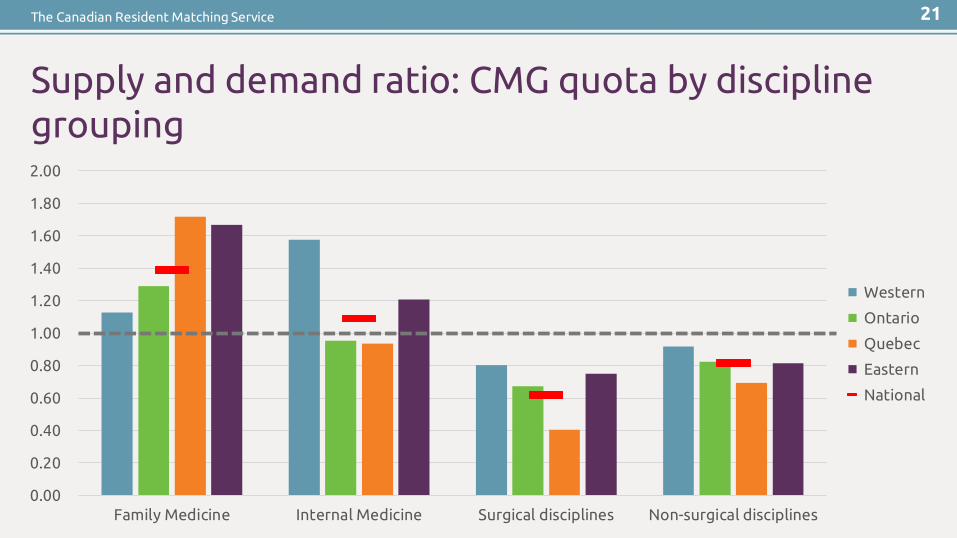
Supply and demand ratio: CMG quota by discipline grouping
21
0.00
0.20
0.40
0.60
0.80
1.00
1.20
1.40
1.60
1.80
2.00
Family Medicine Internal Medicine Surgical disciplines Non-surgical disciplines
Western
Ontario
Quebec
Eastern
National
The Canadian Resident Matching Service
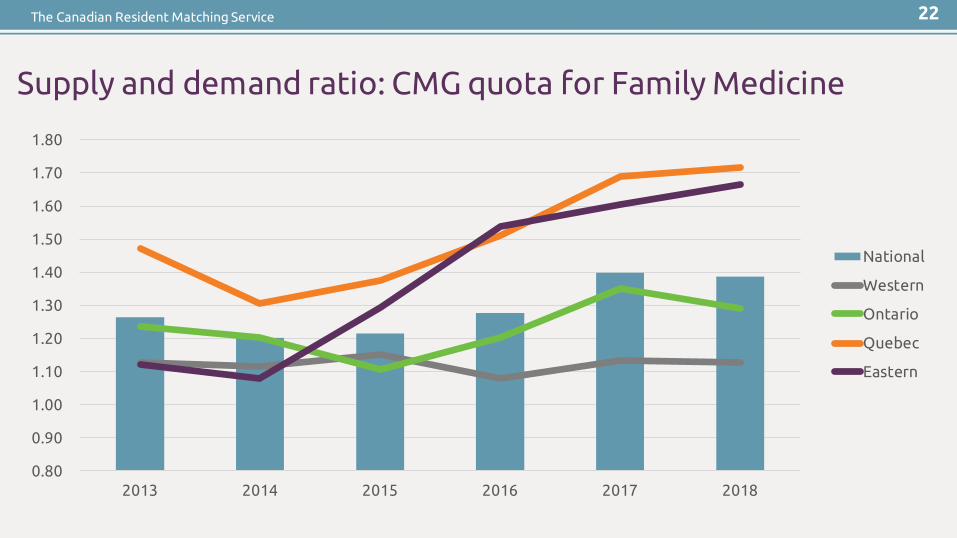
Supply and demand ratio: CMG quota for Family Medicine
22
0.80
0.90
1.00
1.10
1.20
1.30
1.40
1.50
1.60
1.70
1.80
2013 2014 2015 2016 2017 2018
National
Western
Ontario
Quebec
Eastern
The Canadian Resident Matching Service
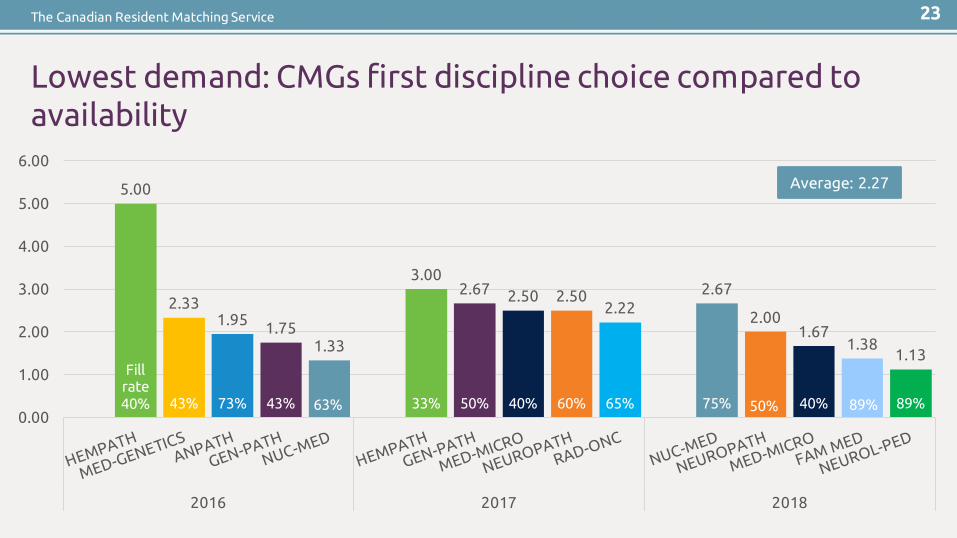
5.00
2.33 1.95 1.75
1.33
3.00 2.67 2.50 2.50
2.22 2.67
2.00 1.67
1.38 1.13
Fillrate40% 43% 73% 43% 63% 33% 50% 40% 60% 65% 75% 50% 40% 89% 89%
0.00
1.00
2.00
3.00
4.00
5.00
6.00
2016 2017 2018
Lowest demand: CMGs first discipline choice compared to availability
Average: 2.27
23
The Canadian Resident Matching Service
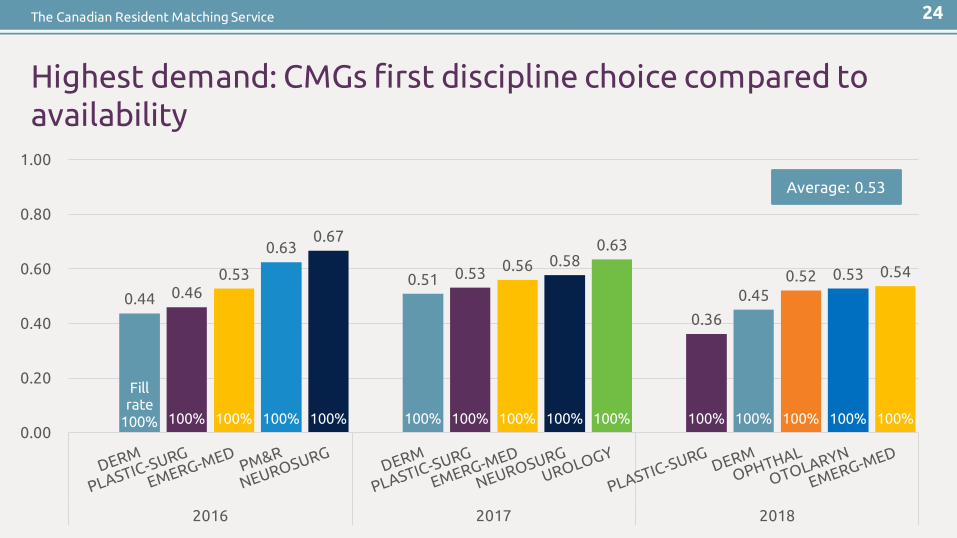
0.44 0.46 0.53
0.63 0.67
0.51 0.53 0.56 0.58 0.63
0.36
0.45 0.52 0.53 0.54
Fill rate
100% 100% 100% 100% 100% 100% 100% 100% 100% 100% 100% 100% 100% 100% 100%0.00
0.20
0.40
0.60
0.80
1.00
2016 2017 2018
Highest demand: CMGs first discipline choice compared to availability
Average: 0.53
24

CMG results
The Canadian Resident Matching Service
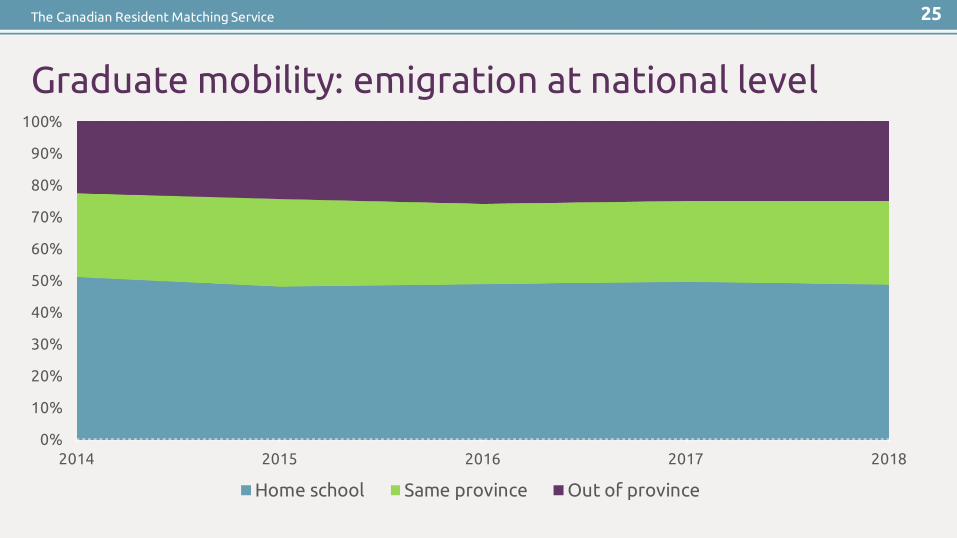
Graduate mobility: emigration at national level
25
0%
10%
20%
30%
40%
50%
60%
70%
80%
90%
100%
2014 2015 2016 2017 2018
Home school Same province Out of province
The Canadian Resident Matching Service
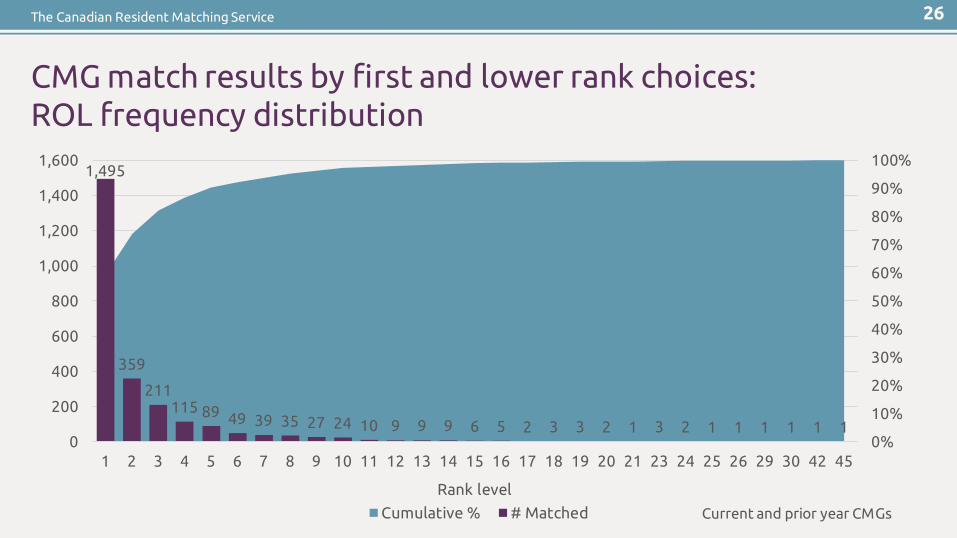
CMG match results by first and lower rank choices: ROL frequency distribution
26
1,495
359
211115 89 49 39 35 27 24 10 9 9 9 6 5 2 3 3 2 1 3 2 1 1 1 1 1 1
0%
10%
20%
30%
40%
50%
60%
70%
80%
90%
100%
0
200
400
600
800
1,000
1,200
1,400
1,600
1 2 3 4 5 6 7 8 9 10 11 12 13 14 15 16 17 18 19 20 21 23 24 25 26 29 30 42 45
Rank level
Cumulative % # Matched Current and prior year CMGs

The Canadian Resident Matching Service 27
CMG couples match results by first and lower rank choices: ROL frequency distribution
95
24 23
93 5 2 4 3 2 1 2 2 2 1 2 1 1 1 1 1 1 1 1
0%
10%
20%
30%
40%
50%
60%
70%
80%
90%
100%
0
10
20
30
40
50
60
70
80
90
100
1 2 3 4 5 6 7 8 9 10 11 12 15 16 24 25 26 27 37 41 42 51 61 66Rank level
Cumulative % # Matched Current and prior year CMGs
The Canadian Resident Matching Service
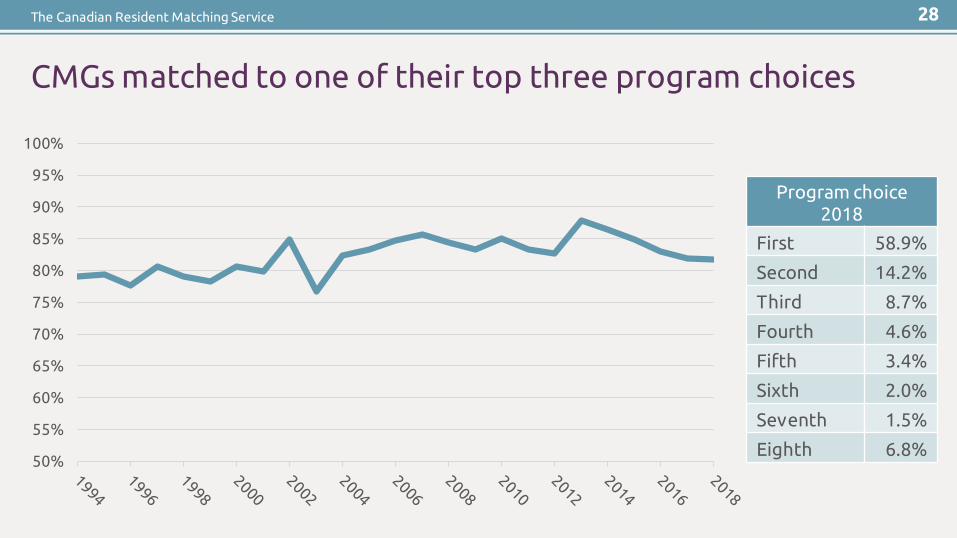
CMGs matched to one of their top three program choices
Program choice2018
First 58.9%
Second 14.2%
Third 8.7%
Fourth 4.6%
Fifth 3.4%
Sixth 2.0%
Seventh 1.5%
Eighth 6.8%
28
50%
55%
60%
65%
70%
75%
80%
85%
90%
95%
100%
The Canadian Resident Matching Service
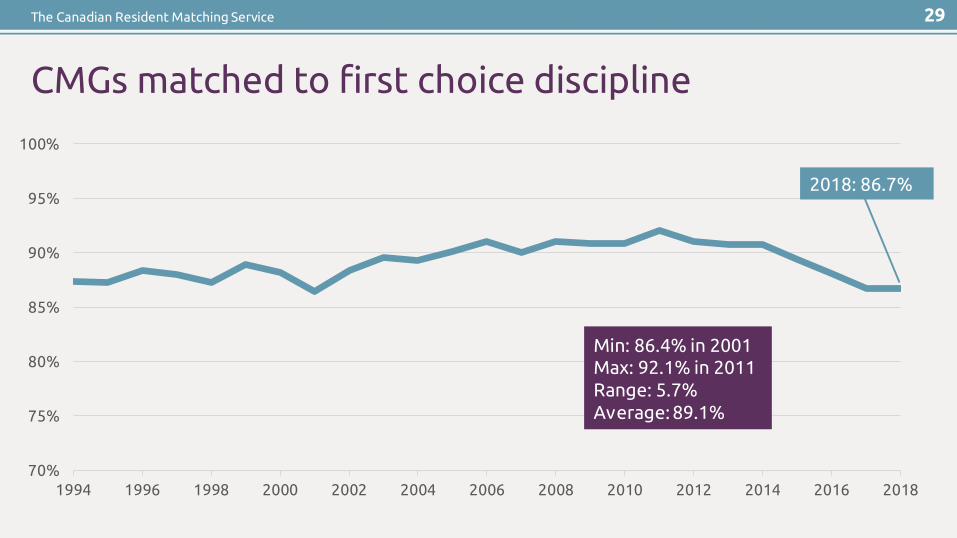
CMGs matched to first choice discipline
29
70%
75%
80%
85%
90%
95%
100%
1994 1996 1998 2000 2002 2004 2006 2008 2010 2012 2014 2016 2018
Min: 86.4% in 2001Max: 92.1% in 2011Range: 5.7%Average: 89.1%
2018: 86.7%
The Canadian Resident Matching Service 30
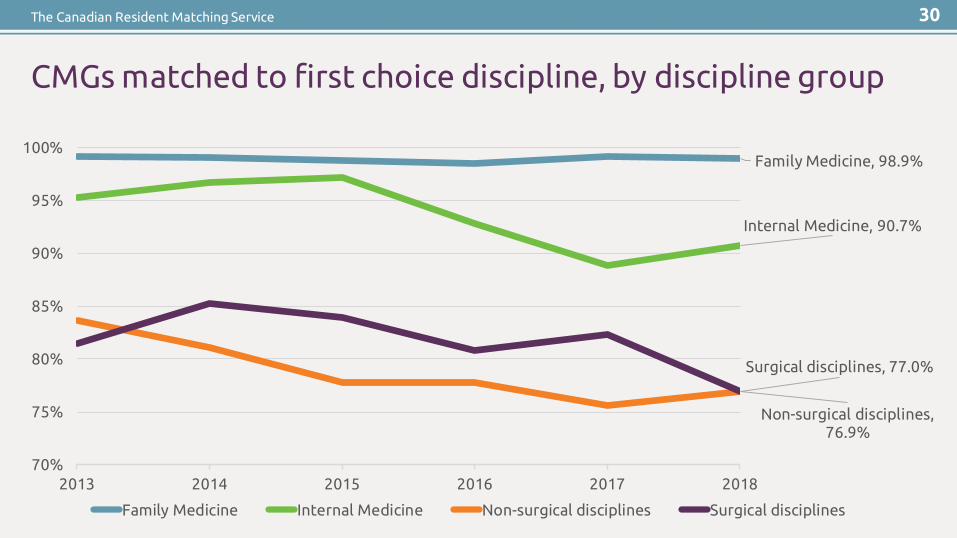
CMGs matched to first choice discipline, by discipline group
Family Medicine, 98.9%
Internal Medicine, 90.7%
Non-surgical disciplines, 76.9%
Surgical disciplines, 77.0%
70%
75%
80%
85%
90%
95%
100%
2013 2014 2015 2016 2017 2018
Family Medicine Internal Medicine Non-surgical disciplines Surgical disciplines

The Canadian Resident Matching Service
CMGs matched to first choice discipline, by region
31
Eastern, 90.5%
Ontario, 89.5%
Quebec, 81.0%
Western, 88.6%
National, 86.7%
70%
75%
80%
85%
90%
95%
100%
2013 2014 2015 2016 2017 2018
Eastern Ontario Quebec Western National
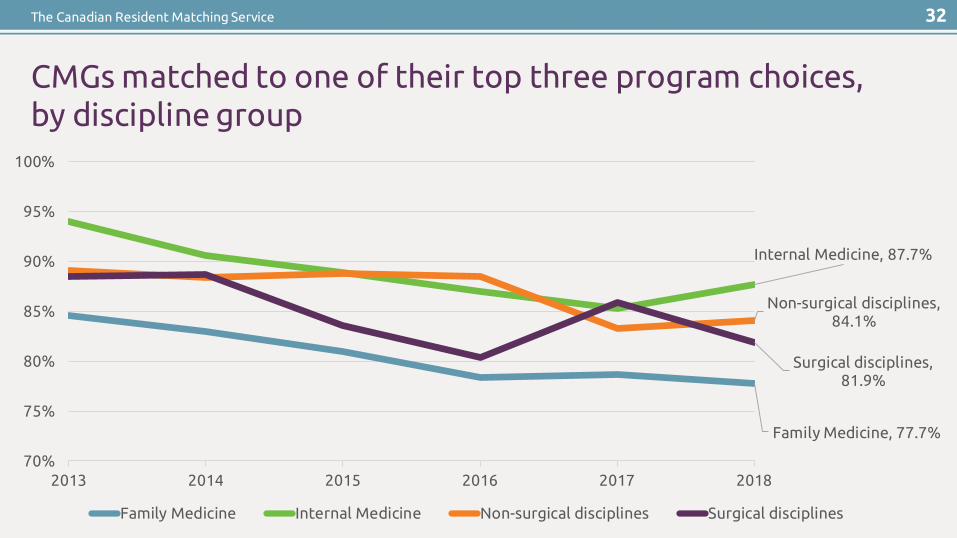
The Canadian Resident Matching Service 32
CMGs matched to one of their top three program choices, by discipline group
Family Medicine, 77.7%
Internal Medicine, 87.7%
Non-surgical disciplines, 84.1%
Surgical disciplines, 81.9%
70%
75%
80%
85%
90%
95%
100%
2013 2014 2015 2016 2017 2018
Family Medicine Internal Medicine Non-surgical disciplines Surgical disciplines

Unmatched and unfilled
The Canadian Resident Matching Service
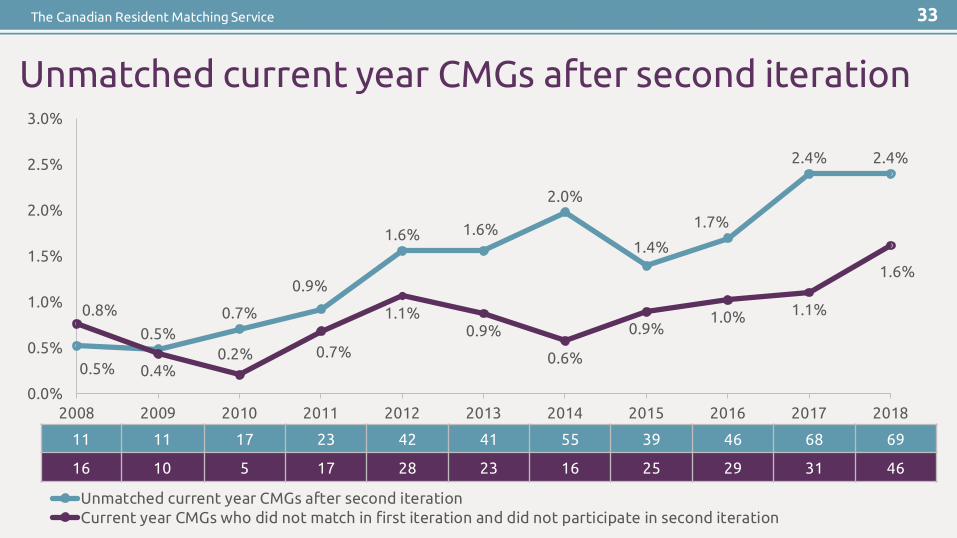
2.4%2.4%
1.7%
1.4%
2.0%
1.6%1.6%
0.9%
0.7%0.5%
0.5%
1.6%
1.1%1.0%0.9%
0.6%
0.9%1.1%
0.7%0.2%0.4%
0.8%
0.0%
0.5%
1.0%
1.5%
2.0%
2.5%
3.0%
2008 2009 2010 2011 2012 2013 2014 2015 2016 2017 2018
Unmatched current year CMGs after second iterationCurrent year CMGs who did not match in first iteration and did not participate in second iteration
Unmatched current year CMGs after second iteration
33
11 11 17 23 42 41 55 39 46 68 69
16 10 5 17 28 23 16 25 29 31 46
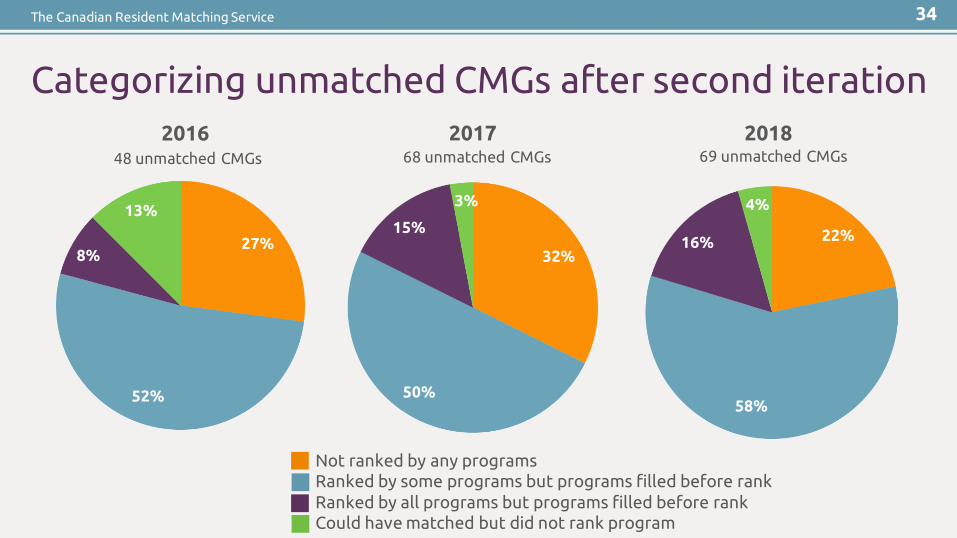
The Canadian Resident Matching Service
Categorizing unmatched CMGs after second iteration
34
27%
52%
8%
13%
201648 unmatched CMGs
32%
50%
15%
3%
201768 unmatched CMGs
22%
58%
16%
4%
201869 unmatched CMGs
Not ranked by any programsRanked by some programs but programs filled before rankRanked by all programs but programs filled before rankCould have matched but did not rank program
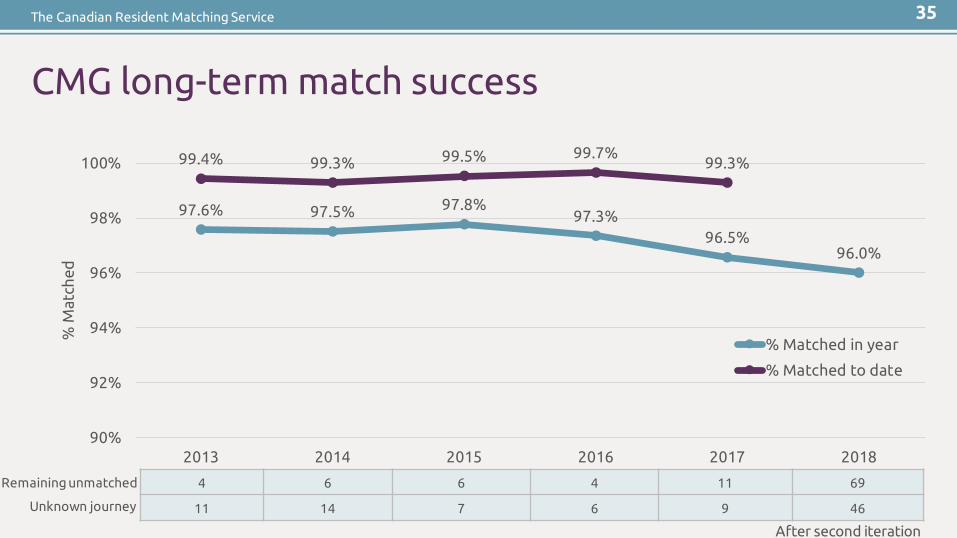
The Canadian Resident Matching Service
CMG long-term match success
35
97.6% 97.5% 97.8%97.3%
96.5%96.0%
99.4% 99.3% 99.5% 99.7%99.3%
90%
92%
94%
96%
98%
100%
2013 2014 2015 2016 2017 2018
% M
atch
ed
% Matched in year
% Matched to date
4 6 6 4 11 69
11 14 7 6 9 46
Remaining unmatched
Unknown journey
After second iteration

The Canadian Resident Matching Service
Comparing discipline choice to unfilled quota (1 of 2)
36
1st choice discipline1st choice discipline
of CMGs matching in 2nd iteration
1st choice discipline of CMGs participating
and not matched in 2nd iteration
1st choice discipline of CMGs not matched in 1st iteration and not
participating in 2nd iteration
Quota unfilled at the end of 1st iteration
Quota unfilled at the end of 2nd iteration
Anesthesiology 3 10 1 0Anatomical Pathology 1 1 7 1Cardiac Surgery 1 0Dermatology 5 8 1Diagnostic Radiology 8 5 6 1Emergency Medicine 1 0Family Medicine 44 25 3 158 65General Pathology 1 2 4General Surgery 8 0Hematological Pathology 2 1Internal Medicine 9 6 1 19 1Medical Genetics and Genomics 1 1Medical Microbiology 4 4Neurology 1 1Neurology-Pediatric 3 2 1Neuropathology 1 1 2 1Neurosurgery 1 0

The Canadian Resident Matching Service
Comparing discipline choice to unfilled quota (2 of 2)
37
1st choice discipline1st choice discipline of
CMGs matching in 2nd iteration
1st choice discipline of CMGs participating
and not matched in 2nd iteration
1st choice discipline of CMGs not matched in 1st iteration and not
participating in 2nd iteration
Quota unfilled at the end of 1st iteration
Quota unfilledat the end of 2nd iteration
Nuclear Medicine 2 1Obstetrics & Gynecology 6 0Ophthalmology 6 0Orthopedic Surgery 4 0Otolaryngology 3 0Pediatrics 1 0Physical Medicine and Rehabilitation 1 1 2 1Plastic Surgery – Clinical Investigator Program 1 0Plastic Surgery 6 0Psychiatry 3 2 1 10 1Public Health and Preventative Medicine 2 4Public Health and Preventative Medicine including Family Medicine 1 3Urology 1 0Vascular Surgery 2 3 1 1 1Totals 83 69 46 228 78
The Canadian Resident Matching Service
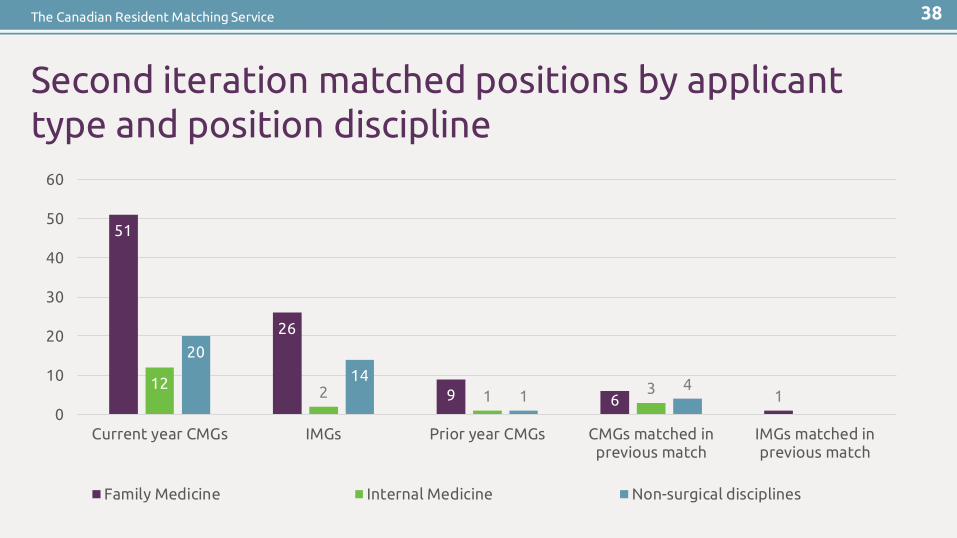
Second iteration matched positions by applicant type and position discipline
38
51
26
9 6 112 2 1 3
20
141
4
0
10
20
30
40
50
60
Current year CMGs IMGs Prior year CMGs CMGs matched inprevious match
IMGs matched inprevious match
Family Medicine Internal Medicine Non-surgical disciplines
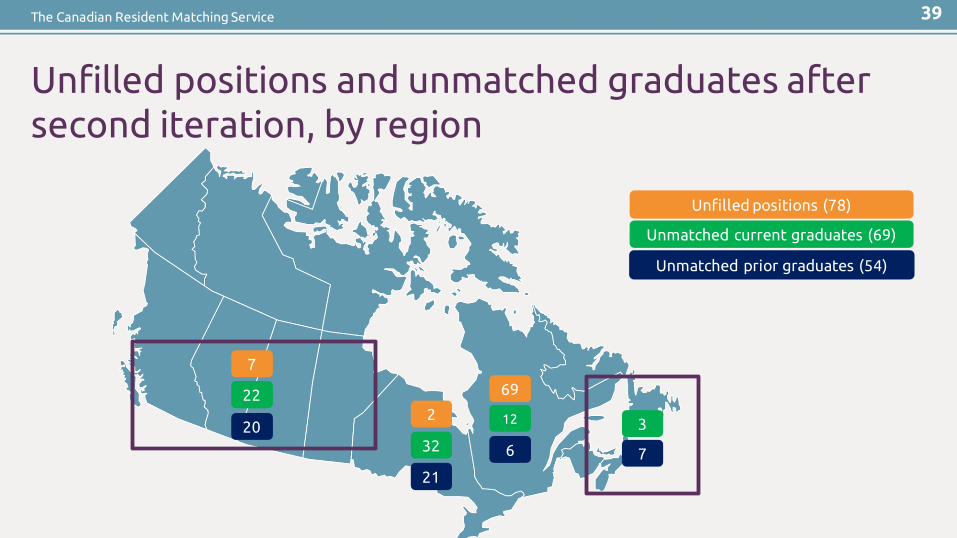
The Canadian Resident Matching Service
Unfilled positions and unmatched graduates after second iteration, by region
7
3
6
12
69
21
32
220
22
7
39
Unfilled positions (78)
Unmatched current graduates (69)
Unmatched prior graduates (54)
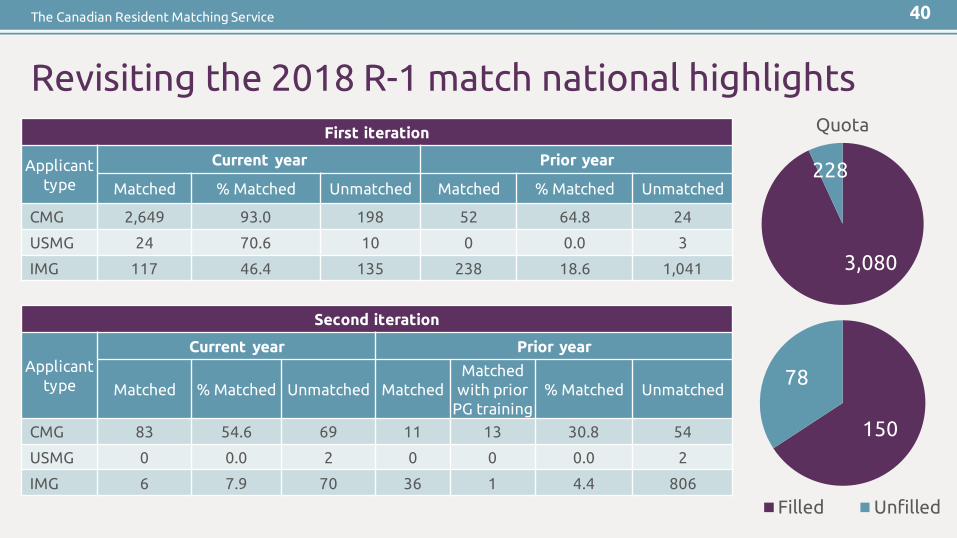
The Canadian Resident Matching Service
Revisiting the 2018 R-1 match national highlights First iteration
Applicant type
Current year Prior year
Matched % Matched Unmatched Matched % Matched Unmatched
CMG 2,649 93.0 198 52 64.8 24
USMG 24 70.6 10 0 0.0 3
IMG 117 46.4 135 238 18.6 1,041
40
Second iteration
Applicant type
Current year Prior year
Matched % Matched Unmatched MatchedMatched
with prior PG training
% Matched Unmatched
CMG 83 54.6 69 11 13 30.8 54
USMG 0 0.0 2 0 0 0.0 2
IMG 6 7.9 70 36 1 4.4 806
3,080
228
150
78
Filled Unfilled
Quota

Additional content
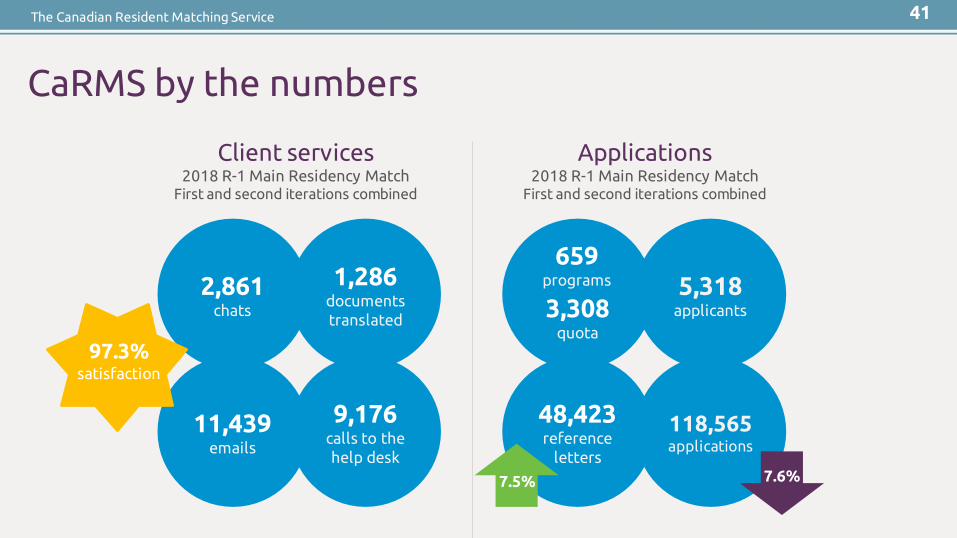
The Canadian Resident Matching Service
CaRMS by the numbers
Client services2018 R-1 Main Residency Match
First and second iterations combined
5,318applicants
48,423reference
letters
2,861chats
11,439emails
9,176calls to the help desk
118,565applications
Applications2018 R-1 Main Residency Match
First and second iterations combined
1,286documents translated
7.5%
3,308quota
659programs
7.6%
97.3% satisfaction
41
The Canadian Resident Matching Service
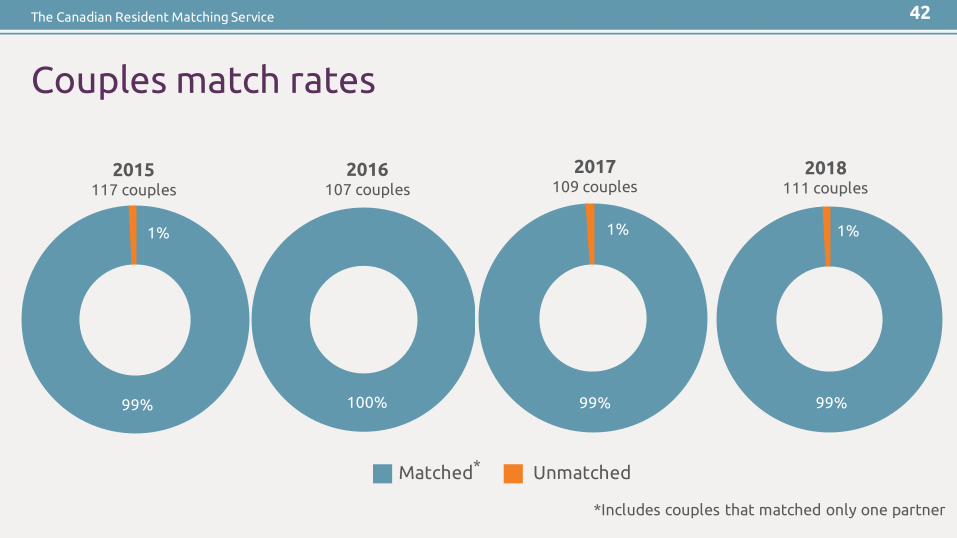
Couples match rates
*Includes couples that matched only one partner
99%
1%
2015117 couples
2016107 couples
99%
1%
2017109 couples
99%
1%
2018111 couples
Matched Unmatched
100%
*
42

The Canadian Resident Matching Service
1.00
1.00
1.02
1.08
1.09
1.10
1.13
1.39
1.67
2.00
2.67
Hematological Pathology
Medical Genetics
Diagnostic Radiology
Anatomical Pathology
Internal Medicine
Public Health and Preventative Medicine
Neurology - Pediatric
Family Medicine
Medical Microbiology
Neuropathology
Nuclear Medicine
First choice discipline compared to availability (supply > demand)
(Positions/applicant first choice discipline)
43
The Canadian Resident Matching Service
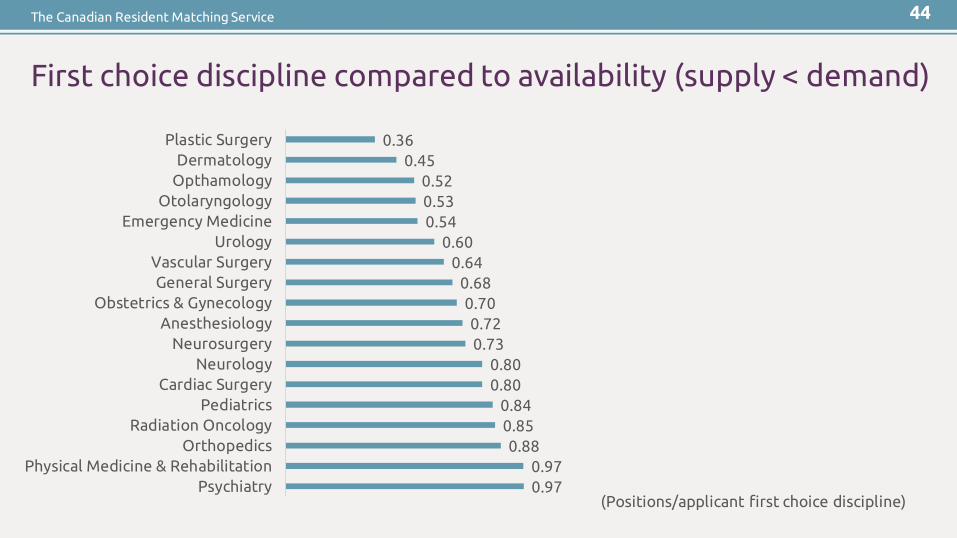
First choice discipline compared to availability (supply < demand)
(Positions/applicant first choice discipline)0.97 0.97
0.88 0.85 0.84
0.80 0.80
0.73 0.72
0.70 0.68
0.64 0.60
0.54 0.53 0.52
0.45 0.36
PsychiatryPhysical Medicine & Rehabilitation
OrthopedicsRadiation Oncology
PediatricsCardiac Surgery
NeurologyNeurosurgery
AnesthesiologyObstetrics & Gynecology
General SurgeryVascular Surgery
UrologyEmergency Medicine
OtolaryngologyOpthamologyDermatology
Plastic Surgery
44
The Canadian Resident Matching Service
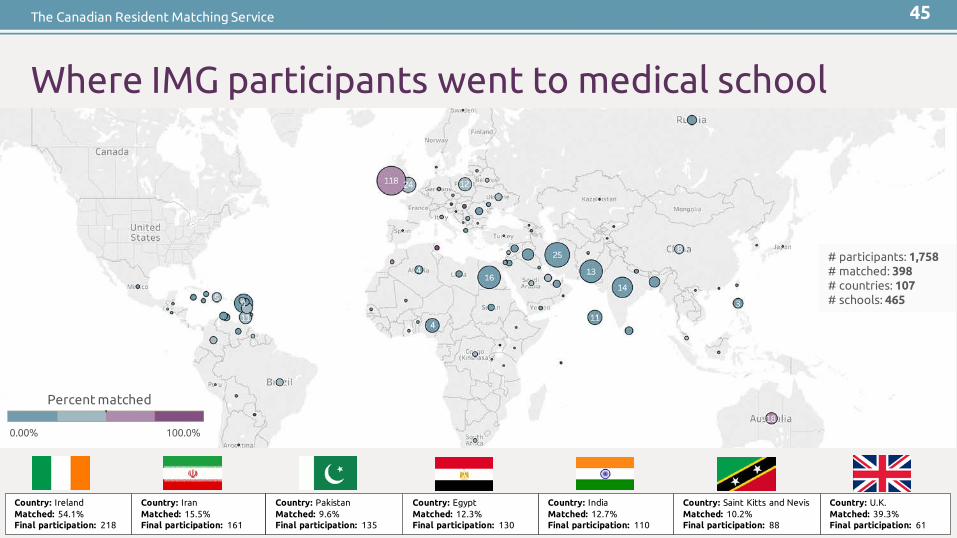
Where IMG participants went to medical school
# participants: 1,758# matched: 398# countries: 107# schools: 465
Country: IndiaMatched: 12.7%Final participation: 110
Country: Saint Kitts and NevisMatched: 10.2%Final participation: 88
Country: IrelandMatched: 54.1%Final participation: 218
Country: EgyptMatched: 12.3%Final participation: 130
Country: IranMatched: 15.5%Final participation: 161
Country: U.K.Matched: 39.3%Final participation: 61
Country: PakistanMatched: 9.6%Final participation: 135
0.00% 100.0%
Percent matched
45
The Canadian Resident Matching Service
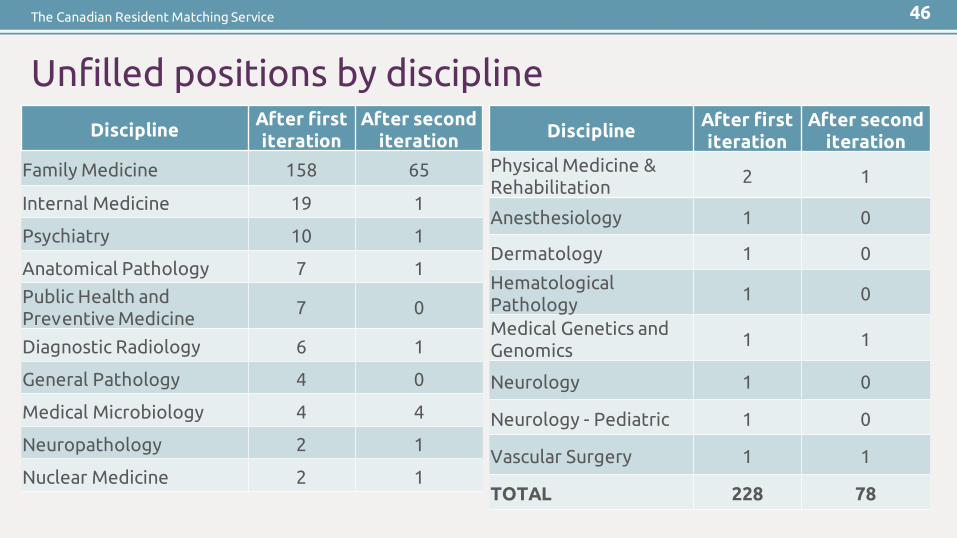
Unfilled positions by disciplineDiscipline
After first iteration
After second iteration
Family Medicine 158 65
Internal Medicine 19 1
Psychiatry 10 1
Anatomical Pathology 7 1
Public Health and Preventive Medicine
7 0
Diagnostic Radiology 6 1
General Pathology 4 0
Medical Microbiology 4 4
Neuropathology 2 1
Nuclear Medicine 2 1
DisciplineAfter first iteration
After second iteration
Physical Medicine & Rehabilitation
2 1
Anesthesiology 1 0
Dermatology 1 0
Hematological Pathology
1 0
Medical Genetics and Genomics
1 1
Neurology 1 0
Neurology - Pediatric 1 0
Vascular Surgery 1 1
TOTAL 228 78
46
The Canadian Resident Matching Service
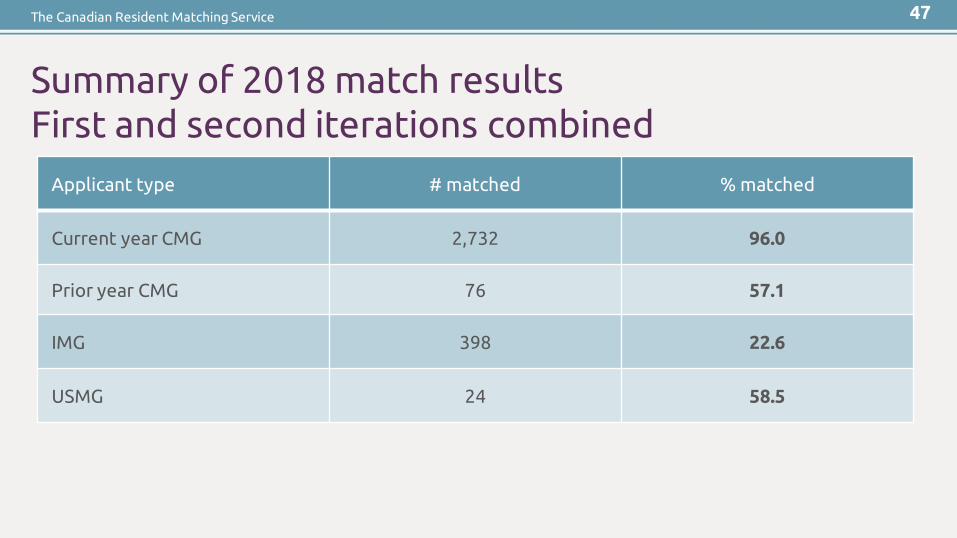
Summary of 2018 match resultsFirst and second iterations combined
Applicant type # matched % matched
Current year CMG 2,732 96.0
Prior year CMG 76 57.1
IMG 398 22.6
USMG 24 58.5
47

The Canadian Resident Matching Service
Match results by school of graduation, first iteration
School of graduationMatched Unmatched Final participation
2018 Graduates
Prior year graduates
Total2018
GraduatesPrior year graduates
Total2018
GraduatesPrior year graduates
Total
Memorial University of Newfoundland
74 2 76 3 1 4 77 3 80
Dalhousie University 101 2 103 5 0 5 106 2 108Université Laval 193 4 197 6 0 6 199 4 203Université de Sherbrooke 180 6 186 15 4 19 195 10 205Université de Montréal 271 9 280 23 2 25 294 11 305McGill University 158 6 164 21 4 25 179 10 189University of Ottawa 161 0 161 9 0 9 170 0 170Queen's University 93 2 95 4 0 4 97 2 99Northern Ontario School of Medicine
65 1 66 3 0 3 68 1 69
University of Toronto 247 0 247 28 2 30 275 2 277McMaster University 199 10 209 12 3 15 211 13 224Western University 160 1 161 18 1 19 178 2 180University of Manitoba 100 0 100 7 1 8 107 1 108University of Saskatchewan 92 1 93 5 1 6 97 2 99University of Alberta 146 0 146 9 0 9 155 0 155University of Calgary 143 1 144 12 0 12 155 1 156University of BritishColumbia
266 7 273 18 5 23 284 12 296
TOTAL 2,649 52 2,701 198 24 222 2,847 76 2,923
48
The Canadian Resident Matching Service
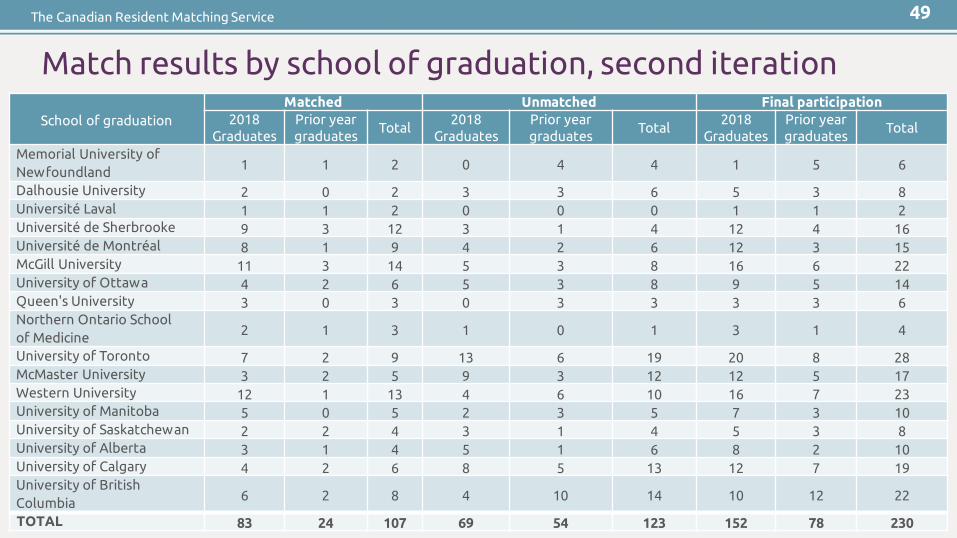
Match results by school of graduation, second iteration
School of graduationMatched Unmatched Final participation
2018 Graduates
Prior year graduates
Total2018
GraduatesPrior year graduates
Total2018
GraduatesPrior year graduates
Total
Memorial University of Newfoundland 1 1 2 0 4 4 1 5 6
Dalhousie University 2 0 2 3 3 6 5 3 8Université Laval 1 1 2 0 0 0 1 1 2Université de Sherbrooke 9 3 12 3 1 4 12 4 16Université de Montréal 8 1 9 4 2 6 12 3 15McGill University 11 3 14 5 3 8 16 6 22University of Ottawa 4 2 6 5 3 8 9 5 14Queen's University 3 0 3 0 3 3 3 3 6Northern Ontario School of Medicine 2 1 3 1 0 1 3 1 4
University of Toronto 7 2 9 13 6 19 20 8 28McMaster University 3 2 5 9 3 12 12 5 17Western University 12 1 13 4 6 10 16 7 23University of Manitoba 5 0 5 2 3 5 7 3 10University of Saskatchewan 2 2 4 3 1 4 5 3 8University of Alberta 3 1 4 5 1 6 8 2 10University of Calgary 4 2 6 8 5 13 12 7 19University of BritishColumbia 6 2 8 4 10 14 10 12 22
TOTAL 83 24 107 69 54 123 152 78 230
49

The Canadian Resident Matching Service
Positions by school of residency
School of residencyFirst iteration Second iteration
Positions available
Positions filled
Positions unfilled
Positions filled
Positions unfilled
Memorial University of Newfoundland 78 71 7 7 0Dalhousie University 132 120 12 12 0Université Laval 230 182 48 15 33Université de Sherbrooke 200 171 29 12 17Université de Montréal 296 274 22 6 16McGill University 191 180 11 8 3University of Ottawa 197 187 10 8 2Queen's University 128 128 0 0 0Northern Ontario School of Medicine 60 55 5 5 0University of Toronto 407 407 0 0 0McMaster University 216 210 6 6 0Western University 182 168 14 14 0University of Manitoba 138 123 15 15 0University of Saskatchewan 118 100 18 18 0University of Alberta 195 188 7 6 1University of Calgary 194 175 19 17 2University of British Columbia 346 341 5 1 4TOTAL 3,308 3,080 228 150 78
50
The Canadian Resident Matching Service
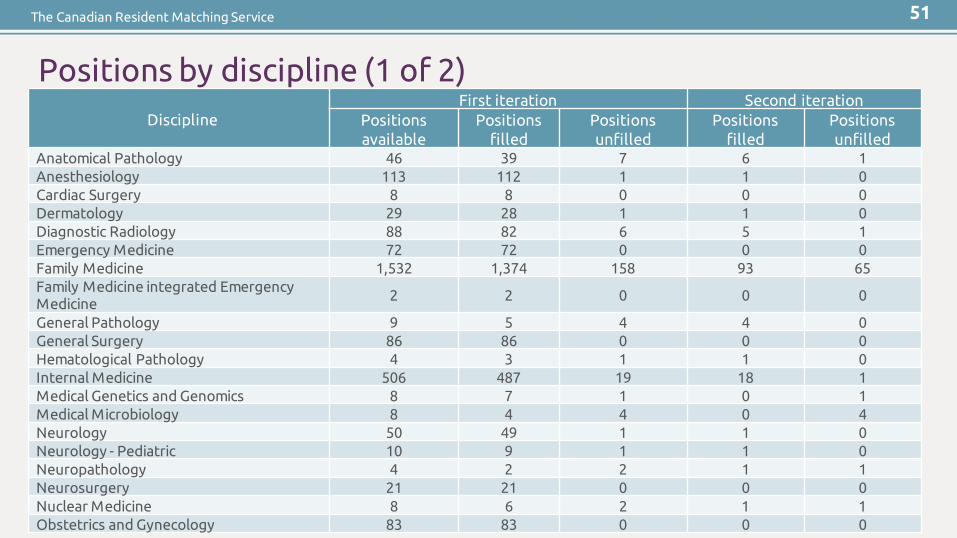
Positions by discipline (1 of 2)
51
DisciplineFirst iteration Second iteration
Positions available
Positions filled
Positions unfilled
Positions filled
Positions unfilled
Anatomical Pathology 46 39 7 6 1Anesthesiology 113 112 1 1 0Cardiac Surgery 8 8 0 0 0Dermatology 29 28 1 1 0Diagnostic Radiology 88 82 6 5 1Emergency Medicine 72 72 0 0 0Family Medicine 1,532 1,374 158 93 65Family Medicine integrated Emergency Medicine 2 2 0 0 0
General Pathology 9 5 4 4 0General Surgery 86 86 0 0 0Hematological Pathology 4 3 1 1 0Internal Medicine 506 487 19 18 1Medical Genetics and Genomics 8 7 1 0 1Medical Microbiology 8 4 4 0 4Neurology 50 49 1 1 0Neurology - Pediatric 10 9 1 1 0Neuropathology 4 2 2 1 1Neurosurgery 21 21 0 0 0Nuclear Medicine 8 6 2 1 1Obstetrics and Gynecology 83 83 0 0 0
The Canadian Resident Matching Service
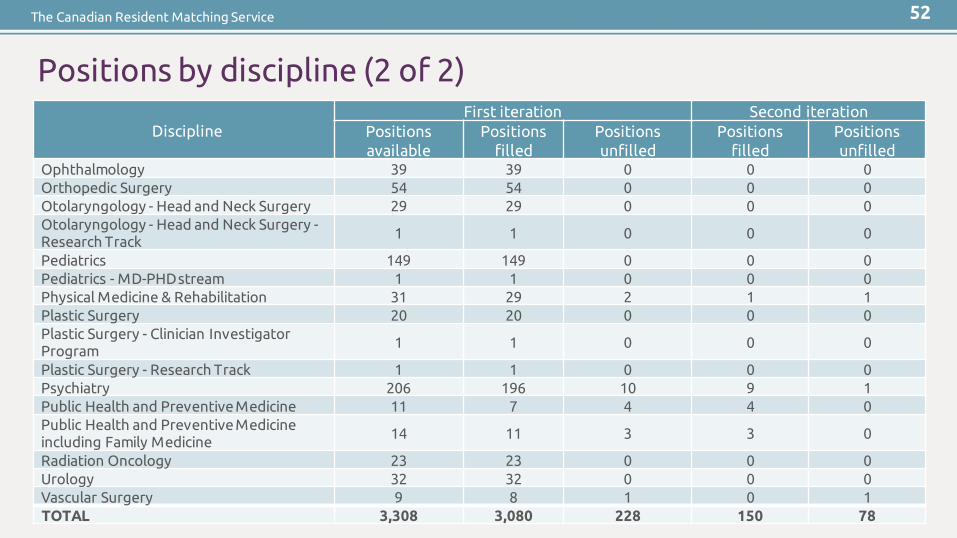
Positions by discipline (2 of 2)
DisciplineFirst iteration Second iteration
Positions available
Positions filled
Positions unfilled
Positions filled
Positions unfilled
Ophthalmology 39 39 0 0 0Orthopedic Surgery 54 54 0 0 0Otolaryngology - Head and Neck Surgery 29 29 0 0 0Otolaryngology - Head and Neck Surgery -Research Track 1 1 0 0 0
Pediatrics 149 149 0 0 0Pediatrics - MD-PHD stream 1 1 0 0 0Physical Medicine & Rehabilitation 31 29 2 1 1Plastic Surgery 20 20 0 0 0Plastic Surgery - Clinician Investigator Program 1 1 0 0 0
Plastic Surgery - Research Track 1 1 0 0 0Psychiatry 206 196 10 9 1Public Health and Preventive Medicine 11 7 4 4 0Public Health and Preventive Medicine including Family Medicine 14 11 3 3 0
Radiation Oncology 23 23 0 0 0Urology 32 32 0 0 0Vascular Surgery 9 8 1 0 1TOTAL 3,308 3,080 228 150 78
52

Thank you