Carmen de Andacollo - Mining News€¦ · • Implement Performance Management for Supervisors and...
35
Carmen de Andacollo April 2012
Transcript of Carmen de Andacollo - Mining News€¦ · • Implement Performance Management for Supervisors and...

Carmen de AndacolloApril 2012

Forward Looking Information
2
Both these slides and the accompanying oral presentation contain certain forward-looking statements within the meaning of the United States Private Securities Litigation Reform Act of 1995 and forward-looking information within the meaning of the Securities Act (Ontario) and comparable legislation in other provinces.
Forward-looking statements can be identified by the use of words such as “plans”, “expects” or “does not expect”, “is expected”, “budget”, “scheduled”, “estimates”, “forecasts”, “intends”, “anticipates” or “does not anticipate”, or “believes”, or variation of such words and phrases or state that certain actions, events or results “may”, “could”, “should”, “would”, “might” or “will” be taken, occur or be achieved. Forward-looking statements involve known and unknown risks, uncertainties and other factors which may cause the actual results, performance or achievements of Teck to be materially different from any future results, performance or achievements expressed or implied by the forward-looking statements. Forward-looking statements included in this presentation, include, but are not limited to, statements regarding actions taken to enhance throughput.
These forward-looking statements involve numerous assumptions, risks and uncertainties and actual results may vary materially. Events or circumstances could cause actual results to differ materially. Factors that may cause actual results to vary include, but are not limited to, unanticipated operational difficulties (including failure of plant, equipment or processes to operate in accordance with specifications or expectations). Certain of these risks are described in more detail in Teck’s annual information form available at www.sedar.com and in public filings with the SEC. Teck does not assume the obligation to revise or update these forward-looking statements after the date of this document or to revise them to reflect the occurrence of future unanticipated events, except as may be required under applicable securities laws

Asset Overview: Asset Description
3

4
Safety

Andacollo Safety Performance
1619 20
16 1614
16
11 11 1210 10 9
6
10
14
18
22
Mar‐11 Apr‐11 May‐11 Jun‐11 Jul‐11 Aug‐11 Sep‐11 Oct‐11 Nov‐11 Dec‐11 Jan‐12 Feb‐12 Mar‐12
SEVERITYPERIODOS MOVILES 12 MESES
1.13 1.15 1.17
1.02 1.070.97 0.96
0.87
0.65
0.79 0.74 0.73 0.69
0.55
0.65
0.75
0.85
0.95
1.05
1.15
Mar‐11 Apr‐11 May‐11 Jun‐11 Jul‐11 Aug‐11 Sep‐11 Oct‐11 Nov‐11 Dec‐11 Jan‐12 Feb‐12 Mar‐12
TRIF ‐ INDICADOR INCIDENTES REPORTABLESPERIODOS MOVILES 12 MESES
5

Andacollo Mine Site
6

7
Site Arial Overview
Plant SX‐EW
Tailing Deposit
Plant Concentred
AndacolloC.M. Dayton
RoadToro
PrimaryCrusher
Open PitMine
Admin

8
Asset Overview

Mining
• Mining Equipment Summary(34 - 30 Mton/ year Mine Movement)
• Shovel O&K ( 2 RH200 – 1 RH40)
• Loaders (1 CAT 994F - 1 CAT 992G)
• Trucks ( 4 CAT 777D – 9 CAT 789C)
• Drilling (2 DM 45- 1 ROC L8)
• Mining Services: 7 CAT Units
• Water Trucks: 4 Mack – 1 Mercedes Benz
9
Leaching Operation Facilities
10
Processing Plant Summary
3 Crusher Stages
1 Agglomeration Drum
2,500 m of conveyor belts
1 Grass Hopper Stacking System
Static Leach Pads Area
ROM Leach
1 SX Plant with a capacity of 1,300 m3/hr (PLS)
EW stage with 56 cells, producing 27 tons/day of Cu cathodes

Mill Flowsheet
11

12
Mill Equipment
Treatment : 55.000 tpd or 20.000.000 tpy Production : 80.000 tpy avg. of fine copper over first 10 years
: 1.0 million ounces gold Primary crusher : 60” x 89” - 800 hp SAG mill : ø36’ x 17’ EGL - 18,000 hp (wrap around) Pebble crushers : 2 – 800 hp Ball mills : 2 – ø25’ x 39’ EGL - 19,000 hp Flotation cells : 9 – 200 m3
: 6 – 100 m3, 5 – 40 m3
: 5 – 20 m3, 5 – 10 m3
Regrind mill : Tower mill – 1,500 hp Thickeners : 1 – ø 20 m (concentrate)
1 – ø 70 m (tailings)

Mill Performance
13
‐ 5
10 15 20 25 30 35 40 45 50 55 60 65 70 75
SAG M
ill [kTpd
]
CDA Daily Mill Tonnage – ktpd
Tonnes milled CDA Budget 2010 ‐ 2011 Forecast 1B 2011
• Design nameplate throughput – 55,000 tpd• First feed of ore – Feb 2010• Ramp-up to October 2010 – commercial production declared• Ore hardness limits throughput – November to present• Current reliable average throughput – 45,000 tpd

Quarterly Mill Throughput
14
5
10
15
20
25
30
35
40
45
50
55
Q1 2010 Q2 2010 Q3 2010 Q4 2010 Q1 2011 Q2 2011 Q3 2011 Q4 2011
Thou
sand
s
Mill Start
Hard Ore
Grinding Circuit Improvement Plan
MTPD

Actions implemented to improve throughput performance
• Blasting design to reduce feed size to SAG mill – in cooperation with Orica. Done.
• Increased SAG mill discharge openings to evacuate pebbles to pebble crushing circuit. Doneo Opened to 75mm in Sept 2010o Opened to 85mm in Feb 2011
• Pre-crushing of ore using supergene crusher to reduce feed size to SAG mill. Doneo Commenced December 2010o Average 10,000 tpd
15

Further short term actions to enhance throughput - 2011
16
• Install jaw-crusher to increase pre-crush tonnage (~2000 tpd). Done
• Install permanent 2-stage crushing to increase pre-crush tonnage (up to 20,000 tpd). In Progress.
• Increase power to SAG mill by upgrading cooling system (up to 10%). Done
• Expand plant with SAG mill #2 and associated plant additions – study proposal on going. In Progress

Crushing Plant 20 ktpdGeneral Flowsheet
Jaws
• Crushing and Screening Plant• Capacity 1,250 MTPD• Production 20,000 MTPD• Product 100% below 11/2” • 80% under 1”• Equipment Brand : TRIO
Feeder
Belt
2 Cones
2 Screen decks
Grizzly
CV‐01
CV‐05
CV‐03
CV‐04
CV‐04
CV‐01 (HYP.)
17

Construction 20 ktpd PlantMarch 2012
JAWSGRIZZLY
CV‐01
MAGNET
CV‐02
2 SCREEN DESKS
2 CONES
CV‐03CV‐04
CV‐05
CV‐06
ELECTRIC ROOM
CV‐01 (Hipogeno)
18

Concentrate Production by Month
19
0
10
20
30
40
50
60
70
80
1T 2010 2T 2010 3T 2010 4T 2010 1T 2011 2T 2011 3T 2011 4T 2011
kTon
Concentrate Production
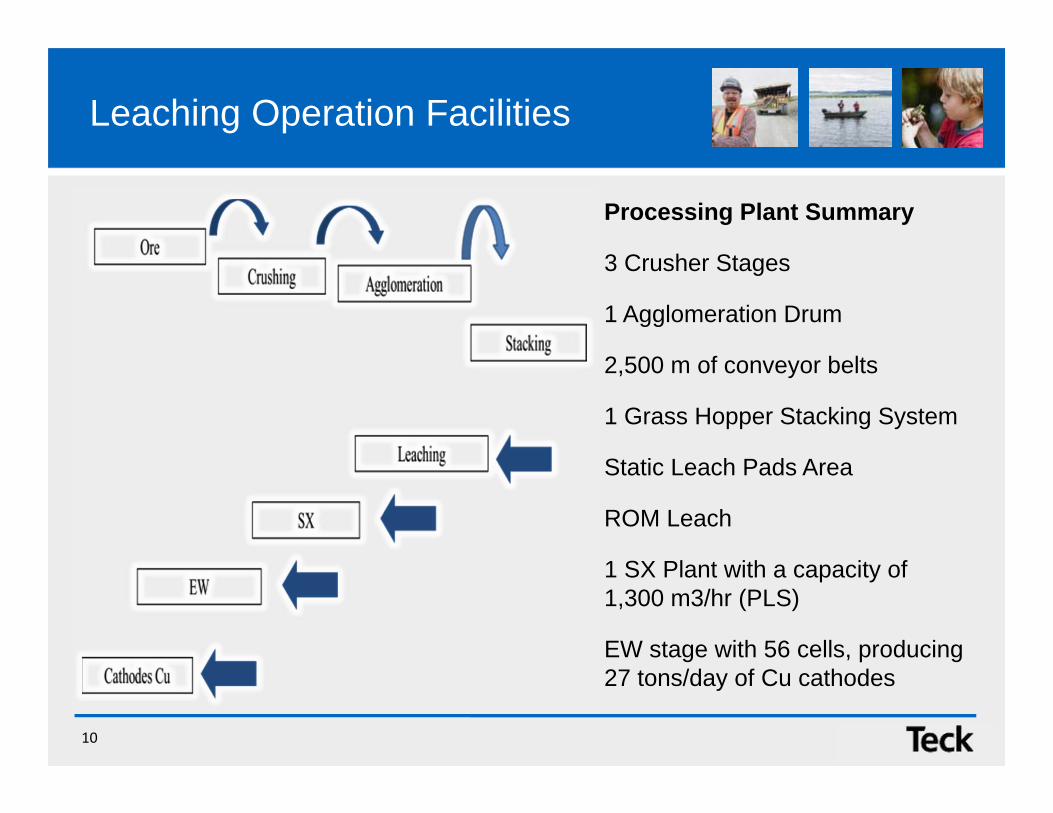
Income Statement
2010 2011
Revenues - Cathodes 83,2 54,1Revenues - Concentrate 140,3 563,0
Cost of Cu & Indirect (115,9) (328,4)EBITDA 107,6 288,7
Other incomes 3,4 27,7D&A, Other Expenses & Tax (41,1) (117,1)NET EARNINGS 69,9 199,3
YTD
(millions, US$)
20

CAPEX (US$ Million)
21
Concentrator Plant Investment+ I. I. 2010 2011Hypogene Project 422,2 Additions - Improvements Hyp. Project 16,7 5,6 Stock Pile Dome 8,2 0,0 Elqui River Water Line 24,6 21,0 Pre Crushing 20 ktpd Plant - 9,7 Total 422,2 49,5 36,4 Sustainability Projects 2010 2011Mine 2,6 4,2 Planning & Development - 10,0 Cathodes Plant 0,9 0,0 Concentrator Plant 8,2 10,4 Administration 0,9 2,1 Total 12,7 26,6 Other Projects 2010 2011CDA Expansion - Feasibility Study - 3,4 Other Projects - -Total - 3,4 TOTAL CAPEX & PROJECTS 422,2 62,2 66,3

MINERAL RESERVES ‐ Superge‐ Leacheable (END YEAR 2011)ReserveCategories t (000's) %Tcu %Scu t (000's) %Tcu %Scu t (000's) %Tcu %Scu
Proven 4,091 0.52 0.43 2,046 0.18 0.14 6,136 0.41 0.33 Provable 1,110 0.50 0.39 1,110 0.50 0.39
.TOTAL 5,201 0.52 0.42 2,046 0.18 0.14 7,247 0.42 0.34
HEAP LEACH OTHER (OLD HEAP LEACH) TOTAL
Reserves Supergene
22

Reserves & Resources Hypogene
MINERAL RESERVES ‐ Mill & Concentrator (END YEAR 2011)ReserveCategories t (000's) %Tcu Au gr/t t (000's) %Tcu Au gr/t t (000's) %Tcu Au gr/t
Proven 162,421 0.38 0.13 162,421 0.38 0.13 Provable 314,188 0.34 0.11 314,188 0.34 0.11
TOTAL 476,610 0.35 0.12 476,610 0.35 0.12
HYPOGENE SUPERGENE TOTAL
23
MINERAL RESOURCES ‐ Mill & Concentrator (END YEAR 2011)ReserveCategories t (000's) %Tcu Au gr/t t (000's) %Tcu Au gr/t t (000's) %Tcu Au gr/t
Measured 3,779 0.50 0.13 6,865 0.41 0.07 10,644 0.44 0.09Indicated 59,172 0.27 0.10 3,050 0.32 0.05 62,222 0.27 0.10TOTAL 62,951 0.28 0.10 9,915 0.38 0.06 72,866 0.29 0.10
Inferred 26,682 0.29 0.10 6 0.25 0.03 26,869 0.29 0.10
TOTAL 89,633 0.29 0.10 9,921 0.38 0.06 99,555 0.30 0.10
HYPOGENE SUPERGENE TOTAL

24
Growth Alternatives: Hypogene Project – Andacollo
POTENTIAL SECTION 51705
Development drilling, currently not considered
Growth potential
Pit de Reserve MI
Optimized Pit unrestricted. Resources MII
25
Community Relations& Environment

Environment
• Dust control to minimize the impact to people, employees and community.
• Monitoring and control of flora and fauna in the area of impact.
• Monitoring and control of process water consumption.
26
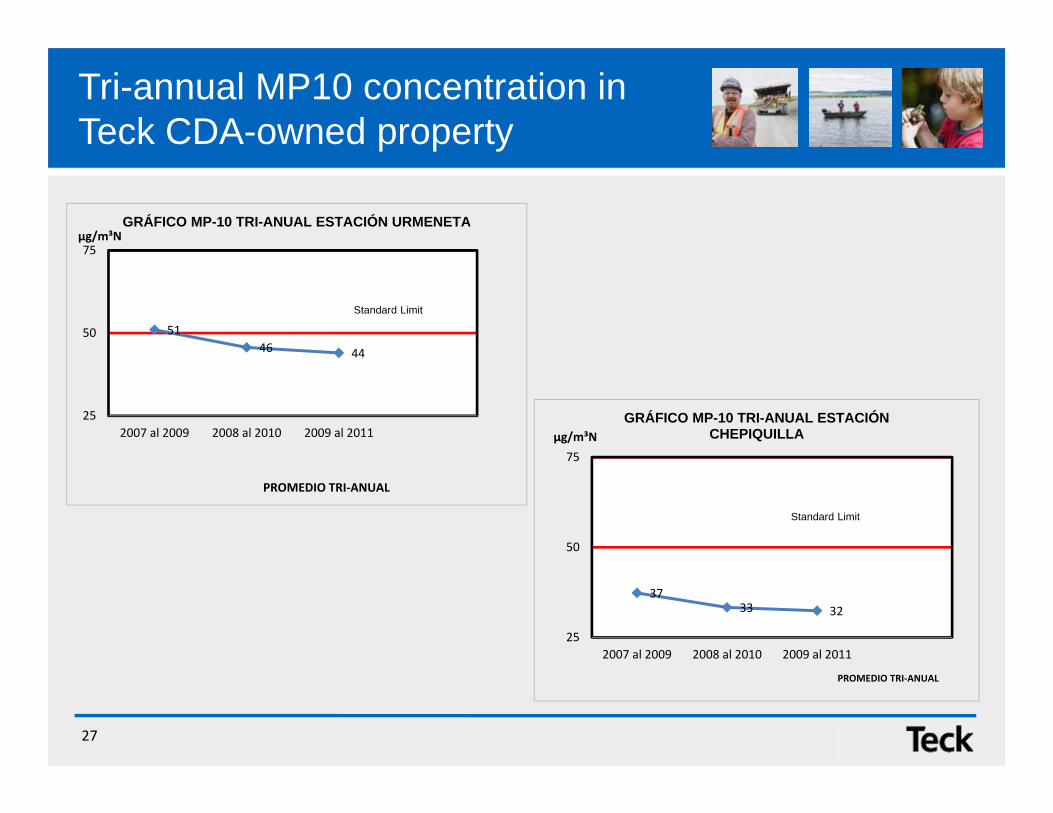
Tri-annual MP10 concentration in Teck CDA-owned property
5146 44
25
50
75
2007 al 2009 2008 al 2010 2009 al 2011
µg/m³N
PROMEDIO TRI‐ANUAL
GRÁFICO MP-10 TRI-ANUAL ESTACIÓN URMENETA
Standard Limit
3733 32
25
50
75
2007 al 2009 2008 al 2010 2009 al 2011
µg/m³N
PROMEDIO TRI‐ANUAL
GRÁFICO MP-10 TRI-ANUAL ESTACIÓN CHEPIQUILLA
Standard Limit
27

Community Development
• Participation in conjunction with the government in Drug & alcohol rehabilitation for employees & community.
• Encourage water conservation programs for farmers
• implement technical training programs in the community, focus on young people and woman.
• Different social development activities with the community with focus on sustainable business.
• formal and direct meetings with the various sub communities to improve communication
28
29
Human Resources

HR Management Indicators
30
HR Management Indicators Year 2011
N° Employees (Teck CDA) 787
N° Contractors 853
Rotation (%) 4,4
Training (%)Man-Hour N°
3,254.375
Absenteeism (%) 2,1
Age (Years) 36
Productivity (pound/Day/people) 280
Overtime (%) 1,7

People –Outstanding Activities 2012
• Implementation of Collective Contracts
• Supervisors Development Plan (Leadership Program)
• General Role Career Planning (Closing Gaps, Conversion, Certification)
• Implement Performance Management for Supervisors and General RoleSuccession Plan (Talent Management, Key Positions)
• Workforce Strategy (Technical and University Degree in Andacollo. FORCOM program, incorporating women, apprentice and trainee program
• HR Standardization Process (Legal Compliance)
• Infrastructure Projects (Dinning Room, Change house, Water Treatment Plant, Gym, Toilets)
31

32
Women in Chile’s Mining Industry
Minera Esperanza
Minera Gaby
Minera EscondidaCompañía XstrataAlto Norte
Lomas Bayas
División Salvador
División Ventanas
División AndinaDivisión El Teniente
Los Pelambres
El Tesoro
Michilla
Teck Carmen de Andacollo
Collahuasi
Anglo Amercian Chile
0%
5%
10%
15%
20%
25%
0 500 1,000 1,500 2,000 2,500 3,000 3,500 4,000 4,500 5,000
Porc
enta
je M
ujer
es
Dotación Propia
PARTICIPACIÓN DE LA MUJER EN FAENAS MINERAS ‐ CHILE(Promedio 7%)

33
Women in Teck CDA
0
5
10
15
20
25
30
35

34
Women Day in Teck CDA

Andacollo Historical Mining Town
35