University of Pennsylvania University of Pennsylvania Law ...

Theory DataAnalysis
Numerical Experiments
LabExperiments
FieldExercises
Real-WorldOperations
• First principles• Rigorous math• Algorithms• Proofs
• Correct statistics
• Only as good as underlying data
• Simulation• Synthetic,
clean data
• Stylized• Controlled• Clean,
real-world data
• Semi-Controlled
• Messy, real-world data
• Unpredictable• After action
reports in lieu of data
CarlsonComplex disaster phenomena

ONR MURI: NexGeNetSci
Wildfire Resource Allocations in Conditions Involving Multiple Threats
Jean CarlsonDepartment of Physics
University of California, Santa Barbara
First Year Review, August 27, 2009
With Nada Petrovic, Seth Peterson, Evan Sherwin, John Doyle

ONR MURI: NexGeNetSci
Network Issues in Natural Disasters and Disaster Response (just a few):
Physical Process: complex spatio-temporal dynamics of geophysical/ecological phenomena
Resource Allocations and Response: multiagency task forces
Coupling to technologies and infrastructure: communication, transportation, energy, economics

Parallels between Natural Disastersand National Security issues:
Parallels between Natural DisastersParallels between Natural Disastersand National Security issues:and National Security issues:
• Quantitative Analysis not used systematically for decision making
• High variability/uncertainty needs to be taken into account
• Fragilities associated with human and social factors
• Reactive spending outweighs proactive spending
• Cascading effects through government and social infrastructure
• Overall resource constraint (economic/military)
• How do we pass information most effectively to policy makers?
• Natural disasters: data more readily available, and models unclassified(David Alderson, John Doyle, Brian Steckler)

Economic Losses 1950-1999Economic Losses 1950Economic Losses 1950--19991999
In 2003, natural catastrophes resulted in more than 50,000 deaths and over US$ 60 B in economic losses
Source: Munich Re

Natural Disaster Costs 1950--2004Natural Disaster Costs 1950Natural Disaster Costs 1950----20042004

100
101
102
20th Century’s 100 largest disasters worldwide
US Power outages (10M of customers,1985-1997)
Natural ($100B)
Technological ($10B)
Slope = -1(α=1)
10-2
10-1
100

100
101
102
10-2
10-1
100
median
the worst
Is much worse than typical

? 100
101
102 US Power outages (10M of customers,
1985-1997)
10-2
10-1
100
Slope = -1(α=1)
A large event is not inconsistent with statistics.

Power Law Statistics for Natural Disasters
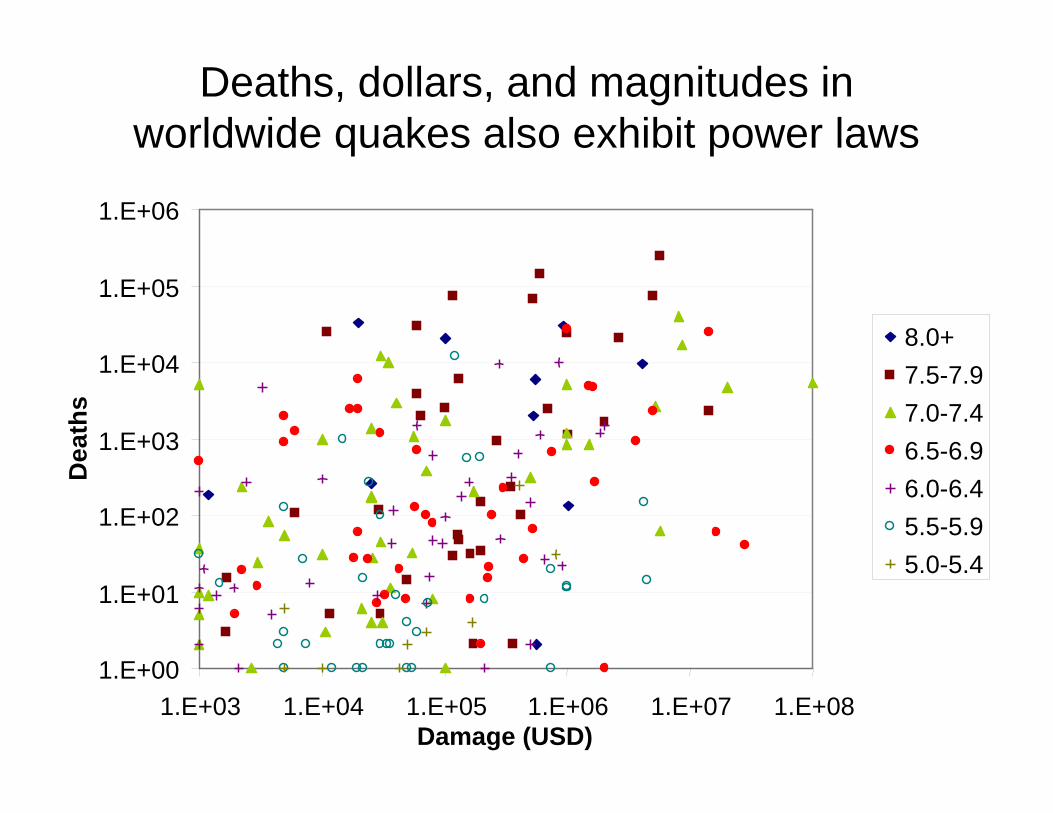
Deaths, dollars, and magnitudes in worldwide quakes also exhibit power laws
1.E+00
1.E+01
1.E+02
1.E+03
1.E+04
1.E+05
1.E+06
1.E+03 1.E+04 1.E+05 1.E+06 1.E+07 1.E+08Damage (USD)
Dea
ths
8.0+7.5-7.97.0-7.46.5-6.96.0-6.45.5-5.95.0-5.4

The worst 5 deaths, 8 damage, and 9 magnitude have none in common
1.E+02
1.E+03
1.E+04
1.E+05
1.E+06
1.E+05 1.E+06 1.E+07 1.E+08
Damage (USD)
Dea
ths
8.0+7.5-7.97.0-7.46.5-6.96.0-6.45.5-5.95.0-5.4
Large deaths
Large dollars
Large magnitude

Megacities: deaths (less developed countries), dollars (more developed), size (geophysical attributes)
Megacities: deaths (less developed countries), dollars Megacities: deaths (less developed countries), dollars (more developed), size (geophysical attributes)(more developed), size (geophysical attributes)
Munich Re

Tech Bio Eco Geo Social
RobustYet
FragileBehavior
Integrated comm,computation and
controls
Multi-scale and Multi-resolution
Modeling and analysis
Feedback And
Dynamics
Highly constrained, uncertain, large scale, networked systems
Tools from physics and engineering
Unifying Theme
Demands new, interdisciplinary approachto complex systems theory
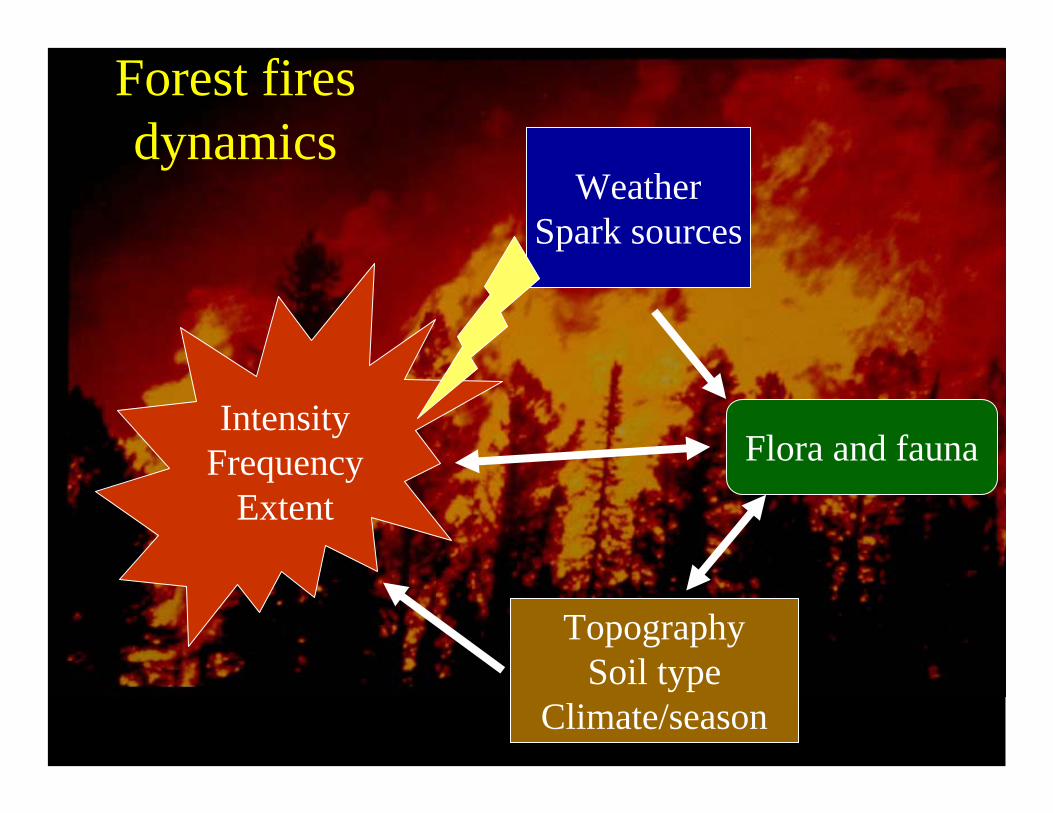
Forest fires dynamics
IntensityFrequency
Extent
WeatherSpark sources
Flora and fauna
TopographySoil type
Climate/season

Social Impact:2003 California Wildfires

Simultaneous Fires: 2003 and 2007 California Fire Siege
Current US Forest Service and CalFire Policy: Protect lives and structures, with interagency protocols for resource allocation at local, state, and federal levels, and constraints acting over a wide range of spatial and temporal scales.

Developed Country Wildfire Risk Management
• Australian fires: recent fires are causing the government to rethink current policy– “stay and defend or leave early”
• February 7th 2009 fires:– Record heat wave, drought, changing
wind directions– 2000 homes lost– Million acres– 173 fatalities
• Were people able to enact policy?• Did staying make sense?
– 113 people died in homes
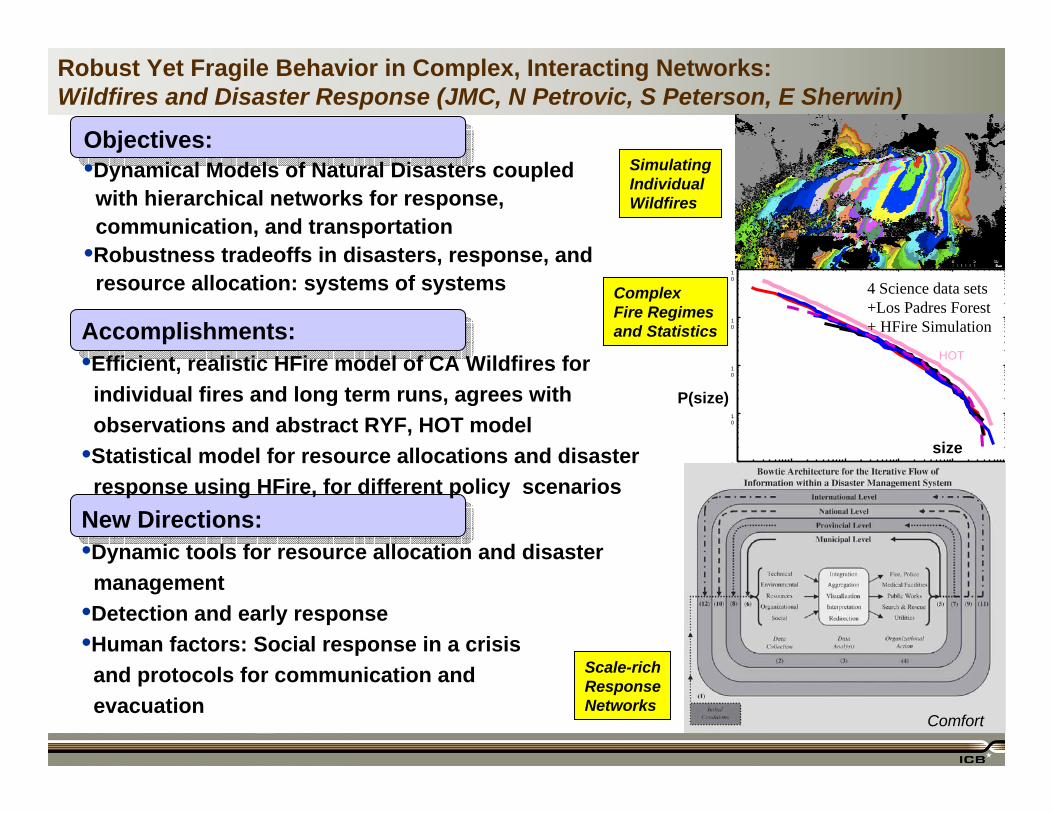
Robust Yet Fragile Behavior in Complex, Interacting Networks: Wildfires and Disaster Response (JMC, N Petrovic, S Peterson, E Sherwin)
Objectives:•Dynamical Models of Natural Disasters coupled
with hierarchical networks for response, communication, and transportation
•Robustness tradeoffs in disasters, response, and resource allocation: systems of systems
Accomplishments:•Efficient, realistic HFire model of CA Wildfires for
individual fires and long term runs, agrees with observations and abstract RYF, HOT model
•Statistical model for resource allocations and disaster response using HFire, for different policy scenarios
New Directions:•Dynamic tools for resource allocation and disaster
management•Detection and early response•Human factors: Social response in a crisis
and protocols for communication and evacuation
10
10
10
10
10
10
10
10
10
10
4 Science data sets +Los Padres Forest+ HFire Simulation
HOT
SimulatingIndividualWildfires
ComplexFire Regimesand Statistics
P(size)
size
Scale-richResponseNetworks
Comfort

Motivation: Models exist for fire spread and risk assessment. How can this information be combined to facilitate policy and real time resource allocation?

Losses vs. Sizes

Fire Model
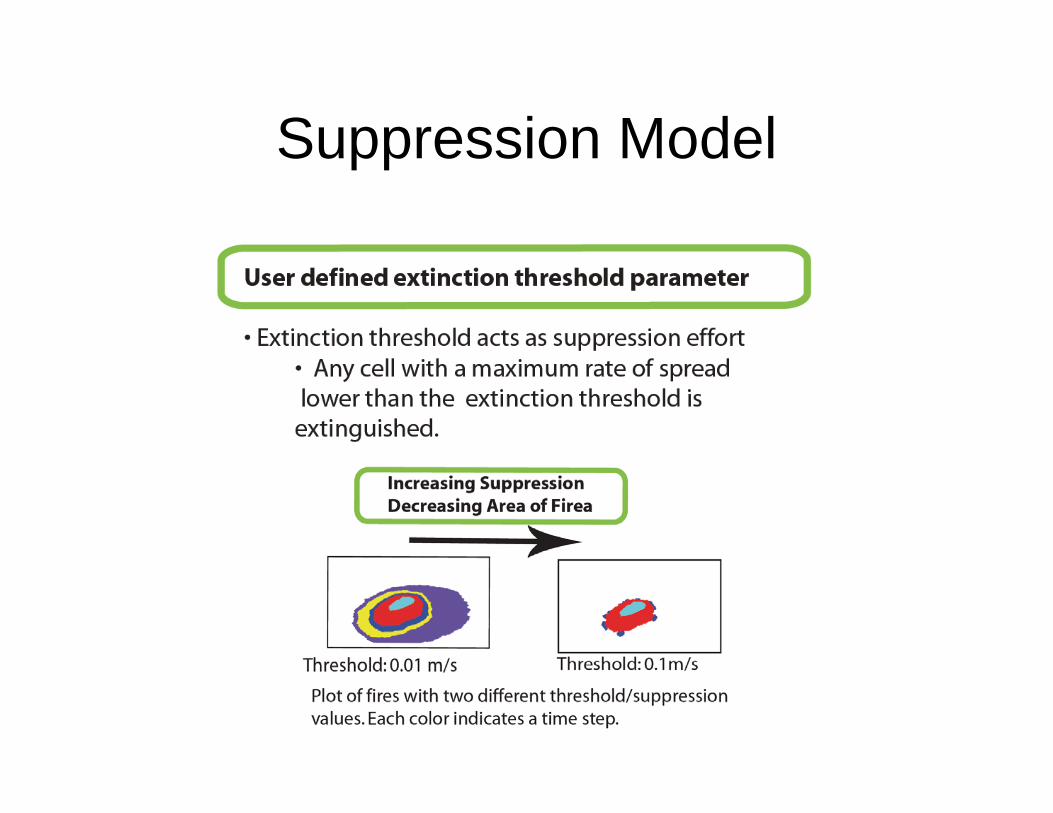
Suppression Model

Catalog of suppression vs. size
• Hfire generates statistics for 1000 years• Average effect of suppression on fires of different sizes• Choose fires by rank and determine their sizes for each of four suppression regimes.

Cost Function

Single Fire

Simultaneous Fires
• Consider 10 fires with limited amount of total available resources (Rtotal)
• Compare cost minimization to 3 other strategies:1) minimize total cost (Best)2) maximize total cost (Worst)3) random allocation4) minimize total area
• Run for 100 sets of 10 and look at how resources are allocated to different fires (histograms with Rtotal=20) and asset costs for varying Rtotal (plots)
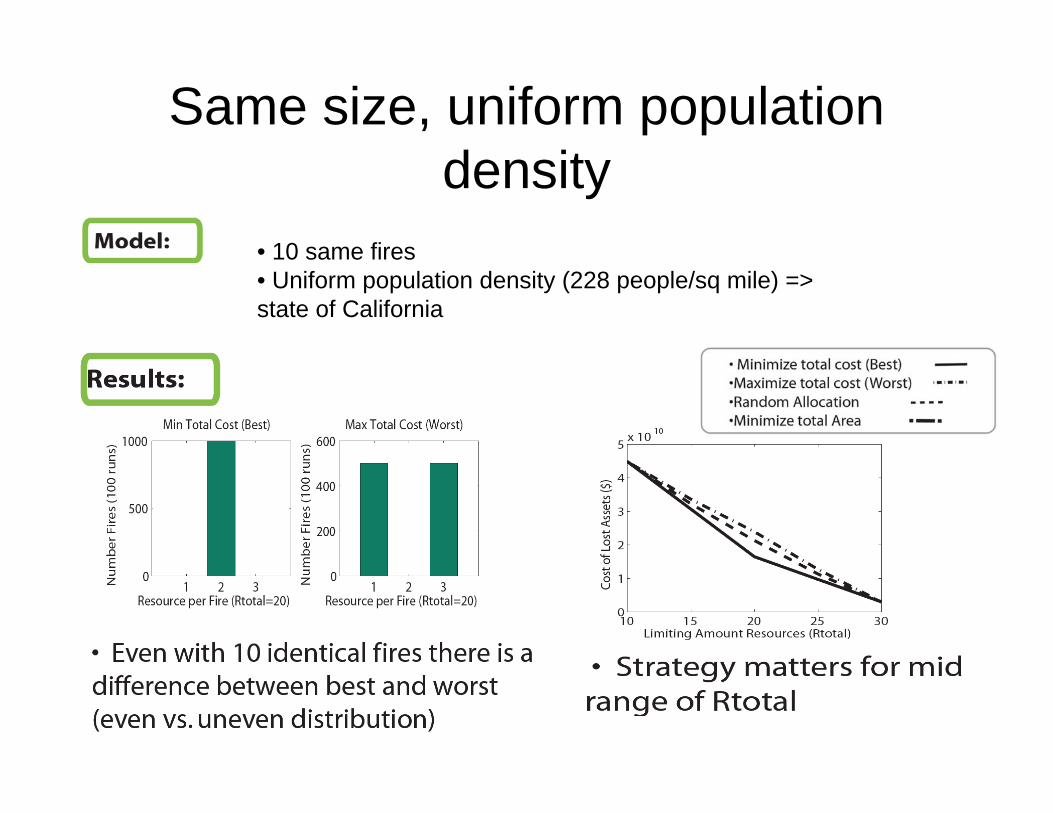
Same size, uniform population density
• 10 same fires • Uniform population density (228 people/sq mile) => state of California

Varying Sizes, Uniform Population Density

Varying Sizes, Varying Population Density
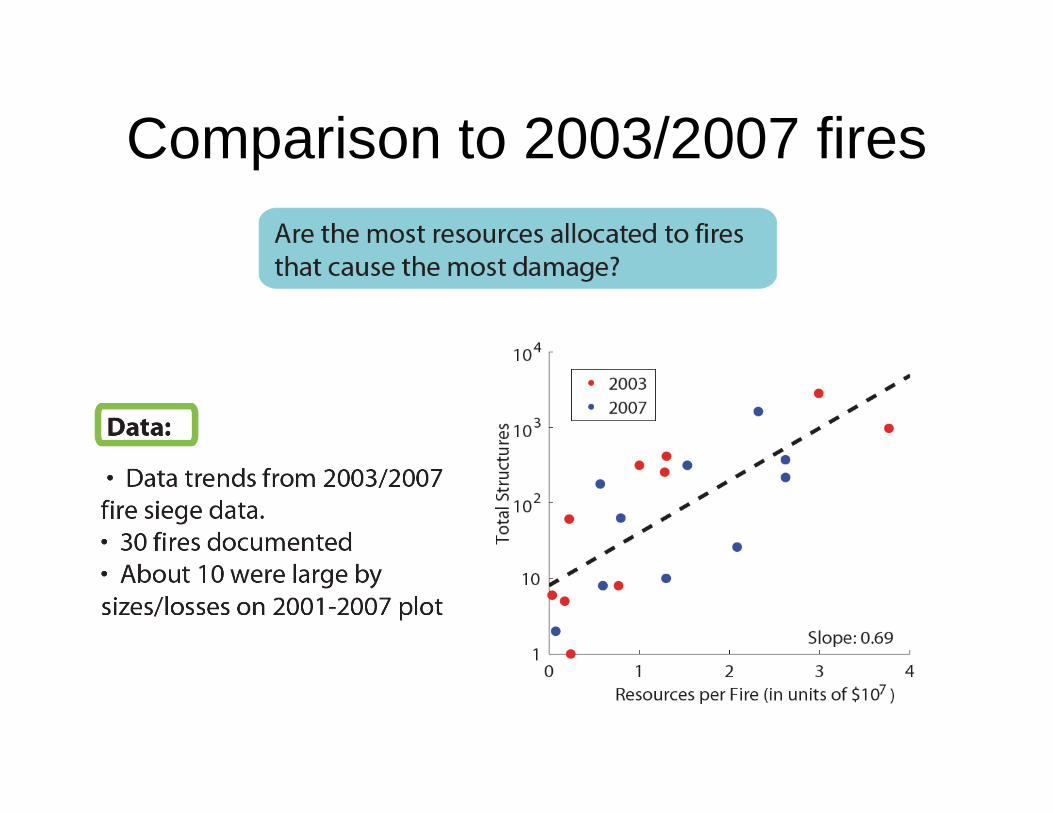
Comparison to 2003/2007 fires

Comparison to 2003/2007 fires

Conclusions: Stage One

•Dynamic tools for resource allocation and disaster management: identifymultiscale network fragilities
•Optimization and limitations: Detection and early response
•Human factors: Social responsein a crisis and communication protocols for civilian evacuation and multiagency response
New Directions:
Fire

Fire is not the only problem!

The Earthquake Problem:• Elastic half spaces separated by a weak interface (fault)
• Loaded by shear (plate tectonics, mantle convection)
• Friction/Fracture failure of theinterface
• Slip propagates, radiates energy

Kinematic simulation of ground motion in a magnitude7.5 event on the San Andreas: physical phenomena exhibits structured complexity

Length
Time
Grains
Friction
FaultsNetworks
HazardsMultiscale Earthquakes Problem:

Time & Space
Grains
Networks
Friction
Faults
“Vertical:”connect different scales
“Horizontal:” each level is a complex, often heterogeneous, dynamical system, with rich behavior, and many unknowns
Hazards

Great Southern California Shakeout
• Comprehensive science-based earthquake scenario and drill (Nov 13 2008)
– Magnitude 7.8 earthquake along San Andreas fault
• Earthquake every 150 years=>last one was 300 years ago
• Constructed an earthquake using earthquake science and previous data
• Estimated damage to structures and loss of life– 2,000 deaths, 50,000 injuries, $200 billion in
damage• 5.5 million people participated through
schools, workplace, etc.

Length
Time
Geophysics/Hydrodynamics
Cascading Failures in Interconnected Networks:
Social Impact (homes, families)
Infrastructure (energy, readiness)
Global Economy &Natural Resources
Transportation/Communication

Time & Space
Physics
Transport
Cities
Infrastructure
“Vertical:”connect different scales
“Horizontal:” each level is a complex, often heterogeneous, dynamical system, with rich behavior, and many unknowns
Globe

Dealing Robustly with Uncertainty
in Hazard Analysis
•Horizontal Challenge:Identify the range of behaviorwhich is physically,technologically, and sociallyplausible
•Vertical Challenges:Uncertainty managementconnecting scales, and investmentof limited resources on multiple scales
Policy