CARING. EVERY - LCBO · indicators had improved, ... Through in-store merchandising, ... ture has...
100
CARING. / EVERY DAY. LCBO annual report 2009–10
Transcript of CARING. EVERY - LCBO · indicators had improved, ... Through in-store merchandising, ... ture has...
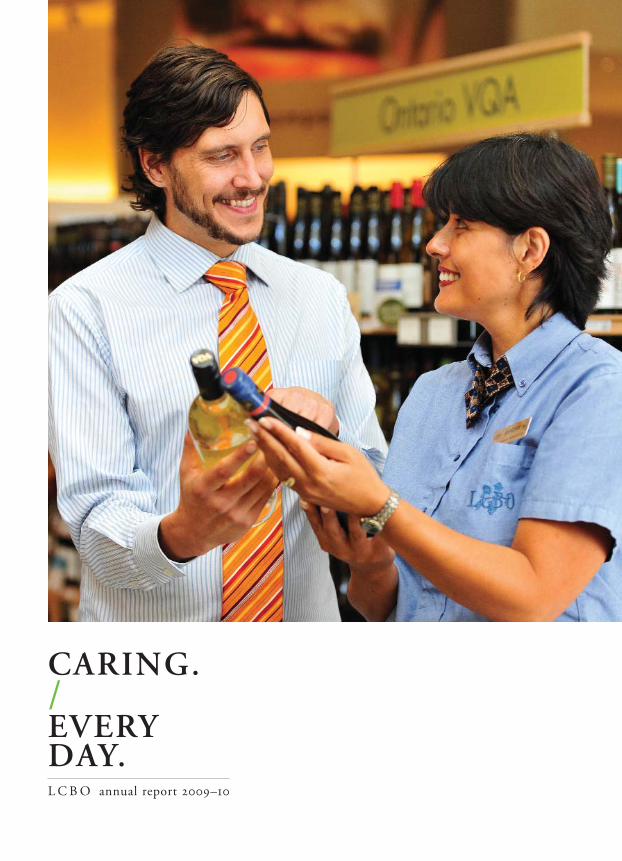
CARING./EVERY DAY.L C B O annual report 2009–10


2009–10 Achievements / LCBO Cares
$1.41 billion Transferred $1.41 billion, excluding alltaxes, to the government of Ontario – its 16th record dividend.
19% & 49% Ontario VQA table wine sales jumped 19 per cent; sales of Ontario craft beerswere up 49 per cent year-over-year.
2.6 million people More than 2.6 million people challengedfor reasons of age or intoxication, up 9.8 per cent from 2008–09. Service wasrefused to 155,000 people, 82 per centfor age.
83% LCBO customer satisfaction rose from 77 per cent in 2008–09 to 83 per cent in 2009–10.
$3.74 million Customers and employees raised $1.94 mil-lion for the United Way and $1.8 millionfor MADD Canada and four Ontario sickchildren’s hospitals.
7, 9 & 1 Opened seven new stores, replaced ninewith upgraded stores and had one majorexpansion to increase product selectionand better serve customers.
600 million The Ontario Deposit Return Program hada container recovery rate of 76.3 per cent,bringing the total number of glass containersdiverted from landfills since the programbegan in 2007 to more than 600 million.


LETTER OF TRANSMITTAL
The Honourable Dwight DuncanMinister of Finance
Dear Minister,
I have the honour to present you with the 2009–10 Annual Reportof the Liquor Control Board of Ontario.
Respectfully submitted,
PHILIP J . OLSSON
Chair
TABLE OF CONTENTS
Message from the Minister 3Message from the Chair 4
Message from the President & CEO 5Corporate Structure 7
Board Members 10Caring. / Community. 16
Caring. / Environment. 18Caring. / Customers. 20
Caring. / Quality. 22Caring. / Employees. 24Supporting. / Local. 26
Product Trends 28Management Discussion and Analysis of Operations 36International Financial Reporting Standards (IFRS) 52
Responsibility for Financial Reporting 59Auditor’s Report 60
Financial Statements 61Notes to Financial Statements 64
Financial Overview 74

annual report 2009–10 L C B O 3
MESSAGE FROM THE MINISTER
In 2009–10 Ontario’s economy began to emerge from the global recession. While many economicindicators had improved, there were some that remained below pre-recession levels.
Through our Open Ontario Plan, the McGuinty government is managing taxpayer dollarsresponsibly to ensure that we protect services in schools and hospitals, while reducing the deficit.
During these lean times, the government has brought in a number of measures to improveaccountability, find savings, and deliver better value for taxpayers. We also expect governmentbusiness enterprises, such as the LCBO, to continue to provide excellent service to customerswhile finding efficiencies to improve its financial performance. The LCBO helps the Governmentof Ontario fund education, healthcare, and the social services Ontarians value.
As a result of good expense and inventory management, and investments in upgrading itsretail network, the LCBO transferred $1.41 billion to the Government of Ontario this past fiscalyear. That was $10 million higher than 2008–09.
Daily, LCBO staff serve thousands of customers across Ontario in a responsible manner.The LCBO helps to promote responsible consumption through its annual social responsibilityadvertising campaign. The Deflate the Elephant campaign was launched in December 2009 toencourage Ontarians to speak up and help prevent friends, family members and guests fromdriving after drinking by providing solutions and responsible hosting tips. I commend theorganization for its contributions to making Ontario roads safer.
Through in-store merchandising, employee development programs and special events,the LCBO continued to support the award-winning products of Ontario’s vintners, distillers andbrewers. At every opportunity, staff encourage customers to “go local,” both for its economicand environmental benefits. For the past fiscal year, Ontario VQA table wine sales were up19 per cent and sales of Ontario craft beers were up 49 per cent year-over-year. Great newsfor local Ontario wines and beers creating jobs in our communities.
Promoting environmental sustainability is one of the LCBO’s corporate strategic objectives.This past year, the LCBO continued to include more green initiatives in its operations. The agencydiverted hundreds of millions of containers from landfills through the Ontario Deposit ReturnProgram (Bag it Back); reduced energy consumption in its stores, offices and warehouses; andencouraged its suppliers to source products in lightweight packages that have less of an impacton the environment.
Entering the third year of its current five-year plan, the LCBO is well-positioned to continueto serve Ontarians responsibly through the years ahead. I am confident that its continuous effortsto provide excellent customer service will safeguard its role as a significant contributor to theprovince’s schools, hospitals and investments in job creation and economic growth.
Sincerely,
THE HONOURABLE DWIGHT DUNCAN
Minister of Finance

annual report 2009–10L C B O4
MESSAGE FROM THE CHAIR
During my 30 plus years working in the financial industry, a good corporate governance struc-ture has always been a key consideration when I evaluate whether or not to invest in a company.Over the past three years, I’ve drawn on this experience often while serving as Chair of theLCBO. This Crown agency is a valuable public asset and the government and taxpayers rightlyexpect it to be well-governed and accountable. My fellow board members and I are helpingmake sure the LCBO management team is operating this agency in a customer-focused andsocially-responsible manner – capitalizing on the agency’s strengths, while safeguarding againstpotential risks.
LCBO posted a net income of $1.436 billion in 2009–10. This income is a result of goodexpense management, inventory control, effective marketing, and the return on investment gener-ated from new stores that opened and existing outlets that were upgraded during the fiscal year.
Our board continues to have open communication with the government. We share theLCBO’s five-year strategic and annual business plans, along with updates and changes to them.We also keep them informed of any significant issues as they emerge.
I’ve worked every year with the board and with the LCBO management team to increasethe organization’s support for Ontario’s manufacturers, including wine, spirits, and craft beer.
Continuous improvement of LCBO’s governance is another priority. One way we’ve donethis is by adding individuals to the board with varied expertise. This past year, Pamela Livingstonejoined the board. She brings extensive retail knowledge, based on her 14-year career with SearsCanada. Pamela currently works as a planning manager for Home Outfitters, a division of theHudson’s Bay Company. This retail background gives her experience in building and executingcomplex business plans; she adds another asset to an already capable board.
As a strong supporter of the work of the United Way, I was pleased to see LCBO onceagain set a new record for its corporate campaign in 2009. The $1.94 million raised epitomizeshow much our customers and employees care for those less fortunate in their communities.This fundraising accomplishment was thanks to customers giving generously at the checkoutand LCBO employees giving back through payroll deduction.
I look forward to continuing to help the LCBO on its successful evolution as a profitable,socially and environmentally-responsible retailer that strives to constantly improve the customershopping experience.
PHILIP J . OLSSON
Chair

annual report 2009–10 L C B O 5
MESSAGE FROM THE PRESIDENT & CEO
From Red Lake to Pelee Island, our staff take pride in serving customers well and responsibly;they also take pride in raising money for charities in the hundreds of communities acrossOntario where they work and live.
In this report, you will meet some of these employees. You will learn how they give backand how they bring our corporate value of responsible service to life.
This past year, generous LCBO customers gave charities millions of reasons to smile.From the record-breaking fundraising for the United Way ($1.94 million), MADD Canadaand the foundations of the four Ontario sick children’s hospitals ($1.8 million) to the $571,000raised for the Red Cross to help provide emergency relief and recovery following the devastatingearthquake in Haiti, the caring nature of our customers and staff was evident like neverbefore in 2009–10. While many customers cut back on their purchases, they didn’t cut backon their philanthropy.
In my letter last year, I predicted sales would be flat. Not surprisingly, they were. This wasmainly because customers chose value products over luxury. A positive trend saw customersincrease support for local producers, driving sales of VQA table wines, which were up 19 percent in 2009–10.
Overall, net sales for 2009–10 were $4.3 billion, 0.9 per cent higher than the previousyear. Net income was $1.436 billion, an increase of 1.8 per cent over the previous year; thiswas thanks largely to good expense management and the return on investment from new andrenovated stores. Care was also taken to monitor and adjust inventory levels to match sales,while maximizing store and warehouse productivity. We also adjusted our marketing to addresscustomers “shift to thrift”.
In the summer, LCBO reached a new collective agreement with its unionized staff. The daysleading up to this successful outcome saw customer traffic unlike any seen before, with one-daysales of $56 million. The real story is not about how much product was sold, but how LCBOemployees – both management and unionized – still served customers well under these difficultcircumstances and how quickly our stores were restocked.
As a responsible retailer, we work hard to create and maintain a safe work environment.In 2009–10, we made ergonomic improvements to our Durham warehouse and introducednew lift tables in many stores to make unloading products from pallets easier and safer. In thecoming year, we will continue to invest in and enhance our employee health and safety programs,aiming to become a best-in-class retailer in this field.

The LCBO also cares for the environment. As one of the largest retailers of alcohol in the world,we source products from more than 80 countries. The Ontario Deposit Return Program hasachieved an overall recovery rate of 76.3 per cent in its third year (ending February 4, 2010)surpassing the 75 per cent target. Ontarians have returned more than three quarters of a billionbeverage alcohol containers since the Bag it Back program began, including 600 million glasscontainers; this represents 287,000 metric tonnes. In the coming year, we are encouragingsuppliers to source more environmentally sustainable packaging options such as lightweightglass to further reduce our environmental footprint.
Looking ahead, even though the economy is growing, Ontario consumers remain cautiousin their discretionary spending, so we will have to continue to run a tight ship.
In 2010–11, LCBO will further enhance its store network across the province. We plan toadd an additional 95,000 square-feet of selling space through eight new stores, 10 relocations,one expansion, and 18 significant renovations and décor upgrades. These new and improvedoutlets will provide even better service to our customers. New stores also provide a solidreturn on investment; these additions to the store network are estimated to generate pro-ratedincremental sales of $25 million. We’re doing more to highlight VQA wines through our “Bestof Ontario” sections in new stores. This is a concept we’d like to expand to an additional 10to 12 stores over the next two years.
With our strategic plan as our guide, our staff are ready to meet both the challenges andthe opportunities that 2010–11 brings.
BOB PETER
President & CEO
MESSAGE FROM THE PRESIDENT & CEO
annual report 2009–10L C B O6

annual report 2009–10 L C B O 7
CORPORATE STRUCTURE
The LCBO is a Crown agency reporting to the Minister of Finance and is classified by theOntario government as an operational enterprise. Its mission statement is: “We are a sociallyresponsible, performance-driven, innovative and profitable retailer, engaging our customersin a discovery experience of the world of beverage alcohol.”
The LCBO is overseen by a board of directors consisting of up to 11 members appointedby the Lieutenant Governor-in-Council, on the recommendation of the Premier and theMinister of Finance, for terms of no more than five years1. The Chair of the board of directorsis responsible for providing strategic leadership to its members and to the President & CEOand making sure the LCBO and its board of directors meet their respective responsibilities.
The mandate of the board is to oversee the management of the business affairs of theLCBO. Among its most important responsibilities are to:• establish bylaws governing the operations of the LCBO• make sure that policies and processes are in place to maintain the integrity of the LCBO’s
internal controls• approve both the five-year strategic plan and annual business plans and monitor manage-
ment’s success in meeting the objectives set out in these plans• submit annual financial plans and business plans to the Minister of Finance• make sure the LCBO has an appropriate communications policy• make sure the LCBO operates in a fair, ethical and impartial manner and in accordance
with applicable laws• establish and oversee senior management succession planning• approve major policy and business decisions• assess and evaluate annually the performance of the President & CEO• establish committees of the board as appropriate to exercise some or all of the board’s
responsibilities; presently this includes: an Audit Committee and a Governance andCompensation Committee.
ETHICS AND BUSINESS CONDUCT
The board has adopted a code of conduct that includes policies addressing human rights, conflictof interest, confidentiality, the outside activities of employees and officers, gifts and entertainment.
1 According to the Liquor Control Act, “the members of the board shall be appointed to hold office for a term not exceedingfive years and reappointed for further succeeding terms not exceeding five years each.”

HEALTH AND SAFETY
The board approves an annual health and safety policy and the senior vice-president, HumanResources provides the board with regular health and safety reports.
BOARD COMMITTEES:
Audit CommitteeThe Audit Committee is responsible for the reliability and accuracy of the LCBO’s financialstatements and for overseeing the LCBO’s risk management function.
Governance and Compensation CommitteeThe Governance and Compensation Committee is responsible for recommending to the boardthe LCBO’s corporate governance policies and practices and making sure the LCBO adheresto sound corporate governance principles. It also makes recommendations concerning humanresources and compensation matters.
MANAGEMENT COMMITTEES:
Store Planning and Development CommitteeThis is a management committee that reviews real estate and leasing transactions and makesrecommendations to the board for final approval.
Listings Appeals CommitteeThis committee reviews supplier and agents appeals of business unit decisions concerningproduct listings.
Management Positions Evaluation CommitteeThis committee evaluates and rates management positions in the organization for purposesof determining appropriate pay classifications.
ACCOUNTABILITY
The LCBO is accountable to its stakeholders in a number of ways, including:• its annual report is required to be tabled in the provincial legislature and available to all
Ontarians in print or online at www.lcbo.com• annual audits of LCBO financial statements are required by the Liquor Control Act and
conducted by the Office of the Auditor General of Ontario
CORPORATE STRUCTURE
annual report 2009–10L C B O8

• public access to various records under the Freedom of Information and Protection of Privacy Act• board members must be appointed by order-in-council• various statutory reporting requirements under the Liquor Control Act require the corporation
to provide reports to the Minister of Finance and the Treasurer of Ontario• the corporation is required to comply with applicable Management Board’s directives.
SENIOR MANAGEMENT TEAM
Day-to-day operations of the LCBO are overseen by the following members of senior management:
BOB PETER , president & chief executive officer
JACKIE BONIC , vice-president, Store Development and Real Estate
ALEX BROWNING , senior vice-president, Finance and Administration, and chief financial officer
NANCY CARDINAL , vice-president, Marketing and Customer Insights
BOB DOWNEY , senior vice-president, Sales and Marketing
ROY ECKER , senior vice-president, Retail Operations
MARY F ITZPATRICK , senior vice-president, general counsel and corporate secretary 2
PATRICK FORD , senior director, Policy & Government Relations
MURRAY KANE , senior vice-president, Human Resources
HUGH KELLY , senior vice-president, Information Technology
BILL KENNEDY , executive director, Corporate Communications
SHARI MOGK-EDWARDS , vice-president, Merchandising
GEORGE SOLEAS , senior vice-president, Logistics and Quality Assurance
SHELLEY SUT TON , director, Strategic Planning
TOM WILSON , vice-president, VINTAGES
CORPORATE STRUCTURE
annual report 2009–10 L C B O 9
2 Retired April 30, 2010

annual report 2009–10L C B O10
BOARD MEMBERS
PHILIP J. OLSSON
Appointed vice-chair in June 2004, became acting chair and CEO on February 6, 2006,and non-executive chair (pursuant to amendments to the Liquor Control Act) on March 7, 2007.Current term expired March 6, 2010; it was renewed for another two-year-term, which expiresMarch 5, 2012.
Mr. Olsson is a partner in K J Harrison & Partners Inc., a privately-held investment firm forprivate individuals. He is also the chair of Connaught Oil & Gas Limited, a private energyexploration and production firm. He has had a career of more than 30 years in finance, as aninvestor and investment and commercial banker, including Managing Director, Private Equity,at Altamira Investment Services Inc., where he restructured and oversaw Altamira’s privateequity functions. Prior to that he was Managing Director of Royal Bank Equity PartnersLimited, the Royal Bank Financial Group’s merchant banking unit, and, before that, was vicechairman of RBC Dominion Securities, Canada’s largest investment bank. Mr. Olsson holds anMBA degree from Vanderbilt University, Nashville, Tennessee, and studied monetary economicsas a postgraduate at the London School of Economics. He holds a CBV designation from theCanadian Institute of Chartered Business Valuators. He has long been active in communityand civic affairs on behalf of such organizations as the United Way, Atlantic SalmonFederation, the Shaw Festival and Trout Unlimited.
STEVE DIAMOND
Appointed September 21, 2005, and appointed vice-chair March 7, 2007. Term expiredMarch 6, 2010; it was renewed for another two-year term, which expires March 5, 2012.
Mr. Diamond is currently president of Diamondcorp, a real estate development and consultingbusiness, and is a director of Whitecastle Investments. Prior to entering the real estate business,Mr. Diamond was a partner at McCarthy Tetrault and head of its municipal and environmentallaw department. He also served as director of the firm. In his practice, he acted as counselon some of the largest and most sophisticated projects that have been approved in the GreaterToronto Area for both private and public sector clients. Mr. Diamond is active in the community,serving as chair of PAYE (Partnership to Advance Youth Employment), director of the Mount
Philip J. Olsson Steve Diamond

Sinai Hospital Foundation, and is a member of Toronto Mayor David Miller’s Committee onCommunity Safety. Mr. Diamond received his LLB from the University of Western Ontarioand was called to the Ontario bar in 1978. He gives back to the educational community throughfrequent lectures at local law schools and other educational organizations.
GEOFFREY R. LARMER
Appointed May 30, 2006. Term expires May 29, 2012. Member, Governance andCompensation Committee.
Mr. Larmer is president of Larmer Professional Corporation, North Bay, a law firm restrictedto personal injury and insurance litigation. His practice gives him a unique perspective onsocial responsibility and liability, particularly in terms of underage alcohol consumption andthe consequences of not drinking responsibly. His clients include victims of drinking and drivingaccidents. He graduated from the University of Western Ontario in 1989 with an Honoursdegree in Medical Biophysics and in1992 with a bachelor of laws degree. He articled withBereskin & Parr, Toronto, where he trained in intellectual property, patent, trademark, copyrightand related licensing matters. He was called to the bar in 1994 and founded Larmer & LarmerBarristers, North Bay. Larmer Professional Corporation was formed in 2005. He is a memberof the Nipissing Law Association, Ontario Trial Lawyers Association and the Association of TrialLawyers of America, and a former director and past-president of the North Bay and DistrictHumane Society.
JAY LEE
Appointed May 30, 2007. Term expired May 29, 2010. Member, Audit Committee.
Jay Lee is a capital markets professional with wide experience in portfolio management,trading and analysis in U.S. and Canadian capital markets. A chartered financial analyst witha bachelor of arts degree in economics from the University of Toronto, he has a diverse back-ground including trading and analysis in a broad array of sectors and products such as equities,equity and credit derivatives.
BOARD MEMBERS
annual report 2009–10 L C B O 11
Geoffrey R. Larmer Jay Lee

PENNY LIPSETT
Appointed May 30, 2007. Term expires May 29, 2010; it was renewed for another three-yearterm expiring May 28, 2013. Member, Governance and Compensation Committee.
Penny Lipsett is a former investor and government relations specialist. She spent much of hercareer in the political and business worlds. Following graduation from the University of WesternOntario, she worked on Parliament Hill in Ottawa as a special assistant to a cabinet minister(Judd Buchanan) during the Trudeau years. Following this and until 1992, she worked forXerox Canada in increasingly responsible roles concluding with the management of all corporateaffairs functions. Ms. Lipsett returned to Parliament Hill as chief of staff to Justice MinisterAllan Rock from 1993 to 1995. Since 1995, she has run her own consulting practice with a focus on investor and government relations. Her clients included Sherritt International,Manulife Financial and the Westaim Corporation. She is on the board of bank holdingcompany MBNA (Canada).
PAMELA LIVINGSTONE
Appointed June 8, 2009. Term expires June 7, 2012.
After a highly successful, 14-year career with Sears Canada, Pamela Livingstone now worksas a planning manager for the Home Outfitters banner in the Hudson Bay Company. HerSears Canada career culminated with her last position as a national operations manager from2007–2009 where she was responsible for all inventory flow and processes for the company’smulti-channel, home décor business. Her retail background has given her experience in buildingand executing complex business plans. Ms. Livingstone launched her Sears Canada career as amerchandise flow analyst in 1995, progressing to an associate buyer in home décor five yearslater and was named buyer in 2004. During her tenure at Sears, she acquired strengths innegotiating, leadership, process management, as well as coaching, mentoring and staff training.Ms. Livingstone earned a master’s degree in public administration at Queen’s University andan Honours B.A. at Wilfrid Laurier University. She also worked as an English teacher in Osaka,Japan for two years.
BOARD MEMBERS
annual report 2009–10L C B O12
Penny Lipsett Pamela Livingstone

LAUREL MURRAY
Appointed August 8, 2005, renewed August 8, 2008. Term expires August 7, 2011. Chair,Audit Committee.
Ms. Murray is a chartered accountant with more than 20 years of senior management experiencein the private and public sectors. Since 2000, Ms. Murray has headed up her own managementconsulting firm. Over the past 20 years, she has helped a number of federal and provincialagencies and ministries improve the way they manage risks, measure performance and improveaccountability. Ms. Murray is a proponent of good governance and oversight. She is also thechair of the Audit Committee of the Office of the Privacy Commissioner of Canada and amember of the Audit Committee of the Office of the Commissioner of Official Languages.She was also the lead in developing the Treasury Board of Canada Secretariat’s Guidebook forDepartmental Audit Committees. She has a keen interest in the environment. Her areas ofexpertise include strategic planning and reporting; performance measurement; integrated riskmanagement; financial management, accounting and auditing; financial systems; projectmanagement; program implementation and organizational design. She graduated with honoursfrom Carleton University in 1986 with a bachelor of commerce. She received her charteredaccountant designation from the Canadian Institute of Chartered Accountants in 1989. An active mother, wife and volunteer, Ms. Murray balances work and family while still playingan active role to help those in need in her community.
WALTER SENDZIK
Appointed June 4, 2008. Term expires June 3, 2011. Member, Audit Committee.
Walter is the CEO of the St. Catharines-Thorold Chamber of Commerce. He is also a memberof the board of directors of the Niagara Wine Festival, the Hotel Dieu Shaver RehabilitationCentre, Business Education Council and the St. Catharines and District United Way. He foundedVines magazine, wrote the Guide to Niagara’s Wine Country and is co-author of the Buyers’Guide to Canadian Wine. He sold Vines to Osprey Media Group in 2003 when he joinedthat company as publisher of the Niagara magazine division, where he helped launchNiagara magazine.
BOARD MEMBERS
annual report 2009–10 L C B O 13
Laurel Murray Walter Sendzik

He left Osprey to join the St. Catharines Chamber of Commerce in 2006 and oversaw themerger of the St. Catharines and Thorold chambers, which created one of the largest chambersof commerce in southern Ontario. Walter was awarded the Bernie Gillespie Award by theOntario Chamber of Commerce for outstanding leadership, was a recipient of a Niagara’s Top40 Under 40 award, the St. Catharines Volunteer Recognition Award and was a finalist in theNiagara Youth Entrepreneur of the Year Award.
JEAN SIMPSON
Appointed November 3, 2004. Renewed November 3, 2007. Term expires November 2, 2010.Chair, Governance and Compensation Committee.
Ms. Simpson has had a lifelong interest in mental health, beginning her career as a nurse andmoving into management at the Clarke Institute of Psychiatry and Women’s College Hospitalin Toronto. She then became director of Mental Health Programs and Services at the Ministryof Health, returning to the Clarke Institute as executive vice-president and COO and subse-quently executive vice-president and COO of the Centre for Addiction and Mental Healthwhen it was created in 1998. She retired in June 2003, but continues her work in mental healththrough membership of the board of the Ontario Council of Alternative Businesses, a not-for-profit organization with a provincial mandate to develop alternative businesses owned andoperated by psychiatric survivors and consumers of the mental health system. As a former COO,she also coaches senior business executives.
RAMESH SRINIVASAN
Appointed April 18, 2007. Term expired April 17, 2010; it was renewed for another three-yearterm, which expires on April 16, 2013. Member, Audit Committee.
Ramesh is a senior hospitality educator with more than 25 years of international experience inhospitality management. He holds a masters degree in hotel administration from Cornell-Essecin Paris, France. Areas of expertise include hotels, restaurants, catering and convention centremanagement, marketing and finance.
BOARD MEMBERS
annual report 2009–10L C B O14
Jean Simpson Ramesh Srinivasan
He is professor of Hospitality Management, School of Hospitality, Recreation and Tourism,Humber Institute of Technology and Advanced Learning, Toronto. Areas of specializationinclude: food and wine pairing, revenue management, hospitality systems and controls, entre-preneurship, convention and meetings management. His professional certifications include:Certified Foodservice Manager; Certified Specialist of Wine; Certified Hospitality Educator;and, most recently, Ramesh completed his Wine & Spirit Education Trust diploma fromthe U.K. He is a member of the Hospitality Sales and Marketing Association International,Canadian Association of Professional Sommeliers, International Council on Hotel Restaurantand Institutional Education, Canadian Restaurant and Foodservices Association and theInstitute of Internal Auditors.
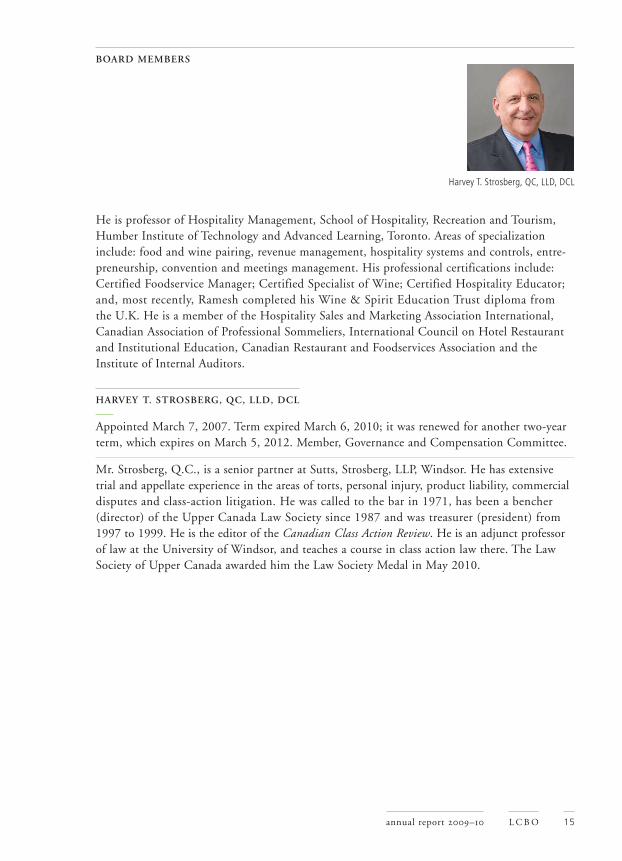
HARVEY T. STROSBERG, QC, LLD, DCL
Appointed March 7, 2007. Term expired March 6, 2010; it was renewed for another two-yearterm, which expires on March 5, 2012. Member, Governance and Compensation Committee.
Mr. Strosberg, Q.C., is a senior partner at Sutts, Strosberg, LLP, Windsor. He has extensivetrial and appellate experience in the areas of torts, personal injury, product liability, commercialdisputes and class-action litigation. He was called to the bar in 1971, has been a bencher(director) of the Upper Canada Law Society since 1987 and was treasurer (president) from1997 to 1999. He is the editor of the Canadian Class Action Review. He is an adjunct professorof law at the University of Windsor, and teaches a course in class action law there. The LawSociety of Upper Canada awarded him the Law Society Medal in May 2010.
BOARD MEMBERS
annual report 2009–10 L C B O 15
Harvey T. Strosberg, QC, LLD, DCL

annual report 2009–10L C B O16
CARING./COMMUNITY.
CARING FOR THE COMMUNITY
Selling beverage alcohol responsibly is a public trust the LCBO takes seriously. Being a goodcorporate citizen is part of the LCBO brand essence and caring is one of the LCBO’s core val-ues. Our customers also expect us to deliver a high standard of corporate social responsibility,including a strong commitment to the environment.
Here’s a sampling of how LCBO gave back to the communities we serve in 2009–10.
Donation box programIn calendar 2009, thanks largely to the generosity of the public, LCBO raised $4.2 millionfor various charities, including: MADD Canada, Friends of We Care, and Camp Oochigeas,which provides summer getaways to kids with cancer. This included $3.8 million for 26 provincialand numerous local charities through in-store fundraising. Of this, $1.9 million was for theUnited Way. In 2010, another 26 provincial and numerous local charities will benefit fromLCBO’s province-wide donation box program. For more information about LCBO communitysupport and fundraising initiatives, visit: www.lcbo.com.
LCBO customers and employees raised $580,000 for Haiti reliefFrom tsunamis to hurricanes, floods to earthquakes, LCBO and its customers have alwaysstepped up to help those affected by natural disasters. The powerful earthquake, which occurredin Haiti on January 12, 2010, was one of the most devastating natural disasters in recenthistory – affecting three million people, killing hundreds of thousands and leaving just asmany more homeless. LCBO customers and employees showed their generosity, raising morethan $580,000 for the Canadian Red Cross Haiti Earthquake Relief Fund at stores acrossthe province.
“During the Haiti fundraising, I was elated daily as the opportunity was given to customers,LCBO team members, and me to not just sit back and watch in horror the devastation on TV;with great relief, we could do our part in aiding the Haitians through the efforts of the LCBOand Red Cross.” – L AURA BEYAK , Store 494 Mississauga
“This support helped the Red Cross continue to provide for immediate needs includingshelter, clean water and medical support, as well as addressing longer-term needs of the affectedcommunities as we started to help them rebuild and recover,” – RON KELUSKY , director generalfor the Ontario Red Cross.

JENNIFERHORNERCSR, Store 607, Gooderham
“Why do I volunteer?Motherhood and cancer.Both happened the samemonth, and both changedhow I view life. Having a serious health scare, if Ican use my life to do somegood, then I should. Ivolunteer to set a goodexample for my children,and to help improve theworld they live in. WhatI give pales in comparisonto what I get in return.Being in the company of others who give is soinspiring and to see firsthand the kindness andgenerosity that others arecapable of is amazing.”

annual report 2009–10L C B O18
CARING./ENVIRONMENT.
SAFEGUARDING THE ENVIRONMENT
The LCBO has a multi-pronged strategy to reduce its environmental footprint, which buildson five specific goals:• to reduce package waste generated by LCBO sales• to increase the rate of material diverted from landfill to recycling and re-use• to reduce the consumption of energy and utilities• to lower our overall carbon footprint and other environmental impacts (Note: LCBO is set
to meet its goal of cutting its print output costs in half over five years.); and• to support local conservation and natural heritage initiatives that involve both LCBO staff
and external environmental organizations.
Utility management systemA new utility management system has been installed to give LCBO a clear picture of exactlyhow much its stores, offices and warehouses are consuming in electricity, gas, water, propane,and oil. Efforts to conserve and reduce can now be more readily compared and analyzed.
New store designs reduce energy consumptionLCBO’s store planning department is continuously updating its standard specifications anddesign details. Many of these details contribute to LCBO sustainability goals and help toreduce energy consumption in LCBO stores. Here are a few examples:• lighting control systems/light zoning: enables staff to reduce and adjust retail lighting
during stocking hours, or when the store is not open to customers• more efficient refrigeration means expanded chilled selection and lower utilities usage• exterior light photo sensors come on automatically when it is dark• occupancy sensors for mezzanines, washrooms and other non-retail areas; and• illuminated sign boxes and exterior signs are now just as bright (but use far less energy).
Lighten up! Lightweight glass provides environmental, ergonomic benefitsReducing the amount of energy expended to ship products from their place of origin to ourshelves is also an ongoing priority. Tetra, PET and aluminum containers for beer, wine andspirits are now common in LCBO stores and consumers have embraced them. The next stepis lightweight glass.
Why reduce glass bottle weight?• less fuel for transportation and manufacturing• less raw materials used• space efficiencies in warehouses (potential for higher stacking)

TINA GIBSONmanager, Thunder Bay Retail
Service Centre
“I’m a rabid environmen-talist. This is the way I live. Environmentalresponsibility meansbeing conscious that everyaction we take impactsthe earth. At the ThunderBay Retail Service Centre,we choose non-toxiccleaners, conserve energy,have a waste managementstrategy, and follow greenpurchasing practices todo our part in minimizingthe LCBO’s ecologicalfootprint.”

annual report 2009–10L C B O20
CARING./CUSTOMERS.
RESPONSIBLE RETAILING AND CONSUMPTION
Challenge and RefusalYear round, through our Challenge and Refusal program, LCBO retail staff prevent sales tominors and those who appear intoxicated. It’s also illegal for anyone to supply alcohol tominors. When staff have reasonable grounds to believe someone is buying for a minor, theLiquor Licence Act gives them the right and responsibility to refuse the sale.
In fiscal 2009–10:• total challenges were more than 2.6 million; and• annual total refusals were more than 155,000 (82 per cent for reasons of age).
SMARRT TrainingEvery LCBO employee serving the public takes part in the organization’s award-winningWorking SMAART (Strategies for Managing Age- and Alcohol-Related Troubles) program.It trains staff how to deal with customers who appear intoxicated or underage, second-partypurchasers (those buying alcohol for someone not legally entitled to purchase it) and difficultrefusals at the checkout. Employees learn to identify potential problems and handle themtactfully and to distinguish between characteristics related to health conditions, disabilitiesand impairment resulting from intoxication.
Drinking and driving prevention campaignLaunched in December 2009, our Deflate the Elephant social responsibility advertising campaignand website were developed to encourage Ontarians to speak up to help prevent friends andguests from drinking and driving. Post-tracking research conducted by Ipsos ASI indicated onein two participants recalled LCBO as the sponsor and believed the ads strongly communicatedthe intended message of helping prevent drinking and driving. Consumer response to thewebsite was positive and 73 per cent believed it was informative, promoted the responsible useof alcohol and strongly communicated the need to speak up to help prevent impaired driving.
Supporting MADD Canada and other causesIn December 2009, LCBO customers and staff raised close to $900,000 for MADD Canadaand its high school multi-media assembly program. These funds will make sure the Englishand French versions of the video Shattered will be delivered to 500,000 students across Ontarioat no cost to the schools.
LCBO also helped promote alcohol and pregnancy awareness in partnership by printing anddistributing brochures with Best Start. This included two advertisements in LCBO’s Food &Drink magazine.

L AURA BEYAKCSR, Store 494, Mississauga
“Working for an organiza-tion that not only speaksabout social responsibility,but acts on it, is an honour.I serve my communitywith pride by upholdingthe oath I took when I joined the LCBO: to provide responsible service.The communities weserve depend on us tohelp keep their familiessafe by applying ourtraining to help makesure the people we serveare of legal age, and‘deflating the elephant’ by refusing individuals webelieve to be impaired.”
annual report 2009–10L C B O22
CARING./QUALITY.
QUALITY ASSURANCE
The majority of products sold in LCBO stores must first be tasted and tested by the LCBO’sQuality Assurance (QA) department. This means they are safe to consume, authentic andmeet standards set out in Canada’s Food and Drugs Act and Consumer Packaging and LabellingAct and their related regulations. The QA laboratory is world-renowned and meets the highstandards set by the Geneva-based International Organization for Standardization. It is registered under ISO 9001:2000 as well as under ISO/IEC 17025, a designation specific tochemistry laboratories.
Tasting facility gets makeoverThe QA (sensory evaluation) lab got a much needed upgrade in 2009. The new facility holdsup to 25 people comfortably and benefits QA, LCBO buying groups and VINTAGES. QA isresponsible for providing sensory evaluation (tasting) services and, along with VINTAGES, hoststastings of new releases for the media.
Product consultants and many members of the media who have used the facility areimpressed. Margaret Swaine – a wine writer and a regular National Post columnist – said thisabout the transformation:
“The new room is a vast improvement over the former space. It’s bright, spacious and welllaid out for handling the large VINTAGES release tastings.”
Some features of the new facilities include:• wireless network that allows electronic data collection using tablet PCs• upgraded air flow• better temperature control• ergonomic enhancements such as higher counters, stools, improved operational flow;• superior sample coordination management; and• secured access to the facilities.
Quality Assurance: by the numbers• total lab samples: 21,448• percentage rejected by laboratory (which is determined based on number of samples rejected
as a proportion of total samples tested): 10.9 per cent• total units returned/customer complaints: 80,469• number of customer complaints requiring investigation: 275

AL AN SHEPPARDchemist, Quality Assurance
“I get great satisfaction to know that I’ve con-tributed to assuring thatnot only are our productssafe but as a laboratorywe meet and exceed themost rigorous standardsheld to chemistry labora-tories. Over the past 10years, I’ve tested more than200,000 products for con-taminants such as lead,arsenic, pesticides, ethylcarbamate and ochratoxinA. As an internal auditor,I’ve had the opportunityto contribute to our labmeeting the ISO 17025standard and our commit-ment to continuousimprovement.”

annual report 2009–10L C B O24
CARING./EMPLOYEES.
PROMOTING A HEALTH AND SAFETY CULTURE
Workplace health and safety is an ongoing priority at LCBO and is a key component of its shortand long-term strategic plans. In 2009–10, LCBO made it a priority to increase this focus onworkplace health and safety. Creating and maintaining a safe work environment is consideredan integral part of being a responsible retailer; LCBO wants its leaders to encourage andmentor employees to excel at health and safety as is the case with challenge and refusal andcustomer service.
In 2009–10, LCBO made ergonomic improvements to its Durham Retail Service Centreand introduced new lift tables in many stores to make unloading products from pallets easierand safer for our frontline employees. Various other safety measures contributed to an eightper cent reduction in lost-time injuries this past fiscal year. Such measures include, but are notlimited to, comprehensive training, awareness promotion and, with the support of our suppliers,reduced case weights.
“Workplace safety is about our people and looking out for each other,” says LCBOPresident & CEO Bob Peter. “Our aim is to become a best-in-class retailer in this field andeliminate all workplace accidents.”
In the last two years, more than 300 LCBO locations (stores and warehouses) have recordedzero lost-time injuries and the goal is to make all LCBO workplaces accident free.
Toronto Retail Service Centre goes two years without a lost-time accidentLCBO employees at the Head Office Retail Service Centre in Toronto have led by example indeveloping and maintaining a safe and healthy work environment. Beginning in 2008–09,they’ve gone more than two years without a lost-time accident thanks to good communicationand the introduction of new policies and procedures.
“It’s all about communication and teamwork,” says Bev James, health and safety coordinator.“We have an open dialogue and everyone is encouraged to ask questions and give feedback.We don’t just tell people what must be done. We explain why it’s important and what can happenif it’s not done.”
LCBO highlights health and safety best practices such as the above example throughtraining and videos and we encourage employees to help us identify areas where we can makefurther improvements.

BEV JAMESHealth & Safety coordinator,
Toronto Logistic Facility
“Incorporating the righthealth and safety policies,procedures and training forour facility has made healthand safety an integral partof our daily activities. Beingaware of our surroundingsand reporting deficienciesallows us to proactivelyimprove our work areas.We encourage employeesto ask questions and timelyfeedback is given. OurJoint Health and SafetyCommittee collectivelywork towards maintaininga safe work environment.With communication andteamwork, we have achievedmore than two years of nolost-time accidents.”

annual report 2009–10L C B O26
SUPPORTING./LOCAL.
LCBO SUPPORTS ONTARIO WINERIES
LCBO conducts a number of initiatives consistent with international trade obligations topromote Ontario wines and help Ontario wineries grow their business. In 2009–10, LCBOintroduced 231 new Ontario VQA wines to VINTAGES and another 56 in the WINES category.All new LCBO stores feature prominent signage that encourages customers to “Go Local”.While LCBO saw many consumers shift to wines priced at less than $10 to stretch their budgetsthis past year, premium Ontario VQA wines bucked this trend as more customers decided tosupport local wineries. LCBO VQA table wine sales were up 19 per cent compared to theprevious year, benefitting also from LCBO’s goLOCAL marketing support, additional prominentdisplays, and high-value products from suppliers, including several with eye-catching labelsand names.
Other initiatives that help support Ontario wineries include:Shelf space/location: Ontario wines are normally located at the front of the store and
more than 250 LCBO stores feature special VQA wine displays. In 2009, the LCBO increasedVQA shelf space by 20 per cent in its “A” and “B” stores; all new stores are now built with thisadded VQA space.
WOW (World of Ontario Wines) leaders: LCBO employees take pride in recommendingOntario wines and some 300 LCBO store employees are specially-trained and designated topromote Ontario wines with customers and to help their colleagues.
Ontario Superstars: Every month, two Ontario VQA wines are highlighted in some 292LCBO stores, with dedicated shelving and promotional materials. Superstar wines are also fea-tured in every issue of Food & Drink.
Annual promotion: Every year, from mid-September to mid-October, Ontario wines(especially VQA) are showcased in all LCBO stores.
VINTAGES VQA promotions: Under Small Winery support, LCBO and VINTAGES featuresa wine-of-the month promotion and other product profiles for Ontario VQA wines and wineries.
Small winery support: LCBO Go-to-Market and Ontario Craft Winery programs providein-store presence for smaller Ontario wineries along with support to help them build sales forwider distribution.
Ontario craft brews continue to shine: Customers continued to “go local” this past yearwhen it came to buying beer as well. Total net sales of Ontario Craft Beer sold at LCBO in2009–10 was $10.4 million – an increase of 49.5 per cent year-over-year or $3.4 million. A keyfactor to these phenomenal sales for craft beers was the success of LCBO sampler packs.Throughout the year, there were five packs available (three Ontario craft beer samplers andtwo Mill Street), which collectively accounted for more than $1.4 million in net sales.

ASTRID BRUMMERproduct manager, Ontario Wines
“Ontario VQA wines arefresh, elegant and deliciousand the natural partnersto earth-to-table cuisine.I am passionate aboutOntario wines because theirsuccess is so important toour local economies. I lovethat I can get to know thegrowers and winemakersby visiting their vineyardsand seeing all of the greatthings that are happeninghere at home. There areso many delicious winesmade here and they canbe found on our shelves.There is a discovery justwaiting to be found forevery occasion, everymeal, every taste andevery budget.”
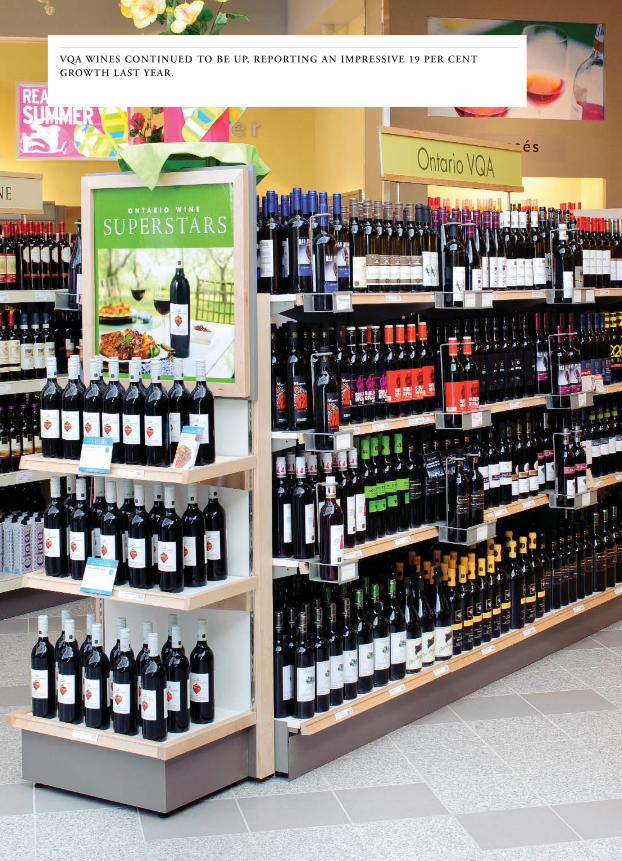
VQA WINES CONTINUED TO BE UP, REPORTING AN IMPRESSIVE 19 PER CENTGROWTH LAST YEAR.

PRODUCT TRENDS
/WINES2009–10:Net sales: $1.121 billionIncrease over year before: $6.5 million (+0.6 per cent)Increase over plan: $24.8 million (+2.3 per cent)Margin dollars: $572.1 millionIncrease over year before: $13.3 million (+2.4 per cent)Performance to plan: +$22 million (+4 per cent)
Key trends:• consumers continued to trade down to the less than $10 segment, which represents
52.8 per cent of the LCBO Wines category net dollar sales. The market share for wines lessthan $10 grew by 2.23 per cent in the past 12 months. Value wines – priced less than $8 –topped all price bands in growth, up 1.4 per cent versus the previous year.
• VQA table wines continued to be up, reporting an impressive 19 per cent growth.• LCBO successfully promoted Spanish and Portuguese wines during the Viva Vino promo-
tion in P1 (March 29 to April 25, 2009); for the past fiscal year, net sales of Spanish wineswere up more than $1.8 million (13 per cent), Portuguese wines increased by $2.4 million(21 per cent) and Ports grew by $233,042 (4.9 per cent).
• in the Italian category, Primitivo grew by $364,895 (101 per cent), Pinot Grigio continuesto grow and increased by $681,721 (1.8 per cent). Prosecco sales were up $411,403 (6.7 per cent).
• Argentinean wine sales grew by 118.3 per cent to $70.9 million. The success of Fuzioncontinues to drive this exponential growth; this value-priced wine sold 399,007 cases last year.
Outlook for 2010–11:• net sales forecast to increase to $1.189 billion, up 4.5 per cent versus the previous year• value wines in the less than $10 price point will continue to be popular. As the global
economy improves, a moderate shift in growth in the $10 to $12 range is expected.• Rosé program selling season will be expanded to launch for Easter and continue to
Thanksgiving. Selection will be increased to 33 Rosé wines. Sales are forecast to increasefrom $2.6 to $5.9 million (up 127 per cent).
• Ontario VQA wines are expected to continue their strong sales growth.• convert wine in-store sections from brand focused displays to more emphasis on grape variety
and region to make it easier for customers to find the wines they want.• continue to support the corporate environmental strategy by buying new products and
working with suppliers to convert current brands to lightweight glass.
annual report 2009–10 L C B O 29

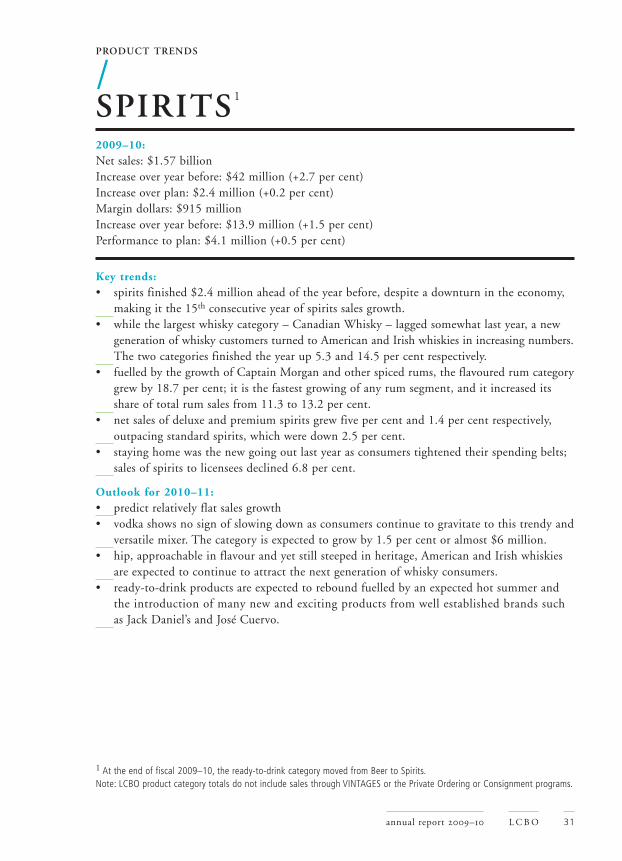
A NEW GENERATION OF WHISKY CUSTOMERS TURNED TO AMERICAN AND IRISHWHISKIES IN INCREASING NUMBERS. THE TWO CATEGORIES FINISHED THE YEARUP 5.3 AND 14.5 PER CENT RESPECTIVELY.
PRODUCT TRENDS
/SPIRITS 1
2009–10:Net sales: $1.57 billionIncrease over year before: $42 million (+2.7 per cent)Increase over plan: $2.4 million (+0.2 per cent)Margin dollars: $915 millionIncrease over year before: $13.9 million (+1.5 per cent)Performance to plan: $4.1 million (+0.5 per cent)
Key trends:• spirits finished $2.4 million ahead of the year before, despite a downturn in the economy,
making it the 15th consecutive year of spirits sales growth.• while the largest whisky category – Canadian Whisky – lagged somewhat last year, a new
generation of whisky customers turned to American and Irish whiskies in increasing numbers.The two categories finished the year up 5.3 and 14.5 per cent respectively.
• fuelled by the growth of Captain Morgan and other spiced rums, the flavoured rum categorygrew by 18.7 per cent; it is the fastest growing of any rum segment, and it increased itsshare of total rum sales from 11.3 to 13.2 per cent.
• net sales of deluxe and premium spirits grew five per cent and 1.4 per cent respectively,outpacing standard spirits, which were down 2.5 per cent.
• staying home was the new going out last year as consumers tightened their spending belts;sales of spirits to licensees declined 6.8 per cent.
Outlook for 2010–11:• predict relatively flat sales growth• vodka shows no sign of slowing down as consumers continue to gravitate to this trendy and
versatile mixer. The category is expected to grow by 1.5 per cent or almost $6 million.• hip, approachable in flavour and yet still steeped in heritage, American and Irish whiskies
are expected to continue to attract the next generation of whisky consumers.• ready-to-drink products are expected to rebound fuelled by an expected hot summer and
the introduction of many new and exciting products from well established brands suchas Jack Daniel’s and José Cuervo.
annual report 2009–10 L C B O 31
1 At the end of fiscal 2009–10, the ready-to-drink category moved from Beer to Spirits.Note: LCBO product category totals do not include sales through VINTAGES or the Private Ordering or Consignment programs.
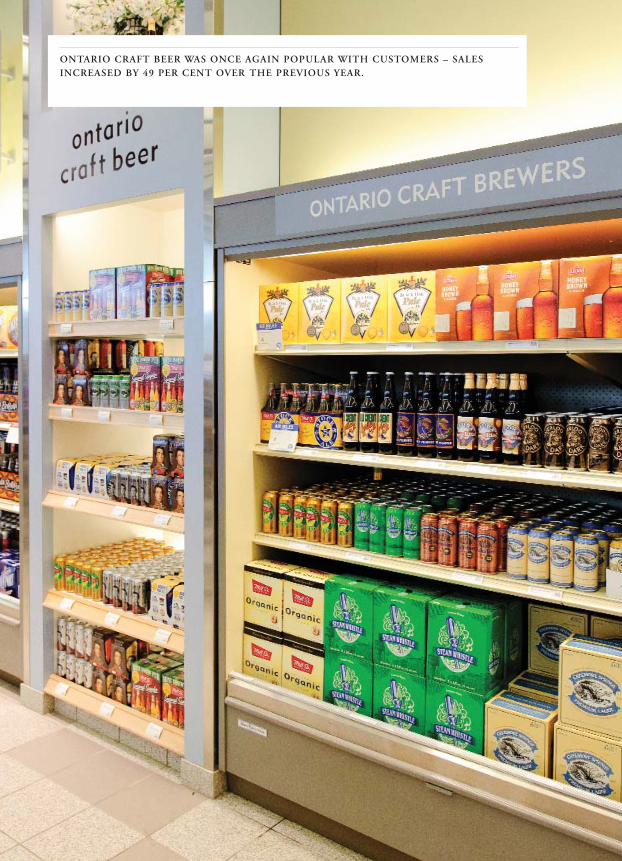
ONTARIO CRAFT BEER WAS ONCE AGAIN POPULAR WITH CUSTOMERS – SALESINCREASED BY 49 PER CENT OVER THE PREVIOUS YEAR.

PRODUCT TRENDS
/BEER2009–10:Net sales: $1 billionIncrease over year before: $46.6 million (+4.7 per cent)Increase over plan: $1.7 million (+0.2 per cent)Margin dollars: $391.7 millionIncrease over year before: $14.3 million (+3.8 per cent)Performance to plan: -$915,000 (-0.2 per cent)
Key trends:• LCBO beer sales had a remarkable year, growing by 6.3 per cent.• the business unit, which includes beer and cider sold at the LCBO and imported beer shipped
to The Beer Store, grew by almost five per cent during a year of economic uncertainty.• volume share for beer sold at the LCBO increased by just over one percentage point to
20.8 per cent.• sales of single-serve cans continue to drive category growth. The segment has tripled in volume
over the past six years. Last year, it was the fastest growing format again, up 11.7 per cent.• ciders experienced growth of 14.9 per cent and achieved net sales of nearly $15 million,
driven primarily by the growing popularity of dry and more traditional styles and theLCBO’s wide assortment of single-serve cans.
Outlook for 2010–11:• after two consecutive cool summers, forecasts are for a warmer and drier summer period
that should help boost the sales of both beer and cider.• in response to growing consumer demand, the beer category is expanding its assortment
of beer gift items and mixed sampler packs this year.• it is expected consumers will continue to exercise caution in their discretionary spending
as the economy improves; value will remain a high priority.• there is growing consumer interest in lower calorie and lower alcohol beer products such
as Molson 67 and Moosehead’s Cracked Canoe.• after the widely popular introduction of Bud Light Lime last year, the lime beer craze is
expected to continue with the introduction of a few new products.
annual report 2009–10 L C B O 33
Footnote: For fiscal 2009–10 ready-to-drink sales were included as part of in the Beer category.Note: LCBO product category totals do not include sales through VINTAGES or the Private Ordering or Consignment programs.

ONTARIO VQA TABLE WINES GREW BY 17 PER CENT OVER LAST YEAR – EXCEED-ING PLAN BY 0.2 PER CENT.
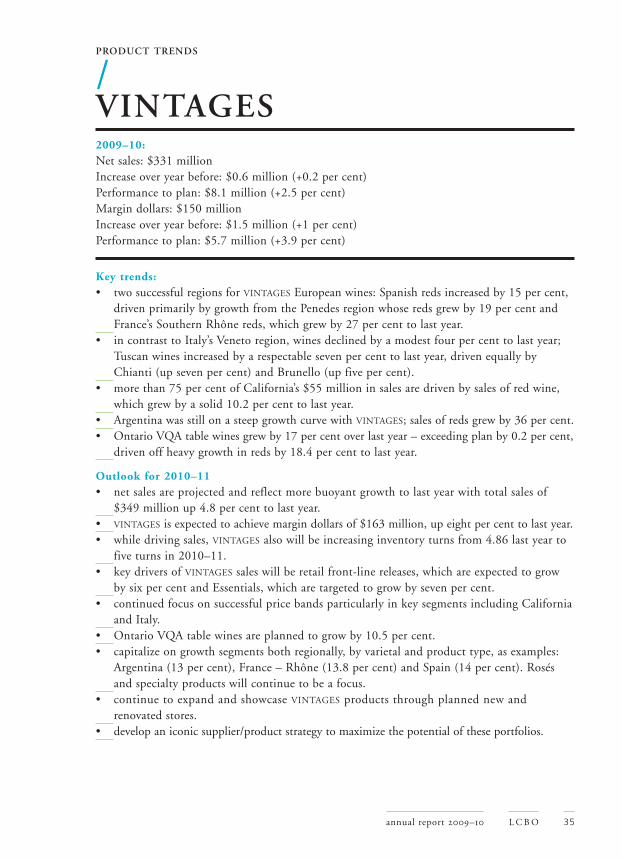
PRODUCT TRENDS
/VINTAGES2009–10:Net sales: $331 millionIncrease over year before: $0.6 million (+0.2 per cent)Performance to plan: $8.1 million (+2.5 per cent)Margin dollars: $150 millionIncrease over year before: $1.5 million (+1 per cent)Performance to plan: $5.7 million (+3.9 per cent)
Key trends:• two successful regions for VINTAGES European wines: Spanish reds increased by 15 per cent,
driven primarily by growth from the Penedes region whose reds grew by 19 per cent andFrance’s Southern Rhône reds, which grew by 27 per cent to last year.
• in contrast to Italy’s Veneto region, wines declined by a modest four per cent to last year;Tuscan wines increased by a respectable seven per cent to last year, driven equally byChianti (up seven per cent) and Brunello (up five per cent).
• more than 75 per cent of California’s $55 million in sales are driven by sales of red wine,which grew by a solid 10.2 per cent to last year.
• Argentina was still on a steep growth curve with VINTAGES; sales of reds grew by 36 per cent.• Ontario VQA table wines grew by 17 per cent over last year – exceeding plan by 0.2 per cent,
driven off heavy growth in reds by 18.4 per cent to last year.
Outlook for 2010–11• net sales are projected and reflect more buoyant growth to last year with total sales of
$349 million up 4.8 per cent to last year.• VINTAGES is expected to achieve margin dollars of $163 million, up eight per cent to last year.• while driving sales, VINTAGES also will be increasing inventory turns from 4.86 last year to
five turns in 2010–11.• key drivers of VINTAGES sales will be retail front-line releases, which are expected to grow
by six per cent and Essentials, which are targeted to grow by seven per cent.• continued focus on successful price bands particularly in key segments including California
and Italy.• Ontario VQA table wines are planned to grow by 10.5 per cent.• capitalize on growth segments both regionally, by varietal and product type, as examples:
Argentina (13 per cent), France – Rhône (13.8 per cent) and Spain (14 per cent). Rosésand specialty products will continue to be a focus.
• continue to expand and showcase VINTAGES products through planned new and renovated stores.
• develop an iconic supplier/product strategy to maximize the potential of these portfolios.
annual report 2009–10 L C B O 35

HIGHLIGHTS 37 / NET INCOME 37 / DIVIDEND 38 / GOVERNMENT REVENUE DISBURSEMENT 38 / LCBO’S EXTERNAL ENVIRONMENT 39 / SALES BY REGION 40 /COMPARABLE STORE SALES 40 / SALES BY CHANNEL 41 / LCBO IN THE SHAREDMARKETPLACE 41 / CHANGES IN MARKET SHARE 42 / OPERATING RESULTS 44 /LOGISTICS – FINANCIAL AND OPERATING HIGHLIGHTS 50 / LOOKING AHEAD 51
annual report 2009–10L C B O36
MANAGEMENT DISCUSSION AND ANALYSIS OF OPERATIONS
/BEYOND THE NUMBERS2009–10

This section of the LCBO annual report explains the financial results for the past year andprovides background for evaluating its performance.
HIGHLIGHTS
NET INCOME
LCBO net income reached a record $1.44 billion in 2009–10, $25.4 million more than in theprevious fiscal year. Net income as a percentage of net sales improved to 33.3 per cent from33.0 per cent a year ago.
The following chart gives a 10-year history of LCBO net income and net income as a per-centage of net sales.
Net income ($000,000) and as percentage of net sales
00–01 01–02 02–03 03–04 04–05 05–06 06–07 07–08 08–09 09–10
Net income % of net sales
876 921 9401,045
1,147 1,2041,301
1,374 1,410 1,436
32.3%
31.5%
30.3%
31.7%
32.7% 32.9%33.4% 33.5%
33.0% 33.3%
Net income
2008–09 � 2009–10
$1.41 billion � $1.44 billion1.8% change
Operating expenses
2008–09 � 2009–10
$683 million � $710 million4.0% change
Net sales and other income
2008–09 � 2009–10
$4.30 billion � $4.34 billion1.1% change
Dividend to Government
2008–09 � 2009–10
$1.40 billion � $1.41 billion0.7% change
MANAGEMENT DISCUSSION AND ANALYSIS OF OPERATIONS
annual report 2009–10 L C B O 37
Since 2000–01, LCBO net income has improved by 63.8 per cent or $559 million. Net incomegrowth exceeded growth in net sales between 2002–03 and 2007–08 and again in 2009–10due to improved margins and expense control.
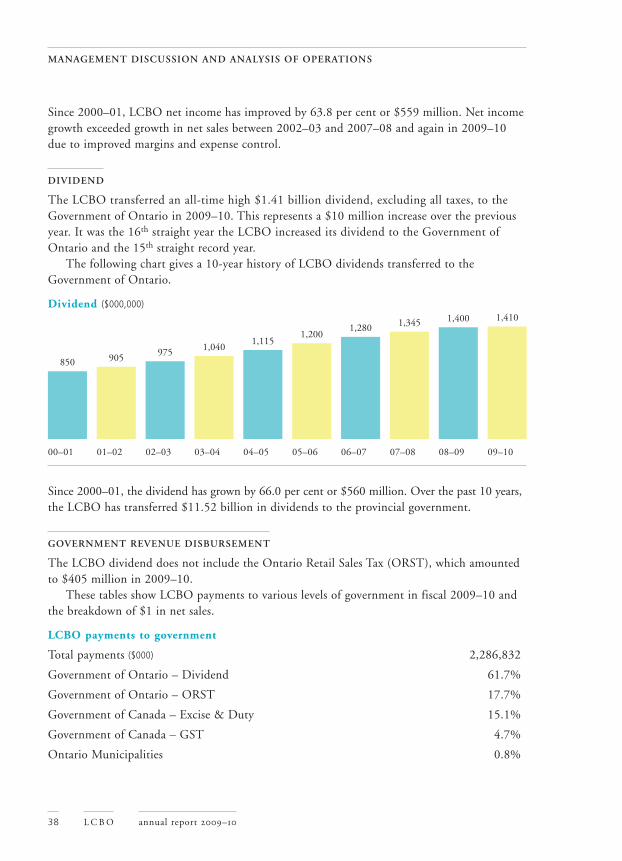
DIVIDEND
The LCBO transferred an all-time high $1.41 billion dividend, excluding all taxes, to theGovernment of Ontario in 2009–10. This represents a $10 million increase over the previousyear. It was the 16th straight year the LCBO increased its dividend to the Government ofOntario and the 15th straight record year.
The following chart gives a 10-year history of LCBO dividends transferred to theGovernment of Ontario.
Dividend ($000,000)
00–01 01–02 02–03 03–04 04–05 05–06 06–07 07–08 08–09 09–10
Since 2000–01, the dividend has grown by 66.0 per cent or $560 million. Over the past 10 years,the LCBO has transferred $11.52 billion in dividends to the provincial government.
GOVERNMENT REVENUE DISBURSEMENT
The LCBO dividend does not include the Ontario Retail Sales Tax (ORST), which amountedto $405 million in 2009–10.
These tables show LCBO payments to various levels of government in fiscal 2009–10 andthe breakdown of $1 in net sales.
LCBO payments to government
Total payments ($000) 2,286,832
Government of Ontario – Dividend 61.7%
Government of Ontario – ORST 17.7%
Government of Canada – Excise & Duty 15.1%
Government of Canada – GST 4.7%
Ontario Municipalities 0.8%
850 905975 1,040
1,1151,200
1,280 1,345 1,400 1,410
MANAGEMENT DISCUSSION AND ANALYSIS OF OPERATIONS
annual report 2009–10L C B O38

Breakdown of $1 in net sales
Product cost $ 0.51
Net income 0.33
Retail and marketing 0.10
Administration and other 0.04
Warehousing and distribution 0.02
LCBO’S EXTERNAL ENVIRONMENT
Beverage alcohol sales are not immune to economic downturns, but are often “cushioned”from the effects. The LCBO business plan for 2009–10 anticipated three key shifts resultingfrom slower economic activity: trading down by customers to less expensive products, greaterhome consumption and less dining out, and increased support for local producers.
During fiscal 2009–10, LCBO net sales increased 0.9 per cent over the previous year. Duringthe same time frame, Ontario’s total retail sector experienced a sales growth of 0.1 per cent.
In the first half of the year, the provincial economy was caught in the turmoil of the globaleconomic crisis that began in October 2008. Unemployment levels had risen to more than9.0 per cent and consumer confidence was low. Demand from the U.S., the province’s largesttrading partner, remained at decreased levels. Despite these challenges, LCBO sales increased1.2 per cent year-over-year during the first seven selling periods of the year. Provincial retailsales declined 4.0 per cent over the same timeframe.
The Ontario economy started to recover going into the second half of the year. Trade beganto accelerate, stock markets rebounded, and domestic spending increased, spurred by risingconfidence and low interest rates. However, unemployment remained elevated from the previousyear and the LCBO began to feel the impact. From October 2009 to the end of the year,LCBO net sales growth slowed, up 0.5 per cent compared to a year earlier. Conversely, thetotal provincial retail sector made strides from the lows of the previous year and posted salesgrowth of 4.5 per cent.
While the final outcome for fiscal 2009–10 outperformed the original plan, the three keyshifts predicted in the LCBO annual business plan occurred. Faced with tighter householdbudgets, LCBO customers purchased more wine than the previous year, but at a lower pricepoint. Despite the modest net sales dollars increase, LCBO litre sales increased by more than2.0 per cent. Also, as expected, sales to bars and restaurants declined by almost 7.0 per centduring the year, offset by a 2.0 per cent improvement in sales to home consumers. Finally,local producers experienced strong sales during the year and supported overall growth at theLCBO – sales of Ontario VQA table wine and beer produced by Ontario craft brewers wereimpressive, with respective growth of 19.0 and 49.0 per cent.
Weather also impacted LCBO sales during the year. A cool and wet summer constrainedgrowth, while a mild winter and early spring provided a boost.
MANAGEMENT DISCUSSION AND ANALYSIS OF OPERATIONS
annual report 2009–10 L C B O 39

SALES BY REGION
Despite challenging economic conditions, LCBO’s four retail regions achieved positive year-over-year net sales growth in fiscal 2009–10.
The following table shows regional net sales and growth performance compared to theprevious year.
2009–10 change fromRegion ($000) 2008–09
Northern 531,356 0.7%
Eastern 882,444 1.8%
Central 1,374,055 1.6%
Western 937,480 1.0%
COMPARABLE STORE SALES
“Comparable stores” are defined as stores that have been open in their present location for morethan two years. “Non-comparable stores” include stores open less than two years and closedstores. In 2009–10, owing to seven new locations and nine store relocations, non-comparablestores posted net sales growth of 28.1 per cent over the previous year. Comparable storesexperienced a slight net sales decline of 0.3 per cent. This reinforces the important contributionof investments in the retail store network.
Comparable vs Non-Comparable Store Sales Growth in 2009–10
Comp Stores Non-Comp Stores
Comp Stores Non-Comp Stores
-0.3%
28.1%
MANAGEMENT DISCUSSION AND ANALYSIS OF OPERATIONS
annual report 2009–10L C B O40

SALES BY CHANNEL
LCBO sales to home consumers through the retail channel increased to $3.41 billion duringfiscal 2009–10, rising 1.8 per cent over the previous year. Retail sales as a share of total LCBOsales increased 70 basis points to 79.1 per cent.
Sales through the licensee channel, which includes hotels and restaurants, were most affectedby the economic downturn, declining 6.6 per cent to $421 million during the year. As a percent-age of total LCBO sales, licensee sales decreased 80 basis points during the year to 9.8 per cent.
LCBO wholesale sales to The Beer Store (TBS) totalled $311 million during the year, up1.2 per cent from 2008–09. TBS sales as a percentage of total LCBO sales remained steady at7.2 per cent.
Breakdown of LCBO sales by channel
Retail 79.1%
Licensee 9.8%
TBS 7.2%
Agency 2.2%
Direct Delivery 1.0%
Duty-free 0.6%
Other 0.1%
LCBO sales to duty-free stores at airport and land border points increased for the first timesince fiscal 2004–05, rising 2.8 per cent year-over-year.
Agency store sales grew 3.6 per cent during the year to $94 million. As a percentage oftotal LCBO sales, agency store sales share increased 10 basis points to 2.2 per cent.
The direct delivery program, which enables Ontario wineries to deliver their products –predominantly VQA wines – directly to licensees, experienced a net sales decline of 0.6 per centyear-over-year. Given the larger overall decline in the licensee channel, direct delivery salesimproved to 17.4 per cent of the total value of the licensee market for wine in 2009–10,compared to 16.2 per cent the previous year.
LCBO IN THE SHARED MARKETPLACE
The LCBO operates in a shared marketplace along with other retailers of beverage alcohol inthe Province of Ontario, including The Beer Store (TBS), which is owned by Molson-Coors,Labatt (InBev SA) and Sleeman (Sapporo), Ontario winery retail stores (WRS), on-site breweryand distillery stores and duty-free operators. Furthermore, the LCBO has authorized establishedretailers in smaller Ontario communities to sell alcoholic beverages in conjunction with theirother goods. These agency stores sell spirits, wine and imported beer purchased from the LCBOand domestic beer purchased from TBS or other domestic beer suppliers.
MANAGEMENT DISCUSSION AND ANALYSIS OF OPERATIONS
annual report 2009–10 L C B O 41

As of March 31, 2010, there were 1,776 outlets selling alcohol in Ontario. Here is what themarket looked like:
Ontario’s alcohol marketplace by number of outlets
Note: When the LCBO’s 611 stores and Ontario’s 216 LCBO agency stores are combined, the total market share is approximately47.0 per cent.
CHANGES IN MARKET SHARE
The total Ontario beverage alcohol marketplace, which includes LCBO, TBS, WRS, as wellas other legal (e.g., ferment on premise), homemade and illegal1 channels, amounted to nearly$9.7 billion in gross sales during 2009–10. The LCBO’s market share by value declined to50.0 per cent from 50.8 per cent in 2008–092.
In fiscal 2009–10, total volume sales in the Ontario wine market rose 2.7 per cent overthe previous year. Imported wine accounted for 61.4 per cent of wines sold in the province,up 30 basis points from a year ago. Wine from Ontario decreased 10 basis points to 38.3 per centshare – Ontario wine sold at the LCBO increased 20 basis points while sales through wineryretail stores as well as delivered directly by Ontario wineries decreased 30 basis points duringthe year.
While Ontario wine sold at the LCBO increased 3.7 per cent during the year, improvingits share of the wine market to 22.3 per cent, sales through winery retail stores were essentiallyflat in fiscal 2009–10 and its share declined to 13.7 per cent. Direct delivery sales maintaineda 2.3 per cent market share.
LCBO
Ontario Winery Retail
The Beer Store
611
448
440
LCBO Agency216
Land Border Point Duty-free10
Airport Duty-free4
On-site Distillery Retail3
44 On-site Brewery Retail
MANAGEMENT DISCUSSION AND ANALYSIS OF OPERATIONS
annual report 2009–10L C B O42
1 Illegal channel sales consist of LCBO estimates for smuggling and illegal wine manufacturing. Smuggling is estimated basedon the variance between Ontario’s expected per capita consumption of spirits (based on its relationship to U.S. per capita con-sumption in 1981) and Ontario’s current actual per capita consumption. Illegal wine manufacturing is estimated by obtainingimported grape juice for wine-making data from Statistics Canada and deducting the legal and reliable uses for the raw mate-rial. The dollar value is based on the comparable average value of product sold through the LCBO and not the actual streetvalue. Current findings and trends are also considered in the estimation of illegal channel sales.2 See Ontario Sales Channel Summary on page 84 for further detail.

MANY LCBO STORES OFFER CUSTOMERS THE OPPORTUNITY TO TRY BEFORETHEY BUY.

Wine volume market share, 2009–10 (2008–09 share in brackets)
LCBO Imported 61.4% (61.1%)
LCBO Ontario 22.3% (22.1%)
Wine Retail Stores 13.7% (14.0%)
Direct Delivery 2.3% (2.3%)
LCBO Domestic – Other 0.4% (0.5%)
Volume sales of beer in Ontario decreased 1.1 per cent in 2009–10 compared to a year earlier.However, beer sold at the LCBO, excluding sales to TBS, grew by 4.7 per cent as sales at TBSdeclined 2.6 per cent versus 2008–09. As a result, LCBO’s volume market share increased to20.8 per cent from 19.6 per cent last year. TBS’s volume market share declined to 79.2 per centfrom 80.4 per cent over the same period.
Beer volume market share, 2009–10 (2008–09 share in brackets)
TBS Domestic 71.8% (73.1%)
LCBO Domestic 11.9% (11.1%)
LCBO Imported 8.9% (8.5%)
TBS Imported 7.4% (7.3%)
OPERATING RESULTS
Gross MarginGross margin increased to $2.11 billion in 2009–10, an improvement of 2.2 per cent fromthe previous year and 4.7 per cent more than plan. Expressed as a percentage of net sales,gross margin was 48.9 per cent, an improvement from 48.3 per cent last year and higher thanthe budgeted 48.5 per cent. The favourable variance to plan was primarily due to better thananticipated spirits and wine sales. The year-over-year improvement was supported by strong wineand beer sales as well as better inbound freight costs during the first half of the year (relatingto the ocean freight contract signed in July 2008).
MANAGEMENT DISCUSSION AND ANALYSIS OF OPERATIONS
annual report 2009–10L C B O44
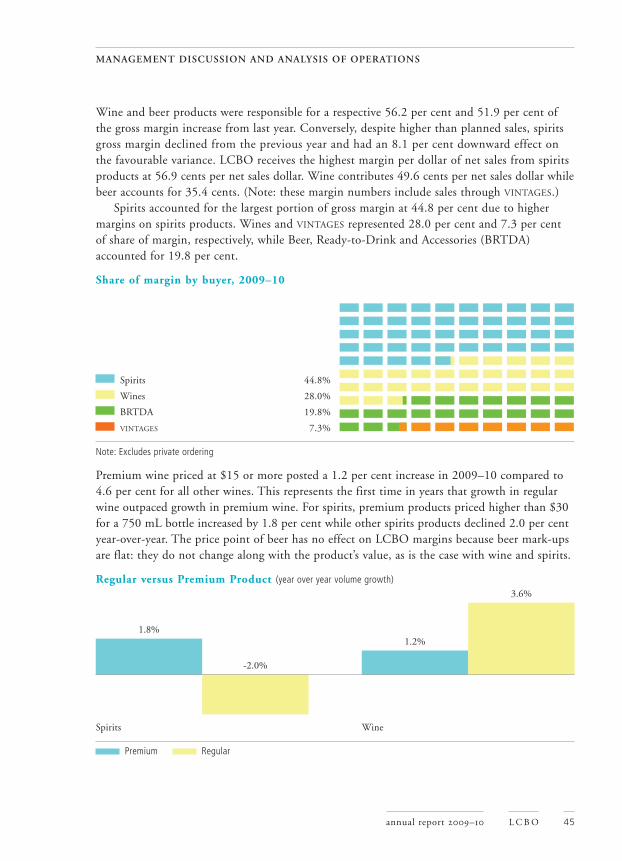
Wine and beer products were responsible for a respective 56.2 per cent and 51.9 per cent ofthe gross margin increase from last year. Conversely, despite higher than planned sales, spiritsgross margin declined from the previous year and had an 8.1 per cent downward effect onthe favourable variance. LCBO receives the highest margin per dollar of net sales from spiritsproducts at 56.9 cents per net sales dollar. Wine contributes 49.6 cents per net sales dollar whilebeer accounts for 35.4 cents. (Note: these margin numbers include sales through VINTAGES.)
Spirits accounted for the largest portion of gross margin at 44.8 per cent due to highermargins on spirits products. Wines and VINTAGES represented 28.0 per cent and 7.3 per centof share of margin, respectively, while Beer, Ready-to-Drink and Accessories (BRTDA)accounted for 19.8 per cent.
Share of margin by buyer, 2009–10
Spirits 44.8%
Wines 28.0%
BRTDA 19.8%
VINTAGES 7.3%
Note: Excludes private ordering
Premium wine priced at $15 or more posted a 1.2 per cent increase in 2009–10 compared to4.6 per cent for all other wines. This represents the first time in years that growth in regularwine outpaced growth in premium wine. For spirits, premium products priced higher than $30for a 750 mL bottle increased by 1.8 per cent while other spirits products declined 2.0 per centyear-over-year. The price point of beer has no effect on LCBO margins because beer mark-upsare flat: they do not change along with the product’s value, as is the case with wine and spirits.
Regular versus Premium Product (year over year volume growth)
Spirits Wine
Premium Regular
1.8%
-2.0%
1.2%
3.6%
MANAGEMENT DISCUSSION AND ANALYSIS OF OPERATIONS
annual report 2009–10 L C B O 45

In 2009–10, beer and wine sales gained share of total LCBO sales volume at the expense ofspirits. Beer sales share increased 0.6 per cent from the previous year to 51.9 per cent and winesales share improved 0.2 per cent to 29.1 per cent. Spirits sales share declined to 19.0 per centfrom 19.8 per cent in 2008–09.
Change in share of LCBO sales volume
Beer Wine Spirits
ExpensesTotal expenses came in at $710 million, 0.4 per cent below budget and 4.0 per cent higher thanthe previous year.
From a divisional perspective, expenses increased $13 million or 2.4 per cent compared tofiscal 2008–09, but remained 1.2 per cent below plan. Wage increases related to a new collec-tive agreement as well as higher occupancy costs relating to new and upgraded stores primarilycontributed to the variance. Retail division expenses increased $17 million or 4.4 per cent overthe previous year – salaries and benefits were almost $10 million higher, $8 million of whichwas bargaining unit related, and rent-related accounts were up over $7 million. Logistics expe-rienced a 3.1 per cent increase in costs, primarily due to wage increases, while administrationexpenses were essentially flat, down 0.6 per cent year-over-year. Sales and Marketing reducedtheir expenses by over $4 million or 16.5 per cent during the year.
Non-divisional expenses were 2.9 per cent more than budget and 10.7 per cent morethan in the previous year. The unfavourable variance was related to unexpected charges underemployee benefit obligations relating to an actuarial assessment3. This variance was eased bysavings in outbound freight, $2 million or 7.1 per cent lower than last year, and $17 millionin unredeemed bottle deposits that were offset against environmental expenses.
In fiscal 2009–10, the expense-to-net-sales ratio was better than the planned target of17.2 per cent, but increased to 16.5 per cent from the previous year’s level of 16.0 per cent.Each one per cent difference in the ratio represents a change of approximately $40 million.
0.6%
0.2%
-0.8%
MANAGEMENT DISCUSSION AND ANALYSIS OF OPERATIONS
annual report 2009–10L C B O46
3 See note 5 in the Notes to Financial Statements section

Expense trend (values in $000)
05–06 06–07 07–08 08–09 09–10
Expenses Expense to net sales ratio
InventoryEffective planning and control resulted in improved total inventory turns in 2009–10, coming inat 7.5, 0.3 turns better than plan and 0.4 more turns than last year. Amongst product categories,turns for wines, excluding VINTAGES, rose from 6.0 last year to 6.4, inventory turns for spiritsincreased to 8.8 from 8.5, VINTAGES improved to 3.0 from 2.9, and Beer, Ready-to-Drink andAccessories moved to 14.7 from 13.9.
Warehouse inventory turns increased to 12.9 from 11.6 a year ago and over the budgeted tar-get of 12.1. Retail inventory turns remained static at 13.1, which was 0.2 turns more than plan.
Total inventory turns
05–06 06–07 07–08 08–09 09–10
Note: Retail and total inventory turns have been restated for years 2005–06 to 2008–09 for Section 3031 adjustment.
Financial and Operating RatiosIncome statement ratio performance was generally positive in 2009–10.
Net income came in at 33.3 per cent of net sales for the year. This result surpassed lastyear’s ratio of 33.0 per cent and the budgeted ratio of 31.9 per cent.
Gross margin as a percentage of net sales was 48.9 per cent for the year, an improvementfrom the target of 48.5 per cent and the previous year’s ratio of 48.3 per cent4.
7.5 7.4 7.47.1
7.5
592,963632,753
659,429682,526
709,570
16.2% 16.2%16.1%
16.0%
16.5%
MANAGEMENT DISCUSSION AND ANALYSIS OF OPERATIONS
annual report 2009–10 L C B O 47
4 See Gross Margin section on page 44 for further detail.

Administrative expenses as a percentage of net sales were 20 basis points better than plan at1.5 per cent, the same as last year. Operating expenses were 11.7 per cent of net sales, 20 basispoints more than last year but 40 basis points below plan.
Productivity RatiosTo help track expenses and to identify where improvements are occurring, or are needed, theLCBO sets targets for many productivity ratios each year. For example, the store expenses-to-sales ratio shows what percentage of net sales is needed to pay retail expenses such as salaries,store rents and other expenses.
Retail – Financial and Operating Highlights
05–06 06–07 07–08 08–09 09–10
Store salary to sales 7.0% 6.8% 6.8% 6.9% 7.0%
Store expenses as percentage of sales 10.3% 10.0% 10.0% 10.0% 10.4%
Store salary per unit sold $ 0.76 $ 0.74 $ 0.72 $ 0.72 $ 0.71
Store expenses per unit sold $ 1.12 $ 1.08 $ 1.05 $ 1.05 $ 1.05
Unit sales per hour 34.9 36.7 38.6 39.8 41.5
Sales per customer $ 31.57 $ 32.41 $ 33.08 $ 33.25 $ 32.60
Sales per square foot $ 1,816 $ 1,898 $ 1,885 $ 1,878 $ 1,808
LCBO retail store salaries as a percentage of net sales increased 10 basis points from the previousyear to 7.0 per cent in 2009–10. Store salaries per unit sold improved to $0.71, better than theplanned value of $0.74.
Store expenses as a percentage of sales increased to 10.4 per cent, higher than 10.0 per centlast year, but better than the plan of 10.6 per cent. Store expenses per unit sold wereunchanged at $1.05, outperforming the planned amount of $1.08.
Sales per customer figures had been improving steadily over the past four years, rising from$31.57 in 2005–06 to $33.25 in 2008–09 as customers trended toward premium products.Economic pressures resulted in a shift to thrift during 2009–10 and many customers tradeddown to lower priced products. Average sales per customer decreased to $32.60.
Average sales per customer
05–06 06–07 07–08 08–09 09–10
31.57 32.41 33.08 33.25 32.60
MANAGEMENT DISCUSSION AND ANALYSIS OF OPERATIONS
annual report 2009–10L C B O48

SALES OF SINGLE-SERVE CANS CONTINUE TO DRIVE CATEGORY GROWTH. THE SEGMENT HAS TRIPLED IN VOLUME DURING THE LAST SIX YEARS.

Store sales per square foot declined to $1,808 partly due to the “trading down” effect, but alsodue to the additional square footage in newly-opened stores. This result is below the previousyear’s figure of $1,878, but better than the planned amount of $1,701.
Average sales per square foot
05–06 06–07 07–08 08–09 09–10
LCBO logistics productivity ratios were mostly favourable. Distribution cases per hour increasedto 74 in 2009–10, one more than last year but well over the target of 70. Warehouse cost percase (excluding freight) increased slightly to $1.22, remaining below the $1.27 plan. Salary costper case was static at $1.00, $0.05 less than the planned figure.
Freight expense per case was considerably lower than last year at $1.35 in 2009–10. The $0.31 per case decrease was primarily due to lower ocean freight expenses resulting fromlower rates in the new ocean freight contract signed in July 2008. Inbound freight as a percentageof sales improved to 2.0 per cent in 2009–10 while outbound freight continues to hold steadyat 0.7 per cent.
LOGISTICS – FINANCIAL AND OPERATING HIGHLIGHTS
05–06 06–07 07–08 08–09 09–10
Warehouse salary cost per case $ 0.93 $ 0.94 $ 0.98 $ 1.00 $ 1.00
Warehouse cost per case $ 1.16 $ 1.14 $ 1.19 $ 1.21 $ 1.22
Distribution cases per hour 64 68 70 73 74
Distribution expenses per case $ 0.68 $ 0.67 $ 0.70 $ 0.66 $ 0.66
Freight expense per case $ 1.67 $ 1.73 $ 1.79 $ 1.66 $ 1.35
Inbound freight as percentage of sales 2.7% 2.8% 2.8% 2.5% 2.0%
Outbound freight as percentage of sales 0.7% 0.7% 0.7% 0.7% 0.7%
1,816 1,898 1,885 1,878 1,808
MANAGEMENT DISCUSSION AND ANALYSIS OF OPERATIONS
annual report 2009–10L C B O50

Capital ExpendituresLCBO capital spending in 2009–10 continued to focus on upgrading more retail stores tocurrent corporate standards, increasing the total number of stores in the province and improvingservice in markets where population growth is occurring or is projected.
($000) 05–06 06–07 07–08 08–09 09–10
Retail 39,650 38,292 45,101 40,673 42,044
Retail Store Development and Real Estate 1,310 1,025 1,126 146 149
Information Technology 7,980 7,320 7,709 7,887 8,572
Logistics 2,464 3,332 2,433 3,108 3,875
Marketing Programs 666 1,225 1,274 1,402 1,132
Other Administrative Divisions 2,466 3,022 6,016 6,552 4,187
Total Capital Expenditures 54,535 54,217 63,659 59,769 59,959
LOOKING AHEAD
In fiscal 2010–11, LCBO net sales are forecast to increase to $4.41 billion, a year-over-yearincrease of 2.3 per cent.
Gross margin is forecast to improve by 3.9 per cent to $2.11 billion. Gross margin as apercentage of net sales is expected to rise to 49.7 per cent, up from 48.9 per cent in 2009–10.
Net income is forecast to be $1.48 billion in 2010–11, $45 million or 3.2 per cent morethan the previous year. As a result, the LCBO’s dividend to Ontario government is expected toincrease for the 17th consecutive year to $1.48 billion, $70 million more than in fiscal 2009–10.
MANAGEMENT DISCUSSION AND ANALYSIS OF OPERATIONS
annual report 2009–10 L C B O 51

annual report 2009–10L C B O52
INTERNATIONAL FINANCIAL REPORTINGSTANDARDS (IFRS)
In February 2008, the Canadian Institute of Chartered Accountants (CICA) announced thatCanadian GAAP (CGAAP) for publicly-accountable enterprises will be replaced by InternationalFinancial Reporting Standards (IFRS) for fiscal years beginning on or after January 1, 2011.LCBO is a government business enterprise, which reports under the same basis of accountingas publicly-accountable enterprises as directed by the Public Sector Accounting Standards Board.
Accordingly, the conversion from CGAAP to IFRS will be applicable to LCBO’s reportingfor the fiscal year ending March 31, 2012, for which the current and comparative informationwill be prepared under IFRS.
Given the magnitude of the effort involved in this conversion, the project has been devel-oped in three main phases.
ImplementationPhase
Description and Status
Scoping This phase involves performing a high-level impact assessment to identifykey areas that may be impacted by the transition to IFRS. As a result ofthese procedures, the potentially affected areas are ranked as high, mediumor low priority.
Based upon the current state of IFRS, this phase has been completed andLCBO had identified certain differences between CGAAP and IFRS thatmay impact financial results.
The International Accounting Standards Board (IASB) has activitiescurrently underway which may change IFRS and ultimately may impactLCBO. Any changes will be assessed as they occur.
Plan, design andbuild
In this phase, each impacted area identified from the scoping phase willbe further analyzed. This phase involves specification of changes requiredto existing accounting policies, information systems, internal controls overfinancial reporting, disclosure controls and procedures, and financial report-ing, together with an analysis of policy alternatives allowed under IFRS.
This phase is underway and is progressing as planned to make sure thefinancial statements are IFRS compliant by the first set of IFRS financialstatements at March 31, 2012. The key significant differences identifiedbetween IFRS and CGAAP that will affect LCBO’s accounting policiesare outlined here.

INTERNATIONAL FINANCIAL REPORTING STANDARDS (IFRS)
annual report 2009–10 L C B O 53
ImplementationPhase
Description and Status
Plan, design and build
(continued)Key elements of the plan that are currently in progress include, but arenot limited to:
Financial reporting and disclosures and accounting policies:• selection of accounting policy choices. This is expected to be substan-
tially completed by the fiscal year ending March 31, 2011;• preparation of financial statements and disclosures required under
IFRS. This is expected to be completed by the fiscal year endingMarch 31, 2012.
Information systems:• the review, development and implementation of information technology
required for current financial reporting requirements. Managementdoes not expect significant changes to the current information tech-nology and financial reporting platforms.
Internal controls over financial reporting and disclosure controls and procedures:• the review of existing control processes and procedures, including its
impact on internal control over financial reporting (ICFR) and disclosurecontrols and procedures, to address significant changes to existingaccounting policies. This is expected to be substantially completed by thefiscal year ending March 31, 2011 and thereafter for changes in IFRS.
Training and communication:• ongoing updates to the Audit Committee;• ongoing IFRS training to key personnel in various areas of the business,
which is continuing throughout 2010/2011; and• communication of the progress of the transition plan to staff and
stakeholders.
Implement andreview
This phase includes execution and testing of changes identified in theplan, build and design phase, and to approve recommended accountingpolicy changes and continue delivering training programs to LCBO staff,as required.

The following table summarizes our progress to date against the milestones contained in thekey elements of the transition plan:
INTERNATIONAL FINANCIAL REPORTING STANDARDS (IFRS)
annual report 2009–10L C B O54
Key Activity Milestones Progress at March 31, 2010
Project team and project management
• audit committee engagement• steering committee creation• technical advisory commit-
tee creation and training• engagement of external con-
sultants• building of project team
• project team in place byend of fiscal 2008–09 andmeeting plans in place forsteering committee andaudit committee communication.
• project team assembled bythe end of fiscal 2008–09,including engagement ofprofessional services firms.
• steering committee andtechnical advisory commit-tee meetings scheduledbased on project outputs.
• audit committee meetingupdates scheduled regularly.
Accounting policies and procedures
• identification of differencesbetween CGAAP and IFRSapplicable to LCBO.
• selection of the IFRSaccounting policies.
• determination of first-timeadoption of IFRS (alsoknown as IFRS 1) choices.
• complete diagnostic identi-fying major areas of differ-ence by the end of fiscal2007–08.
• evaluate accounting policyoptions and develop IFRSaccounting policy documentsbetween fiscal 2008–09 to2010–11.
• complete April 1, 2010opening balance sheet during fiscal 2010–11.
• IFRS scoping completed infiscal 2007–08.
• evaluation and analysis ofIFRS policy choices ongoing.
• opening balance sheet isbeing developed during fiscal 2010–11.
Financial statement preparation
• development of financialstatements under IFRS.
• make sure data required forenhanced note disclosureswill be available.
• develop draft IFRS financialstatements in conjunctionwith accounting policychoice selections.
• make sure all required data is available and auditableduring fiscal 2010–11.
• financial statements arebeing developed during fiscal 2010–11.
• project team within theorganization tasked withpreparing the note disclosures.

INTERNATIONAL FINANCIAL REPORTING STANDARDS (IFRS)
annual report 2009–10 L C B O 55
Key Activity Milestones Progress at March 31, 2010
Information technology impacts
• make sure systems are capa-ble to produce and reportIFRS required data.
• develop a dual reportingstrategy for the year in fiscal transition.
• review and modify thecurrent financial reportingsystems platform to incor-porate required changes for IFRS.
• design, implement and testdual reporting strategy.
• completed review of currentfinancial reporting systemsplatform in early fiscal2009–10. Concluded that no major changes are required to the generalledger platform to accom-modate transition year dualreporting requirements.
• ongoing monitoring andtesting of dual reportingstrategy to occur in fiscal2010–11.
Business impacts
• organizational performancemetric results based onCGAAP measures may differ under IFRS.
• budgeting functions for thefiscal 2011–12 adoptionyear will be impacted.
• process changes may impactinternal controls over finan-cial reporting.
• impacts on organizationalperformance metrics to bereviewed following finaliza-tion of IFRS accountingpolicy choices.
• budgeting for fiscal 2011–12to incorporate IFRS impactsonce final accounting policies selected.
• process changes due toIFRS implementation to bereviewed for impact and toensure compliance assuranceon internal controls.
• ongoing review of businessimpacts in fiscal 2010–11.
Training and communication
• make sure members of theproject team receive adequatetraining and guidance.
• provide communication of project status to internaland external stakeholdersin a timely manner.
• internal training to be pro-vided to personnel directlyimpacted by IFRS through-out implementation.
• external updates to be provided through regularlycommunication with theProvince of Ontario.
• key members of the projectteam have completed IFRSspecific training courses andare continuing to participatein additional training courses.
• ongoing communication withstaff and external stakeholdersthrough MD&A disclosuresthroughout 2010–11 and2011–12 fiscal years.
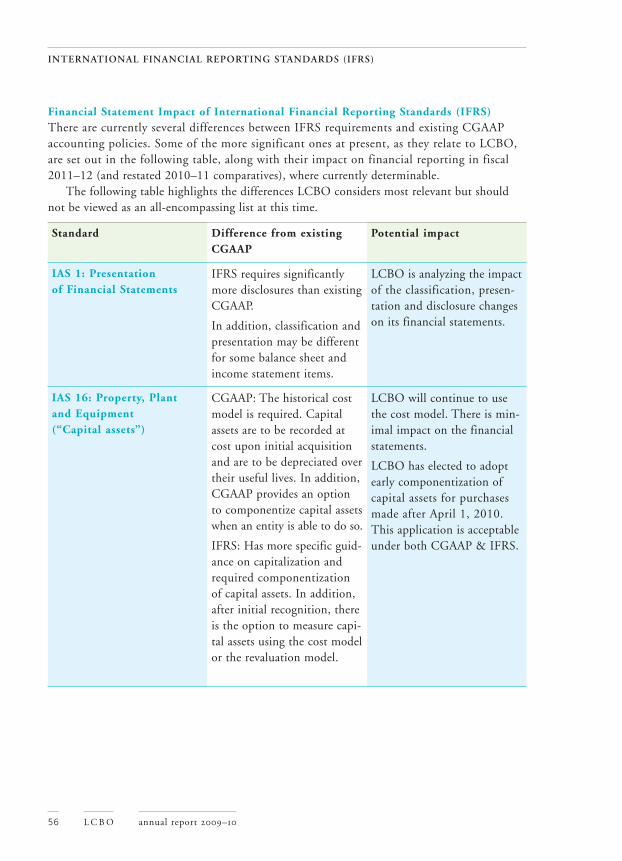
Financial Statement Impact of International Financial Reporting Standards (IFRS)There are currently several differences between IFRS requirements and existing CGAAPaccounting policies. Some of the more significant ones at present, as they relate to LCBO,are set out in the following table, along with their impact on financial reporting in fiscal2011–12 (and restated 2010–11 comparatives), where currently determinable.
The following table highlights the differences LCBO considers most relevant but shouldnot be viewed as an all-encompassing list at this time.
INTERNATIONAL FINANCIAL REPORTING STANDARDS (IFRS)
annual report 2009–10L C B O56
Standard Difference from existingCGAAP
Potential impact
IAS 1: Presentation of Financial Statements
IFRS requires significantlymore disclosures than existingCGAAP.
In addition, classification andpresentation may be differentfor some balance sheet andincome statement items.
LCBO is analyzing the impactof the classification, presen-tation and disclosure changeson its financial statements.
IAS 16: Property, Plant and Equipment (“Capital assets”)
CGAAP: The historical costmodel is required. Capitalassets are to be recorded atcost upon initial acquisitionand are to be depreciated overtheir useful lives. In addition,CGAAP provides an optionto componentize capital assetswhen an entity is able to do so.
IFRS: Has more specific guid-ance on capitalization andrequired componentizationof capital assets. In addition,after initial recognition, thereis the option to measure capi-tal assets using the cost modelor the revaluation model.
LCBO will continue to usethe cost model. There is min-imal impact on the financialstatements.
LCBO has elected to adoptearly componentization ofcapital assets for purchasesmade after April 1, 2010.This application is acceptableunder both CGAAP & IFRS.

Several IFRS standards are in the process of being amended by the International AccountingStandards Board (IASB), who are responsible for drafting and implementing the new standards.Amendments to existing standards are expected to continue until March 31, 2012.
At March 31, 2010, LCBO cannot reasonably determine the full impact adopting IFRSwould have on its financial statements. These disclosures reflect LCBO’s expectations based oninformation available at March 31, 2010. Changes in IFRS standards or circumstances relatingto LCBO may cause LCBO to revise its expectations, its project plan, and its potential IFRSaccounting policy choices prior to the conversion date.
INTERNATIONAL FINANCIAL REPORTING STANDARDS (IFRS)
annual report 2009–10 L C B O 57
Standard Difference from existingCGAAP
Potential impact
IAS 17: Leases CGAAP: CGAAP has estab-lished rule-based guidelinesto determine if leases shouldbe classified as operating leasesor capital leases.
IFRS: There are no specificrule-based guidelines todetermine whether the risksand rewards of ownership of the leased asset have beentransferred. Each asset mustbe assessed qualitatively todeterminate if leases shouldbe classified as operating leasesor finance (i.e. capital) leases.
LCBO is analyzing the impactof the changes on its financialstatements.
IAS 19: Employee Benefits CGAAP: Actuarial gains andlosses related to defined bene-fit obligations are recordedusing a 10 per cent corridorapproach.
IFRS: Actuarial gains and loss-es related to the revaluationof defined benefit obligationscan be recorded using a 10per cent corridor approach orcan be immediately recognizedin equity or net income.
LCBO has not finalized itsdecision with respect to theaccounting for actuarial gainsand losses.

IFRS 1: First-Time Adoption of IFRSA number of mandatory and optional exemptions and elections are available upon first-timeadoption of IFRS. LCBO has not fully analyzed and concluded on IFRS 1, but has madepreliminary analysis on some of the items in the table below.
INTERNATIONAL FINANCIAL REPORTING STANDARDS (IFRS)
annual report 2009–10L C B O58
Optional Exemption LCBO Election
Fair value or revaluation asdeemed cost
This exemption allows LCBO to initially measure an item ofcapital assets and intangible assets upon transition to IFRS atfair value or a previous GAAP valuation (i.e. historical cost).
LCBO does not intend to use this exemption; instead it willvalue capital assets and intangible assets using its historic costunder IFRS.
Employee benefits This exemption permits LCBO to reset the cumulative actuarialgains and losses to zero by recognizing the full amount in theretained earnings of the opening IFRS balance sheet.
LCBO is currently analyzing this election.
Borrowing costs This exemption allows LCBO to adopt IAS 23, which requiresthe capitalization of borrowing costs on all qualifying assets,prospectively from the date of the opening IFRS balance sheet.
LCBO is currently analyzing this election.

The preparation, presentation and integrity of the financial statements are the responsibilityof management. The accompanying financial statements of the Liquor Control Board of Ontariohave been prepared in accordance with Canadian generally accepted accounting principlesand include amounts that are based on management’s best estimates and judgment.
Management maintains a system of internal controls designed to provide reasonable assurancethat the assets are safeguarded and that reliable financial information is available on a timelybasis. The system includes formal policies and procedures and an organizational structure thatprovides for appropriate delegation of authority and segregation of responsibilities. An internalaudit function independently evaluates the effectiveness of these internal controls on an ongoingbasis and reports its findings to management and the Audit Committee of the Board.
The Board, through the Audit Committee, is responsible for ensuring that managementfulfills its responsibilities for financial reporting and internal controls. The Audit Committee,composed of four members who are not employees/officers of the LCBO, generally meetsperiodically with management, the internal auditors and the Office of the Auditor Generalto satisfy itself that each group has properly discharged its respective responsibility.
The financial statements have been audited by the Office of the Auditor General. The Auditor’s responsibility is to express an opinion on whether the financial statements are fairly presented in accordance with Canadian generally accepted accounting principles.The Auditor’s Report outlines the scope of the Auditor’s examination and opinion.
On behalf of management:
N. ROBERT PETER
President & Chief Executive Officer
J . ALEX BROWNING
Senior Vice-President, Finance & Administration, and Chief Financial Officer
June 10, 2010
RESPONSIBILITY FOR FINANCIAL REPORTING
annual report 2009–10 L C B O 59

To the Liquor Control Board of Ontario and to the Minister of FinanceI have audited the balance sheet of the Liquor Control Board of Ontario as at March 31, 2010
and the statements of income and retained income and cash flows for the year then ended.These financial statements are the responsibility of the Board’s management. My responsibilityis to express an opinion on these financial statements based on my audit.
I conducted my audit in accordance with Canadian generally accepted auditing standards.Those standards require that I plan and perform an audit to obtain reasonable assurancewhether the financial statements are free of material misstatement. An audit includes examining,on a test basis, evidence supporting the amounts and disclosures in the financial statements.An audit also includes assessing the accounting principles used and significant estimates madeby management, as well as evaluating the overall financial statement presentation.
In my opinion, these financial statements present fairly, in all material respects, the financialposition of the Board as at March 31, 2010 and the results of its operations and its cash flowsfor the year then ended in accordance with Canadian generally accepted accounting principles.
J IM M C CARTER, FCA
Auditor GeneralLicensed Public Accountant
Toronto, OntarioJune 10, 2010
AUDITOR’S REPORT
annual report 2009–10L C B O60

($000) 2010 2009
ASSETS
Current
Cash and cash equivalents 217,791 162,098
Accounts receivable, trade and others 23,705 21,612
Inventories (Note 3) 344,534 342,860
Prepaid expenses 13,574 16,889
599,604 543,459
Long-term
Capital assets & intangible assets (Note 4) 294,446 259,986
894,050 803,445
LIABILITIES AND RETAINED INCOME
Current
Accounts payable and accrued liabilities 436,397 389,802
Current portion of non-pension employee future benefits (Note 5) 5,925 4,915
442,322 394,717
Long-term
Non-pension employee future benefits (Note 5) 71,942 54,552
Retained income 379,786 354,176
894,050 803,445
Commitments and Contingencies (Notes 6 and 9)
See accompanying notes to financial statements.
Approved by:
Chair
Board Member, Chair Audit Committee
BALANCE SHEETAs at March 31, 2010
annual report 2009–10 L C B O 61

($000) 2010 2009
Sales and other income 4,344,099 4,297,642
Cost and expenses
Cost of sales 2,198,920 2,204,942
Retail stores and marketing 477,517 450,345
Warehousing and distribution 85,913 88,845
Administration 97,424 96,930
Amortization 48,716 46,406
2,908,490 2,887,468
Net income for the year 1,435,609 1,410,174
Retained income, beginning of year 354,176 340,238
Adjustment to opening retained income resulting from adoption of new accounting standards for inventories (Note 2e) – 3,764
1,789,785 1,754,176
Deduct
Dividend paid to the Province of Ontario 1,410,000 1,395,000
Payment on behalf of the Province of Ontario (Note 10) – 5,000
1,410,000 1,400,000
Retained income, end of year 379,785 354,176
See accompanying notes to financial statements.
STATEMENT OF INCOME AND RETAINED INCOMEYear Ended March 31, 2010
annual report 2009–10L C B O62

($000) 2010 2009
Cash provided from operations
Net income 1,435,609 1,410,174
Amortization 48,716 46,406
(Gain) Loss on sale of capital assets 318 (1,330)
1,484,643 1,455,250
Net change in non-cash items increase/(decrease)
Accounts Receivable, trade and others (2,093) 4,512
Inventory (1,674) (3,741)
Prepaids 3,315 1,514
Accounts Payable and accrued liabilities 46,595 26,381
Employee future benefits 18,400 (5,967)
1,549,186 1,477,949
Cash used for investment activities
Purchase of capital assets (84,148) (59,769)
Proceeds from sale of capital assets 655 2,266
(83,493) (57,503)
Cash used for financing activities
Dividend paid to the Province of Ontario (1,410,000) (1,395,000)
Payment on behalf of the Province of Ontario – (5,000)
(1,410,000) (1,400,000)
Increase in cash during the year 55,693 20,446
Cash and cash equivalents, beginning of year 162,098 141,652
Cash and cash equivalents, end of year 217,791 162,098
See accompanying notes to financial statements.
STATEMENT OF CASH FLOWSYear Ended March 31, 2010
annual report 2009–10 L C B O 63

1. NATURE OF THE CORPORATION
The Liquor Control Board of Ontario (Board) is a corporation without share capital incorporatedunder the Liquor Control Act, R.S.O. 1990, Chapter L.18. The corporation is a governmententerprise responsible for regulating the production, importation, distribution and sale ofalcoholic beverages in the Province of Ontario. As an Ontario Crown Corporation, the Boardis exempt from income taxes under Section 149(1)(d) of the Canadian Income Tax Act. The Board transfers most of its profits to the Province of Ontario’s Consolidated RevenueFund in the form of a dividend.
2. SIGNIFICANT ACCOUNTING POLICIES
(a) Basis of AccountingThe Board’s financial statements are prepared in accordance with Canadian generally acceptedaccounting principles.
(b) Use of EstimatesThe preparation of financial statements requires management to make estimates and assumptionsthat affect the reported amount of assets and liabilities at the date of the financial statementsand the reported amounts of revenues and expenses during the reporting period. Actual resultscould differ from those estimates.
(c) Financial InstrumentsUnder CICA Section 3855 “Financial Instruments – Recognition and Measurement”, financialinstruments are classified into one of the following five categories: held-for-trading, held-to-maturity, loans and receivables, available-for-sale financial assets or other financial liabilities.All financial instruments are measured at fair value upon initial recognition except for certainrelated party transactions. After initial recognition, financial instruments are measured at theirfair values, except for financial assets classified as held-to-maturity, loans and receivables andother financial liabilities, which are measured at cost or amortized cost, using the effectiveinterest rate method.
The Board’s financial assets and liabilities are classified as follows:• Cash and cash equivalents are classified as held-for-trading and recorded at fair value.• Accounts receivable, trade and others are classified as loans and receivables and are measured
at amortized cost, which approximates fair value given their short-term nature.• Accounts payable and accrued liabilities are classified as other financial liabilities and are
recorded at amortized cost. Accounts payable and accrued liabilities are generally shortterm in nature and due within one year of the balance sheet date.
• Derivative financial instruments are classified as held-for-trading and recorded at fair value.The Board enters into foreign exchange forward contracts to manage its exposure to foreignexchange rate risk. The fair value of such derivative financial instruments is determined byreference to current market exchange rates and any gains or losses are included in theStatement of Income and Retained Income.
NOTES TO FINANCIAL STATEMENTSMarch 31, 2010
annual report 2009–10L C B O64

Effective April 1, 2008, the Board adopted CICA Handbook Section 3862 “FinancialInstruments – Disclosures” and Section 3863 “Financial Instruments – Presentations”, whichreplaced Section 3861, “Financial Instruments – Disclosure and Presentation”. The disclosurerequirements in Section 3862 require increased disclosures regarding the risks associated withfinancial instruments such as credit risk, foreign exchange risk, liquidity risk and the techniquesused to identify, monitor and manage these risks. Section 3863 essentially carries forward thestandards for presentation of financial instruments and non-financial derivatives previouslyfound in Section 3861. The adoption of Section 3862 and Section 3863 did not have animpact on the Board’s financial results or position. See Note 7 for the resulting disclosuresfrom implementation.
(d) Cash and Cash EquivalentsCash and cash equivalents comprise cash and highly liquid investments with original maturitydates of less than 90 days.
The Board’s investment policy restricts short-term investments to high liquidity, high-grademoney market instruments such as federal/provincial treasury bills, banker’s acceptances andterm deposits.
(e) InventoriesEffective April 1, 2008, the Board implemented CICA Handbook Section 3031 “Inventories,”which replaces Section 3030 of the same title. The new standard provides guidance on thedetermination of cost and requires inventories to be measured at the lower of cost and net real-izable value – with cost being determined using the first-in, first-out or weighted average costmethod. Reversal of previous write-downs to net realizable value is now required when thereis a subsequent increase in the value of inventories. The new standard also requires additionaldisclosures including the accounting policies used in measuring inventories, the carrying amountsof the inventories, amounts recognized as an expense during the period, write-downs and theamount of any reversal of any write-downs recognized as a reduction in expenses.
The Board values inventories at the lower of cost and net realizable value with cost beingdetermined by the weighted average cost method. Cost includes the cost of purchase net ofvendor allowances and includes other direct costs, such as transportation and direct warehousehandling costs that are incurred to bring inventories to their present location and condition.Storage costs, indirect administrative overhead and certain selling costs related to inventoriesare expensed in the period that these costs are incurred. The Board estimates net realizablevalue as the amount that inventories are expected to be sold at less than the estimated costsnecessary to make the sale. Inventories are written down to net realizable value when the costof inventories is not estimated to be recoverable due to obsolescence, damage or decliningselling prices. The resulting disclosures are presented in Note 3.
NOTES TO FINANCIAL STATEMENTS
March 31, 2010
annual report 2009–10 L C B O 65

In accordance with the transitional provisions allowed under Section 3031, the Board haselected to treat the difference in inventory measurement as a retrospective adjustment toopening retained income without restatement of prior periods. The initial impact of measuringinventories under the new standard resulted in an increase to the carrying amount of openinginventories and retained income as at April 1, 2008 of $3.8 million.
(f ) Capital AssetsMajor capital expenditures with a future useful life beyond the current year are capitalized at costand are amortized on a straight-line basis according to their estimated useful lives, as follows:
Buildings 20 yearsFurniture and Equipment 5 yearsLeasehold Improvements Lesser of the average remaining lease term and estimated
useful life of the improvementsComputer Equipment 3 years or 4 yearsConstruction in progress includes assets not available for use which are not amortized.Minor capital expenditures and expenditures for repairs and maintenance are charged
to income.
(g) Intangible AssetsIn February 2008, the CICA adopted Handbook Section 3064, “Goodwill and Intangible Assets,”which replaces CICA Handbook Section 3062, “Goodwill and Other Intangible Assets,” andestablishes standards for the recognition, measurement, presentation and disclosure of goodwilland intangible assets. This section applies to annual and interim financial statements relatingto fiscal years beginning on or after October 1, 2008.
The Board adopted the Handbook Section on April 1, 2009 and reclassified prior periodcomparative amounts from property, plant and equipment to intangible assets.
Intangible assets, which lack physical substance, are stated at cost. Amortization is providedon a straight-line basis over their estimated useful service lives, as follows:
Computer software 3 years or 4 yearsSoftware in development includes assets not yet available for use which are therefore
not amortized.
(h) Employee Future Benefitsi. Pension PlanThe Board provides pension benefits for all its permanent employees (and to non-permanentemployees who elect to participate) through the Public Service Pension Fund (PSPF) and theOntario Public Service Employees’ Union Pension Fund (OPSEU Pension Fund), which aremulti-employer defined benefit pension plans. The Province of Ontario, which is the sole sponsorof the PSPF and a joint sponsor of the OPSEU Pension Fund, determines the Board’s annualcontribution to the funds. As the sponsors are responsible for ensuring that the pension fundsare financially viable, any surpluses or unfunded liabilities arising from statutory actuarial fundingvaluations are not assets or obligations of the Board. See Note 5 for the resulting disclosures.
NOTES TO FINANCIAL STATEMENTS
March 31, 2010
annual report 2009–10L C B O66

ii. Non-pension Employee Future BenefitsEmployee future benefits other than those provided by the Province include accrued contractualseverance payments, executive compensation time banking, unfunded workers compensationobligation and unused vacation entitlements. These plans provide benefits to employees whenthey are no longer providing active service. The Board accrues these employee future benefitsover the periods in which the employees earn the benefits. The cost of other post-retirement,non-pension employee benefits is paid by the Province and is not included in the Statementof Income and Retained Income.
The cost of the contractual severance payments and executive compensation time bankingwas actuarially determined by using the Projected Unit Credit Method and management’s bestestimate. The unfunded workers compensation liability was determined using the AverageAwards Method. The annual benefit cost is the sum of the service cost, one year’s interestcost and any amortization of gains and losses. The net actuarial gains and losses are amortizedon a straight-line basis over the expected average remaining service lifetime of the employee.See Note 5 for the resulting disclosures.
(i) Revenue RecognitionRevenue is recognized when the sale of products is made to customers.
(j) Expense RecognitionExpenses are recognized as incurred, on an accrual basis, in the period to which they relate.
(k) LeasesThe Board leases most of its retail locations and office space. Terms vary in length and typicallypermit renewal for additional periods. Minimum rent, including scheduled escalations and anyrent free periods, are expensed on a straight-line basis over the term of the lease. Landlordinducements are deferred and amortized as reductions to rent expense on a straight-line basisover the same period.
3. INVENTORIES
The cost of inventories sold during the year and recognized as a cost of sales expense duringthe year ended March 31, 2010 was $2,199 million (2009 – $2,205 million). There were nosignificant write-downs or reversal of previous write-downs to net realizable value during theyear ended March 31, 2010 (2009 – nil).
NOTES TO FINANCIAL STATEMENTS
March 31, 2010
annual report 2009–10 L C B O 67
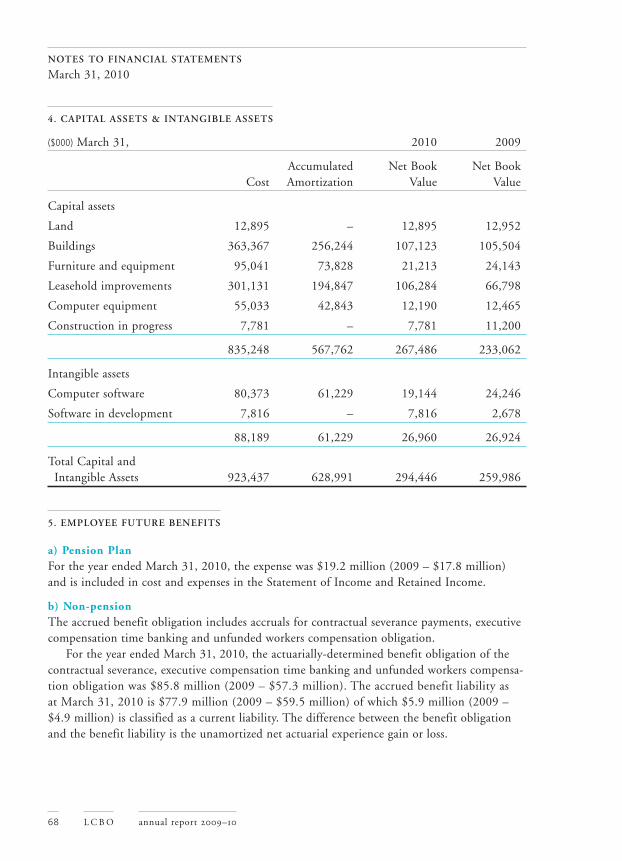
4. CAPITAL ASSETS & INTANGIBLE ASSETS
($000) March 31, 2010 2009
Accumulated Net Book Net BookCost Amortization Value Value
Capital assets
Land 12,895 – 12,895 12,952
Buildings 363,367 256,244 107,123 105,504
Furniture and equipment 95,041 73,828 21,213 24,143
Leasehold improvements 301,131 194,847 106,284 66,798
Computer equipment 55,033 42,843 12,190 12,465
Construction in progress 7,781 – 7,781 11,200
835,248 567,762 267,486 233,062
Intangible assets
Computer software 80,373 61,229 19,144 24,246
Software in development 7,816 – 7,816 2,678
88,189 61,229 26,960 26,924
Total Capital and Intangible Assets 923,437 628,991 294,446 259,986
5. EMPLOYEE FUTURE BENEFITS
a) Pension PlanFor the year ended March 31, 2010, the expense was $19.2 million (2009 – $17.8 million)and is included in cost and expenses in the Statement of Income and Retained Income.
b) Non-pensionThe accrued benefit obligation includes accruals for contractual severance payments, executivecompensation time banking and unfunded workers compensation obligation.
For the year ended March 31, 2010, the actuarially-determined benefit obligation of thecontractual severance, executive compensation time banking and unfunded workers compensa-tion obligation was $85.8 million (2009 – $57.3 million). The accrued benefit liability as at March 31, 2010 is $77.9 million (2009 – $59.5 million) of which $5.9 million (2009 –$4.9 million) is classified as a current liability. The difference between the benefit obligationand the benefit liability is the unamortized net actuarial experience gain or loss.
NOTES TO FINANCIAL STATEMENTS
March 31, 2010
annual report 2009–10L C B O68

The Board measures its accrued benefits obligation for accounting purposes as at March 31st
of each year. The latest actuarial valuation for the contractual severance and executive compen-sation time banking was performed as at March 31, 2010. The latest actuarial assessment forthe unfunded workers compensation was performed as at December 31, 2009. The Board willconduct an actuarial valuation of employee future benefits every three years; therefore, the nextvaluation will be done for the year ending March 31, 2013.
($000’s) March 31 2010 2009
Employee Benefit plan assets – –
Employee benefit plan liabilities 85,838 57,349
Employee benefit plan deficit 85,838 57,349
Unamortized net actuarial experience gain/(loss) (7,971) 2,118
Accrued benefit liability 77,867 59,467
Benefit obligation recognized on the balance sheet
Benefit obligation, beginning of year 59,467 56,920
Expense for the year 27,185 10,360
Benefits paid during the year (8,785) (7,813)
Benefit obligation, end of year 77,867 59,467
The cost of unused vacation entitlements is accrued and included in Accounts payable andaccrued liabilities on the Balance Sheet. As at March 31, 2010, $9.3 million (2009 – $8.4 million)was accrued.
6. LEASE COMMITMENTS
The Board is committed under operating leases on leased premises with future minimumrental payments due as follows:
($000)
2011 55,459
2012 55,839
2013 52,662
2014 49,356
2015 45,915
Thereafter 364,942
624,173
NOTES TO FINANCIAL STATEMENTS
March 31, 2010
annual report 2009–10 L C B O 69
7. FINANCIAL INSTRUMENTS
The Board’s financial instruments consist of cash and cash equivalents, accounts receivable,trade and others, accounts payable and accrued liabilities and derivative financial instruments.The carrying values of these instruments approximate fair value due to the short-termmaturities of these instruments.
(a) Foreign Exchange RiskThe Board is exposed to foreign exchange risk principally through transactional exposure,from the cost of future purchases of goods for resale, where those purchases are denominatedin a currency other than Canadian dollars. The Board is exposed to foreign currency risk arisingfrom various currency exposures, primarily with respect to US dollars and euros.
To manage foreign exchange risk associated with its purchases from foreign suppliers, theBoard is authorized to enter into foreign exchange forward contracts, which are commitments topurchase foreign currencies at a specified date in the future at a fixed rate. As at March 31, 2010,the Board had no foreign exchange forward contracts (2009 – nil).
In the Board’s assessment, a significant strengthening or weakening of the Canadian dollaragainst the US dollar and euro, with all other variables held constant, would not have a significantimpact on earnings in comparison to the overall operations of the Board. For the year endedMarch 31, 2010, the Board recognized a net foreign exchange gain of $6.3 million (2009 –$0.2 million).
When the Board enters into inventory purchase contracts in a currency other than theCanadian dollar or that of the supplier’s home or local currency, an embedded derivative mayexist. Embedded derivatives (elements of contracts whose cash flows move independently fromthe host contract) are required to be separated and measured at their respective fair values exceptunder certain circumstances. For the year ended March 31, 2010, management reviewed thesecontracts and has determined that the Board does not have any significant embedded derivativesor gains/losses resulting from these derivatives that require separate accounting and disclosure(2009 – nil).
(b) Credit RiskCredit risk refers to the possibility that the Board can suffer financial losses due to failure ofthe Board’s counterparties to meet their payment obligations. Exposure to credit risk exists forderivative instruments, cash and cash equivalents and accounts receivable. The Board minimizescredit risks associated with derivative instruments and cash and cash equivalents by dealingonly with major Canadian chartered banks and Canadian subsidiaries of major foreign banks.
Accounts receivable arise primarily from sales billed to independent businesses, agents andother debtors. The Board does not consider its exposure to credit risk associated with accountsreceivable, trade and others to be material. As at March 31, 2010, approximately 68 per cent(2009 – 70 per cent) of the Board’s accounts receivable is due from one customer whoseaccount is in good standing.
NOTES TO FINANCIAL STATEMENTS
March 31, 2010
annual report 2009–10L C B O70
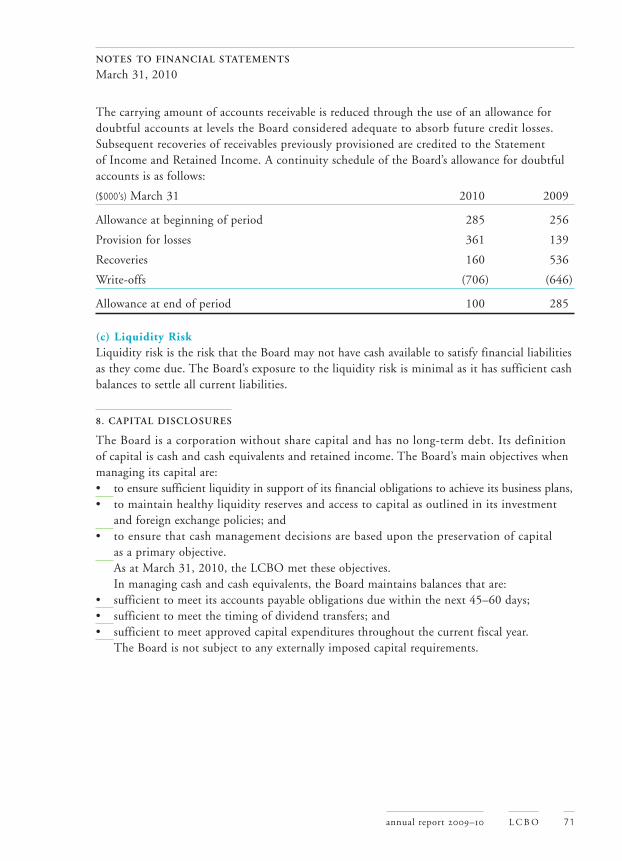
The carrying amount of accounts receivable is reduced through the use of an allowance fordoubtful accounts at levels the Board considered adequate to absorb future credit losses.Subsequent recoveries of receivables previously provisioned are credited to the Statement of Income and Retained Income. A continuity schedule of the Board’s allowance for doubtfulaccounts is as follows:
($000’s) March 31 2010 2009
Allowance at beginning of period 285 256
Provision for losses 361 139
Recoveries 160 536
Write-offs (706) (646)
Allowance at end of period 100 285
(c) Liquidity RiskLiquidity risk is the risk that the Board may not have cash available to satisfy financial liabilitiesas they come due. The Board’s exposure to the liquidity risk is minimal as it has sufficient cashbalances to settle all current liabilities.
8. CAPITAL DISCLOSURES
The Board is a corporation without share capital and has no long-term debt. Its definitionof capital is cash and cash equivalents and retained income. The Board’s main objectives whenmanaging its capital are:• to ensure sufficient liquidity in support of its financial obligations to achieve its business plans,• to maintain healthy liquidity reserves and access to capital as outlined in its investment
and foreign exchange policies; and• to ensure that cash management decisions are based upon the preservation of capital
as a primary objective.As at March 31, 2010, the LCBO met these objectives.In managing cash and cash equivalents, the Board maintains balances that are:
• sufficient to meet its accounts payable obligations due within the next 45–60 days;• sufficient to meet the timing of dividend transfers; and• sufficient to meet approved capital expenditures throughout the current fiscal year.
The Board is not subject to any externally imposed capital requirements.
NOTES TO FINANCIAL STATEMENTS
March 31, 2010
annual report 2009–10 L C B O 71

9. CONTINGENCIES
The Board is involved in various legal actions arising out of the ordinary course and conductof business. The outcome and ultimate disposition of these actions are not determinable atthis time. Accordingly, no provision for these actions is reflected in the financial statements.Settlements, if any, concerning these contingencies will be accounted for in the period inwhich the settlement occurs.
10. WASTE DIVERSION
In prior years, the Board was directed by the Province to assist municipalities with their containerrecycling costs, including $5 million per year on a transitional basis for the first two yearsfollowing the introduction of the Ontario Deposit Return Program effective February 5, 2007.Currently, the Board is responsible under the Waste Diversion Act, 2002 to pay municipalities –through Stewardship Ontario, an industry-funded waste diversion organization – for costsassociated with container waste and non-container waste recycled through municipal Blue Boxsystems. For the year ended March 31, 2010, the Board contributed $2.1 million and theseexpenditures are included in Administration in the Statement of Income and Retained Income.
11. ONTARIO DEPOSIT RETURN PROGRAM
On November 6, 2006, the Province of Ontario entered into an agreement with Brewers RetailInc. for management of a province-wide container deposit return program (“the program”) onwine, liquor and non-common beer containers sold through the Board and Winery, on-siteMicrobrewery and Distillery Retail Stores. Brewers Retail Inc. was appointed the exclusiveservice provider for a period of five years effective February 5, 2007.
Under the program, the Board collects a deposit of 10 or 20 cents on wine, liquor and beercontainers. The Board reimburses Brewers Retail Inc. for deposits it pays to customers whoreturn containers to locations it operates, plus a service fee.
For the year ended March 31, 2010, the Board collected $56 million (2009 – $56.4 million)of deposits on containers and was invoiced $43.5 million (2009 – $41.3 million) for refundsto the customers.
Expenditures in connection with the program for the year ended March 31, 2010 amountedto $28.2 million (2009 – $27.3 million) for service fees to Brewers Retail Inc. and $0.1 million(2009 – $0.1 million) for promoting the program. These expenditures are included inAdministration in the Statement of Income and Retained Income.
NOTES TO FINANCIAL STATEMENTS
March 31, 2010
annual report 2009–10L C B O72

The Board’s experience indicates that not all container deposits are redeemed. Based upon its redemption data and research of industry experience, part of the container deposits collected would not be redeemed. Based on historical redemption patterns, for the year endedMarch 31, 2010, the Board changed the estimated redemption rate for the program from85 per cent to 80 per cent. Accordingly, for the year ended March 31, 2010, the Board applied$16.8 million (2009 – $8.4 million) of unredeemed deposits as a reduction to expendituresin connection with the program.
12. FUTURE CHANGES IN ACCOUNTING POLICIES
International Financial Reporting StandardsIn February 2008, the Accounting Standards Board confirmed that Canadian generally acceptedaccounting principles (GAAP) for publicly-accountable enterprises will be converged withInternational Financial Reporting Standards (IFRS) effective in calendar year 2011, with earlyadoption allowed starting in calendar year 2009. IFRS uses a conceptual framework similarto Canadian GAAP, but there are differences on recognition, measurement and disclosures.The transition from Canadian GAAP to IFRS will be applicable to the Board’s financial state-ments for fiscal 2011–12, at which time the Board will prepare both its fiscal 2011–12 andfiscal 2010–11 comparative financial information using IFRS.
NOTES TO FINANCIAL STATEMENTS
March 31, 2010
annual report 2009–10 L C B O 73

KEY INDICATORS: 2006–2010
Operations
2006 2007 2008 2009 2010
Number of LCBO stores 598 601 604 607 611
Number of permanent employees 3,382 3,421 3,462 3,604 3,542
Number of regular products listed 3,556 3,674 3,578 3,710 3,427
2006 2007 2008 2009 2010
LCBO stores Permanent employees Regular products listed
FINANCIAL OVERVIEW
annual report 2009–10L C B O74
FINANCIAL INDICATORS: 2006–2010
Financial (values in $000)
2006 2007 2008 2009 2010
Net sales and other income 3,682,919 3,922,648 4,133,191 4,297,642 4,344,099
% change/previous year 4.3% 6.5% 5.4% 4.0% 1.1%
Operating expenses 592,963 632,750 659,429 682,526 709,570
As a % of net sales & other income 16.1% 16.1% 16.0% 15.9% 16.3%
Net income 1,204,344 1,300,601 1,374,357 1,410,174 1,435,609
As a % of net sales & other income 32.7% 33.2% 33.3% 32.8% 33.0%
2006 2007 2008 2009 2010
Net sales and other income Operating expenses Net income
FINANCIAL OVERVIEW
annual report 2009–10 L C B O 75

OPERATING EXPENSES: 2006–2010
Breakdown of operating expenses (values in $000)
2006 2007 2008 2009 2010
Salaries and benefits 337,969 352,960 373,864 389,159 400,335
Depreciation 49,099 49,233 48,757 46,406 48,716
Other expenses 205,895 230,557 236,808 246,961 260,519
Total operating expenses 592,963 632,750 659,429 682,526 709,570
2006 2007 2008 2009 2010
Salaries and benefits Depreciation Other expenses
FINANCIAL OVERVIEW
annual report 2009–10L C B O76

REVENUE PAYMENTS
Treasurer of Ontario (values in $000)
2006 2007 2008 2009 2010
Remitted by the Liquor Control Board:on account of profits 1,200,000 1,279,700 1,345,000 1,400,000 1,410,000
Remitted by the Liquor Control Board:Ontario retail sales tax on sales of liquor 341,773 363,338 382,631 398,057 404,823
Remitted by the Alcohol and Gaming Commission:on account of licence fees and permits 516,444 499,373 505,980 500,157 491,398
Remitted by others:Ontario retail sales tax on sales through The Beer Store and Ontario wineryretail stores 213,264 206,405 211,814 213,691 212,803
Ontario retail sales tax on sales through agency stores 9,697 10,404 11,429 12,066 12,503
Total 2,281,177 2,359,220 2,456,853 2,523,971 2,531,527
FINANCIAL OVERVIEW
annual report 2009–10 L C B O 77

REVENUE PAYMENTS (continued)
Receiver General for Canada (values in $000)
2006 2007 2008 2009 2010
Remitted by the Liquor Control Board:
Excise taxes and customs duties 321,350 332,839 339,202 346,477 346,072
Goods and Services Tax 124,978 119,185 119,283 104,372 107,680
Remitted by others:
Excise taxes, GST and other duties/taxes 360,779 344,134 349,420 344,870 348,275
Goods and Services Tax remitted on sales through agency stores 5,656 5,381 5,557 5,027 5,210
Total 812,763 801,539 813,462 800,746 807,237
Ontario Municipalities (values in $000)
2006 2007 2008 2009 2010
Remitted by the Liquor Control Board:Realty taxes* 14,848 15,243 15,792 16,606 18,256
Total revenue payments 3,108,788 3,176,002 3,286,108 3,341,323 3,357,020
*Note: Includes property taxes on leased properties.
FINANCIAL OVERVIEW
annual report 2009–10L C B O78

VOLUME SALES
Product Type (volume in 000 litres)
2006 2007 2008 2009 2010 % change
Domestic Spirits 34,501 34,379 34,156 33,715 33,449 -0.8%
Imported Spirits 21,637 22,001 22,927 23,715 23,614 -0.4%
Total Spirits 56,138 56,380 57,083 57,430 57,064 -0.6%
Domestic Wine 33,491 34,337 35,522 36,362 37,448 3.0%
Imported Wine 78,528 83,575 86,847 89,211 92,060 3.2%
Total Wine 112,018 117,912 122,369 125,573 129,508 3.1%
Domestic Beer 81,373 85,641 91,590 92,531 97,981 5.9%
Imported Beer 107,422 114,463 122,817 130,084 132,980 2.2%
Total Beer 188,795 200,104 214,408 222,615 230,961 3.7%
Domestic Spirit Coolers 26,019 24,359 23,682 22,604 22,522 -0.4%
Imported Spirit Coolers 4,585 4,834 6,082 6,232 5,194 -16.7%
Domestic Wine Coolers 113 62 0 0 0 0.0%
Imported Wine Coolers 328 313 266 197 146 -25.6%
Domestic Beer Coolers 641 556 572 627 691 10.2%
Imported Beer Coolers 96 207 193 110 16 -85.9%
Total Coolers 31,782 30,332 30,795 29,770 28,569 -4.0%
Total Domestic 176,137 179,335 185,523 185,838 192,091 3.4%
Total Imported 212,596 225,393 239,132 249,549 254,011 1.8%
Total 388,733 404,728 424,655 435,388 446,102 2.5%
FINANCIAL OVERVIEW
annual report 2009–10 L C B O 79
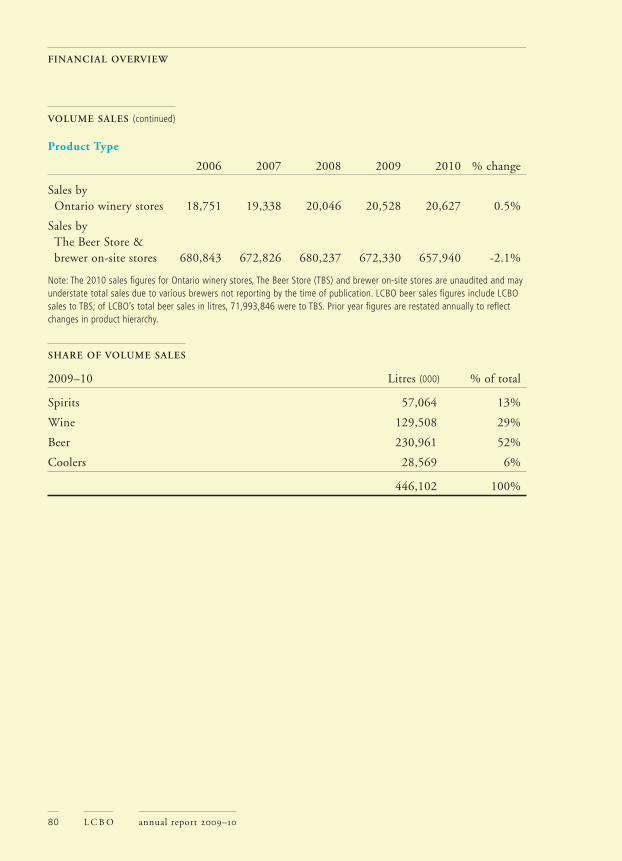
VOLUME SALES (continued)
Product Type
2006 2007 2008 2009 2010 % change
Sales by Ontario winery stores 18,751 19,338 20,046 20,528 20,627 0.5%
Sales by The Beer Store & brewer on-site stores 680,843 672,826 680,237 672,330 657,940 -2.1%
Note: The 2010 sales figures for Ontario winery stores, The Beer Store (TBS) and brewer on-site stores are unaudited and mayunderstate total sales due to various brewers not reporting by the time of publication. LCBO beer sales figures include LCBOsales to TBS; of LCBO’s total beer sales in litres, 71,993,846 were to TBS. Prior year figures are restated annually to reflectchanges in product hierarchy.
SHARE OF VOLUME SALES
2009–10 Litres (000) % of total
Spirits 57,064 13%
Wine 129,508 29%
Beer 230,961 52%
Coolers 28,569 6%
446,102 100%
FINANCIAL OVERVIEW
annual report 2009–10L C B O80
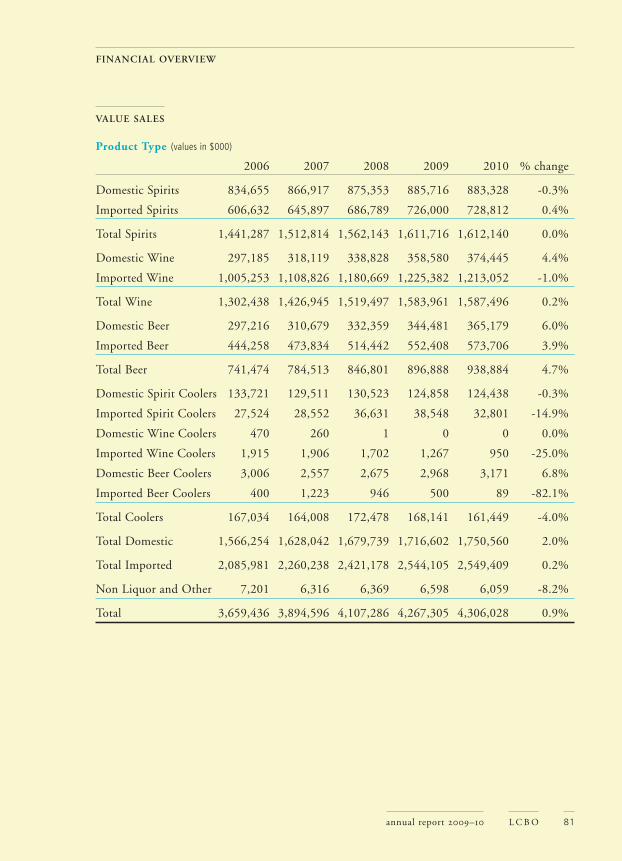
VALUE SALES
Product Type (values in $000)
2006 2007 2008 2009 2010 % change
Domestic Spirits 834,655 866,917 875,353 885,716 883,328 -0.3%
Imported Spirits 606,632 645,897 686,789 726,000 728,812 0.4%
Total Spirits 1,441,287 1,512,814 1,562,143 1,611,716 1,612,140 0.0%
Domestic Wine 297,185 318,119 338,828 358,580 374,445 4.4%
Imported Wine 1,005,253 1,108,826 1,180,669 1,225,382 1,213,052 -1.0%
Total Wine 1,302,438 1,426,945 1,519,497 1,583,961 1,587,496 0.2%
Domestic Beer 297,216 310,679 332,359 344,481 365,179 6.0%
Imported Beer 444,258 473,834 514,442 552,408 573,706 3.9%
Total Beer 741,474 784,513 846,801 896,888 938,884 4.7%
Domestic Spirit Coolers 133,721 129,511 130,523 124,858 124,438 -0.3%
Imported Spirit Coolers 27,524 28,552 36,631 38,548 32,801 -14.9%
Domestic Wine Coolers 470 260 1 0 0 0.0%
Imported Wine Coolers 1,915 1,906 1,702 1,267 950 -25.0%
Domestic Beer Coolers 3,006 2,557 2,675 2,968 3,171 6.8%
Imported Beer Coolers 400 1,223 946 500 89 -82.1%
Total Coolers 167,034 164,008 172,478 168,141 161,449 -4.0%
Total Domestic 1,566,254 1,628,042 1,679,739 1,716,602 1,750,560 2.0%
Total Imported 2,085,981 2,260,238 2,421,178 2,544,105 2,549,409 0.2%
Non Liquor and Other 7,201 6,316 6,369 6,598 6,059 -8.2%
Total 3,659,436 3,894,596 4,107,286 4,267,305 4,306,028 0.9%
FINANCIAL OVERVIEW
annual report 2009–10 L C B O 81

VALUE SALES (continued)
Product Type
2006 2007 2008 2009 2010 % change
Sales by Ontario winery stores 176,214 187,385 198,612 210,271 214,917 2.2%
Sales by The Beer Store and brewer on-site stores 2,229,642 2,204,814 2,243,929 2,254,746 2,230,877 -1.1%
Note: The 2010 sales figures for Ontario winery stores, The Beer Store (TBS) and brewer on-site stores are unaudited and mayunderstate total sales due to various brewers not reporting by the time of publication. Value sales consist of net sales for LCBOand Ontario winery stores. LCBO beer sales figures include LCBO sales to TBS; of LCBO’s total beer sales, $310,913,096 wereto TBS. Prior year figures are restated annually to reflect changes in product hierarchy.
SHARE OF VALUE SALES
2009–10 $ (000) % of total
Spirits 1,612,140 37%
Wine 1,587,496 37%
Beer 938,884 22%
Coolers 161,449 4%
4,299,969 100%
FINANCIAL OVERVIEW
annual report 2009–10L C B O82

PRODUCT LISTINGS
2006 2007 2008 2009 2010
Domestic
Spirits 442 440 440 524 420
Wine 447 450 463 515 515
Beer 494 491 477 470 458
Imported
Spirits 737 761 674 695 685
Wine 1,151 1,225 1,208 1,122 980
Beer 285 307 316 384 369
Total regular listings 3,556 3,674 3,578 3,710 3,427
VINTAGES wines and spirits 5,953 5,633 6,927 6,688 5,256
Duty-free listings 234 231 231 200 211
Consignment warehouse and private ordering 9,483 9,225 9,434 11,793 9,896
Total product listings 19,226 18,763 20,170 22,391 18,790
Note: Product listing figures for Consignment and private ordering are estimated based on invoices produced by SpecialtyServices. The total does not include products delisted during the fiscal year.
FINANCIAL OVERVIEW
annual report 2009–10 L C B O 83

ONTARIO SALES CHANNEL SUMMARY
2006 2007 2008 2009 2010
LCBO total sales 4,284,222 4,530,392 4,724,138 4,875,417 4,922,501
The Beer Store total sales 2,686,509 2,647,897 2,719,131 2,714,574 2,703,197
Winery retail stores 208,452 227,768 233,940 245,918 251,453
Other channels:
Legal 641,091 598,853 641,290 686,354 736,426
Homemade 153,239 142,626 155,607 160,852 189,248
Illegal 550,219 661,356 680,741 766,021 896,215
Grand total 8,523,732 8,808,892 9,154,848 9,449,136 9,699,039
Note: All figures above are shown in gross sales. Sales values reported under the Other channels category are estimated usingthe average retail price for spirits, wine and beer sold under the LCBO, winery retail stores (WRS) and TBS respectively.LCBO and TBS figures are slightly overstated due to reciprocal sales included in the totals. These sales are excluded in thetable below.
SHARE OF ONTARIO BEVERAGE MARKET
2009–10 2008–09
LCBO 50.0% 50.8%
The Beer Store 27.5% 28.5%
Other legal 10.1% 9.5%
Illegal 9.7% 8.5%
Winery retail stores 2.7% 2.7%
100.0% 100.0%
FINANCIAL OVERVIEW
annual report 2009–10L C B O84
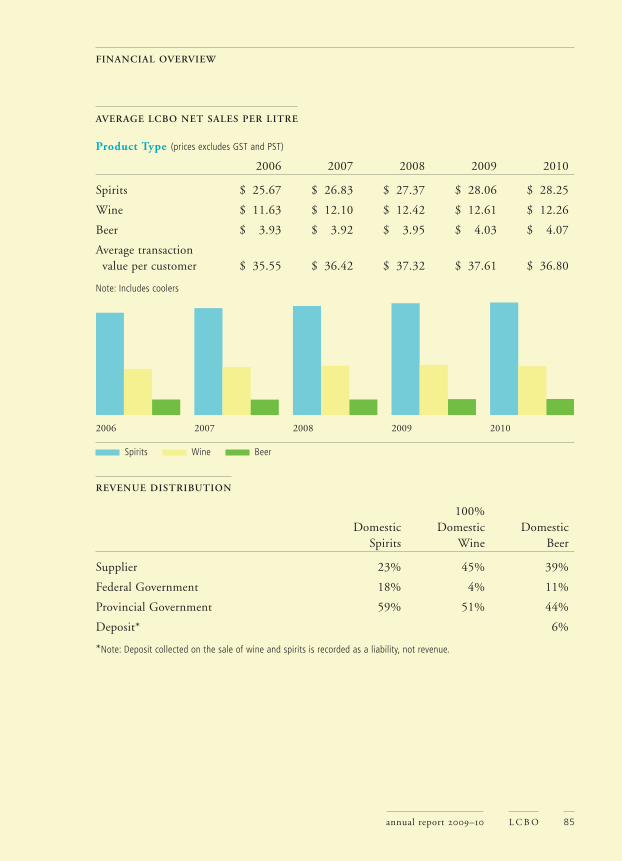
AVERAGE LCBO NET SALES PER LITRE
Product Type (prices excludes GST and PST)
2006 2007 2008 2009 2010
Spirits $ 25.67 $ 26.83 $ 27.37 $ 28.06 $ 28.25
Wine $ 11.63 $ 12.10 $ 12.42 $ 12.61 $ 12.26
Beer $ 3.93 $ 3.92 $ 3.95 $ 4.03 $ 4.07
Average transaction value per customer $ 35.55 $ 36.42 $ 37.32 $ 37.61 $ 36.80
Note: Includes coolers
2006 2007 2008 2009 2010
Spirits Wine Beer
REVENUE DISTRIBUTION
100%Domestic Domestic Domestic
Spirits Wine Beer
Supplier 23% 45% 39%
Federal Government 18% 4% 11%
Provincial Government 59% 51% 44%
Deposit* 6%
*Note: Deposit collected on the sale of wine and spirits is recorded as a liability, not revenue.
FINANCIAL OVERVIEW
annual report 2009–10 L C B O 85

LCBO LITRE SALES BY CATEGORY 2006–2010
The tables below show the share of volume sales (in litres) held by various segments withinmajor product categories.
2006 2007 2008 2009 2010
Canadian Spirits
Canadian Whisky 17.4% 17.4% 16.8% 16.7% 16.8%
Canadian Rum 8.8% 8.8% 8.7% 8.8% 8.9%
Canadian Vodka 9.7% 10.0% 9.9% 9.9% 10.1%
Canadian Liqueur 2.4% 2.5% 2.5% 2.4% 2.3%
Spirit Coolers 30.1% 28.5% 27.3% 26.3% 26.4%
Canadian Dry Gin 0.8% 0.8% 0.8% 0.7% 0.7%
Other 0.6% 0.5% 0.8% 0.8% 1.0%
Imported Spirits
Scotch 4.5% 4.5% 4.4% 4.4% 4.3%
Liqueur 3.8% 3.9% 3.4% 3.2% 3.2%
Miscellaneous Liquors 3.1% 3.4% 3.9% 4.0% 4.0%
Vodka 5.0% 5.5% 6.2% 7.0% 7.4%
French Brandy 2.1% 2.1% 2.0% 2.0% 2.0%
Spirit Coolers 5.3% 5.7% 7.0% 7.2% 6.1%
Other 6.4% 6.4% 6.3% 6.8% 6.8%
Total Spirits (000 litres) 86,527 85,348 86,621 86,048 84,521
Canadian Wines
White Table 14.5% 14.2% 14.3% 14.2% 14.2%
Red Table 9.1% 9.1% 9.2% 9.3% 9.1%
Rosé Table 1.0% 1.0% 1.0% 1.0% 1.0%
7% Sparkling 1.3% 1.2% 1.2% 1.1% 1.1%
Fortified 1.7% 1.5% 1.5% 1.5% 1.4%
Wine Coolers 0.1% 0.1% 0.0% 0.0% 0.0%
Other 0.8% 0.8% 0.7% 0.8% 1.1%
FINANCIAL OVERVIEW
annual report 2009–10L C B O86

LCBO LITRE SALES BY CATEGORY 2006–2010 (continued)
2006 2007 2008 2009 2010
Imported Wines
White Table 22.9% 22.5% 22.6% 22.2% 22.1%
Red Table 38.3% 39.3% 39.6% 40.2% 40.3%
Rosé Table 1.6% 1.4% 0.7% 0.7% 0.8%
Sparkling 2.2% 2.2% 2.3% 2.2% 2.2%
Fortified 1.7% 1.6% 1.4% 1.4% 1.3%
Wine Coolers 0.3% 0.3% 0.2% 0.2% 0.1%
Other 4.7% 5.0% 5.4% 5.4% 5.5%
Total Wine (000 litres) 105,724 111,386 115,118 117,940 122,041
Canadian Beer
Ontario Beer 42.7% 42.1% 42.2% 42.1% 42.9%
Other Canadian Beer 3.0% 2.9% 2.9% 2.6% 2.6%
Imported Beer
U.S. Beer 8.8% 9.5% 8.8% 8.4% 8.1%
Other Imported Beer 45.4% 45.4% 46.0% 46.9% 46.3%
Sake 0.1% 0.1% 0.1% 0.1% 0.1%
Total Beer (000 litres) 170,245 181,959 195,432 203,005 211,505
Total (000 litres) 362,496 378,693 397,171 406,993 418,067
Notes: These figures exclude private ordering and other head office sales. Prior year figures are restated annually to reflectchanges in product hierarchy.
FINANCIAL OVERVIEW
annual report 2009–10 L C B O 87

LCBO NET SALES BY CATEGORY 2006–2010
The tables below show the share of net sales held by various segments within major product categories.
2006 2007 2008 2009 2010
Canadian Spirits
Canadian Whisky 23.1% 22.7% 21.9% 21.6% 21.5%
Canadian Rum 11.4% 11.3% 11.0% 11.1% 11.2%
Canadian Vodka 12.7% 13.0% 12.7% 12.6% 12.7%
Canadian Liqueur 2.8% 2.9% 2.9% 2.7% 2.6%
Spirit Coolers 8.4% 7.8% 7.6% 7.1% 7.0%
Canadian Dry Gin 1.1% 1.0% 1.0% 0.9% 0.9%
Other 0.6% 0.6% 1.2% 1.2% 1.3%
Imported Spirits
Scotch 7.9% 7.8% 7.8% 7.8% 7.8%
Liqueur 6.0% 6.0% 5.1% 4.8% 4.6%
Miscellaneous Liquors 4.5% 4.9% 5.7% 5.7% 5.5%
Vodka 6.7% 7.3% 8.6% 9.7% 10.3%
French Brandy 3.7% 3.7% 3.6% 3.5% 3.4%
Spirit Coolers 1.7% 1.7% 2.1% 2.2% 1.9%
Other 9.4% 9.3% 8.8% 9.3% 9.4%
Total Spirits ($000) 1,598,743 1,667,000 1,724,763 1,770,955 1,764,434
Canadian Wines
White Table 10.4% 10.2% 10.3% 10.5% 10.9%
Red Table 7.0% 7.1% 7.2% 7.4% 7.6%
Rosé Table 0.7% 0.7% 0.7% 0.7% 0.8%
7% Sparkling 0.8% 0.7% 0.7% 0.7% 0.6%
Fortified 1.3% 1.2% 1.1% 1.2% 1.2%
Wine Coolers 0.0% 0.0% 0.0% 0.0% 0.0%
Other 1.3% 1.2% 1.1% 1.1% 1.2%
FINANCIAL OVERVIEW
annual report 2009–10L C B O88
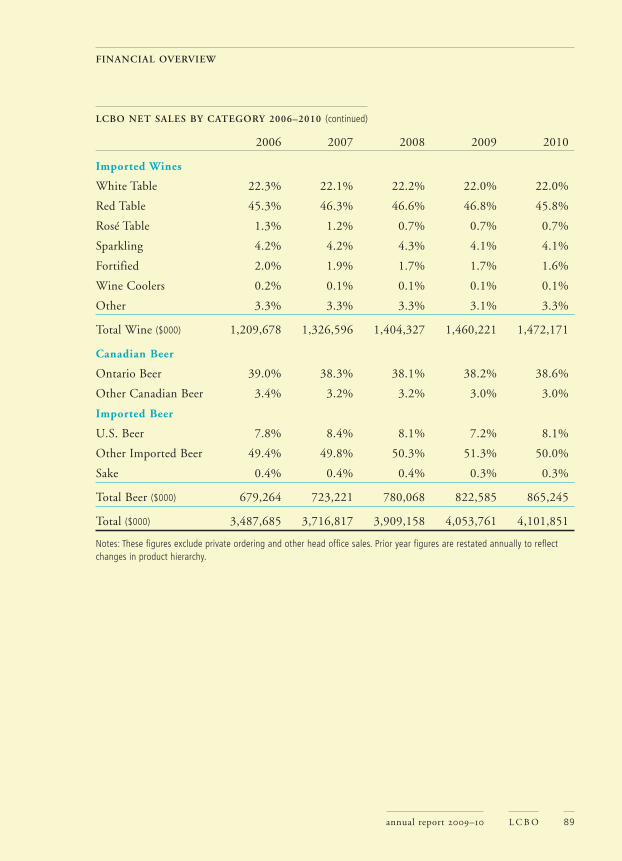
LCBO NET SALES BY CATEGORY 2006–2010 (continued)
2006 2007 2008 2009 2010
Imported Wines
White Table 22.3% 22.1% 22.2% 22.0% 22.0%
Red Table 45.3% 46.3% 46.6% 46.8% 45.8%
Rosé Table 1.3% 1.2% 0.7% 0.7% 0.7%
Sparkling 4.2% 4.2% 4.3% 4.1% 4.1%
Fortified 2.0% 1.9% 1.7% 1.7% 1.6%
Wine Coolers 0.2% 0.1% 0.1% 0.1% 0.1%
Other 3.3% 3.3% 3.3% 3.1% 3.3%
Total Wine ($000) 1,209,678 1,326,596 1,404,327 1,460,221 1,472,171
Canadian Beer
Ontario Beer 39.0% 38.3% 38.1% 38.2% 38.6%
Other Canadian Beer 3.4% 3.2% 3.2% 3.0% 3.0%
Imported Beer
U.S. Beer 7.8% 8.4% 8.1% 7.2% 8.1%
Other Imported Beer 49.4% 49.8% 50.3% 51.3% 50.0%
Sake 0.4% 0.4% 0.4% 0.3% 0.3%
Total Beer ($000) 679,264 723,221 780,068 822,585 865,245
Total ($000) 3,487,685 3,716,817 3,909,158 4,053,761 4,101,851
Notes: These figures exclude private ordering and other head office sales. Prior year figures are restated annually to reflectchanges in product hierarchy.
FINANCIAL OVERVIEW
annual report 2009–10 L C B O 89

LCBO SALES BY COUNTRY OF ORIGIN 2009–10 – SPIRITS
Country Net Sales ($) Litres
Canada $ 995,893,504 55,667,903
United Kingdom $ 201,583,292 7,987,276
United States $ 126,595,983 6,341,645
France $ 111,090,895 2,785,580
Ireland $ 61,598,645 2,050,248
Sweden $ 54,367,182 2,106,348
Mexico $ 44,907,593 1,268,085
Italy $ 36,137,140 1,293,124
Germany $ 23,628,622 754,988
Russia $ 18,129,598 682,646
Poland $ 15,579,659 472,147
Finland $ 13,224,607 493,775
New Zealand $ 9,759,210 841,803
Jamaica $ 5,661,280 180,816
Cuba $ 5,217,884 177,718
Barbados $ 4,997,747 171,556
Netherlands $ 3,968,127 133,305
Greece $ 3,858,361 151,276
South Africa $ 3,808,363 134,497
Guyana $ 2,966,364 89,267
Switzerland $ 2,841,439 85,512
Spain $ 1,877,908 79,051
South Korea $ 1,623,311 100,879
Portugal $ 1,419,132 46,011
Bermuda $ 1,352,362 49,403
Nicaragua $ 1,230,972 42,026
Puerto Rico $ 1,008,004 22,015
Croatia $ 978,552 32,769
Ukraine $ 838,486 28,336
Hungary $ 818,472 27,559
Bahamas $ 739,880 21,265
Denmark $ 733,515 25,952
FINANCIAL OVERVIEW
annual report 2009–10L C B O90

LCBO SALES BY COUNTRY OF ORIGIN 2009–10 – SPIRITS (continued)
Country Net Sales ($) Litres
Serbia $ 728,290 24,025
Lebanon $ 549,464 19,901
Czech Republic $ 543,851 9,356
Brazil $ 541,709 16,726
China $ 492,499 11,549
Dominican Republic $ 479,510 18,620
Austria $ 450,450 10,368
India $ 370,074 14,471
Iceland $ 361,049 9,140
Japan $ 333,989 8,161
Trinidad $ 266,198 6,486
Colombia $ 222,043 8,108
Turkey $ 179,533 4,674
Israel $ 92,581 3,021
Australia $ 61,252 1,458
Republic of Armenia $ 57,708 1,160
U.S. Virgin Islands $ 51,953 4,241
Saint Vincent and The Grenadines $ 50,472 990
Peru $ 36,497 1,074
Bulgaria $ 33,475 1,154
Lithuania $ 28,035 930
St. Lucia $ 27,761 383
Chile $ 17,426 703
Panama $ 16,647 590
Cyprus $ 14,430 544
Georgia $ 4,496 69
British Virgin Islands $ 1,167 33
Thailand $ 1,119 33
Anguilla $ 883 16
Antigua $ 254 8
Venezuela $ 21 1
Total $ 1,764,450,925 84,522,774
FINANCIAL OVERVIEW
annual report 2009–10 L C B O 91

LCBO SALES BY COUNTRY OF ORIGIN 2009–10 – WINE
Country Net Sales ($) Litres
Canada $ 330,471,115 33,984,391
Italy $ 254,143,249 19,831,281
Australia $ 207,972,943 14,010,015
France $ 172,843,708 10,790,935
United States $ 161,463,810 12,368,693
Argentina $ 87,416,964 8,764,787
Chile $ 77,409,244 7,227,175
South Africa $ 40,275,788 3,506,652
Spain $ 39,399,840 2,600,087
Portugal $ 29,500,661 2,281,004
New Zealand $ 27,187,592 1,354,338
Germany $ 20,690,911 1,733,362
United Kingdom $ 10,752,303 2,199,570
Greece $ 3,166,458 304,130
Hungary $ 2,062,716 208,819
Japan $ 1,479,588 96,596
Ireland $ 1,167,986 241,730
Israel $ 950,001 47,863
Sweden $ 932,430 209,996
Serbia $ 752,967 81,310
Austria $ 660,490 39,574
Mexico $ 600,288 45,494
Romania $ 508,087 40,941
Bulgaria $ 489,973 53,124
Belgium $ 444,476 77,457
Jamaica $ 304,293 24,857
Montenegro $ 258,380 23,385
Poland $ 241,070 16,014
Georgia $ 185,002 11,825
Republic of Moldova $ 181,066 16,177
South Korea $ 170,815 7,148
Denmark $ 163,165 12,242
FINANCIAL OVERVIEW
annual report 2009–10L C B O92

LCBO SALES BY COUNTRY OF ORIGIN 2009–10 – WINE (continued)
Country Net Sales ($) Litres
Macedonia $ 134,161 15,135
Ukraine $ 118,270 5,917
Lebanon $ 78,007 4,055
Switzerland $ 70,646 3,549
Cyprus $ 41,361 2,402
Slovenia $ 21,948 1,328
Morocco $ 19,941 1,166
Brazil $ 3,656 223
Croatia $ 865 56
Uruguay $ 23 3
Total $ 1,474,736,257 122,244,806
FINANCIAL OVERVIEW
annual report 2009–10 L C B O 93

LCBO SALES BY COUNTRY OF ORIGIN 2009–10 – BEER
Country Net Sales ($) Litres
Canada $ 359,990,143 96,144,082
Netherlands $ 115,515,111 25,241,988
Mexico $ 105,704,680 24,410,032
United States $ 69,703,243 17,173,699
Belgium $ 49,782,807 10,183,611
United Kingdom $ 41,145,551 8,301,779
Germany $ 35,552,936 9,519,862
Ireland $ 19,470,346 3,740,224
Denmark $ 14,406,733 3,537,739
Poland $ 11,989,384 3,168,285
Czech Republic $ 8,492,102 2,119,320
Turkey $ 7,851,297 2,257,900
France $ 3,347,474 747,352
Jamaica $ 3,220,769 649,368
Austria $ 2,962,549 879,892
Italy $ 1,916,913 380,202
China $ 1,551,407 366,508
Brazil $ 1,395,368 337,427
Slovakia $ 1,043,293 246,351
Singapore $ 1,018,301 290,073
Thailand $ 820,286 170,165
Slovenia $ 670,222 185,196
Japan $ 647,530 156,227
Trinidad $ 589,618 126,369
Portugal $ 579,188 141,385
Russia $ 513,170 134,431
Ukraine $ 456,832 124,878
Croatia $ 434,464 113,400
Spain $ 376,075 102,375
Lithuania $ 250,753 63,425
Bosnia-Herzegovina $ 181,633 44,019
Greece $ 165,802 35,644
FINANCIAL OVERVIEW
annual report 2009–10L C B O94

LCBO SALES BY COUNTRY OF ORIGIN 2009–10 – BEER (continued)
Country Net Sales ($) Litres
Kenya $ 142,831 27,437
Barbados $ 130,056 26,378
Philippines $ 122,904 25,387
Romania $ 121,079 31,119
Estonia $ 79,901 22,650
Latvia $ 74,819 21,336
Vietnam $ 58,860 13,557
New Zealand $ 55,177 11,231
Sri Lanka $ 52,567 10,684
Australia $ 37,665 7,956
South Korea $ 34,945 7,327
Cyprus $ 5,802 1,137
Argentina $ 9 2
Malta $ 2 1
Total $ 862,662,597 211,299,409
Note: Net value represents net sales excluding private ordering sales. In fiscal 2009–10, the LCBO sold products from 82 different countries.
FINANCIAL OVERVIEW
annual report 2009–10 L C B O 95
Credits
The LCBO wishes to thank the members of the Audit Committee of the Board for their assistance in preparing this document.This report is also available at www.lcbo.com, under About LCBO. Produced by LCBO Corporate Communications. Design byANITA CHEN DESIGN. Photography by As One Photography. Financial information prepared by LCBO Financial Planning &Development. French translation by LCBO French Language Services.
Ce rapport est également publié en français sous le titre : Rapport annuel de la LCBO 2009-2010.
This annual report is printed on 30 per cent post-consumer waste and Forest Stewardship Council (FSC) certified paper.Printed by the LCBO’s Print Digital Copy Centre.
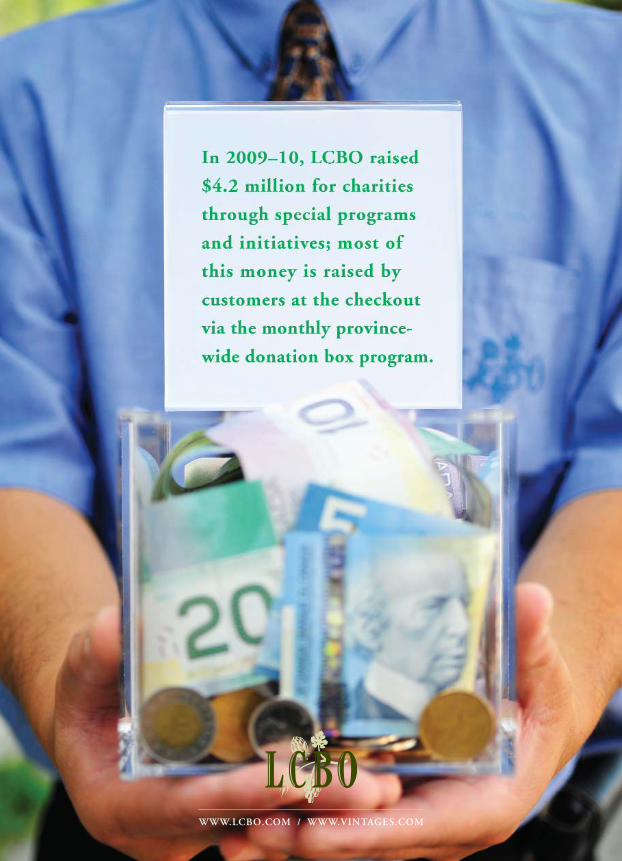
WWW.LCBO.COM / WWW.VINTAGES.COM