Caries Risk Assessment (CRA) - nnoha.org · Dentaquest Institute in the Early Childhood Caries...
29
Caries Risk Assessment (CRA)
Transcript of Caries Risk Assessment (CRA) - nnoha.org · Dentaquest Institute in the Early Childhood Caries...

Caries Risk Assessment (CRA)

ECC Phase III Regional Primary Care Network (RPCN) joined
Dentaquest Institute in the Early Childhood Caries Learning Collaborative (ECC) in 2014 during Phase III.
Children ages (0-5) were risk assessed at new patient visits and subsequent recall visits.After assessment, patient management goals were
discussed with the parent/guardian giving them manageable goals they felt were achievable.
Based on elevated risk level, either high or medium, they were placed on a 3 month fluoride varnish recall schedule where the patient management goals that were previously given are re-visited.
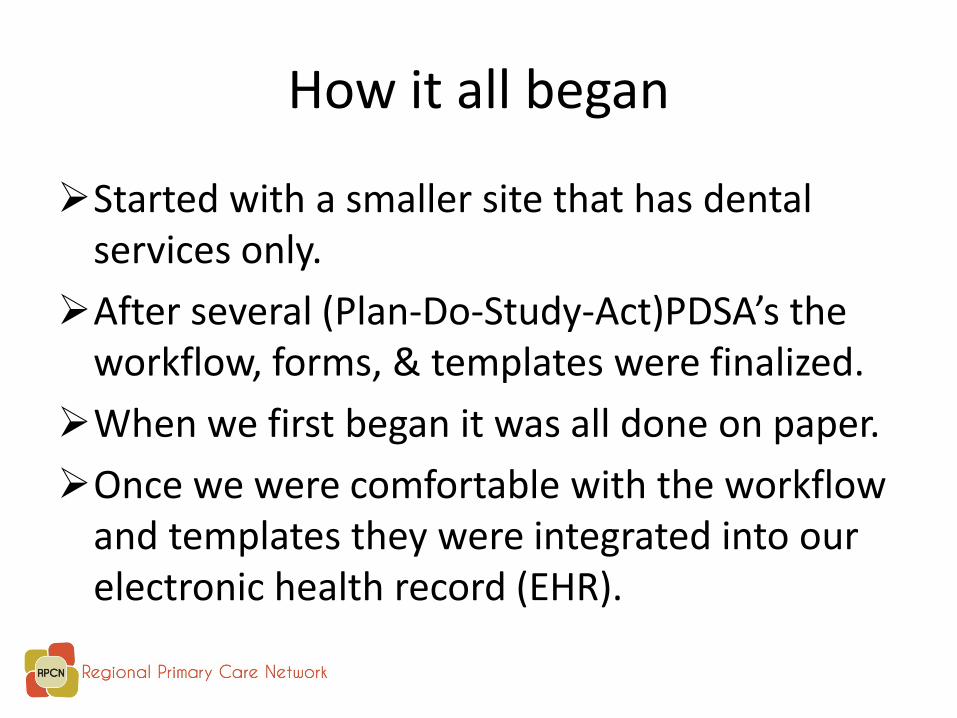
How it all began
Started with a smaller site that has dental services only.After several (Plan-Do-Study-Act)PDSA’s the
workflow, forms, & templates were finalized.When we first began it was all done on paper.Once we were comfortable with the workflow
and templates they were integrated into our electronic health record (EHR).

Monthly Dashboards
Data collection was done monthly via software given to us by the Dentaquest Institute, named the Aggregator.One drawback was the amount of time it took to
input the data into the Aggregator.
The following slides show examples of some of the run charts this data collection process formulated.

Active Patients Ages 0-5
0
20
40
60
80
100
120
140
160
180
F-14
M-14
A-14
M-14 J-14
J-14
A-14
S-14
O-14
N-14
D-14 J-15
Count Active Pts
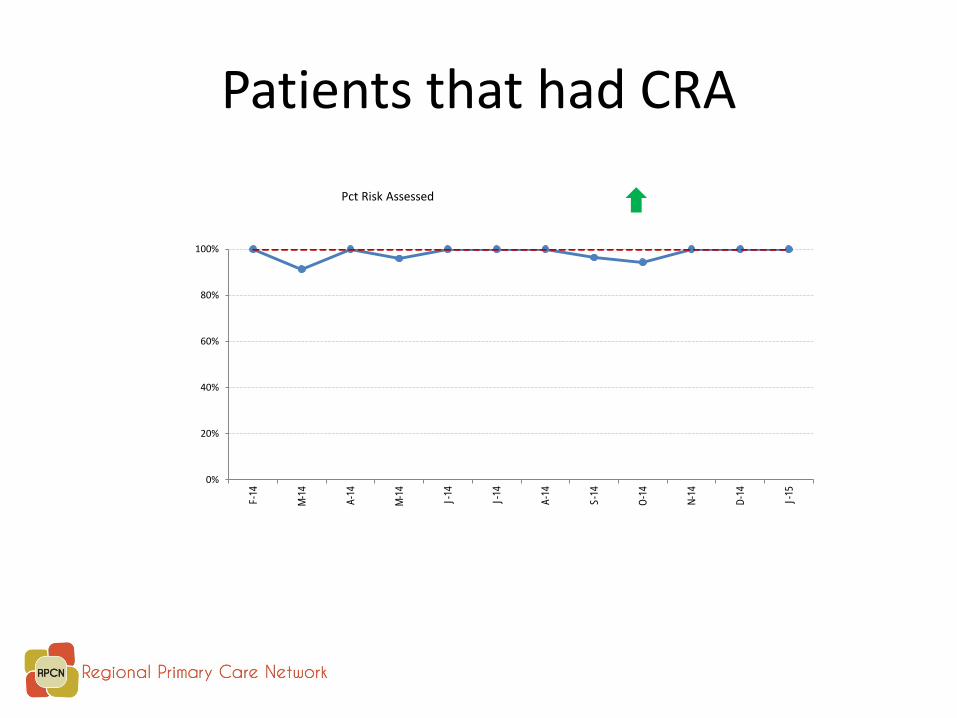
Patients that had CRA
0%
20%
40%
60%
80%
100%F-
14
M-14
A-14
M-14 J-14
J-14
A-14
S-14
O-14
N-14
D-14 J-15
Pct Risk Assessed
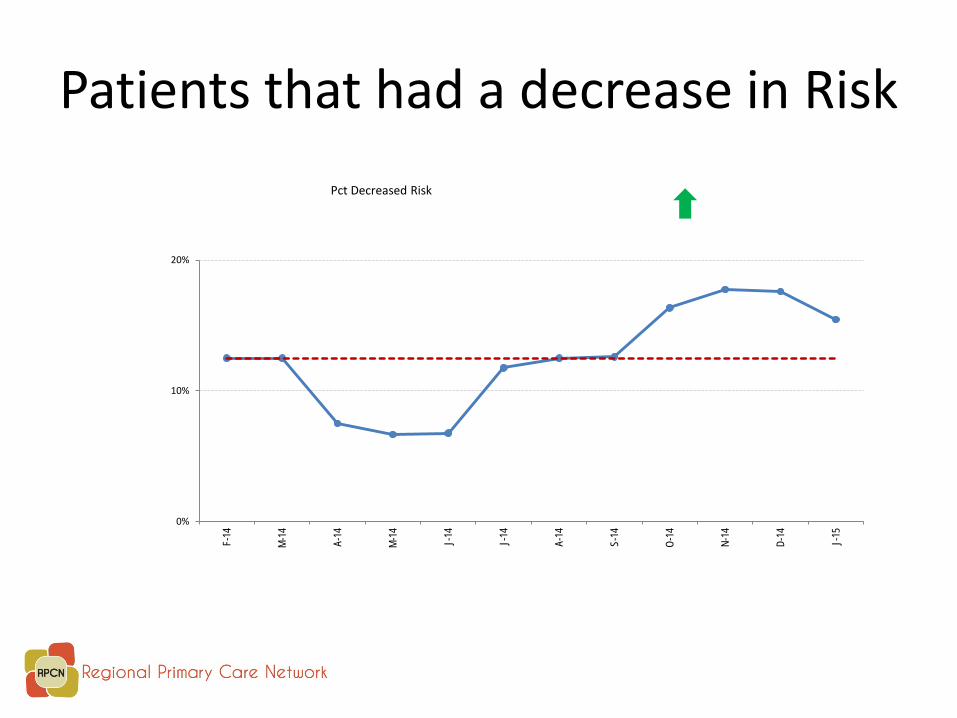
Patients that had a decrease in Risk
0%
10%
20%
F-14
M-14
A-14
M-14 J-14
J-14
A-14
S-14
O-14
N-14
D-14 J-15
Pct Decreased Risk

End of the Collaborative
The collaborative ended in February of 2015.
At this point we decided to continue CRA and include all centers and more patients.

Caries Risk Assessment Overview
We expanded to all patients in the age group of0-17.
Also expanded to include all of our 4 Community Health Centers.
CRA is performed at:New patient visitsRecall visits3 mo. fluoride varnish recall visits
Training
An organization wide training was completed during a dental department meeting via WebEx for all dental staff.
One “super-trainer” was designated at each site (our sites are geographically diverse) to coach new staff and offer support as needed.

Workflow
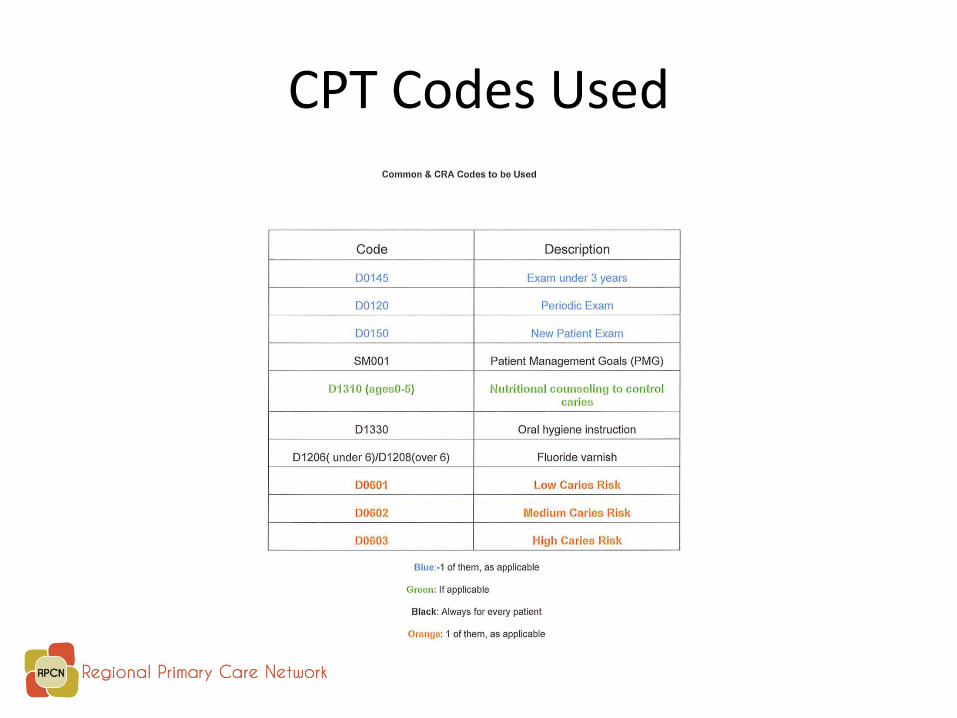
CPT Codes Used
One Click Billing
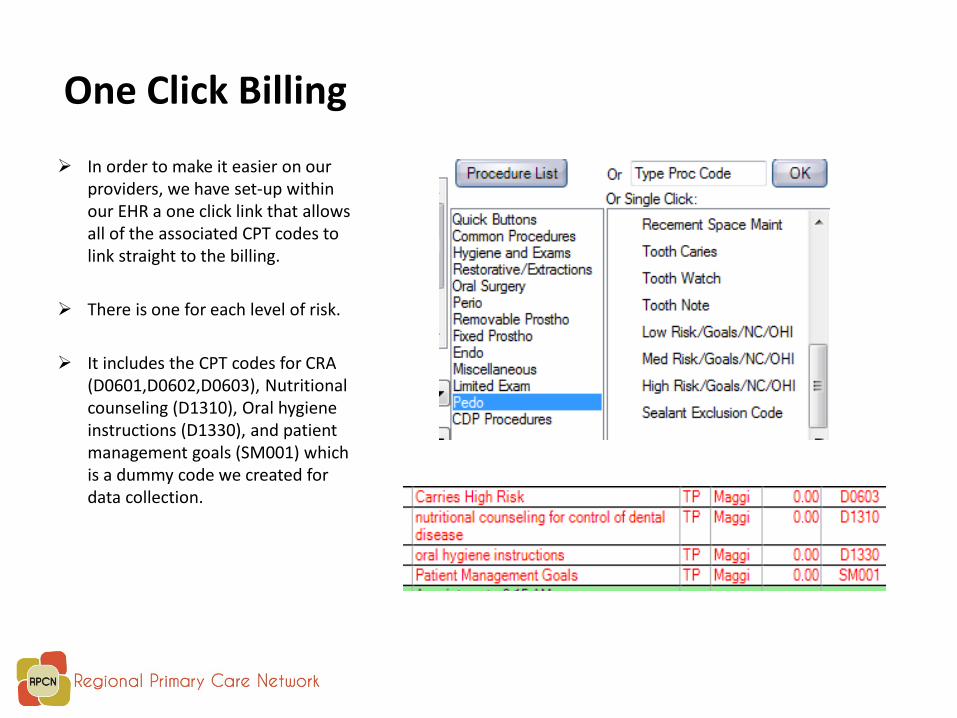
In order to make it easier on our providers, we have set-up within our EHR a one click link that allows all of the associated CPT codes to link straight to the billing.
There is one for each level of risk.
It includes the CPT codes for CRA (D0601,D0602,D0603), Nutritional counseling (D1310), Oral hygiene instructions (D1330), and patient management goals (SM001) which is a dummy code we created for data collection.

Documentation of Risk Level Templates are built into our EHR
0-5 years old 6-12 years old 13-17 years old
Adapted from CAMBRA Age based and risk based with factors that affect our patient population
For eg. Betel Nut Use (High refugee population in one of our locations where betel nut use is a regular occurrence and has a negative effect on oral health)

Template for ages 0-5Factors High Risk Moderate
RiskLow Risk
BiologicalMother/primary caregiver has active caries Yes
Child has >3 sugar-containing snacks or beverages per day YesChild is put to bed with a bottle with something other than water Yes
Child has special health care needs Yes
Child is a recent immigrant Yes
Protective
Child receives optimally-fluoridated drinking water/fluoride supplements Yes
Child has teeth brushed 2X/day w/ fluoridated toothpaste by an adult Yes
Child receives topical fluoride from health professional Yes
Child has dental home/regular dental care Yes
Clinical Findings
Child has >1 decayed/missing/filled surfaces YesChild has active white spot lesions or enamel defects YesChild has plaque on teeth Yes
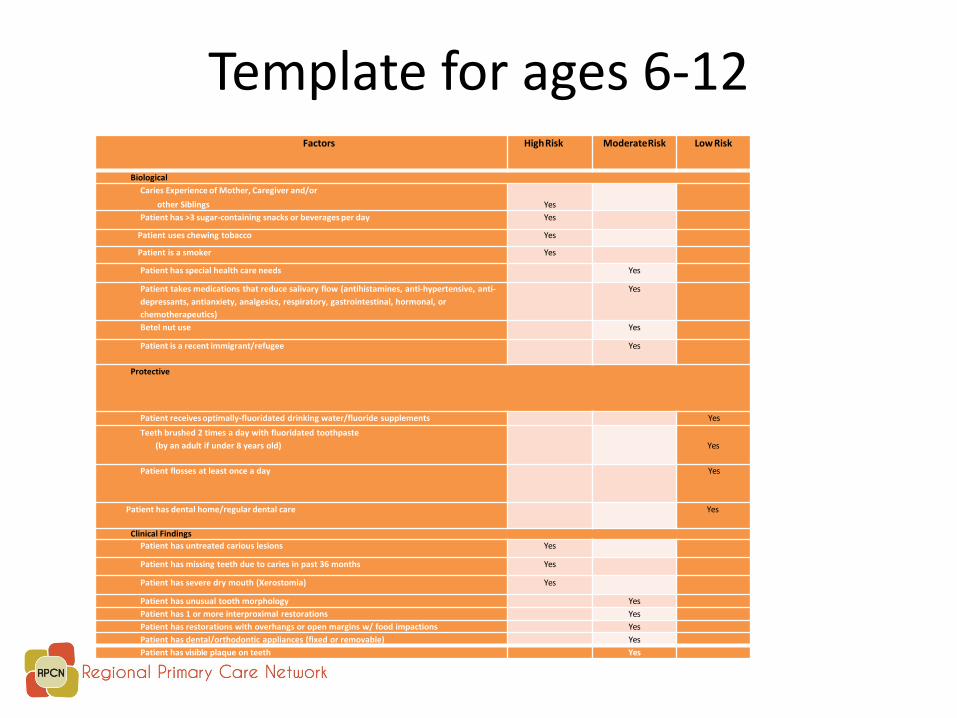
Template for ages 6-12Factors HighRisk ModerateRisk Low Risk
BiologicalCaries Experience of Mother, Caregiver and/or
other Siblings YesPatient has >3 sugar-containing snacks or beverages per day Yes
Patient uses chewing tobacco Yes
Patient is a smoker Yes
Patient has special health care needs Yes
Patient takes medications that reduce salivary flow (antihistamines, anti-hypertensive, anti-depressants, antianxiety, analgesics, respiratory, gastrointestinal, hormonal, or chemotherapeutics)
Yes
Betel nut use Yes
Patient is a recent immigrant/refugee Yes
Protective
Patient receives optimally-fluoridated drinking water/fluoride supplements Yes
Teeth brushed 2 times a day with fluoridated toothpaste(by an adult if under 8 years old) Yes
Patient flosses at least once a day Yes
Patient has dental home/regular dental care Yes
Clinical FindingsPatient has untreated carious lesions Yes
Patient has missing teeth due to caries in past 36 months Yes
Patient has severe dry mouth (Xerostomia) Yes
Patient has unusual tooth morphology YesPatient has 1 or more interproximal restorations YesPatient has restorations with overhangs or open margins w/ food impactions YesPatient has dental/orthodontic appliances (fixed or removable) YesPatient has visible plaque on teeth Yes
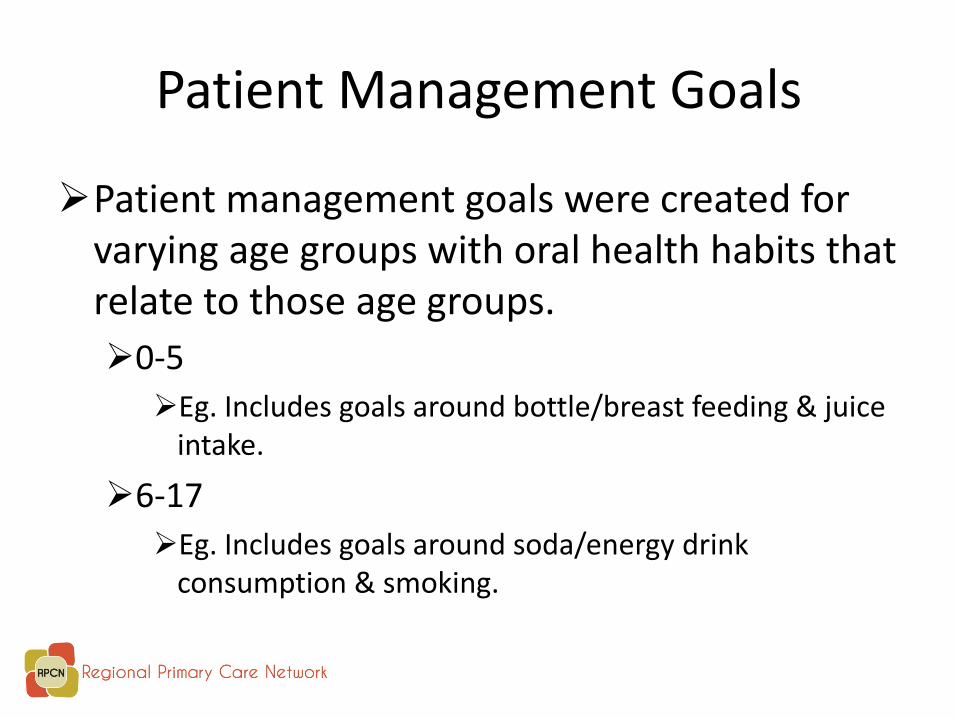
Patient Management Goals
Patient management goals were created for varying age groups with oral health habits that relate to those age groups.0-5Eg. Includes goals around bottle/breast feeding & juice
intake.
6-17Eg. Includes goals around soda/energy drink
consumption & smoking.
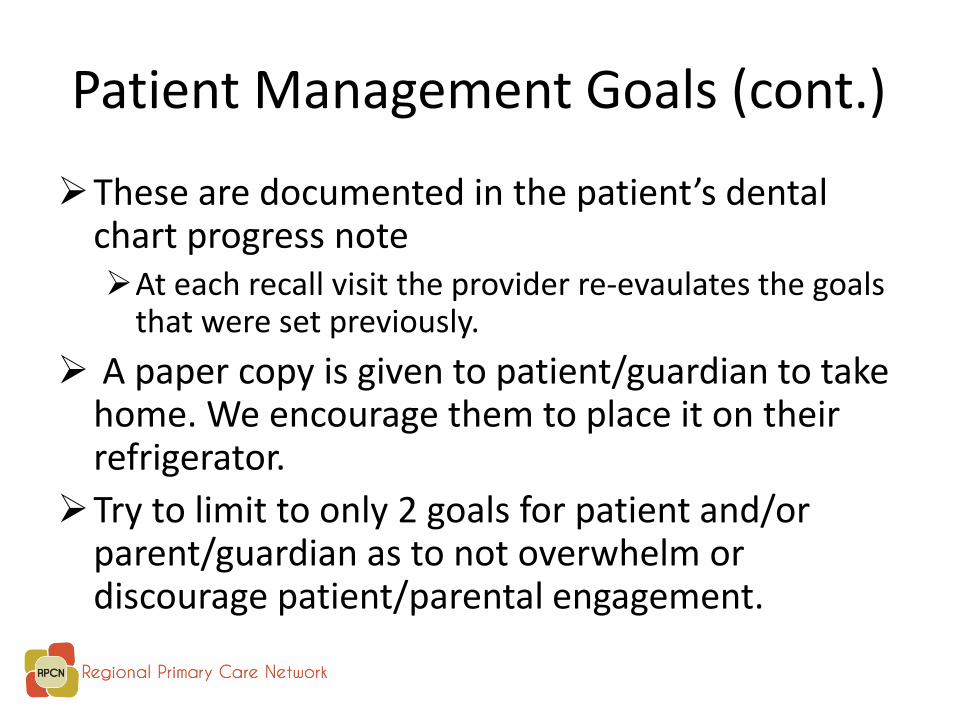
Patient Management Goals (cont.)
These are documented in the patient’s dental chart progress noteAt each recall visit the provider re-evaulates the goals
that were set previously. A paper copy is given to patient/guardian to take
home. We encourage them to place it on their refrigerator.
Try to limit to only 2 goals for patient and/or parent/guardian as to not overwhelm or discourage patient/parental engagement.

Example of a Patient Management Goal Form
More Expansion
RPCN has a school-based dental program that serves on average 130 schools throughout nine counties in Upstate NY.
A large number of our patient population ages 0-17 are seen by this program.

Our School Based Program & CRA
Our school-based program began CRA in January 2016. Using a slightly different version of the CRA template to meet
the needs of the pre-k through 12th grade students. Challenges: No parent/guardian present.
Establishing CRA Organization Wide
Buy in from Senior Management
Buy in from the Clinical StaffMost providers found they were already doing
CRA, however it was not formally documented.CRA is part of our Quarterly Quality Incentive
Program as one of our Quality Measures.

CRA Data ExampleThis data is taken from one our recent monthly reports. This represents our main 4 sites. Our CDP program is tallied separately. Tally 1 is the # of patients that had an exam within that quarter and tally 2 is those patients that also had caries risk assessment performed.
Our original quality goal was 75%, but has since been raised to 90% because all sites were performing so well.
Tally 1 Tally 2 Tally 1 Tally 2 Tally 1 Tally 2 Tally 1 Tally 2
Codes
D0120, D0150, D0145
D0120, D0150, D0145 and D0601, D0602, D0603
D0120, D0150, D0145
D0120, D0150, D0145 and D0601, D0602, D0603
D0120, D0150, D0145
D0120, D0150, D0145 and D0601, D0602, D0603
D0120, D0150, D0145
D0120, D0150, D0145 and D0601, D0602, D0603
# Unique Patients 54 54 77 74 40 40 35 35
Percentages 100% 96% 100% 100%
Quality Performance through Patient Satisfaction Surveys
CRA has played a role in increasing patient satisfaction.
Specifically in the preventative questions and self management/patient management areas of our survey.

Response Rates
Response Rates 2014 2015 2016 YTDLivingston 11% 16% 30%Rushville 14% 26% 29%Utica 10% 21% 29%Wayne 18% 25%
0
0.1
0.2
0.3
0.4
0.5
0.6
0.7
0.8
0.9
1
Livingston Rushville Utica Wayne
2014
2015
2016 YTD
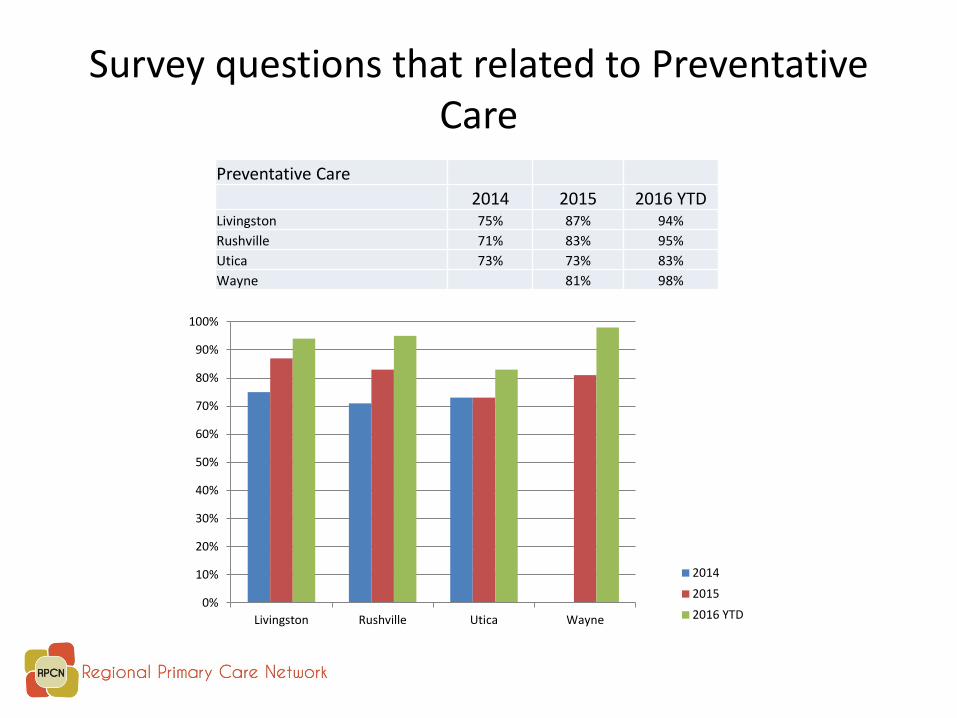
Survey questions that related to Preventative Care
Preventative Care 2014 2015 2016 YTD
Livingston 75% 87% 94%Rushville 71% 83% 95%Utica 73% 73% 83%Wayne 81% 98%
0%
10%
20%
30%
40%
50%
60%
70%
80%
90%
100%
Livingston Rushville Utica Wayne
2014
2015
2016 YTD
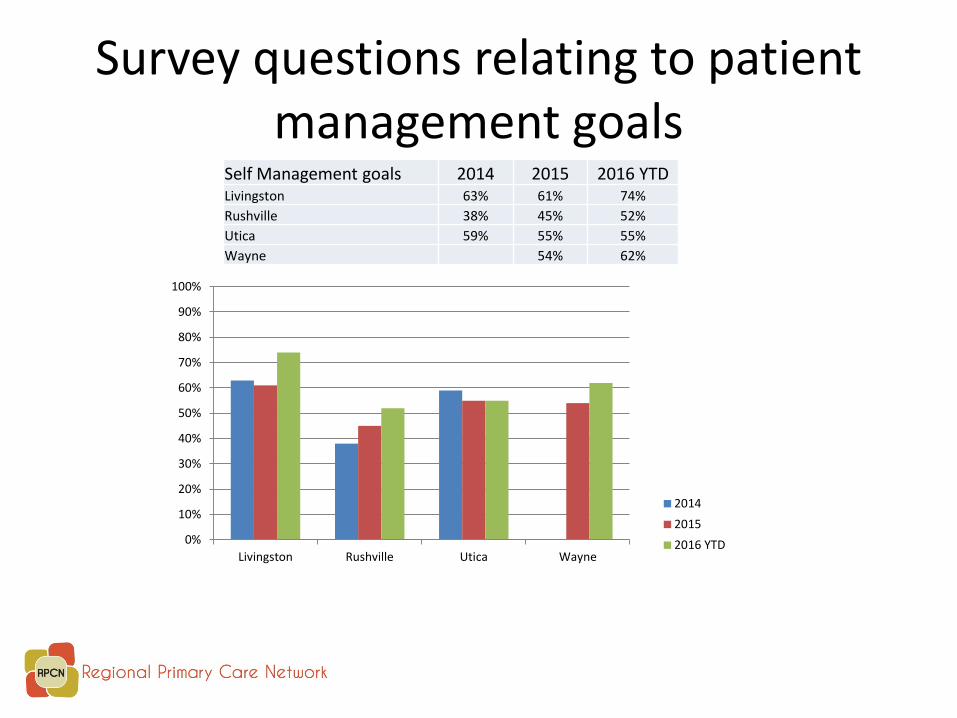
Survey questions relating to patient management goals
Self Management goals 2014 2015 2016 YTDLivingston 63% 61% 74%Rushville 38% 45% 52%Utica 59% 55% 55%Wayne 54% 62%
0%
10%
20%
30%
40%
50%
60%
70%
80%
90%
100%
Livingston Rushville Utica Wayne
201420152016 YTD

Next Steps for our Organization
Establishing a measurable way to assess whether patient’s risk has decreased due to establishing CRA and patient management goals.Expanding to our entire patient
population.

Questions?