Caries Assessment in Orthodontic Patients Assessment in Orthodontic Patients Naif A. Almosa...
76
Caries Assessment in Orthodontic Patients Naif A. Almosa Department of Orthodontics Institute of Odontology at the Sahlgrenska Academy University of Gothenburg Gothenburg, Sweden UNIVERSITY OF GOTHENBURG MINISTRY OF HIGHER EDUCATION SAUDI ARABIA Gothenburg 2014
Transcript of Caries Assessment in Orthodontic Patients Assessment in Orthodontic Patients Naif A. Almosa...
Caries Assessment in Orthodontic Patients
Naif A. Almosa
Department of Orthodontics Institute of Odontology at the Sahlgrenska Academy
University of Gothenburg Gothenburg, Sweden
UNIVERSITY OF GOTHENBURG
MINISTRY OF HIGHER EDUCATION
SAUDI ARABIA
Gothenburg 2014
2
A doctoral thesis at a university in Sweden is produced either as a monograph or as a collection of
papers. In the latter case, the introductory part constitutes the formal thesis, which summarizes the
accompanying papers. All clinical photographs used in this thesis were taken by the author and they
may not be used without written permission from the author. No part of this publication may be
reproduced or transmitted, in any form or by any means, without written permission from the author.
Permission from the journals has been obtained to attach papers I, II, and III to this thesis. The cover
page idea by Naif Almosa and illustrations by Yvonne Heijl.
Printed by Kompendiet, Göteborg, SwedenISBN 978-91-628-8963-0

3
For my mother:
Your pride in me was infinite, your trust unequivocal and your love
eternal. I wish you could have been here to share this moment with me.
You are always in my heart, �I love you�.

CONTENTS
5 5
CONTENTS
ABSTRACT…………………………………………………………7
PREFACE…………………………………………………...............9
INTRODUCTION………………………………………………….11
AIMS…………..…………………………………………………...27
MATERIAL AND METHODS…….………………………………29
RESULTS………………………………………………………..…41
DISCUSSION………………………………………………...….... 55
CONCLUSIONS..………………………………………….……... 63
ACKNOWLEDGEMENTS ………………………………..……... 65
REFERENCES ……………………………………………………. 67
PAPERS I-IV …….…………..…………………………………… 79

6
Caries Assessment in Orthodontic Patients
6
7
ABSTRACT
7
ABSTRACT Caries Assessment in Orthodontic Patients Correspondence to: Naif A. Almosa, Department of Orthodontics, Institute of Odontology, The Sahlgrenska Academy, University of Gothenburg, Box 450, SE-405 30 Gothenburg, Sweden. E-mail: [email protected]
Background and aims: White spot lesions (WSLs) are the most common adverse effect related to orthodontic treatment that may develop into manifest caries lesions if preventive measures are not strictly followed. Caries prevalence has historically been high in the Kingdom of Saudi Arabia (KSA) and the Middle East. Dental caries has previously been evaluated by different techniques. The aims of this thesis were to study: 1) Caries-related factors in orthodontic patients at de-bonding, and compare caries risk profiles between the governmental (G) and private (P) orthodontic patients, 2) The prevalence of buccal caries lesions including WSLs at de-bonding in the G and P orthodontic patients, using the international caries detection and assessment system (ICDAS-II) and the DIAGNOdent Pen, 3) The severity of buccal caries lesions according to ICDAS-II via digital photographs and compare this method with clinical examinations, and 4) Caries-related factors and evaluate caries risks for the G and P orthodontic patients at de-bonding and after four years (longitudinal study).
Methodology: A cross-sectional evaluation was carried out on 89 patients at de-bonding; 45 patients in the G-group and 44 patients in the P-group (Studies I and II). Thirteen postgraduate orthodontic students examined 245 close-up digital photographs (Study III). A longitudinal evaluation was performed on 40 out of the 89 baseline patients; (G=20) (P=20). Investigations included a questionnaire, oral clinical examinations, plaque scoring, saliva sampling, bitewing radiographs, and using the computerized caries risk program “Cariogram” to illustrate the caries risk profiles (Studies I and IV). Assessment of the severity of buccal caries lesions was evaluated by using ICDAS-II, DIAGNOdent Pen (Study II), and digital photographs (Study III).
Results and conclusions: Study I, the findings revealed that “the chance of avoiding new cavities”, according to the Cariogram model, was higher in the P-group compared to the G-group (61% and 28%, respectively) (P < .001). Decayed, missing, and filled surfaces (DMFS), plaque index, mutans streptococci and lactobacilli counts were significantly higher in the G-group compared to the P-group (P < .05). Study II, the G-group showed statistically significantly higher prevalence of buccal caries lesions including WSLs compared to the P-group evaluated by ICDAS-II, DIAGNOdent Pen (P < .0001). ICDAS-II showed that 43% of the patients in the P-group and 9% in the G-group were free from any WSLs. In the G-group, 22% of the patients versus none in the P-group had 16 lesions or more. The Spearman’s correlation coefficient between the two methods was 0.71, which revealed that the clinical index (ICDAS-II) showed a good correlation with the DIAGNOdent Pen. Study III, intra-examiner reliability and the reliability between each examiner and the clinical examination showed moderate to excellent agreement, with kappa values of 0.52-0.83. The Spearman’s correlation coefficient, between scoring buccal caries lesions via clinical examinations and scoring via photographs, was 0.76, which revealed that scoring buccal caries lesions on digital photographs according to ICDAS-II criteria is a reliable and valid method for assessing the severity of buccal caries lesions. Study IV, the chances to avoid new cavities after four years from de-bonding improved from 31% to 52%, and from 58% to 77% in the G-group and the P-group, respectively. This improvement was also observed for all patients (G+P) from 44% to 64% (P < .001). Caries risks according to the Cariogram at de-bonding and after four years is greater in the patients treated at the governmental clinics compared to the private clinics. Keywords: buccal caries, Cariogram, digital photographs, fixed appliance, ICDAS, laser fluorescence, orthodontics, risk assessment, Saudi Arabia, white spot lesions. ISBN: 978-91-628-8963-0

Caries Assessment in Orthodontic Patients
8 8
9
PREFACE
9
PREFACE
This thesis is based on the following four original papers, which are referred to in the
text by their Roman numerals:
I. Almosa NA, Al-Mulla AH, Birkhed D. Caries risk profile using the Cariogram
in governmental and private orthodontic patients at de-bonding. Angle
Orthodontist Journal. 82: 267–274, 2012.
II. Almosa NA, Lundgren T, Aldrees AM, Birkhed D, Kjellberg H. Diagnosing
the severity of buccal caries lesions in governmental and private orthodontic
patients at de-bonding, using the ICDAS-II and the DIAGNOdent Pen. Angle
Orthodontist Journal, online publication, 21 Oct 2013.
III. Almosa NA, Lundgren T, Bresin A, Birkhed D, Kjellberg H. Diagnosing the
severity of buccal caries lesions in orthodontic patients at de-bonding using
digital photographs. Acta Odontologica Scandinavica, online publication, 9
Dec 2013.
IV. Almosa NA, Lundgren T, Al-Mulla AH, Birkhed D, Kjellberg H. Caries risk
profile in orthodontic patients: A 4-year longitudinal study using the
Cariogram model in governmental vs. private clinics. Submitted.

Caries Assessment in Orthodontic Patients
10 10
11
INTRODUCTION
11
INTRODUCTION
In humans, the oral cavity is highly complex and composed of hundreds of bacterial
species (Marcotte and Lavoie 1998), with the distribution of bacterial species varying
qualitatively and quantitatively according to habitat (Smith et al. 1993). In teeth,
dental plaque develops favorably on surfaces protected from mechanical friction, such
as the sub-gingival area, approximal surfaces between two teeth, and the pits and
fissures of the occlusal surfaces (Marsh 1999). Fixed orthodontic appliances are an
example of creating retentive areas, therefore increasing the plaque accumulation and
the number of cariogenic microorganisms (Chatterjee and Kleinberg 1979; Gwinnett
and Ceen 1979; Scheie et al. 1984). Thus, enamel decalcification or the development
of White Spot Lesions (WSLs) on the enamel surface is by far the most important
iatrogenic effect of fixed orthodontic appliance therapy (Øgaard et al. 2004). Such
initial enamel decalcifications can be seen as early as four weeks after the beginning
of fixed orthodontic appliances (Øgaard et al. 1988a), and may remain a long time
after the orthodontic treatment is completed (O'Reilly and Featherstone 1987).
Despite improvements in materials and preventive efforts, the risk of enamel
demineralization, caused by orthodontic treatment, continues to be a considerable side
effect (Lovrov et al. 2007). Studies have shown that more than 50% of orthodontic
patients may experience an increase in the number of WSLs with fixed orthodontic
appliances (Gorelick et al. 1982; Mizrahi 1983; Artun and Brobakken 1986), and are
more susceptible to the development of WSLs than untreated patients (Øgaard 1989).
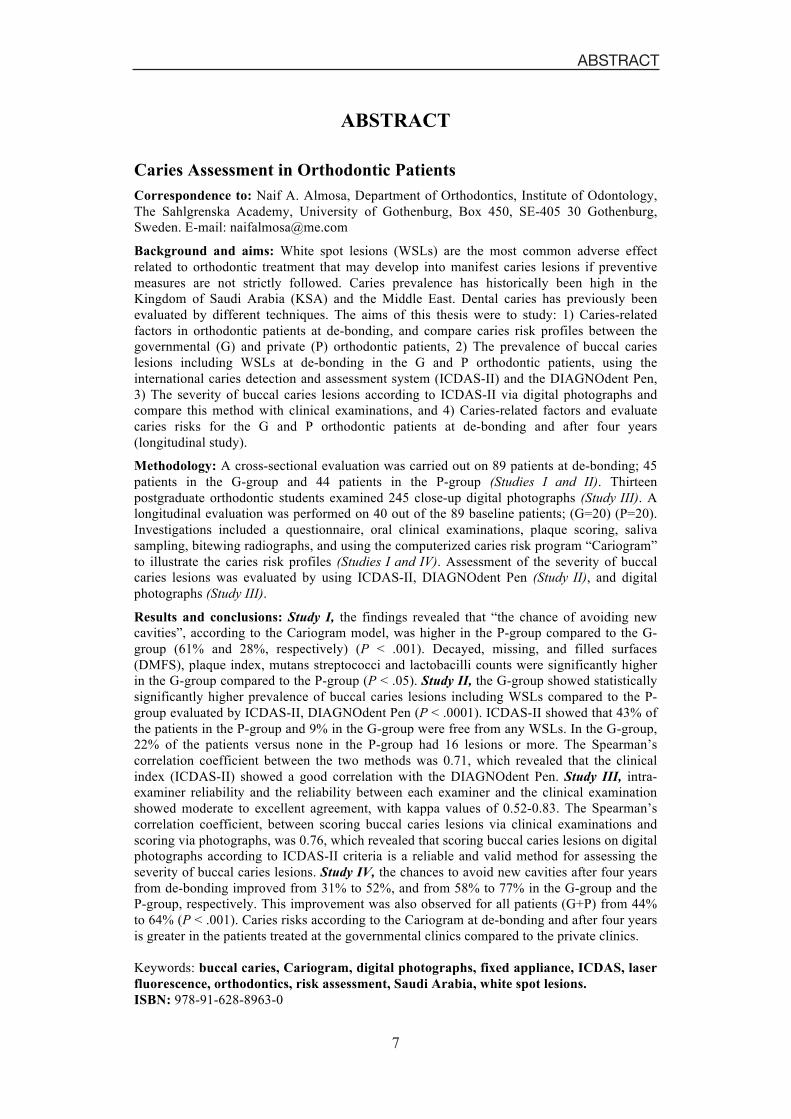
Significant decalcification may develop and become irreversible already within six
months after orthodontic bonding (Lucchese and Gherlone 2013) (Figure 1).
Considering how quickly WSLs can develop and become irreversible, early diagnosis
is crucial in evaluating the oral hygiene status of patients during the whole
orthodontic treatment period, particularly the first months of treatment, and if
necessary, implement preventive actions immediately in order to prevent
demineralization.
Several studies have been made to find the proper solution to prevent the development
of dental caries during orthodontic treatment with fixed appliances. Some studies
have investigated the microbial profile of different bracket materials, and the bonding
materials themselves with respect to their ability to reduce the risk of
Caries Assessment in Orthodontic Patients
12 12
demineralization (Anhoury et al. 2002; Lin et al. 2008; Schmidlin et al. 2008; Paschos
et al. 2009). Some studies were focused on the prevention of caries by using topical
fluoride or antibacterial agents in the form of rinses, varnishes or gels (Jenatschke et
al. 2001; Øgaard et al. 2001; Benson et al. 2005a; Stecksen-Blicks et al. 2007).
Figure 1. Caries development under bonded tube at de-bonding.
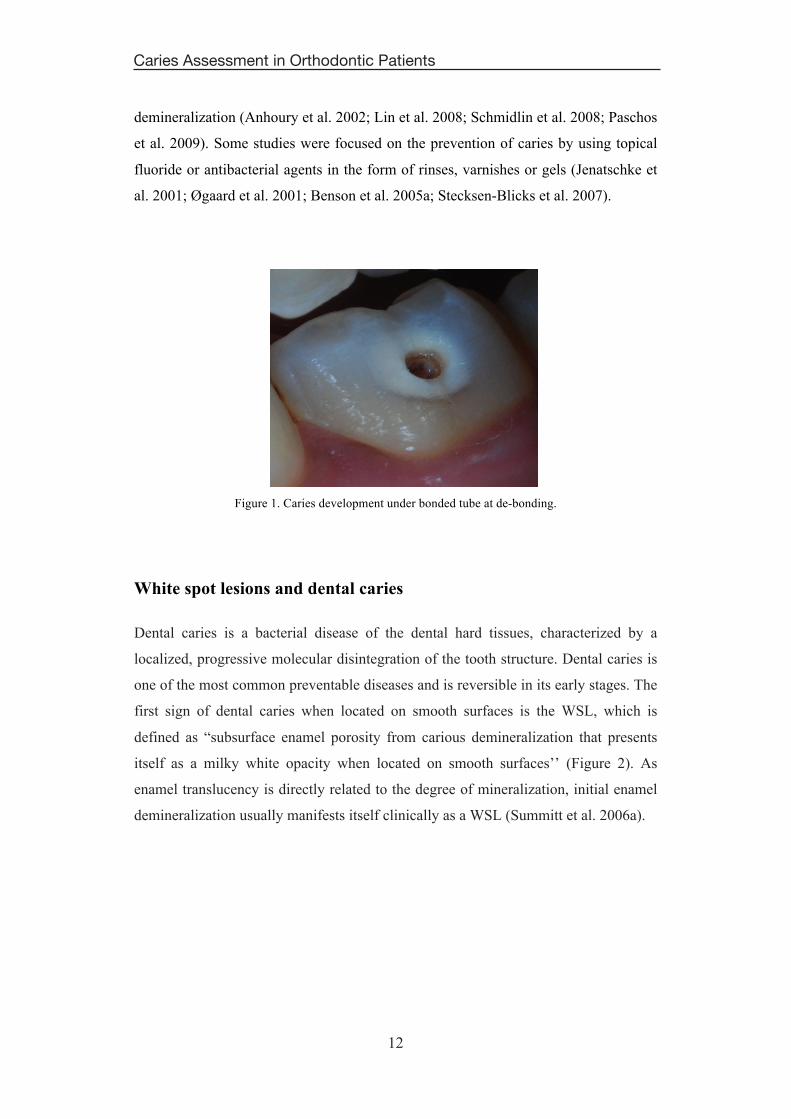
White spot lesions and dental caries
Dental caries is a bacterial disease of the dental hard tissues, characterized by a
localized, progressive molecular disintegration of the tooth structure. Dental caries is
one of the most common preventable diseases and is reversible in its early stages. The
first sign of dental caries when located on smooth surfaces is the WSL, which is
defined as “subsurface enamel porosity from carious demineralization that presents
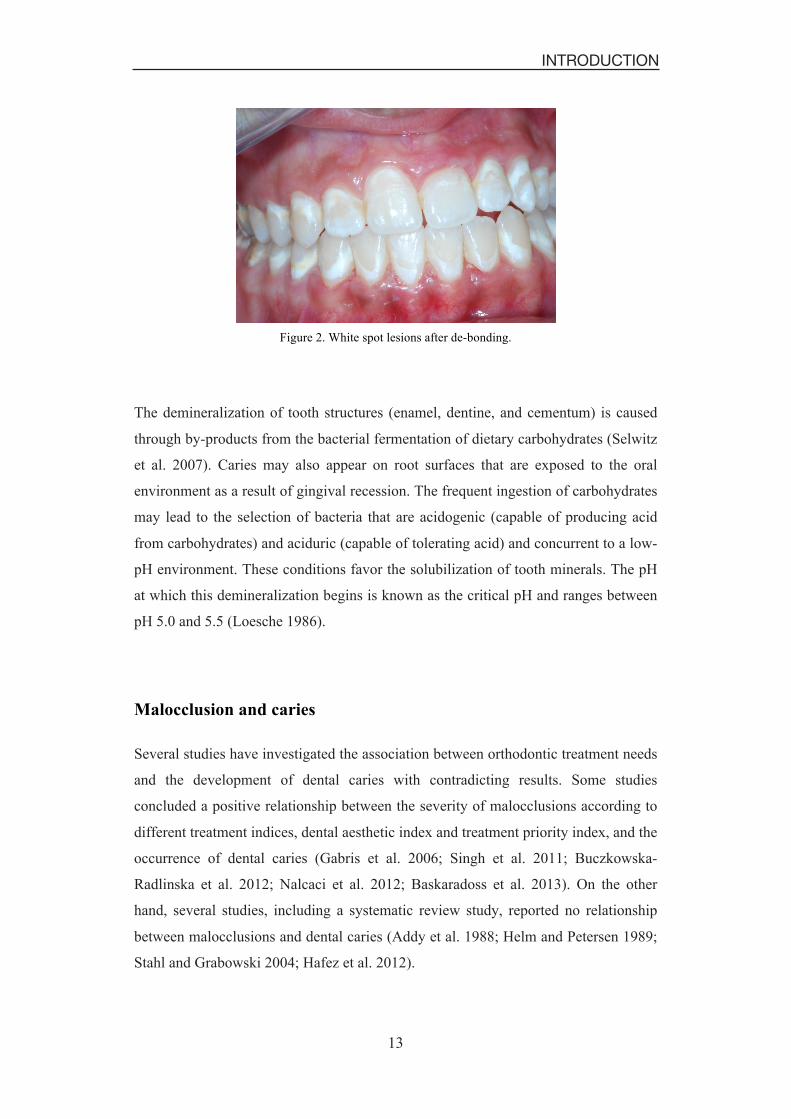
itself as a milky white opacity when located on smooth surfaces’’ (Figure 2). As
enamel translucency is directly related to the degree of mineralization, initial enamel
demineralization usually manifests itself clinically as a WSL (Summitt et al. 2006a).
13
INTRODUCTION
13
Figure 2. White spot lesions after de-bonding.
The demineralization of tooth structures (enamel, dentine, and cementum) is caused
through by-products from the bacterial fermentation of dietary carbohydrates (Selwitz
et al. 2007). Caries may also appear on root surfaces that are exposed to the oral
environment as a result of gingival recession. The frequent ingestion of carbohydrates
may lead to the selection of bacteria that are acidogenic (capable of producing acid
from carbohydrates) and aciduric (capable of tolerating acid) and concurrent to a low-
pH environment. These conditions favor the solubilization of tooth minerals. The pH
at which this demineralization begins is known as the critical pH and ranges between
pH 5.0 and 5.5 (Loesche 1986).
Malocclusion and caries
Several studies have investigated the association between orthodontic treatment needs
and the development of dental caries with contradicting results. Some studies
concluded a positive relationship between the severity of malocclusions according to
different treatment indices, dental aesthetic index and treatment priority index, and the
occurrence of dental caries (Gabris et al. 2006; Singh et al. 2011; Buczkowska-
Radlinska et al. 2012; Nalcaci et al. 2012; Baskaradoss et al. 2013). On the other
hand, several studies, including a systematic review study, reported no relationship
between malocclusions and dental caries (Addy et al. 1988; Helm and Petersen 1989;
Stahl and Grabowski 2004; Hafez et al. 2012).
14
Caries Assessment in Orthodontic Patients
14
Caries prevalence in the Middle East and the Kingdom of Saudi
Arabia
Although caries prevalence has declined among children and adolescents in many
countries (World Health Organization 2003), it still remains a problematic issue in the
Middle East and the Kingdom of Saudi Arabia (KSA). The caries experience among
preschool children was reported to be 72% in the United Arab Emirates and Jordan
(Al-Mughery et al. 1991; Janson and Fakhouri 1993). Another study showed that the
mean number of decayed, missing, and filled surfaces (DMFS) of a random sample of
1,096 adult Jordanian patients was 34.9. All subjects had coronal caries experience
and 93% had untreated lesions (Hamasha and Safadi 2008).
The caries experience among primary and intermediate school-children in the central
regions of KSA was more than 90% (Al Dosari et al. 2004), and 63% in the eastern
regions of KSA (Wyne et al. 2002). In the western regions of KSA, it was reported
that 96% of the children were diagnosed with caries, and only 4% were clinically
caries free (Al-Malik and Rehbini 2006). In 2008, it was reported that the overall
caries prevalence among preschool children in KSA was approximately 75%. The
caries prevalence and severity were significantly higher among children from
government preschools compared to those from private preschools (Wyne 2008).
Recently, a meta-analysis was performed on a Saudi population to evaluate dental
caries. They found that the mean value of the DMFT was 3.3 in the permanent
dentition (Khan et al. 2013).
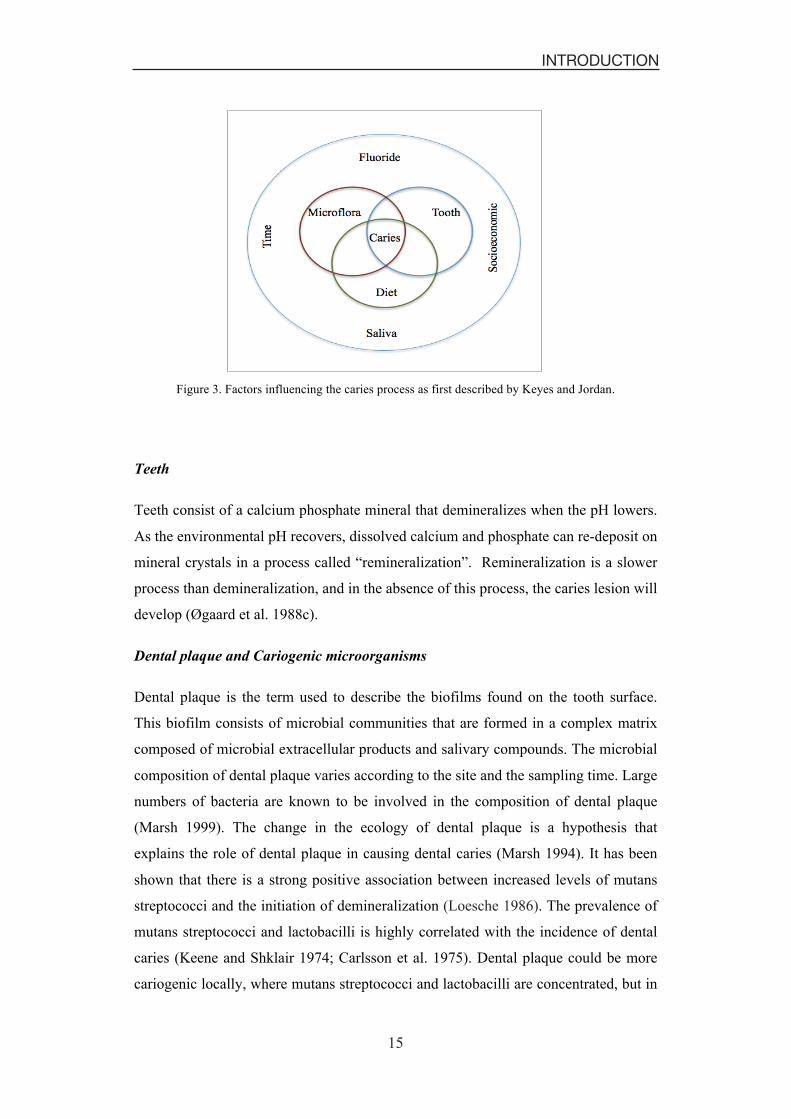
Caries-related factors
The factors involved in the caries process were presented in the 1960s in a model of
overlapping circles including the tooth, the diet, and the microflora (Keyes and Jordan
1963). Since then, the model has been modified and supplemented with factors of
time, fluoride, saliva, and social and demographic factors (Figure 3).
15
INTRODUCTION
15
Figure 3. Factors influencing the caries process as first described by Keyes and Jordan.
Teeth
Teeth consist of a calcium phosphate mineral that demineralizes when the pH lowers.
As the environmental pH recovers, dissolved calcium and phosphate can re-deposit on
mineral crystals in a process called “remineralization”. Remineralization is a slower
process than demineralization, and in the absence of this process, the caries lesion will
develop (Øgaard et al. 1988c).
Dental plaque and Cariogenic microorganisms
Dental plaque is the term used to describe the biofilms found on the tooth surface.
This biofilm consists of microbial communities that are formed in a complex matrix
composed of microbial extracellular products and salivary compounds. The microbial
composition of dental plaque varies according to the site and the sampling time. Large
numbers of bacteria are known to be involved in the composition of dental plaque
(Marsh 1999). The change in the ecology of dental plaque is a hypothesis that
explains the role of dental plaque in causing dental caries (Marsh 1994). It has been
shown that there is a strong positive association between increased levels of mutans
streptococci and the initiation of demineralization (Loesche 1986). The prevalence of
mutans streptococci and lactobacilli is highly correlated with the incidence of dental
caries (Keene and Shklair 1974; Carlsson et al. 1975). Dental plaque could be more
cariogenic locally, where mutans streptococci and lactobacilli are concentrated, but in
16
Caries Assessment in Orthodontic Patients
16
daily practice, it is still difficult to identify cariogenic plaque. It is much easier to
count mutans streptococci and lactobacilli in saliva compared to dental plaque. High
numbers of mutans streptococci and lactobacilli are likely a result of a high sugar
intake, which results in low pH levels in dental plaque (De Stoppelaar et al. 1970;
McDermid et al. 1986). It has been shown that the reduction of sugar intake will
reduce the number of mutans streptococci and lactobacilli (Edwardsson and Krasse
1967; De Stoppelaar et al. 1970). One study showed that individuals who followed
certain diet programs had a reduction of mutans streptococci and lactobacilli counts
by half (Andreen and Köhler 1992).
Dietary intake
Dietary carbohydrates are necessary for bacteria to produce the acids that initiate the
demineralization process (Paes Leme et al. 2006). In general, the rule of diet to
produce caries lesions is based on three principles: the drop in environmental pH, the
frequency of intake, and the cariogenicity of foods (Summitt et al. 2006b). However,
an epidemiological study showed that there is a lack of relationship between the
amount of sugar consumed and caries occurrence (Woodward and Walker 1994).
Moreover, a systematic review investigation has not identified any studies showing
that the reduction of sugar intake on its own affects the caries prevalence (Lingström
et al. 2003).
Time
Dental caries was commonly considered to be a chronic disease, but time was
introduced into the process to indicate that the substrate (dietary sugars) must be
present for a sufficient length of time to cause demineralization (Summitt et al.
2006b). Today, it is known that demineralization can be initiated within four weeks
after orthodontic treatment (Øgaard et al. 1988a), and its effects can be arrested or
repaired by enhancing preventive measures to encourage the remineralization process
(Øgaard et al. 1988b).
Use of fluoride
The mechanism by which fluoride inhibits demineralization is by the re-deposit of
dissolved calcium and phosphate, thereby preventing these constituents from being
latched out of the enamel into the plaque and saliva (Ten Cate and Duijsters 1983).
17
INTRODUCTION
17
Fluoride toothpaste may be the main reason for the observed caries decline in
developed countries, although other reasons should also be taken into account (Hänsel
Petersson and Bratthall 1996). Daily fluoride mouth rinsing in orthodontic patients
decreased the WSLs development significantly (Øgaard et al. 1988b). However, high
caries prevalence was still observed in a number of populations living in areas with
water fluoridation (Al Dosari et al. 2004; Whelton 2004), indicating that fluoride used
alone may not be sufficient to overcome other caries-related factors.
Saliva
The important role of saliva is clearly demonstrated by the occurrence of rampant
caries that may develop in subjects with a compromised salivary flow rate. Saliva
helps to neutralize and clear the acids and carbohydrates from dental plaque.
However, the clearance is not uniform throughout the mouth and may be slower at the
labial surfaces of maxillary incisors and buccal surfaces of mandibular molars. Saliva
has several functions including a specific flushing effect, the maintenance of calcium
super-saturation in plaque, the neutralisation of acids, raising the plaque pH and
reversing the diffusion rate of calcium and phosphate toward the tooth surface
(Lenander-Lumikari and Loimaranta 2000).
Several studies have investigated the effect of fixed orthodontic appliances on the
salivary flow rate. Some studies concluded that during the early stages of fixed
orthodontic treatment, the whole saliva flow rate increased significantly (Chang et al.
1999; Li et al. 2009; Mummolo et al. 2013), while another study proved that no
significant differences were found in the salivary flow rate before, during, and after
orthodontic treatment (Sanpei et al. 2010).
Social and Demographic factors
Dental caries is more prevalent in the lower socioeconomic categories and among
some ethnic groups (Truin et al. 1998). Some studies have shown that for the
prediction of caries development, social and demographic factors could be successful
in very young children, but for older individuals, clinical parameters are more
predictive (Demers et al. 1992; Grindefjord et al. 1995).
18
Caries Assessment in Orthodontic Patients
18
Detection and Diagnosis
Caries risk assessment
Caries risk assessment (CRA) is an essential component in the decision-making
process for the prevention and management of dental caries. It is important to include
CRA in treatment plans in order to assist the clinician concerning treatment and recall
appointments. An ideal CRA system should have high validity and reliability, easy to
use in practice and be low in cost (Hänsel Petersson et al. 2010). In case of
multifactorial diseases, such as dental caries, the assessment of risk of occurrence is
quite difficult. Risk is defined as the possibility of occurrence of a harmful event.
Risk assessment is the means of organizing and analyzing all the available scientific
information having a bearing on the question under discussion (Rodricks 1992). A
proper risk assessment model is the model that takes into consideration multiple
variables in order to recognize one or more risk factors for the disease, so that proper
intervention can be planned (Beck 1998).
In 2008, the Swedish Council on Technology Assessment in Health Care reported that
current CRA models had low accuracy but good reliability in identifying those with a
low risk of developing caries (The Swedish Council on Technology Assessment in
Health Care 2008). Professional organizations and academic institutions in the past
decade have proposed several risk assessment systems/guidelines. Examples of these
systems/guidelines reported in literature are: (i) The Cariogram (Bratthall 1996), (ii)
The Caries Management by Risk Assessment Philosophy (CAMBRA) advocated by
the California Dental Association (Featherstone et al. 2007), iii) The CRA tool
proposed by the American Academy of Pediatric Dentistry (American Academy of
Pediatric Dentistry 2008), and (iv) The American Dental Association CRA forms
(American Dental Association caries risk assessment forms, accessed January 2013)
Cariogram
The Cariogram (Bratthall 1996) is one example of pedagogic caries risk assessment
models that has been used to identify high caries risk individuals. The application of
risk assessment models in clinical settings may be useful and has been recommended
by major organizations (Featherstone et al. 2003). The Cariogram is a computer-based
19
INTRODUCTION
19
program to illustrate the interaction between caries-related factors. This program has
been developed for a better understanding of the multifactorial aspects of dental caries
and to act as a guide in attempts to estimate caries risks. The main purpose of the
Cariogram is to demonstrate the caries risk graphically, expressed as the ”chance to
avoid new caries” in the near future. In addition, this program is designed to
encourage the application of preventive measures to avoid development of new
cavities (Cariogram computer program manual, accessed February 2008).
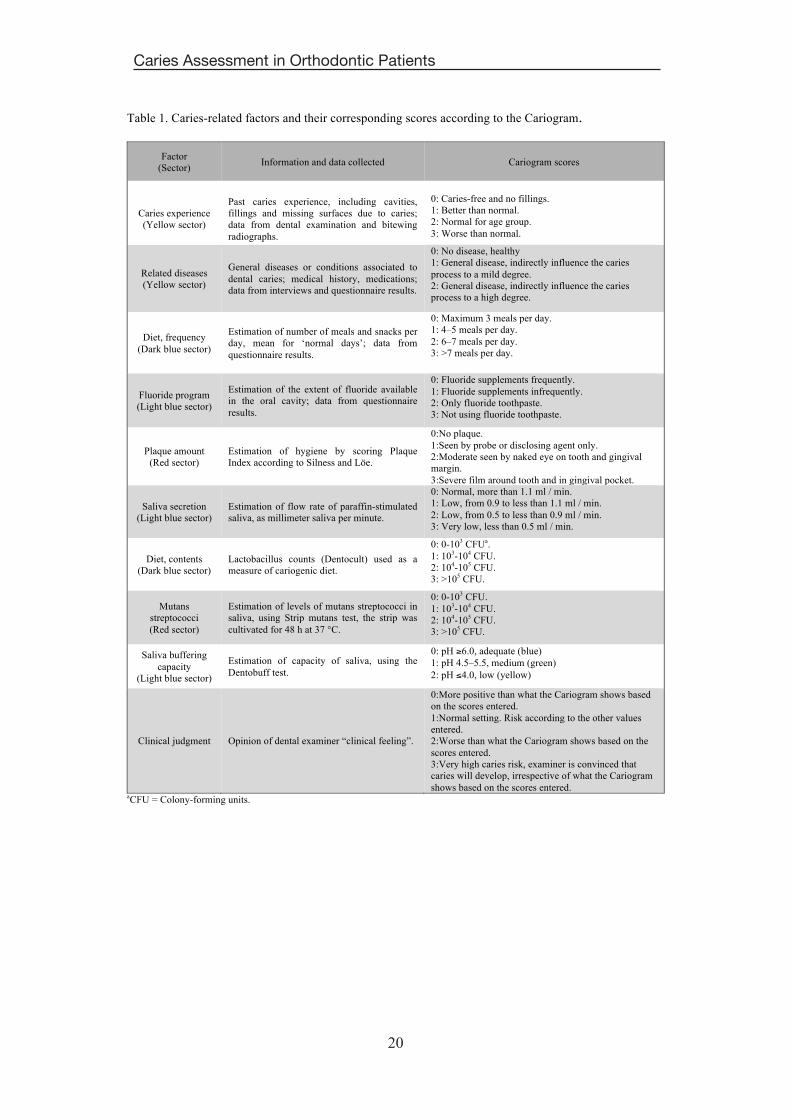
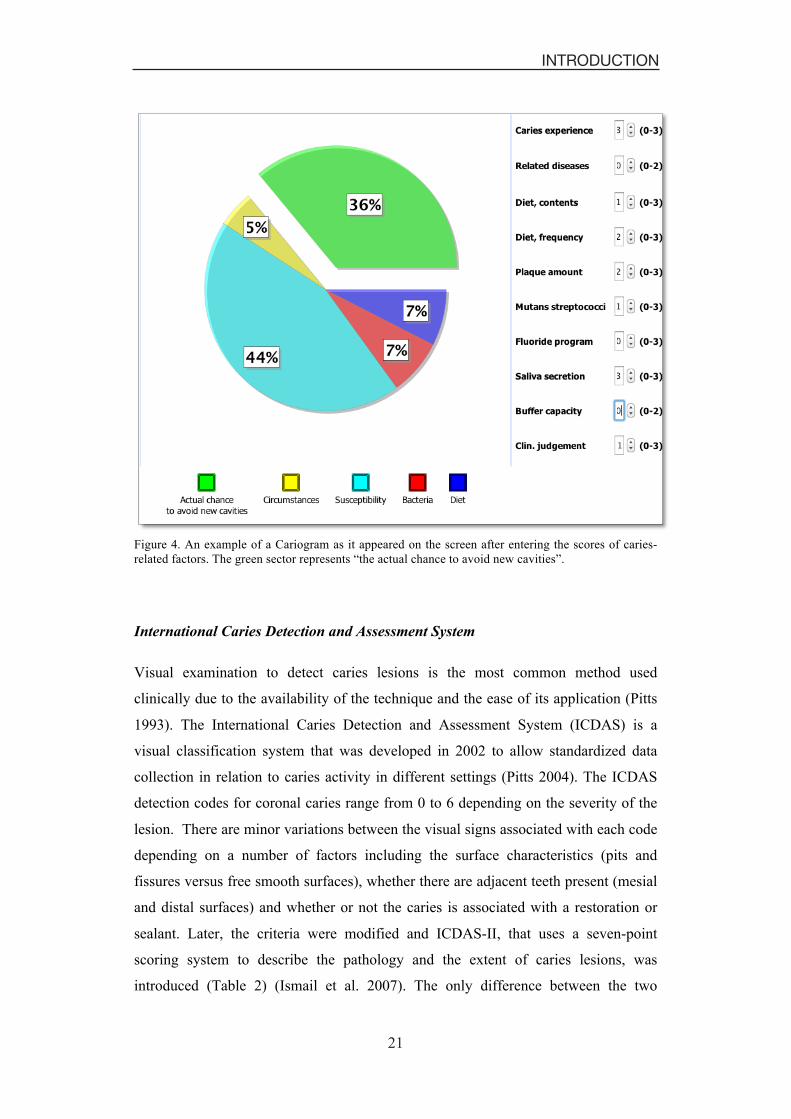
Data of ten caries-related factors ranked from 0-2 or 0-3 are included and scored into
the program to produce a pie chart that illustrates the “chance of avoiding new
cavities” as a percentage value (Table 1). This pie chart has five colored sectors
expressed as percentages (Figure 4); (i) Dark blue sector “Diet”, based on a
combination of sugar intake and the number of lactobacilli; (ii) Red sector “Bacteria”,
based on a combination of the plaque score and the number of mutans streptococci;
(iii) Light blue sector “Susceptibility”, based on a fluoride program, salivary secretion
rate and buffer capacity; (iv) Yellow sector “Circumstances”, based on past caries
experience and general diseases; and (v) Green sector “the chance of avoiding caries”,
which is the actual outcome of the Cariogram model.
A correlation between the Cariogram results and the caries increment over time for
both children and adults was approved (Hänsel Petersson et al. 2002; Hänsel
Petersson et al. 2003), and the validity of the Cariogram has been confirmed (Campus
et al. 2012). Using the Cariogram in clinical practice as a pedagogical tool has been
found to be promising to explain the caries situation to patients and therefore help
them to improve their preventive measures (Hänsel Petersson and Bratthall 2000).
20
Caries Assessment in Orthodontic Patients
20
Table 1. Caries-related factors and their corresponding scores according to the Cariogram.
Factor (Sector) Information and data collected Cariogram scores
Caries experience (Yellow sector)
Past caries experience, including cavities, fillings and missing surfaces due to caries; data from dental examination and bitewing radiographs.
0: Caries-free and no fillings. 1: Better than normal. 2: Normal for age group. 3: Worse than normal.
Related diseases (Yellow sector)
General diseases or conditions associated to dental caries; medical history, medications; data from interviews and questionnaire results.
0: No disease, healthy 1: General disease, indirectly influence the caries process to a mild degree. 2: General disease, indirectly influence the caries process to a high degree.
Diet, frequency (Dark blue sector)
Estimation of number of meals and snacks per day, mean for ‘normal days’; data from questionnaire results.
0: Maximum 3 meals per day. 1: 4–5 meals per day. 2: 6–7 meals per day. 3: >7 meals per day.
Fluoride program (Light blue sector)
Estimation of the extent of fluoride available in the oral cavity; data from questionnaire results.
0: Fluoride supplements frequently. 1: Fluoride supplements infrequently. 2: Only fluoride toothpaste. 3: Not using fluoride toothpaste.
Plaque amount (Red sector)
Estimation of hygiene by scoring Plaque Index according to Silness and Löe.
0:No plaque. 1:Seen by probe or disclosing agent only. 2:Moderate seen by naked eye on tooth and gingival margin. 3:Severe film around tooth and in gingival pocket.
Saliva secretion (Light blue sector)
Estimation of flow rate of paraffin-stimulated saliva, as millimeter saliva per minute.
0: Normal, more than 1.1 ml / min. 1: Low, from 0.9 to less than 1.1 ml / min. 2: Low, from 0.5 to less than 0.9 ml / min. 3: Very low, less than 0.5 ml / min.
Diet, contents (Dark blue sector)
Lactobacillus counts (Dentocult) used as a measure of cariogenic diet.
0: 0-103 CFUa. 1: 103-104 CFU. 2: 104-105 CFU. 3: >105 CFU.
Mutans streptococci (Red sector)
Estimation of levels of mutans streptococci in saliva, using Strip mutans test, the strip was cultivated for 48 h at 37 °C.
0: 0-103 CFU. 1: 103-104 CFU. 2: 104-105 CFU. 3: >105 CFU.
Saliva buffering capacity
(Light blue sector)
Estimation of capacity of saliva, using the Dentobuff test.
0: pH �6.0, adequate (blue) 1: pH 4.5–5.5, medium (green) 2: pH �4.0, low (yellow)
Clinical judgment Opinion of dental examiner “clinical feeling”.
0:More positive than what the Cariogram shows based on the scores entered. 1:Normal setting. Risk according to the other values entered. 2:Worse than what the Cariogram shows based on the scores entered. 3:Very high caries risk, examiner is convinced that caries will develop, irrespective of what the Cariogram shows based on the scores entered.
aCFU = Colony-forming units.
21
INTRODUCTION
21
Figure 4. An example of a Cariogram as it appeared on the screen after entering the scores of caries-related factors. The green sector represents “the actual chance to avoid new cavities”.
International Caries Detection and Assessment System
Visual examination to detect caries lesions is the most common method used
clinically due to the availability of the technique and the ease of its application (Pitts
1993). The International Caries Detection and Assessment System (ICDAS) is a
visual classification system that was developed in 2002 to allow standardized data
collection in relation to caries activity in different settings (Pitts 2004). The ICDAS
detection codes for coronal caries range from 0 to 6 depending on the severity of the
lesion. There are minor variations between the visual signs associated with each code
depending on a number of factors including the surface characteristics (pits and
fissures versus free smooth surfaces), whether there are adjacent teeth present (mesial
and distal surfaces) and whether or not the caries is associated with a restoration or
sealant. Later, the criteria were modified and ICDAS-II, that uses a seven-point
scoring system to describe the pathology and the extent of caries lesions, was
introduced (Table 2) (Ismail et al. 2007). The only difference between the two
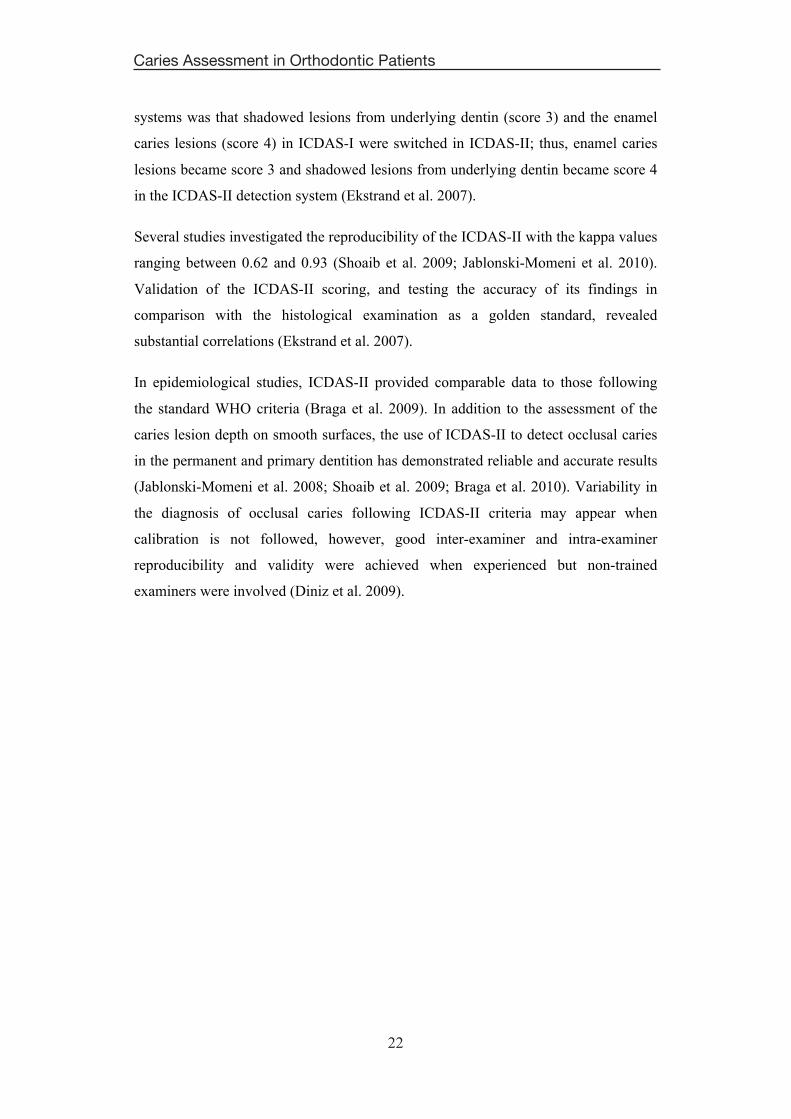
22
Caries Assessment in Orthodontic Patients
22
systems was that shadowed lesions from underlying dentin (score 3) and the enamel
caries lesions (score 4) in ICDAS-I were switched in ICDAS-II; thus, enamel caries
lesions became score 3 and shadowed lesions from underlying dentin became score 4
in the ICDAS-II detection system (Ekstrand et al. 2007).
Several studies investigated the reproducibility of the ICDAS-II with the kappa values
ranging between 0.62 and 0.93 (Shoaib et al. 2009; Jablonski-Momeni et al. 2010).
Validation of the ICDAS-II scoring, and testing the accuracy of its findings in
comparison with the histological examination as a golden standard, revealed
substantial correlations (Ekstrand et al. 2007).
In epidemiological studies, ICDAS-II provided comparable data to those following
the standard WHO criteria (Braga et al. 2009). In addition to the assessment of the
caries lesion depth on smooth surfaces, the use of ICDAS-II to detect occlusal caries
in the permanent and primary dentition has demonstrated reliable and accurate results
(Jablonski-Momeni et al. 2008; Shoaib et al. 2009; Braga et al. 2010). Variability in
the diagnosis of occlusal caries following ICDAS-II criteria may appear when
calibration is not followed, however, good inter-examiner and intra-examiner
reproducibility and validity were achieved when experienced but non-trained
examiners were involved (Diniz et al. 2009).
23
INTRODUCTION
23
Table 2. International Caries Detection and Assessment System (ICDAS-II) for free smooth surfaces.
Score Meaning
0 Sound tooth surface: There is no evidence of caries (either no or questionable change in enamel translucency after prolonged air drying). Surfaces with developmental defects such as enamel hypoplasia; fluorosis; tooth wear, and extrinsic or intrinsic stains will be recorded as sound.
1 First visual change in enamel: When seen wet, there is no evidence of any change in color attributable to carious activity, but after prolonged air-drying, a carious opacity is visible.
2 Distinct visual change in enamel when viewed wet: There is a carious opacity or discoloration that is not consistent with the clinical appearance of sound enamel.
3 Localized enamel breakdown due to caries with no visible dentin: There is carious loss of surface integrity without visible dentin.
4 Underlying dark shadow from dentin with or without localized enamel breakdown: This lesion appears as a shadow of discolored dentin visible through the enamel surface beyond the white or brown spot lesion.
5 Distinct cavity with visible dentin. Cavitation in opaque or discolored enamel exposing the dentin beneath. If in doubt, or to confirm the visual assessment, the CPI probe can be used to confirm the presence of a cavity in dentin.
6 Extensive distinct cavity with visible dentin: The cavity is both deep and wide and dentin is clearly visible on the walls and at the base. An extensive cavity involves at least half of a tooth surface or possibly reaching the pulp.
DIAGNOdent
The evolvement of caries detection and quantification methods has lead to the
development of devices that are able to measure the extent of caries lesions and
monitor its progress (Tranaeus et al. 2005). KaVo DIAGNOdent (KaVo, Biberach,
Germany) is a portable laser fluorescence instrument that emits light from a diode
laser and can differentiate between sound and carious tooth tissue (Hibst and Gall
1998). It is a diagnostic instrument working on the basis of the differing fluorescence
between a healthy and diseased tooth substance. It reliably detects even the smallest
lesions without exposing the patient to radiation. The unit gives a digital numeric
read-out (0-99) to indicate the amount of fluorescence transmitted back. In the
presence of caries, fluorescence increases and the change is registered as a high
digital number (Hibst and Paulus 1999).
The authors suggested categorizing the readings into categories based on the extent of
the caries lesion for easier interpretation (Lussi et al. 1999; Lussi et al. 2004). Table 3
shows the values of DIAGNOdent and corresponding diagnosis and the recommended
24
Caries Assessment in Orthodontic Patients
24
treatment according to the manufacturer. These values are based on the fact that a
zero value was first measured on a healthy coronal location. The validity and
reproducibility of DIAGNOdent for the detection of caries on different tooth surfaces
has been investigated (Lussi et al. 1999; Shi et al. 2001; Pinelli et al. 2002). The
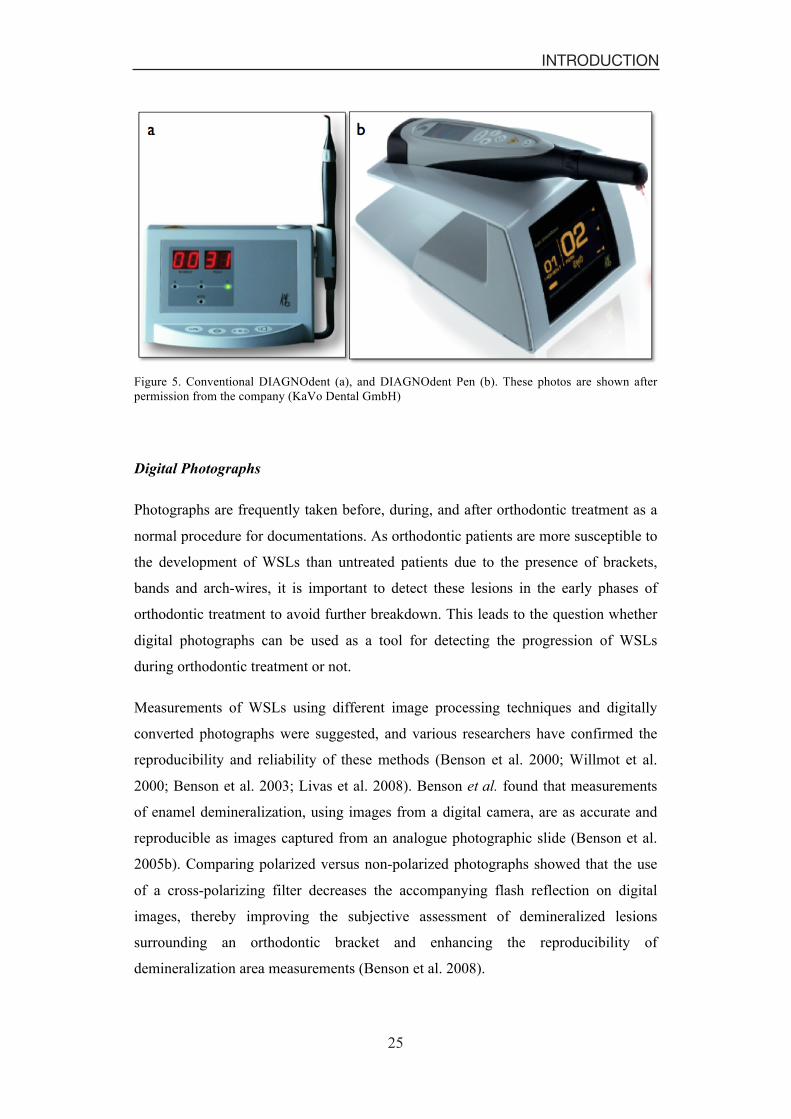
conventional DIAGNOdent and DIAGNOdent Pen (Figure 5) showed excellent
agreement in the quantification of smooth surface caries (Aljehani et al. 2007).
Table 3. DIAGNOdent pen values and corresponding diagnosis and treatment.
Display values Diagnosis - Treatment (therapy)
0 - 13 Healthy tooth - professional teeth cleaning (PTC).
14 - 20 Enamel caries - intensive PTC with fluoride treatment etc.
21 - 29 Deep enamel caries - intensive PTC with fluoride treatment and monitoring
- minimally invasive restorations - monitor caries risk factors.
� 30 Dentin caries - minimally invasive restorations and intensive PTC.
When compared to visual inspection and radiography, DIAGNOdent was more
sensitive, but with lower specificity (Bamzahim et al. 2004). Post-orthodontic WSLs
are accessible for direct clinical examination. However, due to the dynamic nature of
the caries process, the management of WSLs requires a careful evaluation of whether
the lesion is active, arrested or remineralized (Neilson and Pitts 1991). Well-defined
clinical criteria can validate the visual examination, but more objective assessment of
the caries lesion stage could be provided with the new caries detection devices.
DIAGNOdent was evaluated for the quantification of WSLs adjacent to fixed
orthodontic appliances in vitro, but the findings were not compared to calibrate visual
examination results (Aljehani et al. 2004).
25
INTRODUCTION
25
Figure 5. Conventional DIAGNOdent (a), and DIAGNOdent Pen (b). These photos are shown after permission from the company (KaVo Dental GmbH)
Digital Photographs
Photographs are frequently taken before, during, and after orthodontic treatment as a
normal procedure for documentations. As orthodontic patients are more susceptible to
the development of WSLs than untreated patients due to the presence of brackets,
bands and arch-wires, it is important to detect these lesions in the early phases of
orthodontic treatment to avoid further breakdown. This leads to the question whether
digital photographs can be used as a tool for detecting the progression of WSLs
during orthodontic treatment or not.
Measurements of WSLs using different image processing techniques and digitally
converted photographs were suggested, and various researchers have confirmed the
reproducibility and reliability of these methods (Benson et al. 2000; Willmot et al.
2000; Benson et al. 2003; Livas et al. 2008). Benson et al. found that measurements
of enamel demineralization, using images from a digital camera, are as accurate and
reproducible as images captured from an analogue photographic slide (Benson et al.
2005b). Comparing polarized versus non-polarized photographs showed that the use
of a cross-polarizing filter decreases the accompanying flash reflection on digital
images, thereby improving the subjective assessment of demineralized lesions
surrounding an orthodontic bracket and enhancing the reproducibility of
demineralization area measurements (Benson et al. 2008).

26
Caries Assessment in Orthodontic Patients
26
27
AIMS
27
Hypotheses and aims
The present thesis focuses on caries risk, the prevalence of caries using different
methods in orthodontic patients, and to compare these methods with the clinical
examination. Studies I and IV analyze caries risk, while Studies II and III evaluate the
prevalence of caries in orthodontic patients using different methods and comparing
these methods with the clinical examination. The hypotheses and specific aims of this
thesis were:
1. The hypothesis of Study I was that the caries risk for orthodontics patients treated
at governmental clinics is higher compared with patients treated at private clinics.
The aims were to study the different caries-related factors in orthodontic patients
immediately after orthodontic treatment i.e. at de-bonding, and to compare the
caries risk profile using the Cariogram model between governmental and private
orthodontic patients.
2. The hypotheses of Study II were that the prevalence of buccal caries lesions at de-
bonding is higher in orthodontics patients treated at governmental clinics
compared with patients treated at private clinics, and the null hypothesis is that
there is no correlation between the ICDAS-II and DIAGNOdent Pen for detecting
buccal caries lesions. The aims were to clinically study the prevalence of buccal
caries lesions including WSLs at de-bonding using ICDAS-II and DIAGNOdent
Pen in governmental and private orthodontic clinics, and to study the correlation
between the two methods for detecting those lesions.
3. The hypothesis of Study III was that visual examination for assessing the severity
of buccal caries lesions on digital photographs is not a reliable and valid method.
The aims were to study the severity of buccal caries lesions according to the
ICDAS-II criteria via scoring buccal caries lesions on digital photographs at de-
bonding, and to compare this method with clinical examinations.
4. The hypothesis of Study IV was that caries risk is higher in patients treated in
government clinics compared to those treated in private clinics four years after de-
bonding and that the caries risk will decrease over time after de-bonding. The

28
Caries Assessment in Orthodontic Patients
28
aims were to analyze various caries-related factors and evaluate “the actual chance
to avoid new cavities” according to the Cariogram for governmental and private
orthodontic patients at de-bonding and four years after de-bonding, and to
compare the caries-related factors and “the actual chance to avoid new cavities”
according to the Cariogram for those patients over the four-year period.
29
MATERIAL AND METHODS
29
MATERIAL AND METHODS
Ethical considerations
The four studies included in this thesis were approved and registered by the College
of Dentistry Research Centre Ethics Committee, King Saud University, Riyadh, KSA
(Reg. No. NF 2225). All the participants were informed about the nature of the
studies, and were given a written informed consent prior to participation. The
participants were also assured confidentiality with regard to the collected information,
and they were given the choice of not participating or withdrawing from the studies at
any time.
Three studies included in this thesis (I, II, and IV) were investigating the difference
between orthodontic patients treated in governmental clinics compared with those
treated in private clinics in the aspect of the caries situation. It is believed that the
results of such investigations may provide the Saudi medical authorities with valuable
information that could be used as a base to build a proper dental health care system,
particularly during orthodontic treatment. This could also be applicable for other
dental systems in different countries where the caries situation is expected to be high.
Study population and design
In general, the same participants were involved in all four studies (I, II, III and IV).
All adult orthodontic patients, who came for de-bonding in six representative clinics,
were recruited. The six clinics (three governmental and three private) were located in
Riyadh, KSA, and the patients were recruited during a five months period from the
beginning of January till end of May 2009. The three governmental centers are: King
Saud University dental clinics, King Saud Medical Complex, and Prince Sultan
Medical Military City. The three private clinics are: Coral Dental Clinic, Ajyal
Specialist Clinics, and Dr. Saad Al-Kharsa Orthodontic Clinics. The inclusion criteria
were: 1) Willingness to participate in the study, 2) Free from any active caries lesions
prior to orthodontic treatment, 3) Treated with buccal fixed orthodontic appliances in
both jaws.
30
Caries Assessment in Orthodontic Patients
30
In Studies I and II; the sample was comprised of 89 orthodontic patients with a mean
age of 21.5 years. They were divided into two groups based on the center of
treatment: Governmental (G) group (n = 45), and Private (P) group (n = 44). In Study
III; the same 89 orthodontic patients were considered as one group since the study
was aimed to evaluate a method regardless of which clinic they had been treated at. In
Study IV; based on power analysis to estimate the sample size as well as to account
for dropouts, 40 patients from the 89 patients at the baseline were recalled, from the
beginning of December 2012 till end of February 2013. The 40 patients with a mean
age of 26.4 years were divided into two groups based on the center of treatment: G-
group (n = 20), and P-group (n = 20). In addition, it was decided to include a control
group in the follow-up study to be compared with the patients seen four years after
de-bonding. This data was not presented in Study IV mainly due to space limitation
from the journal, as well as lacking the control group in the baseline study. A cross-
sectional comparison between the patients seen four years after de-bonding (the test
group) and the control group will be presented briefly in a separate subheading under
the result part of this frame. The control group included 40 participants matched with
the test group in age and gender aspects. The control group participants were
collected to be the same number as the test group as well as from the same center of
treatment: G-group (n = 20), and P-group (n = 20). Table 4 summarizes the study
design, the sample sizes and topic of the four studies included in the thesis.
Table 4. The main topic of the four studies included in this thesis and their corresponding designs and populations.
Study Design Population Topic
I Cross-sectional 89 Caries risk profile using the Cariogram in governmental and private orthodontic patients at de-bonding
II Cross-sectional 89 Diagnosing the severity of buccal caries lesions in governmental and private orthodontic patients at de-bonding, using the ICDAS-II and the DIAGNOdent Pen
III Methodological 89 Diagnosing the severity of buccal caries lesions in orthodontic patients at de-bonding using digital photographs
IV Prospective, longitudinal
40 Caries risk profile in orthodontic patients: A 4-year longitudinal study using the Cariogram model in governmental vs. private clinics
31
MATERIAL AND METHODS
31
Studies I & IV
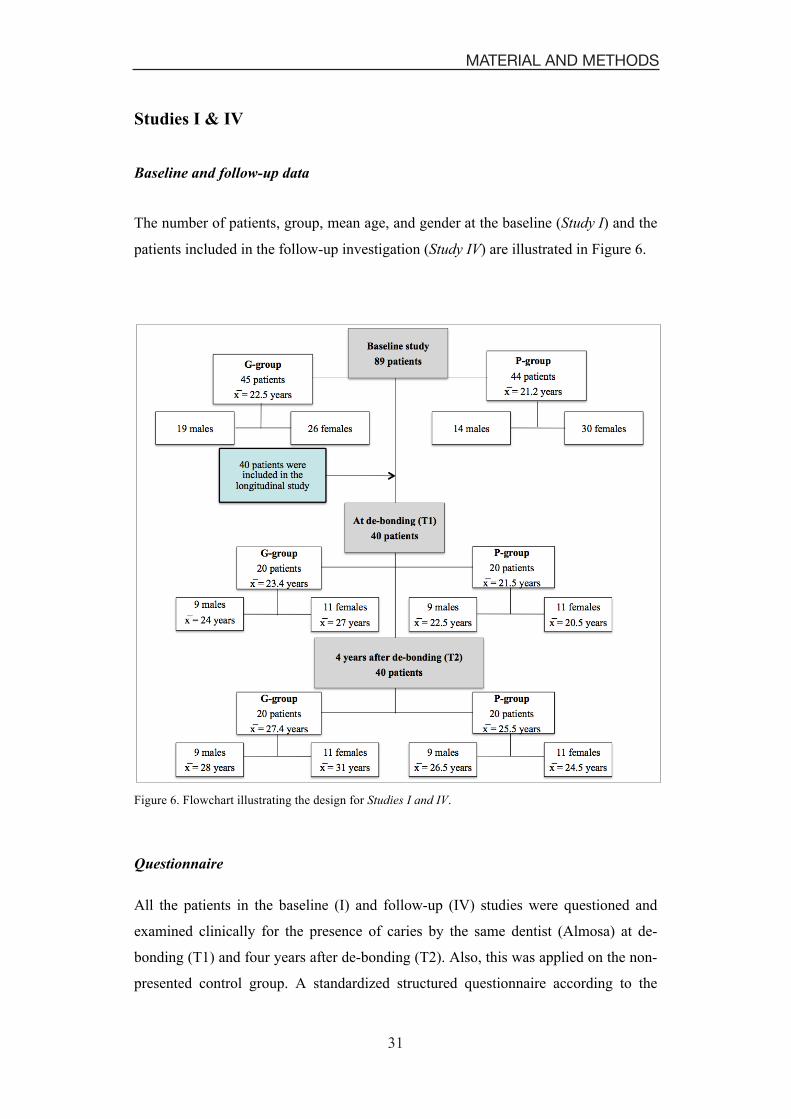
Baseline and follow-up data
The number of patients, group, mean age, and gender at the baseline (Study I) and the
patients included in the follow-up investigation (Study IV) are illustrated in Figure 6.
Figure 6. Flowchart illustrating the design for Studies I and IV.
Questionnaire
All the patients in the baseline (I) and follow-up (IV) studies were questioned and
examined clinically for the presence of caries by the same dentist (Almosa) at de-
bonding (T1) and four years after de-bonding (T2). Also, this was applied on the non-
presented control group. A standardized structured questionnaire according to the
32
Caries Assessment in Orthodontic Patients
32
Cariogram manual (Cariogram computer program manual, accessed February 2008)
was used to obtain data regarding medical and dental history, dietary habits and the
use of fluoride dentifrices, fluoride mouth rinse solutions, and fluoride tablets. The
patients then underwent plaque scoring and saliva sampling followed by bitewing
radiographs to evaluate the interproximal surfaces for the presence of caries.
Plaque index
Before professional cleaning and saliva sampling, the plaque index was recorded
according to Silness and Löe (Silness and Löe 1964). Four sites (buccal, lingual and
proximal surfaces) on six representative teeth (16, 12, 24, 36, 32 and 44) were scored.
If any of these teeth were missing, the neighboring tooth was scored.
Salivary and microbiological tests
Paraffin-stimulated saliva was collected for five minutes and the secretion rate was
expressed as ml/min. The saliva was analyzed in terms of buffer capacity and the
number of mutans streptococci and lactobacilli using chair-side tests (Dentocult SM
Strip mutans, Dentocult LB and Dentobuff strip, Orion Diagnostica, Espoo, Finland).
The mutans streptococci, lactobacilli and buffer capacity were scored in classes
(Table 1), according to the manufacturer’s model chart. To determine the buffer
capacity of saliva, a drop of saliva was left on the Dentobuff Strip for five minutes,
and the pH was then determined by the color presented by the strip in accordance to
the manual provided by the manufacturer.
Clinical examination of caries
After plaque scoring and saliva sampling, the teeth were cleaned with a rubber cup,
pumice and dental floss. They were dried with compressed air and then examined
using a mouth mirror, standard light and dental probe. Caries was scored according to
the WHO criteria (World Health Organization 1997). The numbers of decayed (D),
missing (M) and filled (F) tooth surfaces (S) were scored for each individual and
calculated as DMFS to evaluate the caries experience according to the Cariogram
(Table 1). Third molars were not included. Extracted premolars and molars due to
caries were scored as 5 missing surfaces, and extracted teeth due to orthodontic
treatment and agenesis were not included as missing surfaces. Bitewing radiographs
were evaluated for the presence of proximal caries. White spot lesions were excluded
33
MATERIAL AND METHODS
33
because only manifest lesions are considered in the “caries experience” according to
the Cariogram.
Caries risk assessment
Data of ten caries-related factors (Table 1) were scored and entered into the
Cariogram program to produce a graphic image that illustrated the “chance of
avoiding new cavities” as a percentage value (Figure 4). The tenth factor (clinical
judgment) was set to score 1 in all patients in order not to change the built-in
evaluation of the Cariogram model.
Study II
Clinical examination of buccal caries
The study included all non-extracted premolars and anterior teeth (incisors and
canines). Immediately after de-bonding and remaining resin removal, the teeth were
cleaned using a rubber cup, pumice paste, dental floss, and rinsed and dried with
compressed air in order to remove plaque and extrinsic stains. Then, the same dentist
(Almosa) examined the buccal surfaces of all non-extracted premolars and anterior
teeth for the presence of caries lesions by using the two caries detection methods:
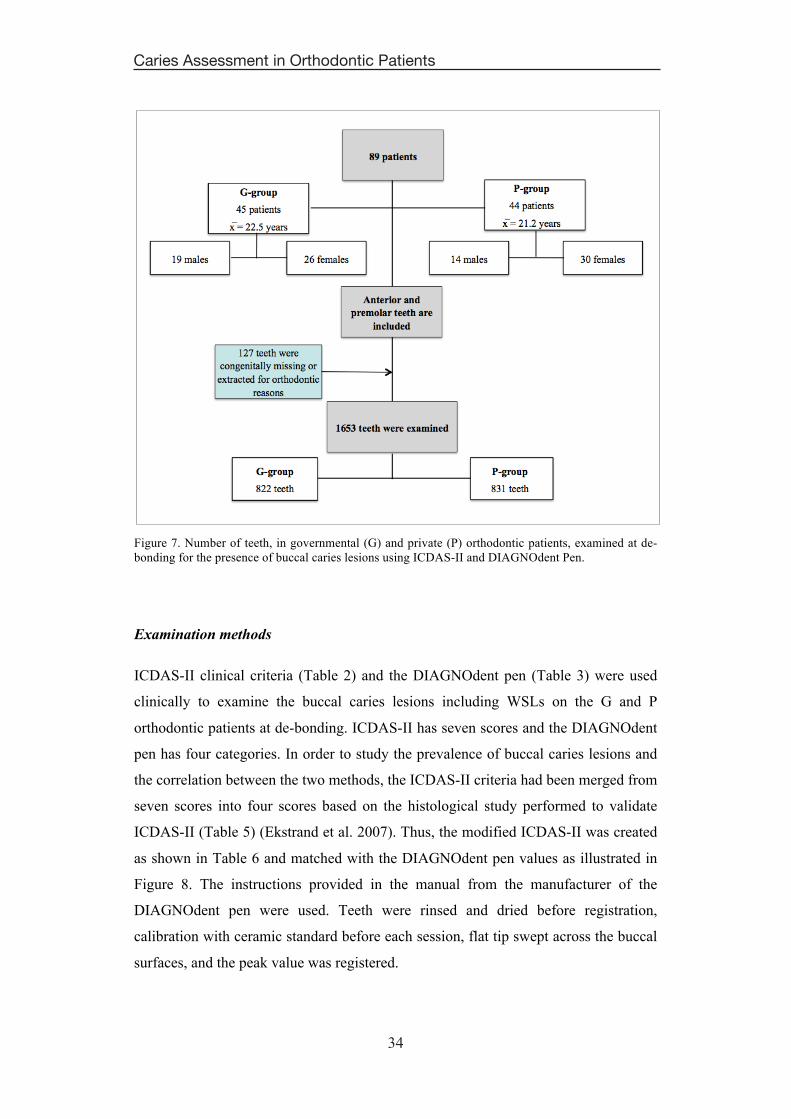
ICDAS-II and DIAGNOdent pen. The number of teeth examined in each group (G vs.
P), illustrated in Figure 7. The prevalence of buccal caries lesions on the G and P
groups was determined on the tooth level and on the individual level to evaluate
differences between the two groups.
34
Caries Assessment in Orthodontic Patients
34
Figure 7. Number of teeth, in governmental (G) and private (P) orthodontic patients, examined at de-bonding for the presence of buccal caries lesions using ICDAS-II and DIAGNOdent Pen.
Examination methods
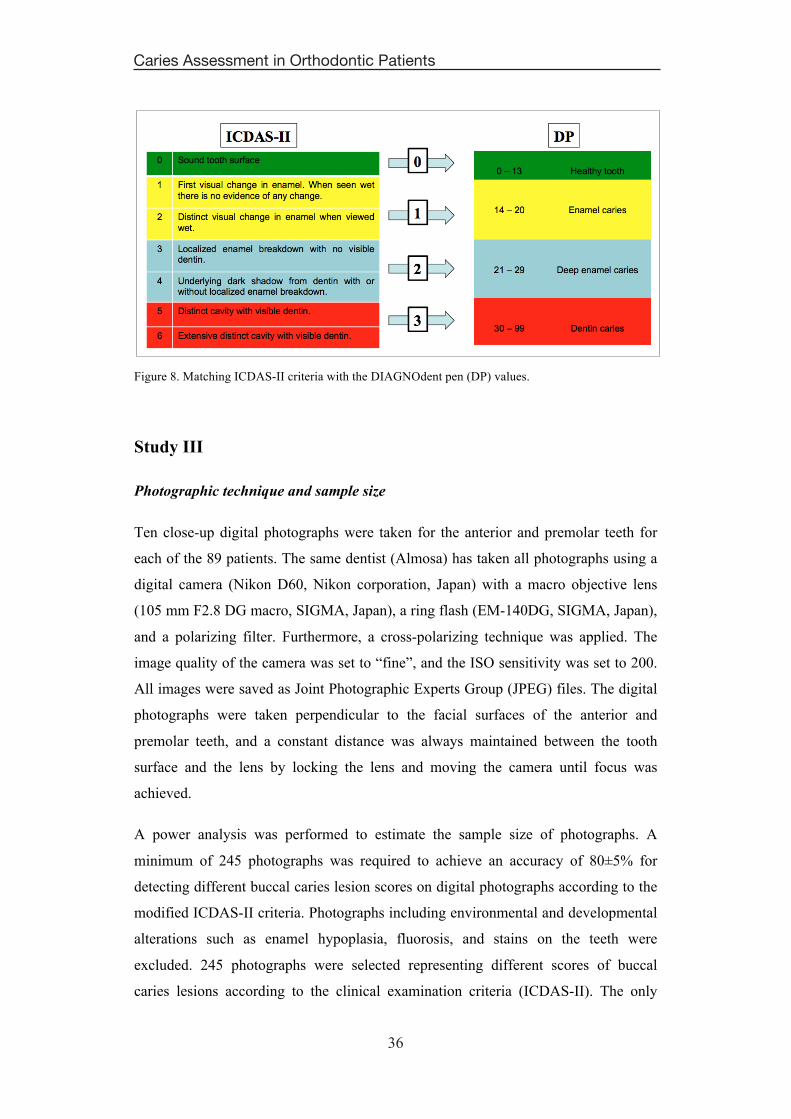
ICDAS-II clinical criteria (Table 2) and the DIAGNOdent pen (Table 3) were used
clinically to examine the buccal caries lesions including WSLs on the G and P
orthodontic patients at de-bonding. ICDAS-II has seven scores and the DIAGNOdent
pen has four categories. In order to study the prevalence of buccal caries lesions and
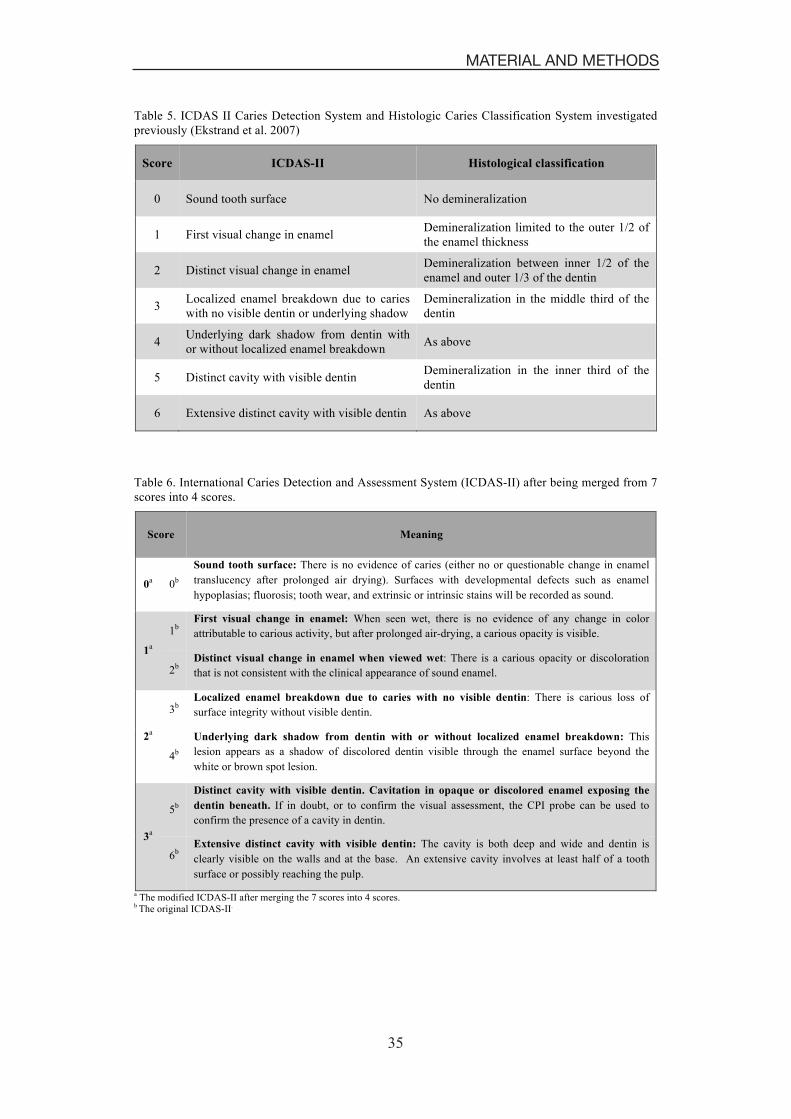
the correlation between the two methods, the ICDAS-II criteria had been merged from
seven scores into four scores based on the histological study performed to validate
ICDAS-II (Table 5) (Ekstrand et al. 2007). Thus, the modified ICDAS-II was created
as shown in Table 6 and matched with the DIAGNOdent pen values as illustrated in
Figure 8. The instructions provided in the manual from the manufacturer of the
DIAGNOdent pen were used. Teeth were rinsed and dried before registration,
calibration with ceramic standard before each session, flat tip swept across the buccal
surfaces, and the peak value was registered.
35
MATERIAL AND METHODS
35
Table 5. ICDAS II Caries Detection System and Histologic Caries Classification System investigated previously (Ekstrand et al. 2007)
Table 6. International Caries Detection and Assessment System (ICDAS-II) after being merged from 7 scores into 4 scores.
Score Meaning
0a 0b
Sound tooth surface: There is no evidence of caries (either no or questionable change in enamel translucency after prolonged air drying). Surfaces with developmental defects such as enamel hypoplasias; fluorosis; tooth wear, and extrinsic or intrinsic stains will be recorded as sound.
1a
1b First visual change in enamel: When seen wet, there is no evidence of any change in color attributable to carious activity, but after prolonged air-drying, a carious opacity is visible.
2b Distinct visual change in enamel when viewed wet: There is a carious opacity or discoloration that is not consistent with the clinical appearance of sound enamel.
2a
3b Localized enamel breakdown due to caries with no visible dentin: There is carious loss of surface integrity without visible dentin.
4b
Underlying dark shadow from dentin with or without localized enamel breakdown: This lesion appears as a shadow of discolored dentin visible through the enamel surface beyond the white or brown spot lesion.
3a
5b
Distinct cavity with visible dentin. Cavitation in opaque or discolored enamel exposing the dentin beneath. If in doubt, or to confirm the visual assessment, the CPI probe can be used to confirm the presence of a cavity in dentin. 6b Extensive distinct cavity with visible dentin: The cavity is both deep and wide and dentin is clearly visible on the walls and at the base. An extensive cavity involves at least half of a tooth surface or possibly reaching the pulp.
a The modified ICDAS-II after merging the 7 scores into 4 scores. b The original ICDAS-II.
�
Score ICDAS-II Histological classification
0 Sound tooth surface No demineralization
1 First visual change in enamel Demineralization limited to the outer 1/2 of the enamel thickness
2 Distinct visual change in enamel Demineralization between inner 1/2 of the enamel and outer 1/3 of the dentin
3 Localized enamel breakdown due to caries with no visible dentin or underlying shadow
Demineralization in the middle third of the dentin
4 Underlying dark shadow from dentin with or without localized enamel breakdown As above
5 Distinct cavity with visible dentin Demineralization in the inner third of the dentin
6 Extensive distinct cavity with visible dentin As above
36
Caries Assessment in Orthodontic Patients
36
Figure 8. Matching ICDAS-II criteria with the DIAGNOdent pen (DP) values.
Study III
Photographic technique and sample size
Ten close-up digital photographs were taken for the anterior and premolar teeth for
each of the 89 patients. The same dentist (Almosa) has taken all photographs using a
digital camera (Nikon D60, Nikon corporation, Japan) with a macro objective lens
(105 mm F2.8 DG macro, SIGMA, Japan), a ring flash (EM-140DG, SIGMA, Japan),
and a polarizing filter. Furthermore, a cross-polarizing technique was applied. The
image quality of the camera was set to “fine”, and the ISO sensitivity was set to 200.
All images were saved as Joint Photographic Experts Group (JPEG) files. The digital
photographs were taken perpendicular to the facial surfaces of the anterior and
premolar teeth, and a constant distance was always maintained between the tooth
surface and the lens by locking the lens and moving the camera until focus was
achieved.
A power analysis was performed to estimate the sample size of photographs. A
minimum of 245 photographs was required to achieve an accuracy of 80±5% for
detecting different buccal caries lesion scores on digital photographs according to the
modified ICDAS-II criteria. Photographs including environmental and developmental
alterations such as enamel hypoplasia, fluorosis, and stains on the teeth were
excluded. 245 photographs were selected representing different scores of buccal
caries lesions according to the clinical examination criteria (ICDAS-II). The only
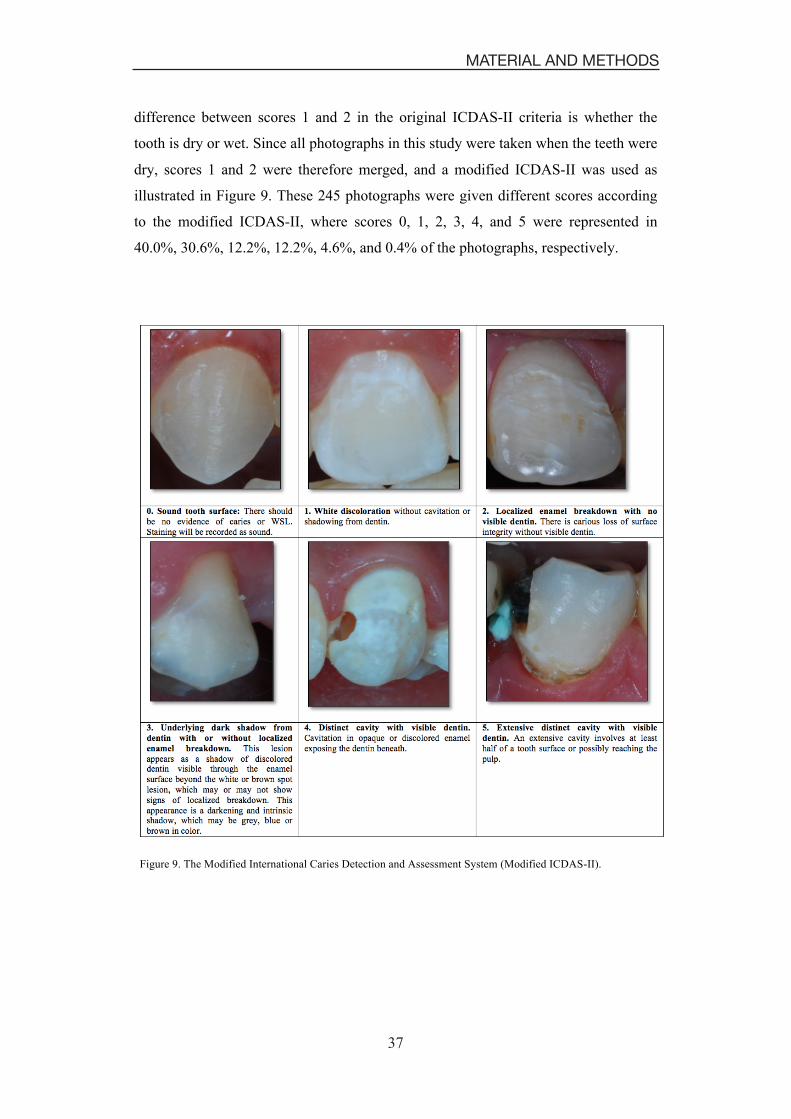
37
MATERIAL AND METHODS
37
difference between scores 1 and 2 in the original ICDAS-II criteria is whether the
tooth is dry or wet. Since all photographs in this study were taken when the teeth were
dry, scores 1 and 2 were therefore merged, and a modified ICDAS-II was used as
illustrated in Figure 9. These 245 photographs were given different scores according
to the modified ICDAS-II, where scores 0, 1, 2, 3, 4, and 5 were represented in
40.0%, 30.6%, 12.2%, 12.2%, 4.6%, and 0.4% of the photographs, respectively.
Figure 9. The Modified International Caries Detection and Assessment System (Modified ICDAS-II).
38
Caries Assessment in Orthodontic Patients
38
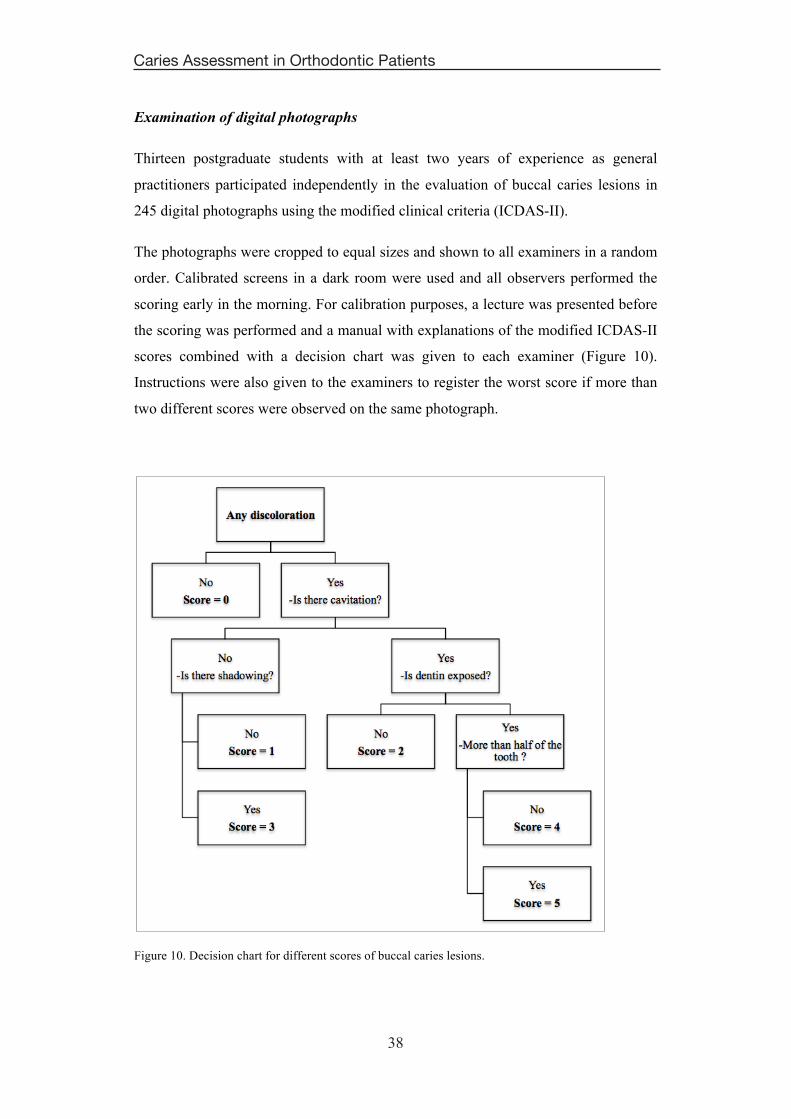
Examination of digital photographs
Thirteen postgraduate students with at least two years of experience as general
practitioners participated independently in the evaluation of buccal caries lesions in
245 digital photographs using the modified clinical criteria (ICDAS-II).
The photographs were cropped to equal sizes and shown to all examiners in a random
order. Calibrated screens in a dark room were used and all observers performed the
scoring early in the morning. For calibration purposes, a lecture was presented before
the scoring was performed and a manual with explanations of the modified ICDAS-II
scores combined with a decision chart was given to each examiner (Figure 10).
Instructions were also given to the examiners to register the worst score if more than
two different scores were observed on the same photograph.
Figure 10. Decision chart for different scores of buccal caries lesions.
39
MATERIAL AND METHODS
39
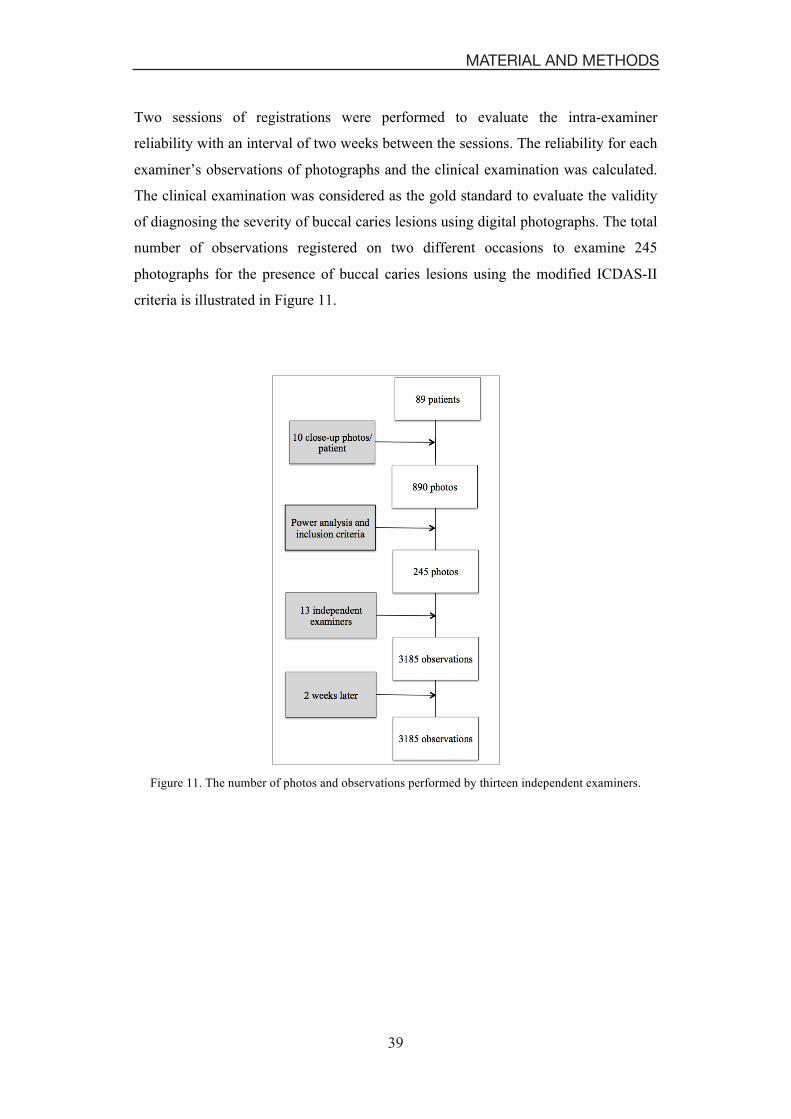
Two sessions of registrations were performed to evaluate the intra-examiner
reliability with an interval of two weeks between the sessions. The reliability for each
examiner’s observations of photographs and the clinical examination was calculated.
The clinical examination was considered as the gold standard to evaluate the validity
of diagnosing the severity of buccal caries lesions using digital photographs. The total
number of observations registered on two different occasions to examine 245
photographs for the presence of buccal caries lesions using the modified ICDAS-II
criteria is illustrated in Figure 11.
Figure 11. The number of photos and observations performed by thirteen independent examiners.
40
Caries Assessment in Orthodontic Patients
40
Statistical analysis
The Statistical Package for Social Sciences (SPSS Inc., Chicago, IL, USA, version
18.0) was used for the statistical analysis of the determined measurements in all
studies included in this thesis.
In Studies I and IV, descriptive statistics including the mean, standard deviations and
the range of numerical variables were calculated for all individuals in the G and P
groups. Moreover, the median values for the Cariogram were calculated. A two-
sample t-test was applied to determine the statistically significant differences between
the two main groups (G vs. P), while the analysis of variance (ANOVA) was used
when three or more groups were compared. Chi-square test (Study I) and Fisher’s
exact test (Study IV) were used to compare the scores between the two different
groups (G vs. P) (control vs. test). A paired t-test was applied to determine the
statistically significant differences for the same individuals over time (Study IV).
In Study II, descriptive statistics were used to study the mean age, frequency of
gender and different scores of the two methods on tooth level, and the frequency of
buccal caries lesions on an individual level. The independent sample t-test was
applied to the two main groups, G and P, to determine the statistically significant
differences of buccal caries lesions on the individual level. Fisher’s exact test was
used to compare the different categories of the buccal caries lesions count on
individual levels. The cross-tabulation was applied to evaluate inter-examiner and
intra-examiner reliabilities, as well as to study the correlation between the ICDAS-II
index and the DIAGNOdent Pen, by calculating the weighted Kappa and Spearman
correlation coefficient.
In Study III, the intra-examiner reliability and the reliability between each examiner
and the clinical examination were performed with regard to selected variables and the
kappa values were calculated. Cross-tabulation was applied to evaluate the correlation
between the clinical examination of buccal caries lesions and the examination of
digital photographs of the lesions using the ICDAS-II criteria, by calculating
Spearman’s correlation coefficient.
For all tests, the significance level was P < .05.
41
RESULTS
41
RESULTS
Study I
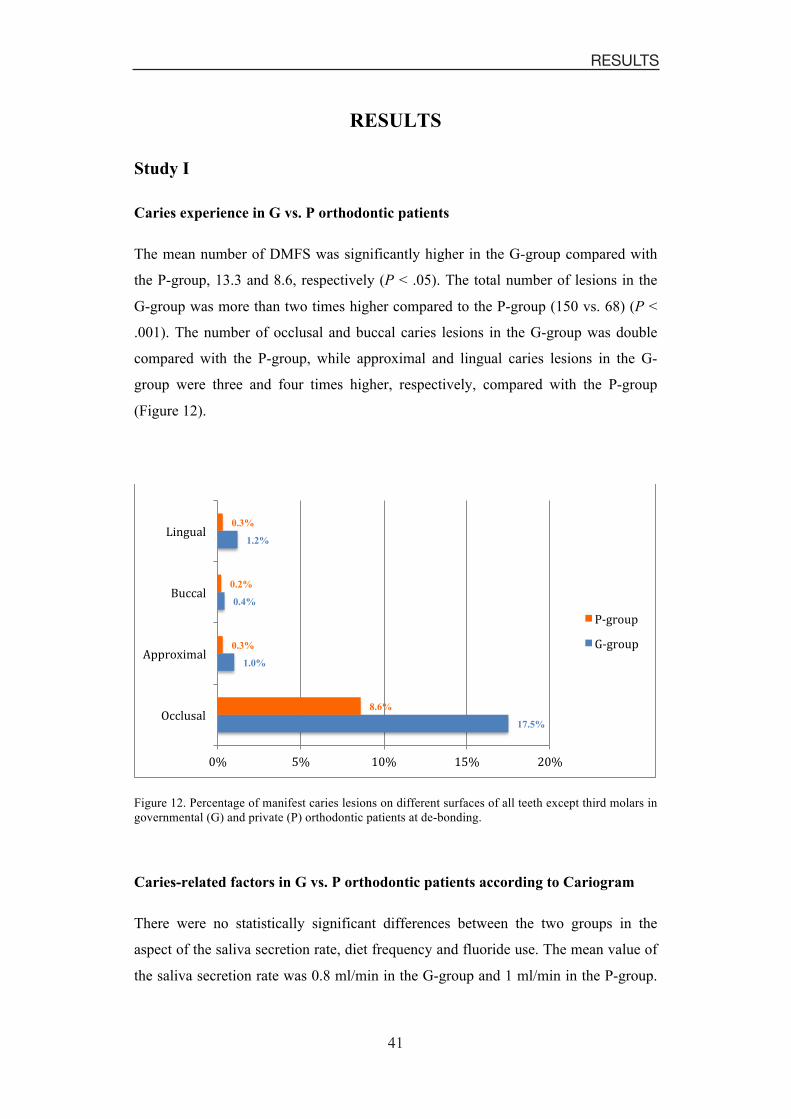
Caries experience in G vs. P orthodontic patients
The mean number of DMFS was significantly higher in the G-group compared with
the P-group, 13.3 and 8.6, respectively (P < .05). The total number of lesions in the
G-group was more than two times higher compared to the P-group (150 vs. 68) (P <
.001). The number of occlusal and buccal caries lesions in the G-group was double
compared with the P-group, while approximal and lingual caries lesions in the G-
group were three and four times higher, respectively, compared with the P-group
(Figure 12).
Figure 12. Percentage of manifest caries lesions on different surfaces of all teeth except third molars in governmental (G) and private (P) orthodontic patients at de-bonding.
Caries-related factors in G vs. P orthodontic patients according to Cariogram
There were no statistically significant differences between the two groups in the
aspect of the saliva secretion rate, diet frequency and fluoride use. The mean value of
the saliva secretion rate was 0.8 ml/min in the G-group and 1 ml/min in the P-group.
17.5%
1.0%
0.4%
1.2%
8.6%
0.3%
0.2%
0.3%
$.� ).� %$.� %).� &$.�
����� ��
�������� ��
���� ��
����� ��
!�������!������
42
Caries Assessment in Orthodontic Patients
42
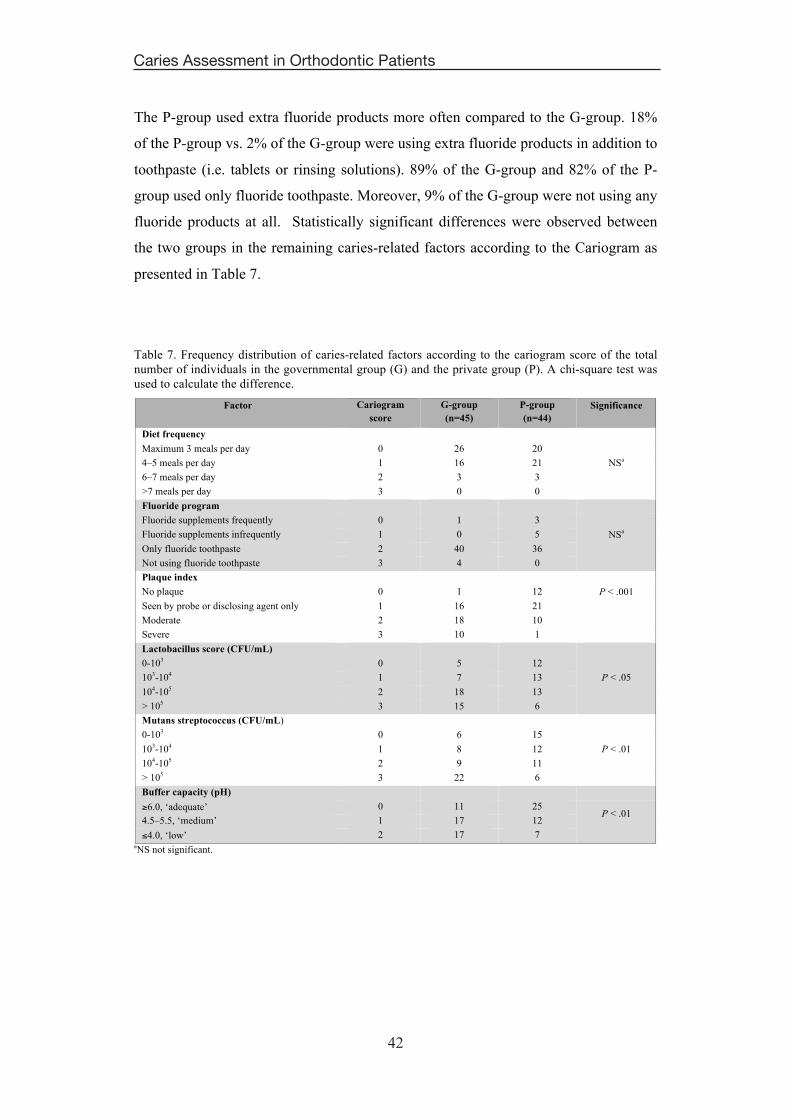
The P-group used extra fluoride products more often compared to the G-group. 18%
of the P-group vs. 2% of the G-group were using extra fluoride products in addition to
toothpaste (i.e. tablets or rinsing solutions). 89% of the G-group and 82% of the P-
group used only fluoride toothpaste. Moreover, 9% of the G-group were not using any
fluoride products at all. Statistically significant differences were observed between
the two groups in the remaining caries-related factors according to the Cariogram as
presented in Table 7.
Table 7. Frequency distribution of caries-related factors according to the cariogram score of the total number of individuals in the governmental group (G) and the private group (P). A chi-square test was used to calculate the difference.
Factor Cariogram score
G-group (n=45)
P-group (n=44)
Significance
Diet frequency Maximum 3 meals per day 0 26 20
NSa 4–5 meals per day 1 16 21 6–7 meals per day 2 3 3 >7 meals per day 3 0 0 Fluoride program Fluoride supplements frequently 0 1 3
NSa Fluoride supplements infrequently 1 0 5 Only fluoride toothpaste 2 40 36 Not using fluoride toothpaste 3 4 0 Plaque index No plaque 0 1 12 P < .001
Seen by probe or disclosing agent only 1 16 21 Moderate 2 18 10 Severe 3 10 1 Lactobacillus score (CFU/mL) 0-103 0 5 12
P < .05 103-104 1 7 13 104-105 2 18 13 > 105 3 15 6 Mutans streptococcus (CFU/mL) 0-103 0 6 15
P < .01 103-104 1 8 12 104-105 2 9 11 > 105 3 22 6 Buffer capacity (pH) �6.0, ‘adequate’ 0 11 25
P < .01 4.5–5.5, ‘medium’ 1 17 12 �4.0, ‘low’ 2 17 7
aNS not significant.
43
RESULTS
43
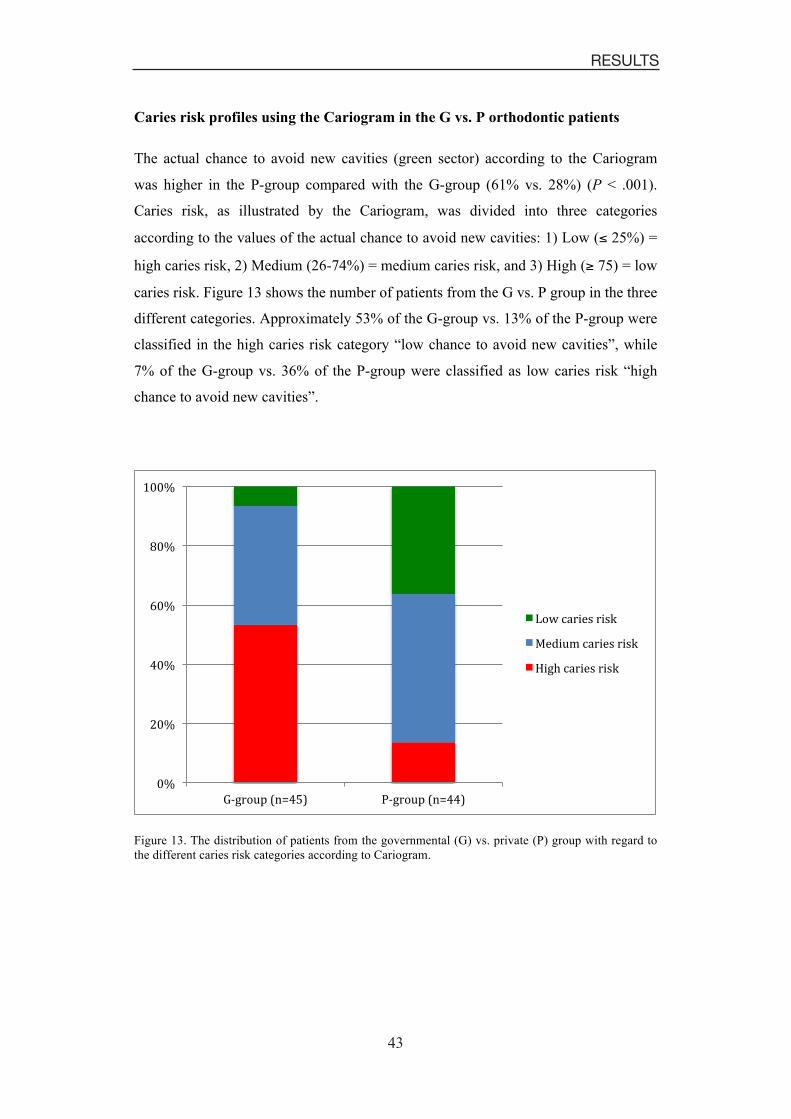
Caries risk profiles using the Cariogram in the G vs. P orthodontic patients
The actual chance to avoid new cavities (green sector) according to the Cariogram
was higher in the P-group compared with the G-group (61% vs. 28%) (P < .001).
Caries risk, as illustrated by the Cariogram, was divided into three categories
according to the values of the actual chance to avoid new cavities: 1) Low (� 25%) =
high caries risk, 2) Medium (26-74%) = medium caries risk, and 3) High (� 75) = low
caries risk. Figure 13 shows the number of patients from the G vs. P group in the three
different categories. Approximately 53% of the G-group vs. 13% of the P-group were
classified in the high caries risk category “low chance to avoid new cavities”, while
7% of the G-group vs. 36% of the P-group were classified as low caries risk “high
chance to avoid new cavities”.
Figure 13. The distribution of patients from the governmental (G) vs. private (P) group with regard to the different caries risk categories according to Cariogram.
$.�
&$.�
($.�
*$.�
,$.�
%$$.�
�!������"�/()#� !������"�/((#�
����� ������������������ ���������������� ����������
44
Caries Assessment in Orthodontic Patients
44
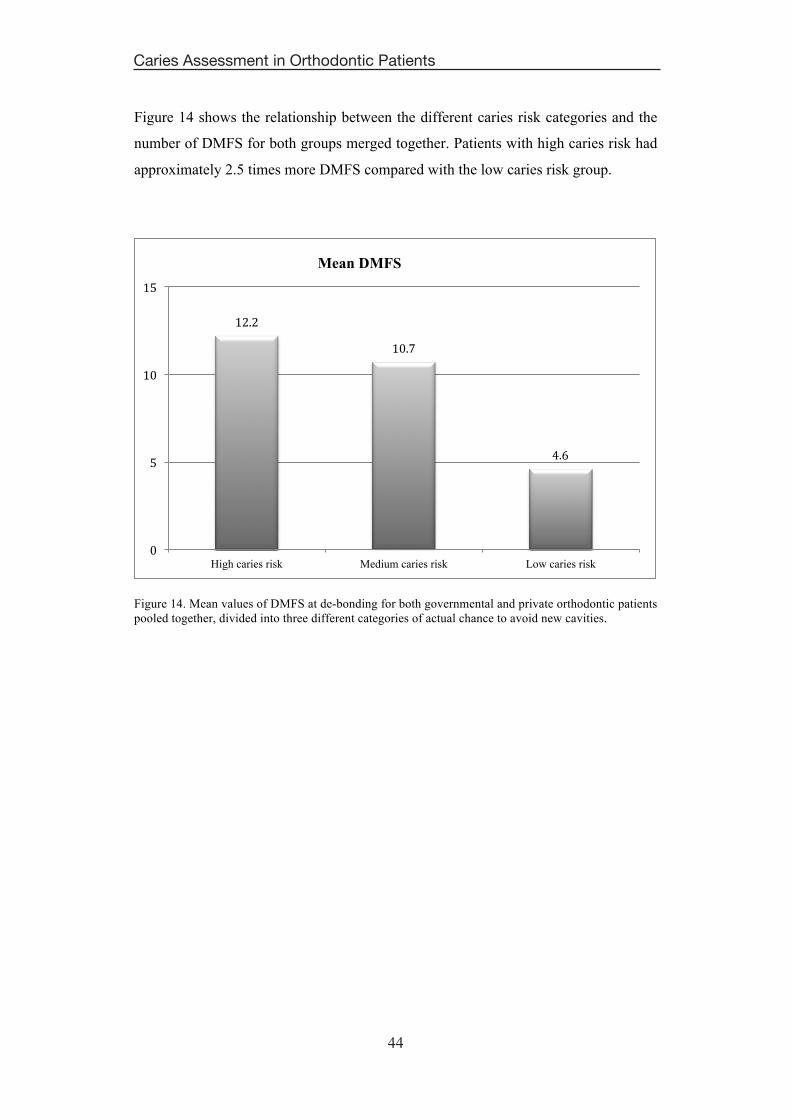
Figure 14 shows the relationship between the different caries risk categories and the
number of DMFS for both groups merged together. Patients with high caries risk had
approximately 2.5 times more DMFS compared with the low caries risk group.
Figure 14. Mean values of DMFS at de-bonding for both governmental and private orthodontic patients pooled together, divided into three different categories of actual chance to avoid new cavities.
%& &�%$ +�
( *�
$�
)�
%$�
%)�
High caries risk Medium caries risk Low caries risk
Mean DMFS
45
RESULTS
45
Study II
Prevalence of buccal caries lesions at de-bonding on tooth level
Table 8 shows the prevalence of buccal caries lesions in the G and P groups pooled
together using the modified ICDAS-II and the DIAGNOdent Pen. The two methods
show that approximately 67% and 79% of the buccal surfaces, respectively, were
healthy. In addition, ICDAS-II detected scores 1 and 2 (enamel caries and deep
enamel caries) almost three times more often than the DIAGNOdent Pen. Moreover,
approximately 10% of the total number of teeth in both groups had dentin caries
according to the DIAGNOdent Pen.
Table 8. Prevalence (%) of buccal caries lesions in G and P groups using modified ICDAS-II and DIAGNOdent Pen (DP).
Method Scores
0 1 2 3
ICDAS-II 67.3 17.1 14.6 1
DP 78.8 6 5.6 9.6
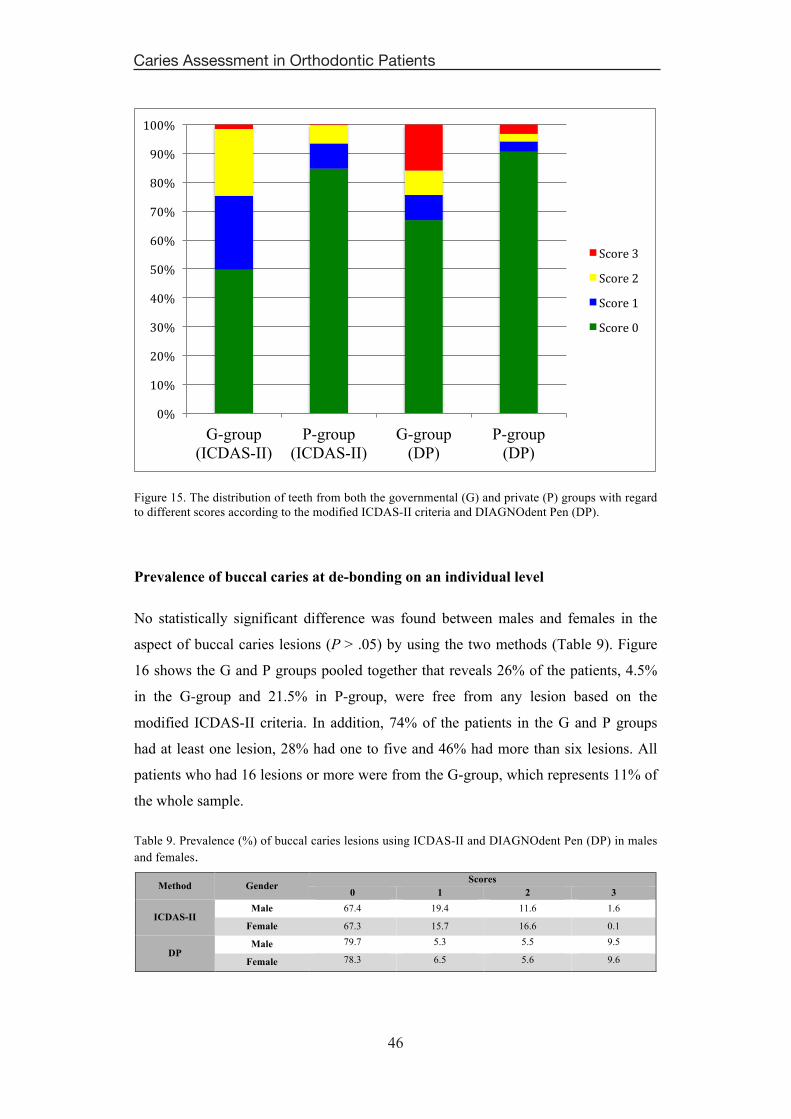
Figure 15 illustrates the distribution of teeth for both groups (G vs. P) among different
scores using the two methods. In overall terms, ICDAS-II reveals that approximately
50% of the teeth in the G-group and 85% of the teeth in the P-group were healthy.
Furthermore, teeth in the G-group had a 3-3.5 times higher prevalence of scores 1 and
2, respectively, compared to the P-group. On the other hand, the DIAGNOdent Pen
shows that 67% of the teeth in the G-group and more than 90% of the teeth in the P-
group were healthy. Moreover, the teeth in the G-group with enamel caries, deep
enamel caries and dentin caries were more than two, three and five times higher
compared to the P-group, respectively.
46
Caries Assessment in Orthodontic Patients
46
Figure 15. The distribution of teeth from both the governmental (G) and private (P) groups with regard to different scores according to the modified ICDAS-II criteria and DIAGNOdent Pen (DP).
Prevalence of buccal caries at de-bonding on an individual level
No statistically significant difference was found between males and females in the
aspect of buccal caries lesions (P > .05) by using the two methods (Table 9). Figure
16 shows the G and P groups pooled together that reveals 26% of the patients, 4.5%
in the G-group and 21.5% in P-group, were free from any lesion based on the
modified ICDAS-II criteria. In addition, 74% of the patients in the G and P groups
had at least one lesion, 28% had one to five and 46% had more than six lesions. All
patients who had 16 lesions or more were from the G-group, which represents 11% of
the whole sample.
Table 9. Prevalence (%) of buccal caries lesions using ICDAS-II and DIAGNOdent Pen (DP) in males and females.
Method Gender Scores
0 1 2 3
ICDAS-II Male 67.4 19.4 11.6 1.6
Female 67.3 15.7 16.6 0.1
DP Male 79.7 5.3 5.5 9.5
Female 78.3 6.5 5.6 9.6
$.�
%$.�
&$.�
'$.�
($.�
)$.�
*$.�
+$.�
,$.�
-$.�
%$$.�
G-group (ICDAS-II)
P-group (ICDAS-II)
G-group (DP)
P-group (DP)
������'�������&�������%�������$�
47
RESULTS
47
Figure 16. Prevalence of buccal caries lesions including WSLs for both groups, governmental and private, based on the individual level illustrated in five different categories.
Statistically significant differences were noted between the G and P groups in the
prevalence of buccal caries lesions (P < .0001) (Figure 17). These differences were
applied on the total number of lesions as well as after categorizing the lesions into
five different counts.
Figure 17. Prevalence of buccal caries lesions including WSLs for the governmental vs. private groups based on the individual level illustrated in five different categories.
48
Caries Assessment in Orthodontic Patients
48
The correlation between ICDAS-II and the DIAGNOdent Pen in detecting
different scores of buccal caries lesions
Table 10 represents the cross-tabulation between the ICDAS-II and the DIAGNOdent
Pen in detecting different scores of buccal caries lesions, from which Spearman’s
correlation coefficient was calculated to be 0.71. Given ICDAS-II with scores 0 and
3, the chances to meet the same scores using the DIAGNOdent Pen were 97% and
86%, respectively. However, diagnosing teeth with scores 1 and 2 using ICDAS-II
will give a chance of 14% and 22%, respectively, using the DIAGNOdent Pen.
Table 10. The cross-tabulation between ICDAS-II and DIAGNOdent Pen in registering different scores of buccal caries lesions.
DIAGNOden Pen
Score 0 1 2 3 Total
ICD
AS
0 1079 21 9 4 1113
1 191 40 29 23 283
2 32 38 53 120 243
3 0 1 1 12 14
Total 1302 100 92 159 1653
49
RESULTS
49
Study III
The reliabilities of the examiners
The intra-examiner reliability test for 12 examiners showed substantial to excellent
agreement, kappa value ranged between 0.65 and 0.83, while one examiner showed
moderate agreement, kappa value of 0.52 (Table 11).
The reliability between 11 examiners and the clinical examinations showed agreement
between 65% and 80%, which is classified as being a substantial to almost perfect
agreement, while two examiners showed agreement below 65% (Table 11).
Table 11. Weighted Kappa values of the Intra-Examiner Reliability (I.E.R)* for 13 examiners, and the Reliability between each one of the 13 Examiners’ observations on photographs and the Clinical examination (R.E.C)**.
Examiners
1 2 3 4 5 6 7 8 9 10 11 12 13
I.E.R* 0.82 0.65 0.76 0.77 0.79 0.65 0.79 0.52 0.83 0.79 0.83 0.75 0.68
R.E.C** 0.80 0.53 0.73 0.70 0.68 0.68 0.77 0.65 0.77 0.69 0.80 0.65 0.52
The correlation between digital photographs and clinical examination of buccal
caries lesions
Table 12 represents the cross-tabulation between the clinical examinations and visual
scores, using photographs of buccal caries lesions, according to the modified ICDAS-
II criteria from which Spearman’s correlation coefficient was calculated to be 0.76.
The correlation was based on the agreement of the registration on photographs toward
the clinical registration, but not vice versa. The agreement for scores 0 and 1 was
almost 80%, and this agreement becomes even higher in the evaluation of scores 4
and 5 with 94% and 100%, respectively. However, the agreement between the scoring
on digital photographs and the clinical examination decreased for scores of 2 and 3,
with 37% and 49.0%, respectively. On digital photographs, there is an approximately
94% chance to detect whether the teeth are healthy or had lesions regardless of the
severity of the lesions.
50
Caries Assessment in Orthodontic Patients
50
Table 12. The cross-tabulation between clinical registration and observations on photographs using modified ICDAS-II, from which Spearman’s correlation coefficient was calculated to be 0.76. The correlation is a column percentage to evaluate the agreement of the registration on photographs toward the clinical registration and not vice versa.
Clinical registration
Score 0 1 2 3 4 5 Total
Photographs
0 1013 60 32 26 0 0 1131
1 196 776 128 94 0 0 1194
2 44 41 145 56 3 0 289
3 21 97 68 191 4 0 381
4 0 1 16 22 135 0 174
5 0 0 1 1 1 13 16
Total 1274 975 390 390 143 13 3185
51
RESULTS
51
Study IV
No statistically significant differences were noticed between the mean of “actual
chance to avoid new cavities” according to the Cariogram among the 89 patients
investigated at the baseline (T1), and the 40 patients investigated at both T1 and T2,
indicating that the 40 patients included in this study comprised a representative
sample for follow-up investigation.
Caries risk profile (Cariogram) at T1, T2, and over a 4-year period (T2-T1)
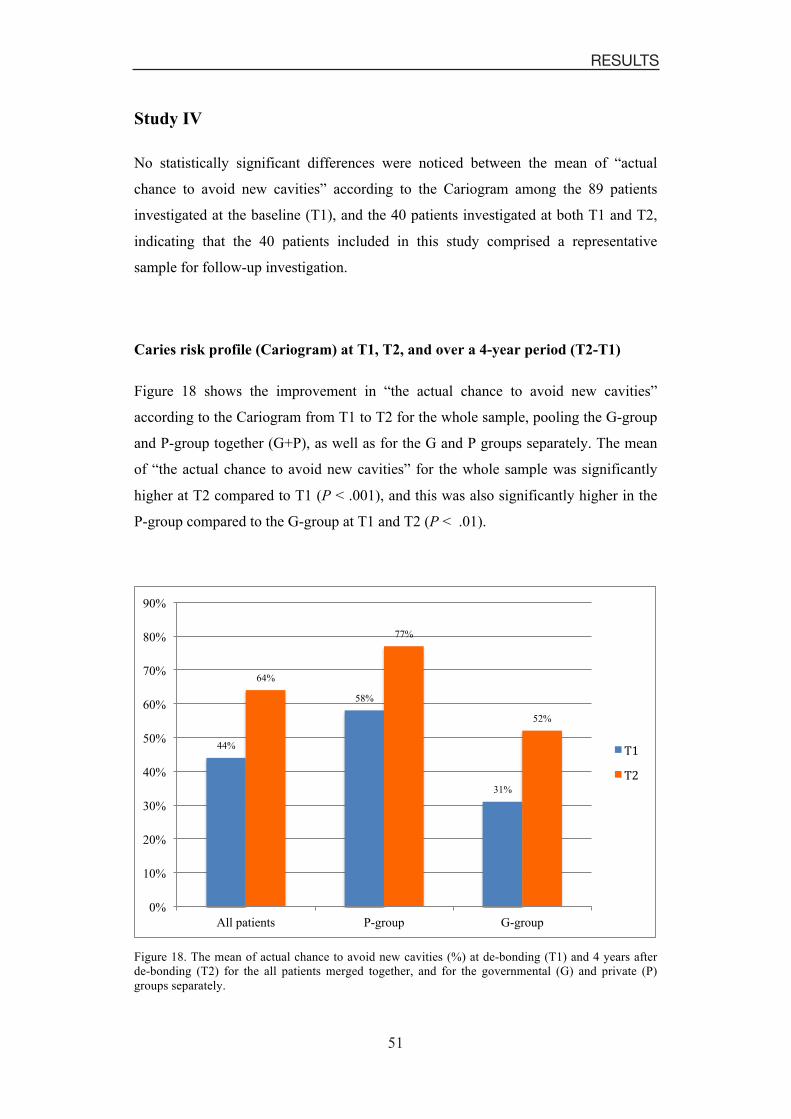
Figure 18 shows the improvement in “the actual chance to avoid new cavities”
according to the Cariogram from T1 to T2 for the whole sample, pooling the G-group
and P-group together (G+P), as well as for the G and P groups separately. The mean
of “the actual chance to avoid new cavities” for the whole sample was significantly
higher at T2 compared to T1 (P < .001), and this was also significantly higher in the
P-group compared to the G-group at T1 and T2 (P < .01).
Figure 18. The mean of actual chance to avoid new cavities (%) at de-bonding (T1) and 4 years after de-bonding (T2) for the all patients merged together, and for the governmental (G) and private (P) groups separately.
44%
58%
31%
64%
77%
52%
0%
10%
20%
30%
40%
50%
60%
70%
80%
90%
All patients P-group G-group
�%��&�
52
Caries Assessment in Orthodontic Patients
52
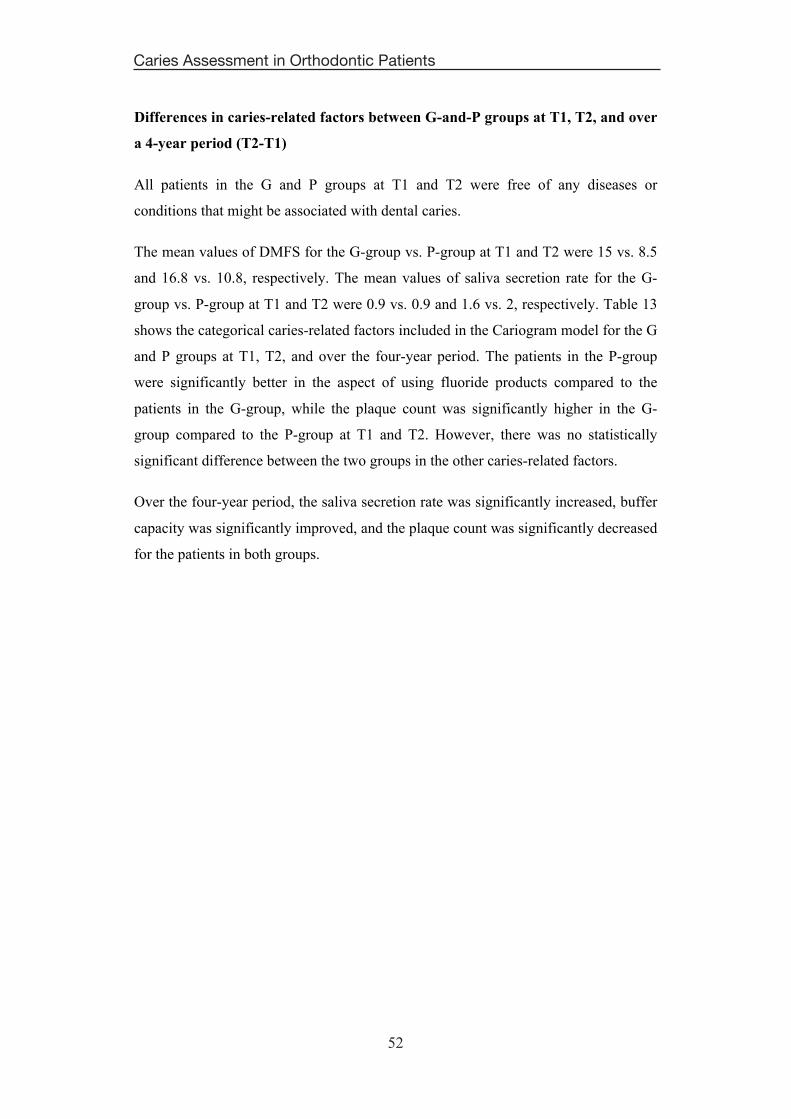
Differences in caries-related factors between G-and-P groups at T1, T2, and over
a 4-year period (T2-T1)
All patients in the G and P groups at T1 and T2 were free of any diseases or
conditions that might be associated with dental caries.
The mean values of DMFS for the G-group vs. P-group at T1 and T2 were 15 vs. 8.5
and 16.8 vs. 10.8, respectively. The mean values of saliva secretion rate for the G-
group vs. P-group at T1 and T2 were 0.9 vs. 0.9 and 1.6 vs. 2, respectively. Table 13
shows the categorical caries-related factors included in the Cariogram model for the G
and P groups at T1, T2, and over the four-year period. The patients in the P-group
were significantly better in the aspect of using fluoride products compared to the
patients in the G-group, while the plaque count was significantly higher in the G-
group compared to the P-group at T1 and T2. However, there was no statistically
significant difference between the two groups in the other caries-related factors.
Over the four-year period, the saliva secretion rate was significantly increased, buffer
capacity was significantly improved, and the plaque count was significantly decreased
for the patients in both groups.
53
RESULTS
53
Table 13. Frequency distribution of categorical caries-related factors according to the cariogram score of the total number of individuals in the G-group and P-group at T1, T2; the significant differences are shown over a four-year period (T2-T1).
Factor
Cariogram
T1
P
T2
P
T2 – T1
G-group P-group G-group P-group P GT2 – GT1
P PT2 – PT1
Caries experience
NS*
NS NS NS Caries-free 0 0 3 0 2 Better than normal 1 11 11 9 11 Normal for age group 2 0 1 0 1 Worse than normal 3 9 5 11 6 Diet frequency Maximum 3 meals per day 0 14 7
NS
10 14
NS
NS
4–5 meals per day 1 6 12 10 5 NS
6–7 meals per day 2 0 1 0 1 >7 meals per day 3 0 0 0 0 Fluoride program F. supplements frequently 0 1 3
< .05
0 2
< .05 NS NS F. supplements infrequently 1 1 2 2 4 Only fluoride toothpaste 2 18 15 17 14 Not using fluoride toothpaste 3 0 0 1 0 Plaque index No plaque 0 1 5
< .05
3 15
< .001
< .001
< .001
Seen by probe/disclosing agent 1 5 10 13 5 Moderate 2 9 5 4 0 Severe 3 5 0 0 0 Saliva secretion Normal, > than 1.1 ml / min 0 3 9
NS
13 12
NS
< .001
< .001
Low, 0.9 to < 1.1 ml / min 1 2 1 3 4 Low, 0.5 to < 0.9 ml / min 2 10 3 3 4 Very low, < 0.5 ml / min 3 5 7 1 0 Lactobacillus score (CFU/mL) 0-103 0 3 6
NS
5 7
NS NS NS 103-104 1 2 5 6 6 104-105 2 11 6 4 4 > 105 3 4 3 5 3 Mutans streptococcus (CFU/mL) 0-103 0 4 6
NS
3 7
< .05 NS NS 103-104 1 2 5 3 8 104-105 2 5 7 10 4 > 105 3 9 2 4 1 Buffer capacity (pH) �6.0, ‘adequate’ 0 5 8
NS 13 17
NS < .01 < .001 4.5–5.5, ‘medium’ 1 8 7 3 2 �4.0, ‘low’ 2 7 5 4 1
*NS = Not Significant
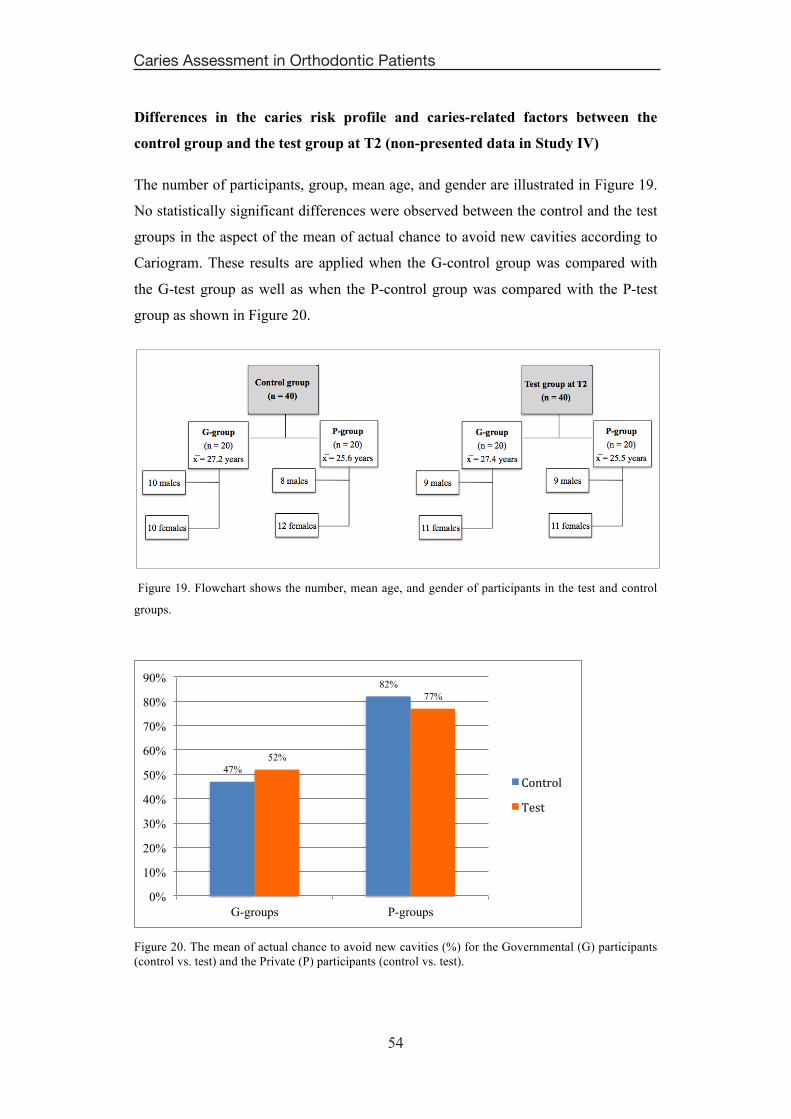
54
Caries Assessment in Orthodontic Patients
54
Differences in the caries risk profile and caries-related factors between the
control group and the test group at T2 (non-presented data in Study IV)
The number of participants, group, mean age, and gender are illustrated in Figure 19.
No statistically significant differences were observed between the control and the test
groups in the aspect of the mean of actual chance to avoid new cavities according to
Cariogram. These results are applied when the G-control group was compared with
the G-test group as well as when the P-control group was compared with the P-test
group as shown in Figure 20.
Figure 19. Flowchart shows the number, mean age, and gender of participants in the test and control
groups.
Figure 20. The mean of actual chance to avoid new cavities (%) for the Governmental (G) participants (control vs. test) and the Private (P) participants (control vs. test).
47%
82%
52%
77%
0%
10%
20%
30%
40%
50%
60%
70%
80%
90%
G-groups P-groups
��������������
55
DISCUSSION
55
DISCUSSION
The outcome of this thesis reveals that in the KSA, orthodontic patients treated in
governmental clinics have higher caries risks, as suggested by the Cariogram model
(Studies I and IV), as well as a higher prevalence of buccal caries lesions (Study II),
compared to patients treated in the private clinics. In addition, caries risks decreased
four years after the orthodontic treatment for all orthodontic patients in both groups
(Study IV). Scoring buccal caries lesions on digital photographs according to the
clinical criteria was found to be a valid and reliable method (Study III).
Caries-related factors and risk in governmental and private orthodontic patients
(Studies I and IV)
The alternative hypotheses in both studies were based on the findings of other studies
(Wyne 2008; Brennan et al. 2011).
In order to check the intra-examiner reliability for clinical caries registration in the
baseline study, the clinical caries examination was performed on two different
occasions with two weeks in between for 20% of the patients; the Kappa value was
0.86.
The “caries experience” factor in the Cariogram model is evaluated by using the mean
value of DMFS of a certain population. No epidemiological studies were performed to
evaluate the mean value of DMFS on the Saudi population for the same age group
included in these studies. Thus, the mean DMFS in Study I was set to be 4 following a
cross-sectional study (Al Mulla et al. 2009), and the mean DMFS in Study IV was
calculated from the baseline study to be 11. The adjustment in the mean values of
DMFS from the baseline to the follow-up investigation may be one reason explaining
the change in value of the green sector. However, the impact of the “caries
experience” factor in the Cariogram model is unknown.
Salivary and microbiological tests in the baseline and follow-up investigation were
performed using the same chair-side tests and analyzed using the same laboratory
facilities. Also, the same laboratory technician was involved in reading the saliva and
microbiological tests on both occasions (Studies I and IV).
56
Caries Assessment in Orthodontic Patients
56
The stimulated saliva samples were collected just before the de-bonding time at the
baseline study. The results showed a low saliva secretion rate compared to the normal
values that were found to be between 1 and 2 ml/minute (Wang et al. 1998).
However, the follow-up investigation (Study IV) showed a statistically significant
increase in stimulated salivary rate four years after de-bonding. This is possibly due to
methodological problems, where the patients were unfamiliar with chewing paraffin
tablets for the first time. The second explanation might be due to the difficulty of
chewing paraffin tablets in the presence of fixed appliances. This finding is in contrast
with other investigations claiming that orthodontic appliances increase the saliva
secretion rate (Chang et al. 1999; Li et al. 2009; Mummolo et al. 2013). However,
these studies were evaluating the saliva secretion rate before and during the early
period of orthodontic treatment, while the present studies (Studies I and IV)
investigated just prior to de-bonding and four years after the orthodontic treatment.
Nevertheless, another study proved there were no significant differences in the
salivary flow rate before, during, and after orthodontic treatment (Sanpei et al. 2010).
The significantly lower plaque index found four years after de-bonding (Study IV) is
due to the presence of brackets and arch wires at de-bonding; this could be one of the
reasons of decreasing the caries risk four years after de-bonding. This finding, in
agreement with other studies, confirmed that fixed orthodontic appliances are
associated with increased plaque accumulation (Chatterjee and Kleinberg 1979;
Chang et al. 1999; Mummolo et al. 2013).
The number of cariogenic microorganisms, mutans streptococci and lactobacilli, did
not significantly change after four years from de-bonding (Study IV). This finding
contradicts other investigations that proved that cariogenic microorganisms increased
after the placement of orthodontic appliances (Chang et al. 1999; Mummolo et al.
2013). However, these studies were investigating the number of cariogenic
microorganisms before and during the early period of orthodontic treatment, while the
present studies (Studies I and IV) investigated the cariogenic microorganisms just
prior to de-bonding and four years after orthodontic treatment. Moreover, another
study (Peros et al. 2011) showed that the period from the 6th to the 12th week of
orthodontic therapy is the peak time for intensive intraoral growth of cariogenic
microorganisms. The amount of cariogenic microorganisms then decreased afterward,
which supports the findings in theses studies (Studies I and IV) as the saliva was
57
DISCUSSION
57
collected for mutans streptococci and lactobacilli at de-bonding, 1.5 - 2 years from the
start of orthodontic treatment, and four years after de-bonding.
The baseline study (Study I) showed that almost all caries-related factors according to
the Cariogram were significantly different between the governmental and private
groups that will definitely lead to different caries risks (green sector). Although, the
follow-up investigation (Study IV) shows that few caries-related factors (two factors at
de-bonding and three factors four years after de-bonding) were significantly different
between the governmental and private groups, the caries risk was still significantly
higher in the governmental group. These findings raised a very crucial question
“which factor/factors has/have more impact on the Cariogram model?”. The plaque
index and fluoride use were the only common factors that significantly differed
between the governmental and private groups at de-bonding and four years after de-
bonding.
The difference in caries risks between the two groups could be related to the payment
method, where the patients in the private orthodontic clinics have to pay the full
treatment fee, which in turn may encourage their motivation compared to those
receiving orthodontic treatment for free in the governmental centers in the KSA. It
has been shown that patients who have been treated in public clinics have poorer oral
health than those treated in private dental clinics (Brennan et al. 2011). However, the
variations in oral health have been largely attributable to socio-demographic factors
and regularity of dental attendance rather than the method of payment itself (McGrath
and Bedi 2003).
The differences in fluoride use and the plaque index between the governmental and
private patients, as shown in Table 13, may explain the difference in caries risk
between the two groups. These findings show the importance of instructing the
orthodontic patients to improve the preventive measures, including routine oral
hygiene with fluoride toothpaste, especially for the patients treated in the
governmental centers. The modified fluoride toothpaste technique is recommended to
reduce the incidence of new carious lesions in orthodontic patients (Al Mulla et al.
2010). The governmental patients show a higher prevalence of caries lesions on
different tooth surfaces compared with the private patients, whereby this finding is in
agreement with another study performed in preschool children (Wyne 2008).
58
Caries Assessment in Orthodontic Patients
58
Dental caries is a multifactorial disease caused by an interaction of several factors. It
is difficult to accurately identify only one factor to be the main risk indicator for
caries. Several studies have investigated different risk indicators for caries and there is
no consensus toward a single factor. Some studies showed that the patients’ exposure
to dental caries at a younger age would place them at a higher caries risk (Delgado-
Angulo and Bernabe 2006; Masood et al. 2012), while another, long follow-up study
went against this finding (Ekbäck et al. 2012). Other studies investigated caries
indicators including socioeconomic, dietary, gingival bleeding, smoking and oral
hygiene habits with contradicting results (Boersma et al. 2005; Ayo-Yusuf et al. 2007;
Ferreira Zandona et al. 2012). The level of lactobacilli microorganisms is found to be
an important indicator for the caries risk assessment during orthodontic treatment
(Sanpei et al. 2010). These contradicting results emphasize the need for future
investigations and analyses to find out the accurate caries risk indicators and
therefore, the proper prevention.
The findings in the comparison between the test and control groups indicated that the
caries risk using the Cariogram did not differ significantly between patients who had
fixed orthodontic treatment four years ago and those who had no fixed orthodontic
treatment at all. This finding indicates that fixed orthodontic treatment increases the
caries risk during treatment, but once it is removed, the caries risk decreased.
However, this finding is not applicable on WSLs, which is the most frequent side
effect of orthodontic treatment, since WSLs are not included in the Cariogram model.
This seems to be a limitation of the Cariogram used on orthodontic patients, and this
disadvantage should be considered if an updated version of the Cariogram model is
planned.
Buccal caries lesions including WSLs in governmental and private orthodontic
patients (Study II)
The alternative hypothesis in this study was based on the findings of other studies
(Wyne 2008; Brennan et al. 2011).
The advantages of the DIAGNOdent Pen are; the method is more objective; the
readings on the digital screen can be shown to the patient as a pedagogic method; it is
59
DISCUSSION
59
more informative to the patient; and it is more accurate. The disadvantages are that
the device is expensive and the examination is more time-consuming. On the other
hand, the advantages of ICDAS-II are; it costs nothing; is easy to use and less time
consuming but is more subjective and less informative to the patient.
The inter-examiner and intra-examiner reliabilities of the ICDAS-II and the
DIAGNOdent Pen for examining buccal caries lesions were evaluated and kappa
values ranged between 0.87 and 0.93, which reveal substantial agreement (Landis and
Koch 1977). These findings were in agreement with other studies (Lussi et al. 1999;
Ismail et al. 2007).
A systematic review showed the limitations of using the laser fluorescence device as a
principal diagnostic tool for detecting caries due to false-positive readings (Bader and
Shugars 2004). In order to avoid false-positive readings by the DIAGNOdent Pen, the
teeth included in this investigation were rinsed and dried with compressed air after
being polished with a rubber cup and pumice paste as recommended (Lussi and Reich
2005; Lussi et al. 2006).
The percentage of the patients with at least one WSL after orthodontic treatment was
74%. This percentage is similar to another study reported using quantitative light-
induced fluorescence (QLF) (Mattousch et al. 2007). Moreover, the prevalence of
buccal caries lesions was not significantly differing between males and females. This
finding is in agreement with other studies (Øgaard 1989; Lucchese and Gherlone
2013). However, other studies found that males had more tendencies to develop
WSLs than females (Gorelick et al. 1982; Enaia et al. 2011), which could be
explained by ethnic and cultural differences between the studied groups of patients.
This investigation revealed that the clinical criteria (ICDAS-II) correlated well with
the DIAGNOdent Pen (Spearman=0.71). This correlation was measured based on the
chance for the DIAGNOdent Pen to be in agreement with ICDAS-II for diagnosing
different scores of WSL, but not vice versa. For example, 86% of teeth diagnosed
with the ICDAS-II score 3 (dentin caries) had the same score using the DIAGNOdent
Pen, while approximately 10% of teeth diagnosed with the DIAGNOdent Pen score 3
resulted in less than 1% of teeth having the same score using ICDAS-II. This could be
due to the DIAGNOdent Pen tending to give a more positive diagnosis with lower
specificity (Bamzahim et al. 2004).
60
Caries Assessment in Orthodontic Patients
60
Using digital photographs to evaluate buccal caries lesions in orthodontic
patients (Study III)
The question from the beginning was: “Could digital photographs be used as a tool
for detecting the progression of WSLs during orthodontic treatment?”. Based on the
results showed in this study, which indicated that scoring the severity of buccal caries
lesions on digital photographs is a reliable and valid method, the answer is YES.
The photographs in this investigation were taken after de-bonding, which may
simplify the direct visual examination on photographs, however, a previous study
proved that the presence of brackets would not influence the examination of WSLs on
photographs (Livas et al. 2008). In addition, the photographs in this study were taken
perpendicular to the facial surfaces since this technique was found to be reliable for
evaluating WSLs (Benson et al. 2000; Livas et al. 2008). To validate the
standardization, 13 calibrated screens were used to ensure the examiners utilized
exactly the same measurements for direct visual examination of photographs. The
first session of photograph scoring was utilized for comparison with the clinical
examinations; the second session was performed to evaluate the intra-examiner
reliability. The second scoring session showed slight improvement with respect to
correlation with the clinical examination, with an increase in Spearman’s correlation
coefficient from 0.76 to 0.79. This result is to be expected due to the training effect.
The results showed good intra-examiner reliability from the thirteen examiners for
detecting different scores of buccal caries lesions, according to the modified ICDAS-
II, with an agreement ranged between 52% and 83%. These findings are in agreement
with another study that included three examiners (Enaia et al. 2011). In addition,
inter-examiner reliabilities between each examiner and the clinical examination were
moderate to excellent, with agreement ranged between 52% and 80%. These findings
are in agreement with another study (Chapman et al. 2010).
The highest agreement between the direct visual examination of buccal caries lesions
on digital photographs and the clinical examination was found during the evaluation
of teeth with scores 0, 1, 4 and 5 (Figure 9). The lowest agreement was found when
teeth had score 2. This can be explained by the easiness of distinguishing between
sound teeth and teeth with exposed dentin (scores 0, 4 and 5), while score 2 lesions
show enamel breakdown, which is easier to detect clinically by using the dental
61
DISCUSSION
61
explorer. Moreover, there was confusion when registering scores 1 and 3 on digital
photographs. 10% of score 1 lesions examined clinically were registered as score 3 on
the photographs, and 24% of score 3 lesions examined clinically were registered as
score 1 on the photographs. One explanation could be that both scores (1 and 3) have
no cavitation according to the definitions of the clinical criteria (Figure 9). A second
explanation is that most of score 3 lesions accompany score 1 as well. Nonetheless,
the examiners were instructed to register the worst score during the registration on the
photographs. Overall, diagnosing the severity of buccal caries lesions on digital
photographs is a valuable diagnostic tool for evaluating the progression of WSLs
during orthodontic treatment, but further histological studies are needed to confirm
this finding.
Clinical consideration and recommendations
In general, the results of this thesis show that dental caries during orthodontic
treatment is a serious dental health problem in the Kingdom of Saudi Arabia. This
requires the immediate attention of the government, represented by the Ministry of
Health and the dental profession officials, in the Kingdom of Saudi Arabia.
Epidemiological studies to construct baseline data for oral health as well as a good
understanding of dental caries determinants are necessary for setting appropriate oral
health goals. These goals cannot be achieved or even progressed without having
baseline data that describes the current situation. A roadmap with a clear starting
point, pathway, and destination is a desperately needed tool to improve the oral health
of the Saudi Arabian citizens undergoing orthodontic treatment.

62
Caries Assessment in Orthodontic Patients
62
63
CONCLUSIONS
63
CONCLUSIONS
The conclusions from this thesis were that:
� Studies I and IV: Caries risks in orthodontic patients at de-bonding and four years
after de-bonding were greater in patients treated at governmental clinics compared to
those treated at private clinics according to the Cariogram. Caries risks decreased four
years after the orthodontic treatment for all orthodontic patients regardless of which
clinics they were treated at. Thus, the alternative hypothesis was accepted.
� Studies I and IV: Fluoride use and plaque index are the most significant indicators for
caries risk when the government and private groups were compared. Increased
salivary secretion rate, decreased plaque amount, and the improvement of buffer
capacity were the most significant factors in decreasing caries risks four years after
de-bonding.
� Study II: Orthodontic patients treated at governmental clinics show a higher
prevalence of buccal caries lesions at de-bonding, compared to those treated at private
clinics, thus, the alternative hypothesis was accepted. The clinical criteria (ICDAS-II)
shows a good correlation with the laser fluorescence device (DIAGNOdent Pen), thus,
the null hypothesis was rejected.
� Study III: Scoring buccal caries lesions on digital photographs according to ICDAS-
II criteria is a reliable and valid method for assessing the severity of buccal caries
lesions during orthodontic treatment. Thus, the null hypothesis was rejected.

64
Caries Assessment in Orthodontic Patients
64
65
ACKNOWLEDGEMENTS
65
ACKNOWLEDGEMENTS
In the name of Allah, the most Compassionate, the most Merciful. All praise to Allah the
almighty for giving me the wisdom and strength to overcome the difficulties I faced during
my journey of education. Thank you Allah for giving me the health, power and strength to
complete this project.
Associate Professor Heidrun Kjellberg, my main supervisor in this thesis and my former
director in the postgraduate program of Orthodontics…. I will never forget the moment when
I decided to leave Sweden after only the first month of the clinical program due to my
mother’s deteriorating health condition. You compassionately assured me that “your position
is guaranteed for next year”. Thank you so much for your support during the clinical program
and your guidance during my research project.
Associate Professor Ted Lungren, my second supervisor…. besides providing me with
excellent scientific discussions, you were always taking the time to listen and to give advice
when obstacles were encountered. From the bottom of my heart, Thank You!
Professor Dowen Birkhed, the former chairman of the Cariology department…. Thank you
for creating the initial idea for this project.
Dr. Andrea Bresin, my postgraduate program director in Orthodontics…. It has been a very
pleasant period during the three-year clinical program, filled with joy and scientific
discussions. From the deepest part of my heart, Thank you.
Associate Professor Abdullah Aldrees, my close friend and colleague…. for supporting me
with the documentations required for carrying out my studies, my most sincere thanks.
Professor Nasser Al-Jasser, Associate Professor Fares Al-Sehaibany, Dr. Saad Al-Kharsa, Dr.
Tawfik Al-Tamimi, and Dr. Naidah Jodet…. Thank you so much for allowing me to use your
clinics to collect the data required for completing this thesis.
Special thanks to the director of the microbiology laboratory at King Saud University for
allowing me to use the laboratory facilities. I would also like to extend my special thanks to
Mr. Abdulhakim Al-Badah for his general assistance during the laboratory procedures.
I owe special thanks to Dr. Sara Hansen for her assistance in using the radiology rooms in
Study III.

66
Caries Assessment in Orthodontic Patients
66
Special thanks to Mr. Tommy Johnsson for his amazing statistical support. My special thanks
and gratitude extend to Mrs. Sandra Ståhlberg for the linguistic advice and editing. Yvonne
Heijl, the amazing artist who made the perfect thesis cover illustration. Thank you!
Many thanks to the postgraduate students in the Orthodontic department as well as to all the
staff in the Cariology and Orthodontic departments, at Odontologen, University of
Gothenburg, Sweden, for their support and friendship.
Many thanks to Sahlgrenska International Care AB for their great help and support during my
time in Sweden.
My Saudi friends in Sweden…. Warm and special thanks to each one of you. I wish you all
the best in your current education and your future careers.
The Saudi Ministry of Higher Education and the Saudi Arabian government…. Thank you for
all the support you have provided me with. I will be forever indebted to you and I will work
hard to help build our country further.
My father and late mother; Abdullah and Hessah…. It is extremely difficult to translate my
feelings into words. You have nurtured, educated, supported, and loved me. Thank you for
being the best parents in the world, I hope that I have made you both proud.
Warm and special thanks to my lovely brothers and sisters for making sure I stayed healthy
and never lost focus during my education.
Finally, I am sincerely thankful to my darling wife (Ghada) for her continuous support,
patience, prayers, motivation, and taking care of my two angels (Layan and Wegdan)
throughout my studies. Her love, kindness and understanding made developing this thesis
easier.
Funding
This thesis was supported by a scholarship from the Saudi Ministry of Higher Education.
67
REFERENCES
67
REFERENCES
Addy M, Griffiths GS, Dummer PM, Kingdon A, Hicks R, Hunter ML, Newcombe RG, Shaw WC. The association between tooth irregularity and plaque accumulation, gingivitis, and caries in 11-12-year-old children. Eur J Orthod. 1988; 10(1): 76-83.
Al Dosari AM, Wyne AH, Akpata ES, Khan NB. Caries prevalence and its relation to water fluoride levels among schoolchildren in Central Province of Saudi Arabia. Int Dent J. 2004; 54(6): 424-428.
Al Mulla AH, Kharsa SA, Birkhed D. Modified fluoride toothpaste technique reduces caries in orthodontic patients: A longitudinal, randomized clinical trial. Am J Orthod Dentofacial Orthop. 2010; 138(3): 285-291.
Al Mulla AH, Kharsa SA, Kjellberg H, Birkhed D. Caries risk profiles in orthodontic patients at follow-up using Cariogram. Angle Orthod. 2009; 79(2): 323-330.
Al-Malik MI, Rehbini YA. Prevalence of dental caries, severity, and pattern in age 6 to 7-year-old children in a selected community in Saudi Arabia. J Contemp Dent Pract. 2006; 7(2): 46-54.
Al-Mughery AS, Attwood D, Blinkhorn A. Dental health of 5-year-old children in Abu Dhabi, United Arab Emirates. Community Dent Oral Epidemiol. 1991; 19(5): 308-309.
Aljehani A, Tranaeus S, Forsberg CM, Angmar-Mansson B, Shi XQ. In vitro quantification of white spot enamel lesions adjacent to fixed orthodontic appliances using quantitative light-induced fluorescence and DIAGNOdent. Acta Odontol Scand. 2004; 62(6): 313-318.
Aljehani A, Yang L, Shi XQ. In vitro quantification of smooth surface caries with DIAGNOdent and the DIAGNOdent pen. Acta Odontol Scand. 2007; 65(1): 60-63.
American Academy of Pediatric Dentistry. Policy on use of a caries-risk assessment tool (CAT) for infants, children, and adolescents. Pediatr Dent. 2008; 30: 29-33.
American Dental Association caries risk assessment forms. Available at: http://www.ada.org/sections/professionalresources/pdfs/topic_caries_over6.pdf. Accessed on January, 2013.
Andreen I, Köhler B. Effects of Weight Watchers' diet on salivary secretion rate, buffer effect and numbers of mutans streptococci and lactobacilli. Scand J Dent Res. 1992; 100(2): 93-97.
Anhoury P, Nathanson D, Hughes CV, Socransky S, Feres M, Chou LL. Microbial profile on metallic and ceramic bracket materials. Angle Orthod. 2002; 72(4): 338-343.
Artun J, Brobakken BO. Prevalence of carious white spots after orthodontic treatment with multibonded appliances. Eur J Orthod. 1986; 8(4): 229-234.
68
Caries Assessment in Orthodontic Patients
68
Ayo-Yusuf OA, Reddy PS, van Wyk PJ, van den Borne BW. Household smoking as a risk indicator for caries in adolescents' permanent teeth. J Adolesc Health. 2007; 41(3): 309-311.
Bader JD, Shugars DA. A systematic review of the performance of a laser fluorescence device for detecting caries. J Am Dent Assoc. 2004; 135(10): 1413-1426.
Bamzahim M, Shi XQ, Angmar-Månsson B. Secondary caries detection by DIAGNOdent and radiography: a comparative in vitro study. Acta Odontol Scand. 2004; 62(1): 61-64.
Baskaradoss JK, Geevarghese A, Roger C, Thaliath A. Prevalence of malocclusion and its relationship with caries among school children aged 11 - 15 years in southern India. Korean J Orthod. 2013; 43(1): 35-41.
Beck JD. Risk revisited. Community Dent Oral Epidemiol. 1998; 26(4): 220-225.
Benson PE, Ali Shah A, Robert Willmot D. Polarized versus nonpolarized digital images for the measurement of demineralization surrounding orthodontic brackets. Angle Orthod. 2008; 78(2): 288-293.
Benson PE, Pender N, Higham SM. Enamel demineralisation assessed by computerised image analysis of clinical photographs. J Dent. 2000; 28(5): 319-326.
Benson PE, Pender N, Higham SM. Quantifying enamel demineralization from teeth with orthodontic brackets--a comparison of two methods. Part 1: repeatability and agreement. Eur J Orthod. 2003; 25(2): 149-158.
Benson PE, Shah AA, Millett DT, Dyer F, Parkin N, Vine RS. Fluorides, orthodontics and demineralization: a systematic review. J Orthod. 2005a; 32(2): 102-114.
Benson PE, Shah AA, Willmot DR. Measurement of white lesions surrounding orthodontic brackets: captured slides vs digital camera images. Angle Orthod. 2005b; 75(2): 226-230.
Boersma JG, van der Veen MH, Lagerweij MD, Bokhout B, Prahl-Andersen B. Caries prevalence measured with QLF after treatment with fixed orthodontic appliances: influencing factors. Caries Res. 2005; 39(1): 41-47.
Braga MM, Martignon S, Ekstrand KR, Ricketts DN, Imparato JC, Mendes FM. Parameters associated with active caries lesions assessed by two different visual scoring systems on occlusal surfaces of primary molars - a multilevel approach. Community Dent Oral Epidemiol. 2010; 38(6): 549-558.
Braga MM, Oliveira LB, Bonini GA, Bonecker M, Mendes FM. Feasibility of the International Caries Detection and Assessment System (ICDAS-II) in epidemiological surveys and comparability with standard World Health Organization criteria. Caries Res. 2009; 43(4): 245-249.
Bratthall D. Dental caries: intervened--interrupted--interpreted. Concluding remarks and cariography. Eur J Oral Sci. 1996; 104(4 (Pt 2)): 486-491.
69
REFERENCES
69
Brennan DS, Do LG, Slade GD. Caries experience of adults attending private and public dental clinics in Australia. J Public Health Dent. 2011; 71(1): 32-37.
Buczkowska-Radlinska J, Szyszka-Sommerfeld L, Wozniak K. Anterior tooth crowding and prevalence of dental caries in children in Szczecin, Poland. Community Dent Health. 2012; 29(2): 168-172.
Campus G, Cagetti MG, Sale S, Carta G, Lingström P. Cariogram validity in schoolchildren: a two-year follow-up study. Caries Res. 2012; 46(1): 16-22.
Cariogram computer program manual. Available at: http:// www.mah.se/fakulteter-och-omraden/Odontologiska-fakulteten/Avdelning-och-kansli/Cariologi/Cariogram/. Accessed February 2008.
Carlsson J, Grahnen H, Jonsson G. Lactobacilli and streptococci in the mouth of children. Caries Res. 1975; 9(5): 333-339.
Chang HS, Walsh LJ, Freer TJ. The effect of orthodontic treatment on salivary flow, pH, buffer capacity, and levels of mutans streptococci and lactobacilli. Aust Orthod J. 1999; 15(4): 229-234.
Chapman JA, Roberts WE, Eckert GJ, Kula KS, Gonzalez-Cabezas C. Risk factors for incidence and severity of white spot lesions during treatment with fixed orthodontic appliances. Am J Orthod Dentofacial Orthop. 2010; 138(2): 188-194.
Chatterjee R, Kleinberg I. Effect of orthodontic band placement on the chemical composition of human incisor tooth plaque. Arch Oral Biol. 1979; 24(2): 97-100.
De Stoppelaar JD, Van Houte J, Backer DO. The effect of carbohydrate restriction on the presence of Streptococcus mutans, Streptococcus sanguis and iodophilic polysaccharide-producing bacteria in human dental plaque. Caries Res. 1970; 4(2): 114-123.
Delgado-Angulo EK, Bernabe E. Influence of host-related risk indicators on dental caries in permanent dentition. Acta Odontol Latinoam. 2006; 19(2): 85-92.
Demers M, Brodeur JM, Mouton C, Simard PL, Trahan L, Veilleux G. A multivariate model to predict caries increment in Montreal children aged 5 years. Community Dent Health. 1992; 9(3): 273-281.
Diniz MB, Rodrigues JA, Hug I, Cordeiro Rde C, Lussi A. Reproducibility and accuracy of the ICDAS-II for occlusal caries detection. Community Dent Oral Epidemiol. 2009; 37(5): 399-404.
Edwardsson S, Krasse B. Human streptococci and caries in hamsters fed diets with sucrose or glucose. Arch Oral Biol. 1967; 12(8): 1015-1016.
Ekbäck G, Ordell S, Unell L. Can caries in the primary dentition be used to predict caries in the permanent dentition? An analysis of longitudinal individual data from 3-19 years of age in Sweden. Eur Arch Paediatr Dent. 2012; 13(6): 308-311.
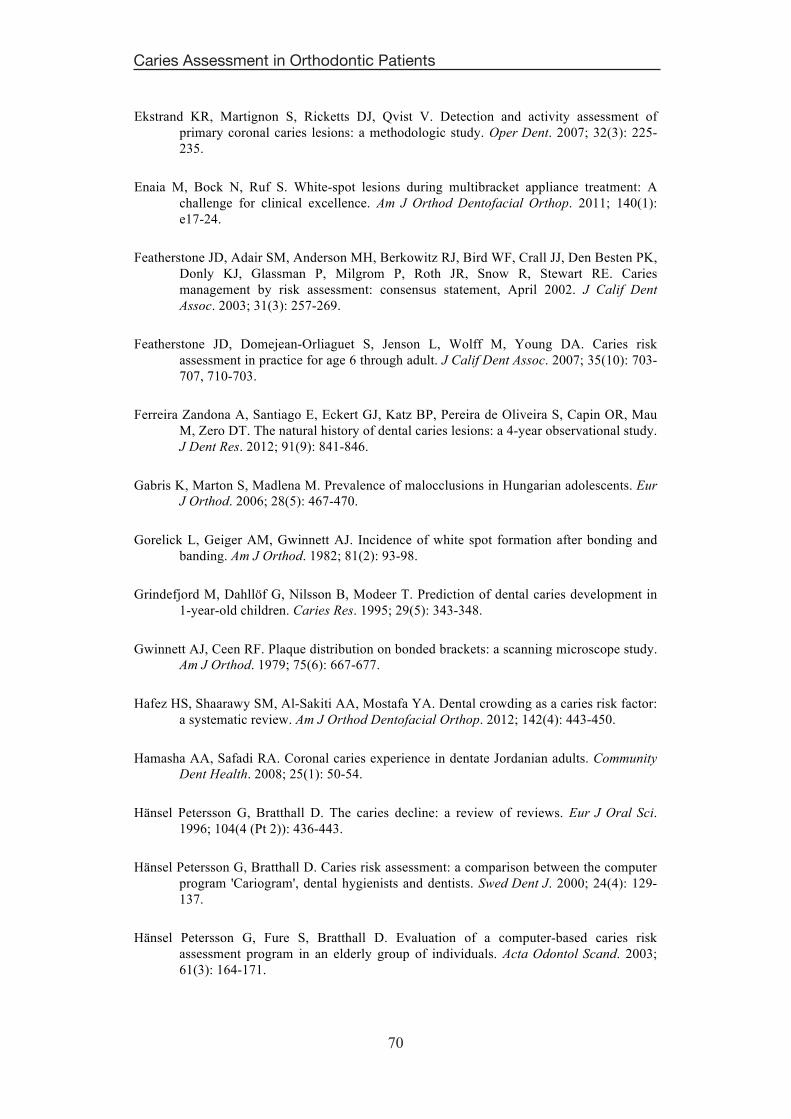
70
Caries Assessment in Orthodontic Patients
70
Ekstrand KR, Martignon S, Ricketts DJ, Qvist V. Detection and activity assessment of primary coronal caries lesions: a methodologic study. Oper Dent. 2007; 32(3): 225-235.
Enaia M, Bock N, Ruf S. White-spot lesions during multibracket appliance treatment: A challenge for clinical excellence. Am J Orthod Dentofacial Orthop. 2011; 140(1): e17-24.
Featherstone JD, Adair SM, Anderson MH, Berkowitz RJ, Bird WF, Crall JJ, Den Besten PK, Donly KJ, Glassman P, Milgrom P, Roth JR, Snow R, Stewart RE. Caries management by risk assessment: consensus statement, April 2002. J Calif Dent Assoc. 2003; 31(3): 257-269.
Featherstone JD, Domejean-Orliaguet S, Jenson L, Wolff M, Young DA. Caries risk assessment in practice for age 6 through adult. J Calif Dent Assoc. 2007; 35(10): 703-707, 710-703.
Ferreira Zandona A, Santiago E, Eckert GJ, Katz BP, Pereira de Oliveira S, Capin OR, Mau M, Zero DT. The natural history of dental caries lesions: a 4-year observational study. J Dent Res. 2012; 91(9): 841-846.
Gabris K, Marton S, Madlena M. Prevalence of malocclusions in Hungarian adolescents. Eur J Orthod. 2006; 28(5): 467-470.
Gorelick L, Geiger AM, Gwinnett AJ. Incidence of white spot formation after bonding and banding. Am J Orthod. 1982; 81(2): 93-98.
Grindefjord M, Dahllöf G, Nilsson B, Modeer T. Prediction of dental caries development in 1-year-old children. Caries Res. 1995; 29(5): 343-348.
Gwinnett AJ, Ceen RF. Plaque distribution on bonded brackets: a scanning microscope study. Am J Orthod. 1979; 75(6): 667-677.
Hafez HS, Shaarawy SM, Al-Sakiti AA, Mostafa YA. Dental crowding as a caries risk factor: a systematic review. Am J Orthod Dentofacial Orthop. 2012; 142(4): 443-450.
Hamasha AA, Safadi RA. Coronal caries experience in dentate Jordanian adults. Community Dent Health. 2008; 25(1): 50-54.
Hänsel Petersson G, Bratthall D. The caries decline: a review of reviews. Eur J Oral Sci. 1996; 104(4 (Pt 2)): 436-443.
Hänsel Petersson G, Bratthall D. Caries risk assessment: a comparison between the computer program 'Cariogram', dental hygienists and dentists. Swed Dent J. 2000; 24(4): 129-137.
Hänsel Petersson G, Fure S, Bratthall D. Evaluation of a computer-based caries risk assessment program in an elderly group of individuals. Acta Odontol Scand. 2003; 61(3): 164-171.
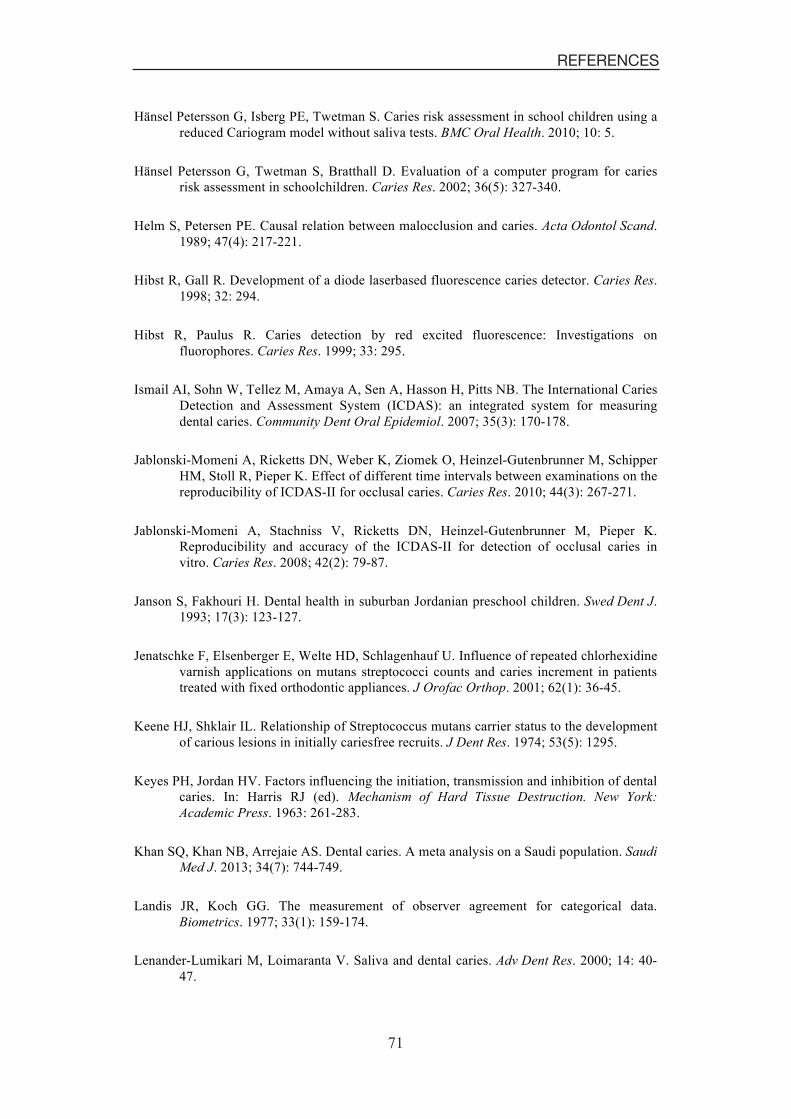
71
REFERENCES
71
Hänsel Petersson G, Isberg PE, Twetman S. Caries risk assessment in school children using a reduced Cariogram model without saliva tests. BMC Oral Health. 2010; 10: 5.
Hänsel Petersson G, Twetman S, Bratthall D. Evaluation of a computer program for caries risk assessment in schoolchildren. Caries Res. 2002; 36(5): 327-340.
Helm S, Petersen PE. Causal relation between malocclusion and caries. Acta Odontol Scand. 1989; 47(4): 217-221.
Hibst R, Gall R. Development of a diode laserbased fluorescence caries detector. Caries Res. 1998; 32: 294.
Hibst R, Paulus R. Caries detection by red excited fluorescence: Investigations on fluorophores. Caries Res. 1999; 33: 295.
Ismail AI, Sohn W, Tellez M, Amaya A, Sen A, Hasson H, Pitts NB. The International Caries Detection and Assessment System (ICDAS): an integrated system for measuring dental caries. Community Dent Oral Epidemiol. 2007; 35(3): 170-178.
Jablonski-Momeni A, Ricketts DN, Weber K, Ziomek O, Heinzel-Gutenbrunner M, Schipper HM, Stoll R, Pieper K. Effect of different time intervals between examinations on the reproducibility of ICDAS-II for occlusal caries. Caries Res. 2010; 44(3): 267-271.
Jablonski-Momeni A, Stachniss V, Ricketts DN, Heinzel-Gutenbrunner M, Pieper K. Reproducibility and accuracy of the ICDAS-II for detection of occlusal caries in vitro. Caries Res. 2008; 42(2): 79-87.
Janson S, Fakhouri H. Dental health in suburban Jordanian preschool children. Swed Dent J. 1993; 17(3): 123-127.
Jenatschke F, Elsenberger E, Welte HD, Schlagenhauf U. Influence of repeated chlorhexidine varnish applications on mutans streptococci counts and caries increment in patients treated with fixed orthodontic appliances. J Orofac Orthop. 2001; 62(1): 36-45.
Keene HJ, Shklair IL. Relationship of Streptococcus mutans carrier status to the development of carious lesions in initially cariesfree recruits. J Dent Res. 1974; 53(5): 1295.
Keyes PH, Jordan HV. Factors influencing the initiation, transmission and inhibition of dental caries. In: Harris RJ (ed). Mechanism of Hard Tissue Destruction. New York: Academic Press. 1963: 261-283.
Khan SQ, Khan NB, Arrejaie AS. Dental caries. A meta analysis on a Saudi population. Saudi Med J. 2013; 34(7): 744-749.
Landis JR, Koch GG. The measurement of observer agreement for categorical data. Biometrics. 1977; 33(1): 159-174.
Lenander-Lumikari M, Loimaranta V. Saliva and dental caries. Adv Dent Res. 2000; 14: 40-47.
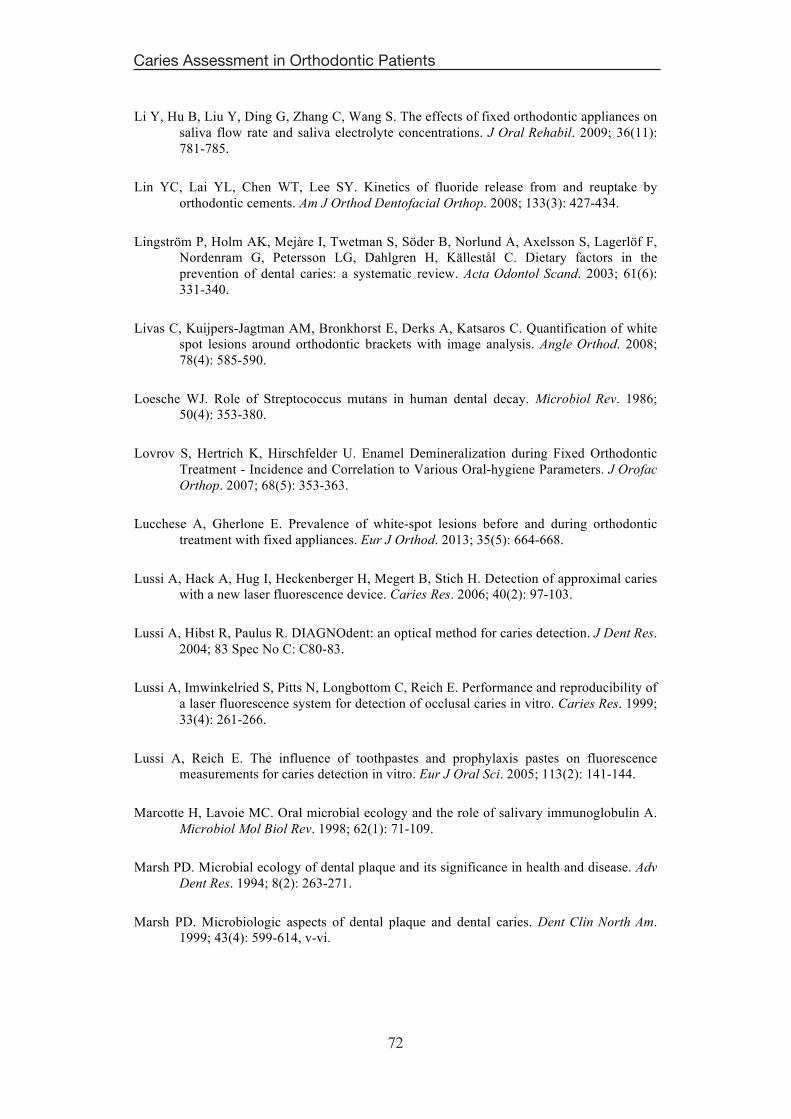
72
Caries Assessment in Orthodontic Patients
72
Li Y, Hu B, Liu Y, Ding G, Zhang C, Wang S. The effects of fixed orthodontic appliances on saliva flow rate and saliva electrolyte concentrations. J Oral Rehabil. 2009; 36(11): 781-785.
Lin YC, Lai YL, Chen WT, Lee SY. Kinetics of fluoride release from and reuptake by orthodontic cements. Am J Orthod Dentofacial Orthop. 2008; 133(3): 427-434.
Lingström P, Holm AK, Mejàre I, Twetman S, Söder B, Norlund A, Axelsson S, Lagerlöf F, Nordenram G, Petersson LG, Dahlgren H, Källestål C. Dietary factors in the prevention of dental caries: a systematic review. Acta Odontol Scand. 2003; 61(6): 331-340.
Livas C, Kuijpers-Jagtman AM, Bronkhorst E, Derks A, Katsaros C. Quantification of white spot lesions around orthodontic brackets with image analysis. Angle Orthod. 2008; 78(4): 585-590.
Loesche WJ. Role of Streptococcus mutans in human dental decay. Microbiol Rev. 1986; 50(4): 353-380.
Lovrov S, Hertrich K, Hirschfelder U. Enamel Demineralization during Fixed Orthodontic Treatment - Incidence and Correlation to Various Oral-hygiene Parameters. J Orofac Orthop. 2007; 68(5): 353-363.
Lucchese A, Gherlone E. Prevalence of white-spot lesions before and during orthodontic treatment with fixed appliances. Eur J Orthod. 2013; 35(5): 664-668.
Lussi A, Hack A, Hug I, Heckenberger H, Megert B, Stich H. Detection of approximal caries with a new laser fluorescence device. Caries Res. 2006; 40(2): 97-103.
Lussi A, Hibst R, Paulus R. DIAGNOdent: an optical method for caries detection. J Dent Res. 2004; 83 Spec No C: C80-83.
Lussi A, Imwinkelried S, Pitts N, Longbottom C, Reich E. Performance and reproducibility of a laser fluorescence system for detection of occlusal caries in vitro. Caries Res. 1999; 33(4): 261-266.
Lussi A, Reich E. The influence of toothpastes and prophylaxis pastes on fluorescence measurements for caries detection in vitro. Eur J Oral Sci. 2005; 113(2): 141-144.
Marcotte H, Lavoie MC. Oral microbial ecology and the role of salivary immunoglobulin A. Microbiol Mol Biol Rev. 1998; 62(1): 71-109.
Marsh PD. Microbial ecology of dental plaque and its significance in health and disease. Adv Dent Res. 1994; 8(2): 263-271.
Marsh PD. Microbiologic aspects of dental plaque and dental caries. Dent Clin North Am. 1999; 43(4): 599-614, v-vi.
73
REFERENCES
73
Masood M, Yusof N, Hassan MI, Jaafar N. Assessment of dental caries predictors in 6-year-old school children - results from 5-year retrospective cohort study. BMC Public Health. 2012; 12: 989.
Mattousch TJ, van der Veen MH, Zentner A. Caries lesions after orthodontic treatment followed by quantitative light-induced fluorescence: a 2-year follow-up. Eur J Orthod. 2007; 29(3): 294-298.
McDermid AS, McKee AS, Ellwood DC, Marsh PD. The effect of lowering the pH on the composition and metabolism of a community of nine oral bacteria grown in a chemostat. J Gen Microbiol. 1986; 132(5): 1205-1214.
McGrath C, Bedi R. Dental services and perceived oral health: are patients better off going private? J Dent. 2003; 31(3): 217-221.
Mizrahi E. Surface distribution of enamel opacities following orthodontic treatment. Am J Orthod. 1983; 84(4): 323-331.
Mummolo S, Marchetti E, Giuca MR, Gallusi G, Tecco S, Gatto R, Marzo G. In-office bacteria test for a microbial monitoring during the conventional and self-ligating orthodontic treatment. Head Face Med. 2013; 9: 7.
Nalcaci R, Demirer S, Ozturk F, Altan BA, Sokucu O, Bostanci V. The relationship of orthodontic treatment need with periodontal status, dental caries, and sociodemographic factors. ScientificWorldJournal. 2012; 2012: 498012.
Neilson A, Pitts NB. The clinical behaviour of free smooth surface carious lesions monitored over 2 years in a group of Scottish children. Br Dent J. 1991; 171(10): 313-318.
O'Reilly MM, Featherstone JD. Demineralization and remineralization around orthodontic appliances: an in vivo study. Am J Orthod Dentofacial Orthop. 1987; 92(1): 33-40.
Øgaard B. Prevalence of white spot lesions in 19-year-olds: a study on untreated and orthodontically treated persons 5 years after treatment. Am J Orthod Dentofacial Orthop. 1989; 96(5): 423-427.
Øgaard B, Bishara S, Duschner H. Enamel effects during bonding—debonding and treatment with fixed appliances. Experts’ Guide to Malpractice. Quintessence. 2004: 19-46.
Øgaard B, Larsson E, Henriksson T, Birkhed D, Bishara SE. Effects of combined application of antimicrobial and fluoride varnishes in orthodontic patients. Am J Orthod Dentofacial Orthop. 2001; 120(1): 28-35.
Øgaard B, Rølla G, Arends J. Orthodontic appliances and enamel demineralization. Part 1. Lesion development. Am J Orthod Dentofacial Orthop. 1988a; 94(1): 68-73.
Øgaard B, Rølla G, Arends J, ten Cate JM. Orthodontic appliances and enamel demineralization. Part 2. Prevention and treatment of lesions. Am J Orthod Dentofacial Orthop. 1988b; 94(2): 123-128.
74
Caries Assessment in Orthodontic Patients
74
Øgaard B, Rølla G, Ruben J, Dijkman T, Arends J. Microradiographic study of demineralization of shark enamel in a human caries model. Scand J Dent Res. 1988c; 96(3): 209-211.
Paes Leme AF, Koo H, Bellato CM, Bedi G, Cury JA. The role of sucrose in cariogenic dental biofilm formation--new insight. J Dent Res. 2006; 85(10): 878-887.
Paschos E, Kleinschrodt T, Clementino-Luedemann T, Huth KC, Hickel R, Kunzelmann KH, Rudzki-Janson I. Effect of different bonding agents on prevention of enamel demineralization around orthodontic brackets. Am J Orthod Dentofacial Orthop. 2009; 135(5): 603-612.
Peros K, Mestrovic S, Anic-Milosevic S, Slaj M. Salivary microbial and nonmicrobial parameters in children with fixed orthodontic appliances. Angle Orthod. 2011; 81(5): 901-906.
Pinelli C, Campos Serra M, de Castro Monteiro Loffredo L. Validity and reproducibility of a laser fluorescence system for detecting the activity of white-spot lesions on free smooth surfaces in vivo. Caries Res. 2002; 36(1): 19-24.
Pitts N. "ICDAS"--an international system for caries detection and assessment being developed to facilitate caries epidemiology, research and appropriate clinical management. Community Dent Health. 2004; 21(3): 193-198.
Pitts NB. Current methods and criteria for caries diagnosis in Europe. J Dent Educ. 1993; 57(6): 409-414.
Rodricks J. Calculated risk. The toxicity and human health risks of chemicals in our environment. 1992; Cambridge: Cambridge University Press.
Sanpei S, Endo T, Shimooka S. Caries risk factors in children under treatment with sectional brackets. Angle Orthod. 2010; 80(3): 509-514.
Scheie AA, Arneberg P, Krogstad O. Effect of orthodontic treatment on prevalence of Streptococcus mutans in plaque and saliva. Scand J Dent Res. 1984; 92(3): 211-217.
Schmidlin PR, Schatzle M, Fischer J, Attin T. Bonding of brackets using a caries-protective adhesive patch. J Dent. 2008; 36(2): 125-129.
Selwitz R, Ismail A, Pitts N. Dental caries. Lancet. 2007; 369: 51-59.
Shi XQ, Tranaeus S, Angmar-Mansson B. Validation of DIAGNOdent for quantification of smooth-surface caries: an in vitro study. Acta Odontol Scand. 2001; 59(2): 74-78.
Shoaib L, Deery C, Ricketts DN, Nugent ZJ. Validity and reproducibility of ICDAS II in primary teeth. Caries Res. 2009; 43(6): 442-448.
Silness J, Löe H. Periodontal Disease in Pregnancy. Ii. Correlation between Oral Hygiene and Periodontal Condtion. Acta Odontol Scand. 1964; 22: 121-135.
75
REFERENCES
75
Singh A, Purohit B, Sequeira P, Acharya S, Bhat M. Malocclusion and orthodontic treatment need measured by the dental aesthetic index and its association with dental caries in Indian schoolchildren. Community Dent Health. 2011; 28(4): 313-316.
Smith DJ, Anderson JM, King WF, van Houte J, Taubman MA. Oral streptococcal colonization of infants. Oral Microbiol Immunol. 1993; 8(1): 1-4.
Stahl F, Grabowski R. Malocclusion and caries prevalence: is there a connection in the primary and mixed dentitions? Clin Oral Investig. 2004; 8(2): 86-90.
Stecksen-Blicks C, Renfors G, Oscarson ND, Bergstrand F, Twetman S. Caries-preventive effectiveness of a fluoride varnish: a randomized controlled trial in adolescents with fixed orthodontic appliances. Caries Res. 2007; 41(6): 455-459.
Summitt J, Robbins J, Schwartz R (2006a). Fundamentals of Operative Dentistry: A Contemporary Approach, 3rd ed. Hanover Park, IL, Quintessence Publishing. Chapter 1. Pages 2-4.
Summitt J, Robbins J, Schwartz R (2006b). Fundamentals of Operative Dentistry: A Contemporary Approach, 3rd ed. Hanover Park, IL, Quintessence Publishing. Chapter 4. Pages 72-73.
Ten Cate J, Duijsters P. Influence of fluoride in solution on tooth demineralization. I. Chemical data. Caries Res. 1983; 17(3): 193-199.
The Swedish Council on Technology Assessment in Health Care. Caries-Diagnosis, risk assessment and non-invasive treatment. A systematic review. Summary and conclusions. Report No 188. 2007 ISBN: 978-91-85413-21-8. 2008.
Tranaeus S, Shi XQ, Angmar-Månsson B. Caries risk assessment: methods available to clinicians for caries detection. Community Dent Oral Epidemiol. 2005; 33(4): 265-273.
Truin GJ, König KG, Bronkhorst EM, Frankenmolen F, Mulder J, van't Hof MA. Time trends in caries experience of 6- and 12-year-old children of different socioeconomic status in The Hague. Caries Res. 1998; 32(1): 1-4.
Wang SL, Zhao ZT, Li J, Zhu XZ, Dong H, Zhang YG. Investigation of the clinical value of total saliva flow rates. Arch Oral Biol. 1998; 43(1): 39-43.
Whelton H. Overview of the impact of changing global patterns of dental caries experience on caries clinical trials. J Dent Res. 2004; 83 Spec No C: C29-34.
Willmot DR, Benson PE, Pender N, Brook AH. Reproducibility of quantitative measurement of white enamel demineralisation by image analysis. Caries Res. 2000; 34(2): 175-181.
Woodward M, Walker AR. Sugar consumption and dental caries: evidence from 90 countries. Br Dent J. 1994; 176(8): 297-302.

Caries Assessment in Orthodontic Patients
76 76
World Health Organization. Oral health surveys: Basic methods. 4th ed. Geneva: World Health Organization. 1997.
World Health Organization. Continous Improvement of Oral Health in the 21 Century: The approach of the WHO Global Oral Health Programme. Geneva: World Health Organization. 2003.
Wyne AH. Caries prevalence, severity, and pattern in preschool children. J Contemp Dent Pract. 2008; 9(3): 24-31.
Wyne AH, Al-Ghannam NA, Al-Shammery AR, Khan NB. Caries prevalence, severity and pattern in pre-school children. Saudi Med J. 2002; 23(5): 580-584.