Removing phosphorus from drainage water the phosphorus removal structure

Caribbean Area
Caribbean Area Phosphorus Index
A Planning Tool to Assess and Manage P Movement
High phosphorus (P) concentrations found in many surface waters throughout Puerto
Rico suggest that this may be the leading cause of observed eutrophication. Because
agricultural activities are one of many nonpoint sources apparently contributing to P
loading, it is important to implement agricultural nutrient management plans. This must
be done judiciously because of the unique social and economic conditions that prevail.
One component of such plan is the assessment of P transport from soil to water by the
use of the Phosphorus Index (PI). The Phosphorus Index (PI) is a site specific,
qualitative vulnerability assessment tool used by the USDA, Natural Resources
Conservation Service (NRCS) to determine when manure utilization may be based on a
nitrogen or phosphorus-based budget. The tool allows a conservation planner to
determine, from among a series of proposed manure application sites, which ones are
potentially most vulnerable to the off-site movement of phosphorus. The original PI has
been modified to consider the unique pedologic and climatic conditions that prevail in the
tropical Caribbean. Modifications to the PI for tropical conditions also address
characteristics of highly weathered soils. The PI for Puerto Rico considers both transport
(soil erosion, runoff class, distance to watercourse) and source (soil test P, fertilizer and
organic P ratio and application method and timing) characteristics.

2
PHOSPHORUS CONCERNS IN THE TROPICAL ENVIRONMENT Factors affecting P losses from the landscape and movement to surface water are grouped into transport factors. To assess P transport it is necessary to examine soil erosion and runoff rates, P sorption to soil particles and proximity of site to surface water. Since P is considered immobile in most soils, soil erosion and runoff in areas with high soil test P can pollute surface waters. However, the risk is lower if runoff and erosion is minimized. Except in the coastal plains and valleys, the steep topography on the island dominates soil landscape characteristics (Map1) increasing P loss potential via erosion and runoff. With the topographic characteristics of our soils it is obvious that most of the P loss, in traditional cropland and overgrazed sites, is attached to soil particles. If these conditions occur in close proximity to surface water, impairment is likely. Thus, controlling erosion is of prime importance in minimizing P movement. According to RUSLE estimates, soil erosion rates may exceed 40 tons/acre/year in low residue conventional tillage cropland with more than 30 percent slopes. A highly erodible soil map unit list is in Section II of Caribbean Area Field Office Technical Guide. Soil erodibility potential for soils in Puerto Rico is shown in Map 2. The categories used in this map regroup highly erodible land (HEL) into high or very high erosion potential and non HEL into low or very low. The potentially HEL determinations are categorized as a medium class. High category includes all deep red clayey soils formed on 20 to 40 percent slopes and K factor from 0.02 to 0.10 and other shallow soils up to 20 percent slopes. The very high category includes soils with K factor more than 0.10 formed on slopes over 20 percent, all soils over 40 percent slopes with K factor from 0.02 to 0.10 and all rockland complex exceeding 40 percent slope. Low and Very low category soils include those on slopes from 0 to 2 percent. All soils with an aquic moisture regime, and fluventic great group of Soil Taxonomy and others with coarse textures are grouped in the low category. The island exhibits an intriguing pedologic and mineralogical diversity with soils presenting widely different P sorption – desorption patterns (Jones et al., 1982; Beinroth, 1982). Most highly weathered and alkaline soils have high sorption potential, which could reduce P losses in runoff. Based on soil survey data and soil classification of the soils in Puerto Rico around 30 percent of soils in agricultural production exhibit a high P sorption characteristic. Leaching in P deficient subsoil with high sorption capacity is of less importance because soil particles sorb much of the soluble P. Few exceptions may occur in permeable coarse texture and organic soils with low ability to retain P. Agricultural P sources include organic residues from manure and inorganic fertilizers. In Puerto Rico most of the agricultural activity is concentrated on ecologically fragile ecosystem, commonly exceeding 20% slopes where intense sudden rainstorms are common. Most of the manure comes from poultry, dairy, and swine enterprises. The poultry industry is concentrated in the south central part while dairy is in the north coast, mostly in the Karst formation. The swine producers are distributed throughout the island.

Map 1. General Topography and Rivers of Puerto Rico
3

Map 2. General Soil Erodibility Classes of Puerto Rico
4

5
Effective management of P requires knowledge of soil properties, P behavior in soils and information obtained from onsite soil and manure test. In Puerto Rico, either the Bray 1, Bray 2 or Olsen P soils tests have traditionally been used to evaluate plant available P. High long term P application rates in the form of fertilizers or manure can increase the soil test P levels. With higher P content present in the soil, there is an increased risk of loss potential. Nevertheless, to assure adequate crop yields in P deficient soils, often the application rate may exceed more than twice the amount utilized by the crop. Thus, heavy application of manure and fertilizer may need to be applied to maintain optimum agronomic yields in highly weathered and alkaline soils. The risks of P loss increase with increasing P rate and surface application in close proximity to surface water. Those sites with highest probability for P loss merit specific management practices to minimize their contribution to surface water. The key is to apply where and when the risk of major runoff and erosion events is lowest.
PHOSPHORUS INDEX CONCEPT
The Phosphorus Index (PI) is an assessment tool that may be used by resource managers and landusers to assess the risk of phosphorus (P) losses from a field. A work group made up by Scientists from College of Agricultural Sciences of the University of Puerto Rico and USDA – NRCS formed a working group to adapt and validate this technology to our tropical environment. The purpose of the PI is to aid personnel from Natural Resources Conservation, third party vendors, and other environmental agencies in the decision-making processes involved in designing animal by products conservation plans. The risk of P losses is a function of transport and sources characteristics. The P index considers eight field features and management practices, including three transport characteristics which are: (1) soil erosion rate, (2) runoff class, (3) distance to surface water, and buffer strips; and five source characteristics which are: (1) soil test P factor, (2) fertilizer P application ratio, fertilizer P application method and timing, organic P application ratio, and organic P application method and timing. The weighting factors (WF) show on Table 1 is based on the professional judgement of the scientists that modified the PI. The lowest weighting factor is assigned to the factor that has low relative importance to P loss. For example, the fertilizer P application ratio and method are assigned lower weighting factor compared to organic fertilizer because organic sources nutrient content and balance of manure varies among operations and over time and nitrogen based manure application may cause P build up.

6
Table 1. Weighting Factors of P Index Parameters
Parameters Weighting Factor
1. Soil Erosion 1.0
2. Runoff Class 1.0
3. Distance to Surface Water and Buffer Strip Width 1.0
4. Soil Test P 1.0
5. Fertilizer P Application Ratio 0.5
6. Fertilizer P Application Method and Timing 0.5
7. Organic P Application Ratio 0.75
8. Organic P Application Method and Timing 1.0
Each field features and management practices are assigned value rating as shown on the next table. Table 2. Value Ratings of P Index Parameters
Value Ratings (Points) P index Parameters Very Low Low Medium High Very High
Transport Characteristics 0.6 0.7 0.8 0.9 1.0 Site Source Characteristics 0.1 1 2 4 8
Multiplying the weighting factor by the value rating yields points for that specific field feature or management practice. Caribbean Area P Index shown on Table 3 takes into considerations all the above data. The following formula describes the procedure used to compute the PI rating.
PI = ( (SE x C1) x (RC x C2 ) x (PSW x C3)) x ∑ (Source Characteristic Rating x Ci)
Where: SE = Soil Erosion rating C1 = Weighting coefficients for soil erosion RC =Runoff Class rating C2 = Weighting coefficients for runoff class PSW = Distance to Surface Water/Buffer Strips rating C3 = Weighting coefficients for Distance to Surface Water/Buffer Strips Ci = Weighting coefficients for each source characteristics This formula separately evaluates the transport and source characteristics of a site and combines them in a multiplicative manner. This procedure allows having a better representation of site vulnerability. A site could have a high rating of source characteristics but if there is no P loss the vulnerability is low. Based on multiplication of transport and source factor, the product is rank into an overall category rating of Low, Medium, High or Very High. The final ranking identifies fields where the risk of phosphorus movement is relatively higher than other sites.

7
Table 3. Caribbean Area P Index
Caribbean Area P Index Characteristics Value Ratings
Transport
WF
Very Low (0.6 point)
Low (0.7 point)
Medium (0.8 point)
High (0.9 point)
Very High (1.0 point)
1. Soil Erosion (tons/acre/year)
1.0
< 3
>3 ≤ 6
> 6 ≤ 10
> 10 ≤ 15
> 15
2. Runoff Class
1.0
Very low/ Negligible
Low
Medium
High
Very High
3. Distance to Surface Water; Buffer Strip Width
1.0
> 100 feet of high stand cover (>91% cover and > 6” high); > 21 feet of buffer strip
> 100 feet of good stand cover(81– 90 % cover and > 6” high); 10 – 20 feet of buffer strip
> 100 feet of medium or better stand cover (> 61 % cover and >6” high) ; no buffer strip
> 100 feet of low stand cover (< 60% cover and < 6” high); no buffer strip
< 100 feet; no buffer strip
Characteristics Value Ratings
Site Source WF Very Low
(0.1 point) Low
(1 point) Medium
(2 points) High
(4 points) Very High (8 points)
4. Soil Test P Level (PPM)
1.0
Very low
Low
Medium
High
Very high
5. Fertilizer P Application Ratio (lb./acre) FPR = Annual P application rate/ P Crop uptake
0.5
≤1 time crop
uptake
≤ 2 times
crop uptake
≤ 4 times
crop uptake
≤ 6 times
crop uptake
> 6 times
crop uptake
6. Fertilizer P Application Method and Timing
0.5
None applied
Incorporated < 1 week or trickle applied
Incorporated < 1 month after applied; or contour banded
Surface applied before rainy Season
Surface applied during rainy season
7. Organic P Application Ratio (lb./acre) OPR = Annual P application rate/ P Crop uptake
0.75
≤ 1 time crop
uptake
≤ 2 times
crop uptake
≤ 4 times
crop uptake
≤ 6 times
crop uptake
> 6 times
crop uptake
8. Organic P Application Method and Timing
1.0
None applied
Incorporated < 1 week after applied or sprinkler applied during dry season
Incorporated > 1 month after applied or contour banded in crop field or when sprinkler applied no runoff occurs
Surface applied and not Incorporated or when applied via irrigation excessive runoff occurs
Surface or sprinkler applied during rainy season

8
DESCRIPTION OF FIELD FEATURES AND MANAGEMENT PARAMETERS 1. Soil Erosion is the detachment and movement of soil particles predicted from
Universal Soil Loss Equation (RUSLE). The value category is given in tons of soils per acre per year (ton/acre/year). The rating is higher as soil erosion increases. This parameter considers the risk of movement of sediment bound P suspended in water runoff. A Caribbean Area RUSLE handbook should be used to calculate soil erosion.
A = R * K * LS * C * P Where: A = Average annual soil loss (tons/acre/year) R = Runoff and erosion factor K = Soil erodibility factor LS = Slope length/steepness factor C = Cover and management factor P = Supporting practice factor
2. Runoff Class considers the relative risk of surface transport of P from a site by water flow over the land surface to water bodies. These groupings are based on runoff producing characteristics of the soil. The current runoff class used in this P indexing is a function of land slope and soil permeability. The method is adapted from National Soil Survey Handbook. Soil survey data is used to determine the classes. The runoff classes are: Negligible – N Medium - M Very low – VL High - H Low – L Very high - VH
The result of using the matrix provides the value categories: Very Low, Low, Medium, High, and Very High. Distribution of soil runoff classes is shown on Map 3. Map Soil runoff class is derived from the following table:
Table 4. Surface Runoff Classes
Soil Permeability Class Slope (%) Very Rapid
Moderately Rapid and
Rapid
Moderately Slow and Moderate
Slow Very Slow
Concave N N N N N
< 2 N N N L M
2 – 5 N VL L M H
5 – 12 VL L M H VH
12 – 20 VL L M H VH
> 20 L M H VH VH

9
Permeability classes for specific soils can be obtained from a published soil survey or from local USDA – NRCS field offices. Runoff class determination arranged by soil survey and mapping units is included in the Appendix 1.
3. Distance to Surface Water and Buffer Strip Width considers the distance in feet
from the phosphorus application site to surface water and filtering effect of a vegetative buffer strip. Surface waters include any permanent streams, springs, lakes, sinkholes, wetlands and ditches or waterways that flow intermittently through the year. Buffer strip (BS) considers the filtering effect of a vegetative filter strip at all areas where water will flow from the field, including well-managed pastureland. Filter strips, field borders, contour buffer strips, vegetative barrier grassed waterway and riparian forest buffers are all examples of vegetative buffers or covers. The value class is established based on distance to surface water, buffer strip width and cover management condition. The medium value is based on the average distance required by local Environmental Quality Board (EQB). Plant vigor of permanent vegetation may reduce or increase runoff velocity and infiltration. In a similar ecosystem, a well-managed pastureland might have a lower runoff and higher infiltration than an overgrazed condition. Sites with distances and buffer width greater or lower than average specified on the PI will receive higher or lower rating, respectively. The buffering effect of vegetative strips may compensate distance to surface water.
4. Soil Test P Level (STPL) is the soils P nutrient level relative to crop production
expressed in part per million (PPM). From an environmental standpoint, soil test P content is not intended to predict the amounts of P leaving land and going into surface waters, as it cannot be assumed that there is a direct relationship between the STPL and nutrient pollution potential. This is because the movement of P can be affected by soil properties such as soil pH, clay content, mineralogy, among others. Nevertheless, there exists quantitative relationship between soil test P extracted by agronomic soil test and water soluble P. Preliminary work by scientist at the University of Puerto Rico has developed empirical relationship between agronomic soil test and water soluble P. From this work, preliminary threshold soil test P levels based on the maximum allowable point source limits established by the local Environmental Quality Board which is 1ppm of total P have been developed. The range of value used for soil test P interpretation on the table below were chosen so that they would approximately represent the P fertility level of soils throughout Puerto Rico for the most commonly grown crops. The very high-risk class may exceed about four to eight times the expected agronomic STP critical level for the most commonly grown crops.

10
Map 3. General Soil Runoff Classes of Puerto Rico RRico

11
Table 5. Soil Test P Interpretation Categories by Soils Groups
Soil Test P Interpretation Soils Groups
Soil Test
(PPM) Very Low Low Moderate High Very High
Strongly Acid
High P Sorption
Olsen or
Bray 0 - 10 11 - 30 31 - 130 131 - 300 > 300
Bray 0 - 10 11 - 30 31 - 55 56 - 100 > 100 Moderate and Slightly Acids
Low to Medium P Sorption Olsen 0 - 20 21 - 40 41 - 90 91 - 200 > 200
Non Acid Low to Medium P Sorption
Olsen or Bray 0 - 10 11 - 30 31 - 70 71 - 150 > 150
Table 5 uses the P Sorption Capability Group (PSCG) system to characterize three soils groups based on potential P sorption and soil reaction. The PSCG describes the soil potential to fix phosphorus. Phosphate in the fixed P pool may have a very little impact on the fertility of the soil. The soil grouping is based on soil mineralogy and texture. P sorption is higher in strongly acid soils with oxidic and kaolinitic mineralogy and in alkaline soils with carbonatic mineralogy. Each of these reactions will result in very insoluble compounds of phosphate that are generally not available to plants. Continuous application of more P increases the fertility of the soil, but much of the added P becomes fixed and unavailable. The sorption intensity based on mineralogy for the soils in the Caribbean Area: Oxidic > Carbonatic > Kaolinitic > Mixed > Montmorrillonitic > Siliceous. The sorption capacity of organic soils is considered to be very low. Soil texture is another factor that influence soil sorption. The sorption is higher with an increase in soil clay. Soils with a coarse texture have a lower sorption. High P saturation level of most tropical soils can reduce the amount of soluble P in runoff. The combination of mineralogy and textural classes serve to create different sorption groups varying from very low to very high. A soil with higher sorption capacity may receive a lower rating value. The P sorption capability group may be estimated by the use of Table 6, Phosphorus Sorption Soil Capability Group Classification System. Map 4 shows distribution of PSCG categories in Puerto Rico. The user may use the soil classification made by soil survey and mapping units included in the appendix 1. Also, soil map unit is correlated with a soil group to facilitate STPL interpretation.

Map 4. General Soil Phosphorus Sorption Capability Groups of Puerto Rico
12

13
Table 6. Phosphorus Sorption Soil Capability Group Classification System
Phosphorus Sorption Soil Capability Group Interpretation Categories
Sorption Class
Descriptions
Very Low A. All soils with various mineralogy that have over 70% of sand fraction in the surface horizon (sand and loamy sand). B. All organic soils.
Low A. Clayey soils with montmorrillonitic mineralogy. B. B. Other soils with mixed mineralogy that have less than 20% clay but no more than 70% sand (SL, L, SIL and SI textural classes).
Medium
A. Soils with mixed mineralogy that have more than 20% clay (SCL, CL, SICL, SC, SIC and C textural classes). B. Soils with oxidic and carbonatic mineralogy that have no more than 70% sand and less than 20% clay (SL, L and SIL textural classes). C. C. Other kaolinitic soils with SCL, CL, SICL, SL, L and SIL textural classes
High
A. Clayey acid soils with Kaolinitc mineralogy B. Other soils with oxidic or carbonatic mineralogy that have clay between 20 and 35% C. (SCL, CL and SICL textural classes).
Very High Clayey soils with more than 35% clay (C, SC and SIC textural classes) with oxidic or carbonatic mineralogy.
5. Fertilizer P Application Ratio is the amount of P in pound per acre (lb./acre) that is applied to the soil, divided by the amount of P removed by the crop. The amount applied does not include phosphorus from organic sources. The form of phosphorus as well as the quantity is an important predictor of soluble P in runoff. Phosphorus uptakes for tropical crops are in Agricultural Waste Management Field Handbook, Chapter 6, Table 6 - 6 Caribbean Area Supplement.
FPR = Annual P application ratio/ P crop uptake
6. Fertilizer P Application Method and Timing considers if the P fertilizer is surface applied, incorporated or irrigated. It also considers the amount of time that the P fertilizer is exposed on the soil surface and the historical weather seasons when most rainfall occurs. Fertilizer incorporation after application reduces the potential for P losses.

14
7. Organic P Application Ratio is the function of total P in manure, in pound of per acre (lb./acre) of total P that is applied to the soil divided by the P crop uptake. An analysis of organic material is necessary to determine the total P content of the manure. This parameter includes all sources of phosphorus whether originating from organic sources such as animal manure, compost or poultry litter. Most of the total will be released over a period of time depending on soil and climatic condition. Phosphorus uptakes for tropical crops are in Agricultural Waste Management Field Handbook, Chapter 6, Table 6 - 6 Caribbean Area Supplement.
OPR = Annual Organic P application ratio / P crop uptake 8. Organic P Application Method and Timing considers if the organic P material is
surface applied, incorporated or irrigated and the amount of time that manure is exposed on the soil surface and the historical weather seasons when most rainfall occurs. Manure should be incorporated after application to reduce the potential for P losses.
USE OF THE P INDEX
The P Index was developed to rank the relative risk of occurrence, and should not be interpreted as an assurance of actual P loss. The ranking of a site does not reflect a water quality standard or represent a regulatory tool. It is a planning tool that can be used in resource management planning to identify sites that would require direct conservation efforts to minimize P transfer to surface water. A PI analysis helps the planner assist the producer in making nutrient management decisions. The PI numerical value is interpreted in Table 6 and delineates if the nutrient management plan should be based on nitrogen or phosphorus. The numerical result of the PI is a qualitative rating (Low, Medium, High, or Very high). The transport value rating of 0.25 is the product of a very low erosion rate (0.6), very low runoff (0.6), and low distance to surface water and buffer strip width (0.7). The transport value rating of 0.5 is the product of all the transport characteristics (soil erosion, runoff class, and distance to surface water; buffer strip width) having a medium value rating of 0.8. The transport parameter yield 0.25 and 0.5 numerically depict the environmental vulnerability of average farm condition in Puerto Rico. As an example, multiplication of 0.25 by Very High source characteristics (30 points) results in a rating of 7.5 while Very High transport rating (1) multiplied by Low site source characteristic (3.75) gives a 3.75 rating. These value ratings are used in Table 7 to set P index rating of organic and inorganic low and medium categories. The same approach is used to set the other categories. Some values rating were slightly adjusted, such as increase the value from 7.5 to 7.7, to reflect actual condition. Separate values rating for organic and inorganic and organic or inorganic were set up to avoid rating underestimate when inorganic fertilizer is not applied. In this particular case the overall numerical rating is low but the risk of using organic amendment remain the same. Table 7. Interpretation of the P Index

16
Rating P index
Organic &
Inorganic
Organic or
Inorganic
Generalized Interpretation of P Index for the Site
≤ 3.7 ≤ 2.7 LOW potential for P movement from the site. If farming practices are maintained at current level there is a low probability of an adverse impact to waterbodies.
> 3 .7 ≤ 7.7 > 2.7 ≤ 5.5
MEDIUM potential for P movement from the site. The chance for an adverse impact to waterbodies exists. Soil and water conservation practices as well as P management practices should be taken to lessen the risk of P movement and potential water quality degradation.
> 7.7 ≤ 15 > 5.5 ≤ 11
HIGH potential for P movement from the site. The chance of organic material and nutrients getting to waterbodies is likely unless remedial action is taken. Soil and water conservation practices as well as P management plan are necessary to reduce the risk of P movement and water quality degradation.
> 15 > 11
VERY HIGH potential for P movement from the site and an adverse impact on waterbodies. All necessary soil and water conservation practices, plus P management plan must be put in place to avoid the potential for water quality degradation.
For each qualitative rating a description is given for the level of concern that each specifically assessed field has for P loss potential. Some general guidance is given for each qualitative level as to the intensity and type of remedial action or mitigation that would be necessary to reduce P loss risk. Reviewing each individual site characteristic rating will identify whether the cause and severity of the risk warrants management attention. In a field with a Low or Medium vulnerability rating, it may be possible to manage animal manure using a nitrogen-based budget to determine manure application rates. On sites with a High or Very high rating, it may be desirable to manage animal manure based a phosphorus budget. When this occurs, manure application rate should be planned as a function of estimated phosphorus uptake in harvested plant biomass for the plant growing season or entire crop rotation. The application rate should be reduced as available soil P levels increase. Phosphorus may be applied at rates consistent with Table 8. Table 8. Application rate according with P Index rating
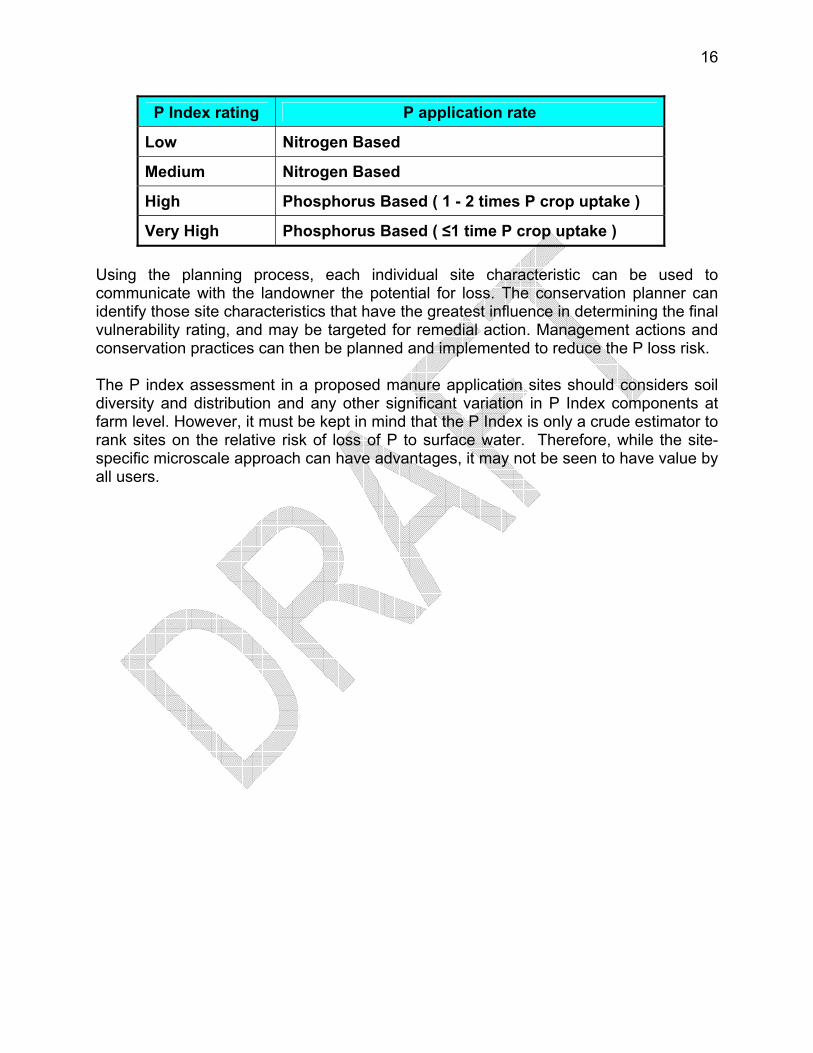
16
P Index rating P application rate
Low Nitrogen Based
Medium Nitrogen Based
High Phosphorus Based ( 1 - 2 times P crop uptake )
Very High Phosphorus Based ( ≤1 time P crop uptake ) Using the planning process, each individual site characteristic can be used to communicate with the landowner the potential for loss. The conservation planner can identify those site characteristics that have the greatest influence in determining the final vulnerability rating, and may be targeted for remedial action. Management actions and conservation practices can then be planned and implemented to reduce the P loss risk. The P index assessment in a proposed manure application sites should considers soil diversity and distribution and any other significant variation in P Index components at farm level. However, it must be kept in mind that the P Index is only a crude estimator to rank sites on the relative risk of loss of P to surface water. Therefore, while the site-specific microscale approach can have advantages, it may not be seen to have value by all users.

17
BEST MANAGEMENT PRACTICES FOR REDUCING SITE VULNERABILITY A best management practice (BMP) is a practice or combination of practices used in a conservation management system to reduce site vulnerability. The table below lists the most common BMP used in the Caribbean Area to prevent nonpoint source pollution of surface water by agricultural P. It also displays the potential environmental effect that each BMP has on site vulnerability. BMP may decrease, increase or have no effects on site conditions. These BMP may minimize P losses from soil to water or improve management practices. BMP and corresponding effects could be used to reevaluate the current conditions to determine what factors are creating the highest levels of concern. Once these factors have been determined, an onsite assessment should be made to evaluate the feasibility of making changes to reduce the vulnerability rating to an acceptable level. In general any practice which reduces soil erosion and runoff and improves nutrient management will reduce the P loss from landscape. This may require several trials and a combination of BMP to achieve the desired level. When site vulnerability cannot be reduced enough to apply animal waste, an alternate site would need to be considered. Table 9. Environmental Effects of Best Management Practices on P index Parameters
Environmental Effects on P index Parameters Best Management Practices Soil
Erosion Runoff Surface Water
Soil Test P Level
P Application
Ratio
P Application
Method Conservation Cover - - - 0 - 0 Conservation Crop Rotation - - 0 - - 0 Contour Farming - - 0 0 0 0 Diversion - - 0 0 0 0 Field Border - - - 0 0 0 Filter Strip - - - 0 0 0 Grassed Waterway - - - 0 0 0 Hillside Ditch - - 0 0 0 0 Irrigation Water Management - - 0 - 0 - Land Mechanical Treatment - - 0 0 0 - Manure Transfer 0 - 0 0 0 - Nutrient Management 0 0 - - - - Pasture and Hayland Planting - - 0 - - 0 Residue Management, No Till - - 0 0 - 0 Residue Management, Mulch Till - - 0 0 - 0 Residue Management, Seasonal - - 0 0 - 0 Riparian Forest Buffer - - - 0 0 0 Roof Runoff Management - - - 0 0 0 Use Exclusion 0 0 - 0 0 0 Waste Utilization 0 0 - - - - Legend: + Increase effect; - Decrease effect; 0 - No effect

18
PROCEDURE TO CALCULATE PHOSPHORUS INDEX Step 1 – Inventory procedure and tools The following is a list of all the information and procedure needed to make determination, along with where that information is found. A. Field observation and measurements • Identify predominant soil type in field from soil survey. • Measure distance to surface water and buffer width and percent cover stand. • Measure slope length and steepness and estimate cover stand percent in field. • List existing best management practices, including conservation practices that meet
NRCS standards. • Identify all major resources problems affecting nutrient management. B. Farm operator data • Soil test report • Manure test report • Amount and type of fertilizer and manure applied • Application method and timing of fertilizer and manure applied • Crop rotation C. Tools • National Agronomy Manual • P Index Worksheets • RUSLE Handbook of the Caribbean Area • Field Office Technical Guide Sections I - V • Agricultural Waste Management Manual • Soil Survey Step 2 - Determine the value for each field feature and management This step serves as a basic guide to arrange and use the information collected to determine the P index factor. The procedure is separated into transport and site source characteristics.

19
A. Transport Characteristics • Forecast Soil Erosion using RUSLE. • Determine Runoff Class using the table provided or selects the value from the
database in the Appendix. • Use measures distance to surface water and buffer width distance and percent
cover stand to determine Distance to Surface Water and Buffer Strip Width. B. Site Source Characteristics • Use soil test report to determine Soil Test P Level factor. Step 3 – P index Rating • Use the Caribbean Area P index Assessment Worksheets (Table 3) to find the
class value rating that best describes the site condition determined. • Score the rating for each factor in the field no. column of the Caribbean Area P
Index Rating Worksheet in the Appendix 2. • Compute the P index following the procedure describes in the Caribbean Area P
Index Rating Worksheet. • Assess overall rating using tables 7 and 8. • Recommend BMP to reduce P loss using Table 9. Environmental Effects of Best
Management Practices on P index Parameters.

20
Appendix 1. Phosphorus Index Transport Data by Soil Survey
Arecibo Soil Survey P index Transport Data
Map Symbol Soil Series
Phosphorus Sorption
Capability Group
Soil Test P 1 Level
Groups
Runoff Class
AaC Aceitunas H Soil Group1 M AcC Aceitunas VH Soil Group1 M AdF2 Adjuntas H Soil Group1 H AgC Algarrobo VL Soil Group2 L AlB Almirante M Soil Group1 L AlC Almirante M Soil Group1 M AmB Almirante M Soil Group1 L AmC Almirante M Soil Group1 M AnB Almirante H Soil Group1 L AnC Almirante H Soil Group1 M AoD2 Alonso H Soil Group1 M AoE2 Alonso H Soil Group1 H AoF2 Alonso H Soil Group1 H ArC Arecibo VL Soil Group2 VL Ba Bajura M Soil Group2 L BcB Bayamon M Soil Group1 L BcC Bayamon M Soil Group1 M BsB Bayamon M Soil Group1 L BsC Bayamon M Soil Group1 M ByB Bayamon H Soil Group1 L ByC Bayamon H Soil Group1 M CaF Caguabo M Soil Group2 H CbF Caguabo M Soil Group2 H CcD Caracoles L Soil Group2 M CcE Caracoles L Soil Group2 H CeC Carrizales VL Soil Group2 L Cf Catano VL Soil Group2 N ClD2 Colinas H Soil Group3 M ClE2 Colinas H Soil Group3 H ClF2 Colinas H Soil Group3 H CmF2 Colinas H Soil Group3 H Cn Coloso M Soil Group2 N CoE Consejo M Soil Group1 H
1 Soils Group 1: Strongly Acid High P Sorption Soils Group 2: Moderate and Slightly Acids Low to Medium P Sorption Soils Group 3: Non Acid Low to Medium P Sorption

21
Arecibo Soil Survey P index Transport Data
Map Symbol Soil Series
Phosphorus Sorption
Capability Group
Soil Test P 1 Level
Groups
Runoff Class
CoF Consejo M Soil Group1 H CpE Consumo M Soil Group1 H CpF Consumo M Soil Group1 H CrC Corozal M Soil Group1 H CsC Corozo VL Soil Group2 L CtB Coto H Soil Group1 L CtC Coto H Soil Group1 M CuF Cuchillas M Soil Group1 H CvF Cuchillas M Soil Group1 H DaD2 Daguey VH Soil Group1 M EaB Espinosa L Soil Group1 L EaC Espinosa L Soil Group1 M EbB Espinosa M Soil Group1 L EbC Espinosa M Soil Group1 M EcB Espinosa M Soil Group1 L EcC Espinosa M Soil Group1 M Ga Garrochales VL Soil Group2 N GeC Guerrero VL Soil Group2 L HmE Humatas H Soil Group1 H HmF Humatas H Soil Group1 H InD Ingenio M Soil Group1 M InE Ingenio M Soil Group1 H IsC Islote M Soil Group2 L Ja Jareales M Soil Group2 N JoC Jobos M Soil Group2 L JuD2 Juncal M Soil Group2 M JuE2 Juncal M Soil Group2 H LME Los Guineos H Soil Group1 H LME Maricao H Soil Group1 H LcE2 Lirios M Soil Group1 H LcF2 Lirios M Soil Group1 H LgD Los Guineos H Soil Group1 M LgE Los Guineos H Soil Group1 H LgF Los Guineos H Soil Group1 H MaF2 Maraguez M Soil Group2 H McF Maricao M Soil Group1 H
1 Soils Group 1: Strongly Acid High P Sorption Soils Group 2: Moderate and Slightly Acids Low to Medium P Sorption Soils Group 3: Non Acid Low to Medium P Sorption

22
Arecibo Soil Survey P index Transport Data
Map Symbol Soil Series
Phosphorus Sorption
Capability Group
Soil Test P 1 Level
Groups
Runoff Class
MmF Matanzas VH Soil Group1 L MnB Matanzas VH Soil Group1 L MoC2 Moca M Soil Group1 M MoD2 Moca M Soil Group1 M MoE2 Moca M Soil Group1 H MpF2 Morado M Soil Group2 H MuE Mucara M Soil Group2 H MuF Mucara M Soil Group2 H NaD Naranjo L Soil Group2 H NaE Naranjo L Soil Group2 VH NaF Naranjo L Soil Group 2 VH Pa Palmar VL Soil Group2 N PeF Pellejas M Soil Group2 M PhC2 Perchas M Soil Group2 H PhD2 Perchas M Soil Group2 H Re Reilly L Soil Group2 N RlC Rio Lajas VL Soil Group2 VL RsF San German H Soil Group3 M RtF Tanama M Soil Group3 H SaB Sabana Seca M Soil Group2 M SgD San German H Soil Group3 L SgF San German H Soil Group3 M SmF San Sebastian VH Soil Group3 H SnC Santa Clara M Soil Group3 L SoC Soller M Soil Group3 M SoD Soller M Soil Group3 M SoF Soller M Soil Group3 H SpD Soller M Soil Group3 M SpF Soller M Soil Group3 H SrF Soller M Soil Group3 H TaB Tanama M Soil Group3 L TaC2 Tanama M Soil Group3 M TaD2 Tanama M Soil Group3 M Tb Tiburones VL Soil Group2 N To Toa M Soil Group2 N VaB Vega Alta M Soil Group2 L
1 Soils Group 1: Strongly Acid High P Sorption Soils Group 2: Moderate and Slightly Acids Low to Medium P Sorption Soils Group 3: Non Acid Low to Medium P Sorption

23
Arecibo Soil Survey P index Transport Data
Map Symbol Soil Series
Phosphorus Sorption
Capability Group
Soil Test P 1 Level
Groups
Runoff Class
VaC2 Vega Alta M Soil Group2 M VcB Vega Alta M Soil Group2 L VcC2 Vega Alta M Soil Group2 M VeB Vega Baja M Soil Group2 M Vg Vigia VL Soil Group2 N Vm Vivi L Soil Group2 N VoC2 Voladora VH Soil Group1 M VoD2 Voladora VH Soil Group1 M VoE2 Voladora VH Soil Group1 H
1Soils Group 1: Strongly Acid High P Sorption Soils Group 2: Moderate and Slightly Acids Low to Medium P Sorption
Soils Group 3: Non Acid Low to Medium P Sorption

24
Humacao Soil Survey P index Transport Data
Map Symbol Soil Series
Phosphorus Sorption
Capability Group
Soil Test P 1 Level
Groups
Runoff Class
AcC Aceitunas H Soil Group1 M Ad Aguadilla VL Soil Group2 N Ag Aguadilla L Soil Group2 N AmB Amelia M Soil Group1 L AmC2 Amelia M Soil Group1 M An Arenales L Soil Group2 N Ar Arenales L Soil Group2 N Ba Bajura M Soil Group2 L Bc Bajura M Soil Group2 L CbD2 Caguabo M Soil Group2 M CbF2 Caguabo M Soil Group 2 H CdB Candelero L Soil Group2 VL CdC2 Candelero L Soil Group2 L Ce Cartagena M Soil Group3 L Cf Catano VL Soil Group2 N CgC2 Cayagua L Soil Group2 M CgD2 Cayagua L Soil Group2 M ClB Coamo M Soil Group3 M ClC Coamo M Soil Group3 H Co Coloso M Soil Group2 L Cr Coloso M Soil Group2 L Cs Corcega L Soil Group2 N DaC Daguao
Variant M Soil Group2 M
DcE2 Daguao M Soil Group2 H DeC2 Descalabrado M Soil Group2 M DeE2 Descalabrado M Soil Group2 H DgF2 Descalabrado M Soil Group2 H DgF2 Guayama M Soil Group2 H DrF Descalabrado M Soil Group2 H FaC Fajardo M Soil Group2 H FaC2 Fajardo M Soil Group2 H Fo Fortuna M Soil Group2 L FrA Fraternidad L Soil Group3 L FrB Fraternidad L Soil Group3 M
1 Soils Group 1: Strongly Acid High P Sorption Soils Group 2: Moderate and Slightly Acids Low to Medium P Sorption
Soils Group 3: Non Acid Low to Medium P Sorption

25
Humacao Soil Survey P index Transport Data
Map Symbol Soil Series
Phosphorus Sorption
Capability Group
Soil Test P 1 Level
Groups
Runoff Class
GvF Guayabota M Soil Group2 H GvF Ciales M Soil Group2 H GvF Picacho M Soil Group2 H GyC2 Guayama
Variant M Soil Group2 M
HmB Humacao L Soil Group2 VL HtE2 Humatas H Soil Group1 H HtF2 Humatas H Soil Group1 H HuF Humatas H Soil Group1 H InE2 Ingenio M Soil Group1 H JaB Jacana M Soil Group3 L JaC2 Jacana M Soil Group 3 M JgE2 Jagueyes M Soil Group2 M JuC Junquitos M Soil Group2 M LeE2 Limones H Soil Group1 H LoC2 Lirios M Soil Group1 M LrE2 Lirios M Soil Group1 H LsD Los Guineos M Soil Group1 M LsE2 Los Guineos M Soil Group1 H LsF2 Los Guineos M Soil Group1 H LyF Los Guineos M Soil Group1 H LyF Yunque M Soil Group2 H MaB Mabi L Soil Group2 M MaC2 Mabi L Soil Group2 H MaD2 Mabi L Soil Group2 H McA Machete M Soil Group2 N McB Machete M Soil Group 2 VL Me Maunabo M Soil Group2 L MlC Mayo L Soil Group2 M MrB Meros VL Soil Group2 L MuD2 Mucara M Soil Group2 L MuE2 Mucara M Soil Group2 H NaE2 Naranjito M Soil Group1 H NaF2 Naranjito M Soil Group1 H PaE2 Pandura L Soil Group2 M PaF2 Pandura L Soil Group2 M
1 Soils Group 1: Strongly Acid High P Sorption Soils Group 2: Moderate and Slightly Acids Low to Medium P Sorption Soils Group 3: Non Acid Low to Medium P Sorption

26
Humacao Soil Survey P index Transport Data
Map Symbol Soil Series
Phosphorus Sorption
Capability Group
Soil Test P 1 Level
Groups
Runoff Class
PdF Pandura L Soil Group2 M PeC2 Parcelas M Soil Group2 M PlB Paso Seco M Soil Group2 M PmD2 Patillas M Soil Group2 M PmE2 Patillas M Soil Group2 H Po Poncena M Soil Group 3 L PrC2 Pozo Blanco H Soil Group3 M Re Reilly L Soil Group2 N Rp Reparada M Soil Group2 N RrB Rio Arriba M Soil Group2 L RrC2 Rio Arriba M Soil Group2 M SaE2 Sabana M Soil Group2 H SaF2 Sabana M Soil Group2 H Ta Talante M Soil Group2 N TeE Teja L Soil Group2 M Tt Toa M Soil Group2 N UpF Utuado M Soil Group2 H UpF Picacho M Soil Group2 H Va Vayas M Soil Group3 N Vc Vayas M Soil Group3 N VeB Vega Alta M Soil Group 2 L VeC Vega Alta M Soil Group2 M VgA Vega Baja M Soil Group2 L VlC Via M Soil Group2 M VmC Vieques L Soil Group3 L VmE2 Vieques L Soil Group3 M Vs Vives M Soil Group2 N VvA Vives M Soil Group2 N VvB Vives M Soil Group3 L Vw Vivi L Soil Group2 N YuF2 Yunes M Soil Group2 H 1 Soils Group 1: Strongly Acid High P Sorption
Soils Group 2: Moderate and Slightly Acids Low to Medium P Sorption Soils Group 3: Non Acid Low to Medium P Sorption

27
Lajas Soil Survey P index Transport Data
Map Symbol Soil Series
Phosphorus Sorption
Capability Group
Soil Test P 1 Level
Groups
Runoff Class
AcD Aguilita VH Soil Group3 M AcE Aguilita VH Soil Group3 H Ag Aguirre M Soil Group3 M AmB Amelia M Soil Group3 L AmB Maguayo* M Soil Group3 L AmC2 Amelia M Soil Group3 M AmC2 Maguayo* M Soil Group3 M Ao Amelia M Soil Group3 L AsB Bahia VL Soil Group3 VL Ca Cartagena M Soil Group3 L Cc Cartagena
Variant M Soil Group3 L
DeC Descalabrado M Soil Group3 M DeD Descalabrado M Soil Group3 M DeF Descalabrado M Soil Group3 H Fe Fe M Soil Group3 M FrA Fraternidad L Soil Group3 L FrB Fraternidad L Soil Group3 M Ft Fraternidad L Soil Group3 L FvA Fraternidad L Soil Group3 L FvB Fraternidad L Soil Group 3 M Gc Guanica L Soil Group3 M Gf Guayabo VL Soil Group3 N GuD Guayama M Soil Group3 M GuF Guayama M Soil Group3 H JaB Jacana M Soil Group3 L JaC Jacana M Soil Group3 M JaC2 Jacana M Soil Group3 M JaD2 Jacana M Soil Group3 M JcB Jacana M Soil Group3 L JcC Jacana M Soil Group3 M MaD2 Mariana M Soil Group3 L MaE2 Mariana M Soil Group3 M PaA Palmarejo L Soil Group3 N PaB Palmarejo L Soil Group3 L PaC2 Palmarejo L Soil Group3 M
1 Soils Group 1: Strongly Acid High P Sorption Soils Group 2: Moderate and Slightly Acids Low to Medium P Sorption
Soils Group 3: Non Acid Low to Medium P Sorption

28
Lajas Soil Survey P index Transport Data
Map Symbol Soil Series
Phosphorus Sorption
Capability Group
Soil Test P 1 Level
Groups
Runoff Class
PcB Poncena M Soil Group3 M PcC2 Poncena M Soil Group3 H PoA Pozo Blanco M Soil Group3 L PzB Pozo Blanco H Soil Group3 L PzC Pozo Blanco H Soil Group3 M PzD Pozo Blanco H Soil Group3 M Sa San Anton M Soil Group3 N Sc San Anton M Soil Group3 N Se San Anton
Variant M Soil Group3 N
SgD San German M Soil Group3 L SgF San German M Soil Group3 M SmE San German H Soil Group3 M Sn Santa Isabel L Soil Group3 M SoA Sosa VL Soil Group3 N SsB Sosa M Soil Group3 VL SsD2 Sosa M Soil Group3 L Tc Teresa M Soil Group3 N Va Vayas M Soil Group3 N
* Complex component
1 Soils Group 1: Strongly Acid High P Sorption Soils Group 2: Moderate and Slightly Acids Low to Medium P Sorption
Soils Group 3: Non Acid Low to Medium P Sorption

29
Mayagüez Soil Survey P index Transport Data
Map Symbol Soil Series
Phosphorus Sorption
Capability Group
Soil Test P 1 Level
Groups
Runoff Class
AaC2 Aceitunas VH Soil Group1 M AbC2 Aceitunas H Soil Group1 M AcD Aguilita VH Soil Group3 M AcE Aguilita VH Soil Group3 H AdE2 Aibonito VH Soil Group1 H AoD Anones H Soil Group1 M AoE2 Anones H Soil Group1 H AoF2 Anones H Soil Group1 H Ba Bajura M Soil Group2 L BcB Bejucos H Soil Group2 L BeB Bejucos M Soil Group2 VL CaC Cabo Rojo M Soil Group1 M CaC2 Cabo Rojo M Soil Group1 M CbF2 Caguabo M Soil Group2 H CcB Camaguey L Soil Group2 H Cd Catano VL Soil Group2 N Ce Catano H Soil Group2 L CfC2 Cidral M Soil Group1 M ClD Colinas H Soil Group 3 M ClE Colinas H Soil Group3 H ClF2 Colinas H Soil Group3 H CmD Colinas H Soil Group3 M CmE Colinas H Soil Group3 H Cn Coloso M Soil Group2 N CoE Consumo M Soil Group1 H CoF2 Consumo M Soil Group1 H Cr Corcega M Soil Group2 N CtB2 Cotito H Soil Group1 L CuB2 Coto H Soil Group1 L CuC2 Coto H Soil Group1 M CvB Coto M Soil Group1 L CwF Cuchillas H DaD2 Daguey VH Soil Group1 M DaE2 Daguey VH Soil Group1 H
1 Soils Group 1: Strongly Acid High P Sorption Soils Group 2: Moderate and Slightly Acids Low to Medium P Sorption
Soils Group 3: Non Acid Low to Medium P Sorption

30
Mayagüez Soil Survey P index Transport Data
Map Symbol Soil Series
Phosphorus Sorption
Capability Group
Soil Test P 1 Level
Groups
Runoff Class
DcD2 Delicias VH Soil Group1 M DeC Descalabrado M Soil Group2 M DeD Descalabrado M Soil Group2 M DeF Descalabrado M Soil Group2 H Du Dique L Soil Group2 N Es Espinal VL Soil Group2 N GnC Guanajibo M Soil Group2 L GoC Guanajibo M Soil Group2 L GuB Guerrero VL Soil Group2 N HmD2 Humatas H Soil Group1 M HmE2 Humatas H Soil Group1 H HmF2 Humatas H Soil Group1 H HuE Humatas H Soil Group1 H Ig Igualdad M Soil Group2 L JaC Jacana M Soil Group3 M Jd Jaucas VL Soil Group2 N JoB Jobos M Soil Group2 VL JuD2 Juncal M Soil Group 2 M LaB2 Lares M Soil Group1 L LaD2 Lares M Soil Group1 M LuD2 Los Guineos H Soil Group1 M LuF2 Los Guineos H Soil Group1 H MaB Mabi L Soil Group2 M MaC2 Mabi L Soil Group2 H McF2 Malaya M Soil Group2 H MdB Maleza VL Soil Group2 VL Mh Mani M Soil Group2 N Mn Mani M Soil Group2 N MoD2 Maresua M Soil Group2 L MoF2 Maresua M Soil Group2 M MpD2 Mariana M Soil Group2 L MpE2 Mariana M Soil Group2 M MrF2 Maricao M Soil Group1 H MsB Matanzas VH Soil Group1 L MtB Matanzas VH Soil Group1 L MuC2 Moca M Soil Group1 M
1 Soils Group 1: Strongly Acid High P Sorption Soils Group 2: Moderate and Slightly Acids Low to Medium P Sorption
Soils Group 3: Non Acid Low to Medium P Sorption

31
Mayagüez Soil Survey P index Transport Data
Map Symbol Soil Series
Phosphorus Sorption
Capability Group
Soil Test P 1 Level
Groups
Runoff Class
MuD2 Moca M Soil Group1 M MuD3 Moca M Soil Group1 M MuE3 Moca M Soil Group1 H MvC Montegrande L Soil Group2 M MwD2 Morado M Soil Group2 M MwE2 Morado M Soil Group2 H MwF2 Morado M Soil Group2 H MxC Mucara M Soil Group2 M MxD2 Mucara M Soil Group2 M MxE2 Mucara M Soil Group2 H MxF2 Mucara M Soil Group2 H NaD Naranjo L Soil Group3 H NcD2 Nipe VH Soil Group1 L PaC2 Palmarejo M Soil Group2 M PeD2 Perchas M Soil Group2 H PlE2 Plata M Soil Group2 H PlF2 Plata M Soil Group2 H QuD2 Quebrada M Soil Group2 M QuE2 Quebrada M Soil Group2 H QuF2 Quebrada M Soil Group2 H Re Reilly L Soil Group2 N RlB Rio Lajas VL Soil Group2 N RpC2 Rio Piedras H Soil Group1 M RpD2 Rio Piedras H Soil Group1 M RsD2 Rosario VH Soil Group1 M RsE2 Rosario VH Soil Group1 H RsF2 Rosario VH Soil Group1 H SaD San German H Soil Group3 L SaE San German H Soil Group3 M ScB San German M Soil Group3 VL SdF2 San Sebastian VH Soil Group3 H SeB Santa Clara M Soil Group2 L SmE2 Santa Marta VH Soil Group2 H Sn Santoni M Soil Group2 L SrD Soller M Soil Group3 M SrE Soller M Soil Group3 H
1 Soils Group 1: Strongly Acid High P Sorption Soils Group 2: Moderate and Slightly Acids Low to Medium P Sorption
Soils Group 3: Non Acid Low to Medium P Sorption

32
Mayagüez Soil Survey P index Transport Data
Map Symbol Soil Series
Phosphorus Sorption
Capability Group
Soil Test P 1 Level
Groups
Runoff Class
SsD2 Soller M Soil Group3 M SsE2 Soller M Soil Group3 H StB Soller M Soil Group3 L StC Soller M Soil Group3 M StD Soller M Soil Group3 M StE Soller M Soil Group3 H Ta Talante L Soil Group2 N TcB2 Tanama M Soil Group3 L TcC2 Tanama M Soil Group3 M TcD2 Tanama M Soil Group3 M TcE2 Tanama M Soil Group3 H ToA Toa M Soil Group3 N Ts Toa M Soil Group3 N VoD2 Voladora VH Soil Group1 M VoE2 Voladora VH Soil Group1 H VrC2 Voladora VH Soil Group1 M
1 Soils Group 1: Strongly Acid High P Sorption Soils Group 2: Moderate and Slightly Acids Low to Medium P Sorption
Soils Group 3: Non Acid Low to Medium P Sorption

33
Ponce Soil Survey P index Transport Data
Map Symbol Soil Series
Phosphorus Sorption
Capability Group
Soil Test P 1 Level
Groups
Runoff Class
AaF2 Adjuntas H Soil Group1 H AgD Aguilita H Soil Group3 M AgF Aguilita H Soil Group3 H AhF Aguilita H Soil Group3 H AnE2 Alonso H Soil Group1 H AnF2 Alonso H Soil Group1 H CbF2 Caguabo M Soil Group2 H CdF Caguabo M Soil Group2 H CoD Callabo M Soil Group2 M CoE Callabo M Soil Group2 H CoF2 Callabo M Soil Group2 H Cr Cintrona M Soil Group3 M Ct Constancia M Soil Group3 M CuF2 Consumo M Soil Group1 H Cx Cortada M Soil Group3 N CyB Cuyon L Soil Group3 N DaD Daguey VH Soil Group1 M EnC Ensenada M Soil Group3 M Fe Fe M Soil Group3 M FtB Fraternidad L Soil Group3 M FtC2 Fraternidad L Soil Group3 H GoF Guanabano M Soil Group3 H HmE2 Humatas H Soil Group1 H HmF2 Humatas H Soil Group1 H HxF Humatas H Soil Group1 H Jg Jacaguas M Soil Group3 N JnC Jacana M Soil Group3 M JzD Juana Diaz M Soil Group2 M JzE Juana Diaz M Soil Group2 H
1 Soils Group 1: Strongly Acid High P Sorption Soils Group 2: Moderate and Slightly Acids Low to Medium P Sorption
Soils Group 3: Non Acid Low to Medium P Sorption

34
Ponce Soil Survey P index Transport Data
Map Symbol Soil Series
Phosphorus Sorption
Capability Group
Soil Test P 1 Level
Groups
Runoff Class
LeC Lares M Soil Group1 M LmF2 Lirios M Soil Group1 H LnB Llanos M Soil Group2 L LnC2 Llanos M Soil Group2 M LuE Los Guineos H Soil Group1 H LuF Los Guineos H Soil Group1 H LyFX Los Guineos H Soil Group1 H LyFX Maricao H Soil Group1 H LnB Llanos M Soil Group2 L LnC2 Llanos M Soil Group2 M LuE Los Guineos H Soil Group1 H LuF Los Guineos H Soil Group1 H LyFX Los Guineos H Soil Group1 H LyFX Maricao H Soil Group1 H LzFX Los Guineos H Soil Group1 H LzFX Maricao H Soil Group1 H Ma Machuelo H Soil Group2 L MeF2 Maraguez M Soil Group2 H MkF2 Maricao M Soil Group1 H Mr Meros VL Soil Group2 N MsC Montegrande L Soil Group2 M MtE2 Morado M Soil Group2 H MtF2 Morado M Soil Group2 H MuD2 Mucara M Soil Group2 M MuE2 Mucara M Soil Group2 H MuF2 Mucara M Soil Group2 H PaB Paso Seco M Soil Group3 M PeF2 Pellejas M Soil Group2 M QeD2 Quebrada M Soil Group2 M QeE2 Quebrada M Soil Group2 H QeF2 Quebrada M Soil Group2 H Re Reilly L Soil Group2 N Sa San Anton M Soil Group3 N Se Serrano VL Soil Group2 N
1 Soils Group 1: Strongly Acid High P Sorption Soils Group 2: Moderate and Slightly Acids Low to Medium P Sorption
Soils Group 3: Non Acid Low to Medium P Sorption

35
Ponce Soil Survey P index Transport Data
Map Symbol Soil Series
Phosphorus Sorption
Capability Group
Soil Test P 1 Level
Groups
Runoff Class
Te Teresa M Soil Group3 N To Toa M Soil Group3 N TuF Tuque M Soil Group3 M YcB Yauco H Soil Group3 L YcC Yauco H Soil Group3 M
1 Soils Group 1: Strongly Acid High P Sorption Soils Group 2: Moderate and Slightly Acids Low to Medium P Sorption
Soils Group 3: Non Acid Low to Medium P Sorption

36
San Juan Soil Survey P index Transport Data Map Symbol Soil Series Phosphorus
Sorption Capability
Group
Soil Test P 1 Level
Groups
Runoff Class
AaB Aceitunas VH Soil Group1 L AaC Aceitunas VH Soil Group1 M AbD Aibonito VH Soil Group1 M AbE Aibonito VH Soil Group1 H AmB Almirante H Soil Group1 L AmC Almirante H Soil Group1 M Ba Bajura M Soil Group2 L BmB Bayamon H Soil Group1 L CaE Caguabo M Soil Group2 H CaF Caguabo M Soil Group2 H CbF Caguabo M Soil Group2 H Ce Candelero L Soil Group2 L ClC Catalina VH Soil Group1 L Cn Catano VL Soil Group2 N Co Cayagua L Soil Group2 M CrD2 Colinas H Soil Group3 M CrE2 Colinas H Soil Group3 H CrF2 Colinas H Soil Group3 H Cs Coloso M Soil Group2 N CuE Consumo M Soil Group1 H CuF Consumo M Soil Group1 H CzC Corozal M Soil Group1 H DaC Daguey VH Soil Group1 M DaD Daguey VH Soil Group1 M DeF Descalabrado M Soil Group2 H DgF Descalabrado M Soil Group2 H Dm Dique L Soil Group2 L Dr Durados L Soil Group2 N Es Estacion M Soil Group2 L GuF Guayama M Soil Group2 H Hm Humacao L Soil Group2 L HtE Humatas H Soil Group1 H
1 Soils Group 1: Strongly Acid High P Sorption Soils Group 2: Moderate and Slightly Acids Low to Medium P Sorption
Soils Group 3: Non Acid Low to Medium P Sorption

37
San Juan Soil Survey P index Transport Data
Map Symbol Soil Series Phosphorus Sorption
Capability Group
Soil Test P 1 Level
Groups
Runoff Class
HtF Humatas H Soil Group1 H HuF Humatas H Soil Group1 H JaE2 Jagueyes M Soil Group1 M JnD2 Juncal M Soil Group2 M JuC Juncos L Soil Group2 H JuD Juncos L Soil Group2 H LaB Lares M Soil Group1 L LaC2 Lares M Soil Group1 M LmE Limones H Soil Group1 H LmF Limones H Soil Group1 H LoF2 Lirios M Soil Group1 H LsE Los Guineos H Soil Group1 H LsF Los Guineos H Soil Group1 H MaA Mabi L Soil Group2 L MaB Mabi L Soil Group2 M MaC Mabi L Soil Group2 H MlF Malaya M Soil Group2 H MoF Maricao M Soil Group1 H Mp Martin Pena VL Soil Group2 N MsB Matanzas VH Soil Group1 L MtB Montegrande L Soil Group2 L MtC Montegrande L Soil Group2 M MuF2 Morado M Soil Group2 H MxD Mucara M Soil Group2 M MxE Mucara M Soil Group2 H MxF Mucara M Soil Group2 H NaD2 Naranjito M Soil Group1 M NaE2 Naranjito M Soil Group1 H NaF2 Naranjito M Soil Group1 H PaD Pandura L Soil Group2 L PaE Pandura L Soil Group2 M PaF Pandura L Soil Group2 M PeF Pellejas M Soil Group2 M Re Reilly L Soil Group2 N
1 Soils Group 1: Strongly Acid High P Sorption Soils Group 2: Moderate and Slightly Acids Low to Medium P Sorption
Soils Group 3: Non Acid Low to Medium P Sorption

38
San Juan Soil Survey P index Transport Data
Map Symbol Soil Series
Phosphorus Sorption
Capability Group
Soil Test P 1 Level
Groups
Runoff Class
RoB Rio Arriba M Soil Group2 L RoC2 Rio Arriba M Soil Group2 M RpD2 Rio Piedras H Soil Group1 M RpE2 Rio Piedras H Soil Group1 H RpF2 Rio Piedras H Soil Group1 H SaF Sabana M Soil Group2 H ScB Sabana Seca M Soil Group2 H Sm Saladar VL Soil Group2 L SoE Soller M Soil Group3 H SoF Soller M Soil Group3 H TaF Tanama M Soil Group3 H To Toa M Soil Group3 N TrB Torres VL Soil Group2 L VaB Vega Alta M Soil Group1 L VaC2 Vega Alta M Soil Group1 M Vg Vega Baja M Soil Group2 L VkC2 Via M Soil Group2 M Vv Vivi L Soil Group3 N YeE Yunes M Soil Group2 M YeF Yunes M Soil Group2 M
1 Soils Group 1: Strongly Acid High P Sorption Soils Group 2: Moderate and Slightly Acids Low to Medium P Sorption
Soils Group 3: Non Acid Low to Medium P Sorption

39
Appendix 2. Caribbean Area Phosphorus Index Rating Worksheet
Caribbean Area P Index Rating Worksheet Name: Tract no: Farm no : Date: Evaluator : Value Ratings
Field no. _____
Field no. _____
Field no. _____ Field no. _____ Field Features and
Management Parameters
Current Planned Current Planned Current Planned Current Planned
A. Transport Factors
1. Soil Erosion
2. Runoff Class
3. Distance to Surface Water and Buffer Strip Width
Subtotal A Factors = 1 x 2 x 3
B. Site Source Factors
4. Soil Test P
5. Fertilizer P Application Ratio
6. Fertilizer P Application Method and Timing
7. Organic P Ratio
8. Organic P Application Method and Timing
Subtotal B Factors = 5 + 6 + 7 + 8
PI = Subtotal A x Subtotal B

40
P Index Workgroup:
José A Castro, Agronomist USDA – NRCS, Caribbean Area PO Box 364868 San Juan, P.R. 00936 - 4868 Phone: 787 – 766 – 5206 x 226; Fax: 787 – 766 – 5987 E – Mail: [email protected] David Sotomayor, Assistant Professor of Soil Fertility Agronomy and Soils Department UPR – RUM, PO Box 9030 Mayaguez, P.R. 00681 - 9030 Phone: 787 – 832 – 4040 x 3734; Fax: 787 – 265 – 0860 E – Mail: [email protected] Gustavo Martínez, Associate Professor of Soil Chemistry Agronomy and Soils Department PO Box 21360 San Juan, P.R. 00928 Phone: 787 – 767 – 9705 x 2068, 2350; Fax: 787 – 756 – 8329 E – Mail: [email protected] Luis Pérez-Alegría Agricultural and Biosystems Engineering Univ. of Puerto Rico – Mayagüez Puerto Rico 787-832-4040; x3337 [email protected]

41
REFERENCES A Phosphorus Assessment Tool; Technical Note Engineering Series No. 1901; USDA-SCS, South National Technical Center, Ft. Worth, TX. Beinroth, F.H. , 1982. Some highly weathered soils of Puerto Rico, 1. Morphologhy , formation and classification. Geoderma. 27: 261 – 266. Havlin, J.L., Beaton, J.D., Tisdale, S.L. , and W.L. Nelson. 1999. Soil Fertility and Fertilizers. Jones, R.C., Hudnall, W.H., and Saki, W.S. Some highly weathered soils of Puerto Rico, 1. Morphologhy , formation and classification. Geoderma. 27: 75 – 137. Lemunyon, J.L., & Gilbert, R.G. 1993. The concept and need for a phosphorus assessment tool. J. Prod. Agric. 6:483-486. Muñiz – Torres, O. 1992. Uso de Fertilizantes en Puerto Rico: Enfoques prácticos. Guía Técnica. SEA – UPR – RUM. Muñoz, M.A., Peña, L., Figueroa, T., and Hallorans J. M. O. 1992. Comparison of available P extracting methods for selected Puerto Rican soils. Proc. Plant Stress in Trop. Environ. 67-70. Prentice Hall Inc.Upper Saddle River, N.J. Sims. J.T. 2000. Soil test Phosphorus: Bray and Kurtz P. 1 P. 13 – 14; in G.M. Pierzinsky Ed., Methods of Phosphorus analysis for soils, sediments, residuals, and waters. Southern Cooperative Series Bulletin no. 396. Sims. J.T. 2000. Soil test Phosphorus: Olsen P. P. 20 – 21; in G.M. Pierzinsky Ed., Methods of Phosphorus analysis for soils, sediments, residuals, and waters. Southern Cooperative Series Bulletin no. 396. Snyder, C.S., Sharpley, A. N., Bruulsema, T. W., Beegle, D.B. Site-specific Use of the Environmental Phosphorus Index concept, Site-Specific Management Guidelines-SSMG-1; Potash & Phosphate Institute. Sotomayor-Ramírez, D., Martínez, G. A., and Olivieri, L. J. 2000. Phosphorus status of stream - waters in Puerto Rico: 1989-1997. Proceedings Programa Cooperativo para el Mejoramiento de Cultivos y Animales. mayo de 2000. Gburek W.J. , Sharpley, A.N. , Heathwaite, L. , and Folmar G. J. 2000. Phosphorus Management at the Watershed Scale: A modification of the Phosphorus Index. J. Environmental Qual. 29:130-144. USDA -NRCS. 2000. Caribbean Area Field Office Technical Guide, Section IV