CARGO AIRCRAFT AND SPACECRAFT FORWARD RESTRAINT …"Air Cargo k.estraint Criteria," and ASD...
91
FO FE"2 R;, M ct. ASD-TR-76-30 CARGO AIRCRAFT AND SPACECRAFT FORWARD RESTRAINT CRITERIA DECEMBER 1977 S Q. TECHNICAL REPORT ASD-TR-76-30 $i C Final Report for July 1976 - December 1977 C.48 Approved for public release; distribution unlimited. DEPUTY FOR ENGINEERING AERONAUTICAL SYSTEMS DIVISION AIR FORCE SYSTEMS COMMAND WRIGHT-PATTERSON AIR FORCE BASE, OHIO 45433 78 06 07 038
Transcript of CARGO AIRCRAFT AND SPACECRAFT FORWARD RESTRAINT …"Air Cargo k.estraint Criteria," and ASD...
FO FE"2 R;, M
ct. ASD-TR-76-30
CARGO AIRCRAFT AND SPACECRAFTFORWARD RESTRAINT CRITERIA
DECEMBER 1977 S
Q. TECHNICAL REPORT ASD-TR-76-30$�i C Final Report for July 1976 - December 1977
C.48 Approved for public release; distribution unlimited.
DEPUTY FOR ENGINEERINGAERONAUTICAL SYSTEMS DIVISIONAIR FORCE SYSTEMS COMMANDWRIGHT-PATTERSON AIR FORCE BASE, OHIO 45433
78 06 07 038
IZI
.NOTICE
*When Government drawings, specifications, or other data are used for any.purpose other than in connection with a definitely related Government pro-curement operation, the United States Government thereby incurs no respon-sibility nor any obligation whatsoever; and the fact that the governmentmay have formulated, furnished, or in any way supplied the said drawings,specifications, or other data, is not to be regarded by implication orotherwise as in any manner licensing the holder or any other person or cor-portation, or conveying any rights or permission to manufacture, use or sellany patented invention that may in any way be related thereto.
This report has been reviewed by the Information Office (10) and is release-able to the National Technical Information Service (NTIS). At NTIS, it willbe available to the general public, including foreign nations.
-This technical report has been reviewed and is approved for publication.
Joseph L. WeingartenProject Engineer
FOR THE COMMANDER
-William E. ThurmanColonei USAFDeputy for Engineering
Copies of this report should not be returned unless return is required bysecurity considerations, contractual obligations, or notice on a specificdocument.AIR FORCEI56780125 May 1978 - 300
IT - -Y
_________IINi_ A_ _TI__T _SECURITY CLASSIFICATION OFýTHIS PAGE (When Doat. Entered)
SREPORT DOCUMENTATION PAGE READ INSTRUCTIONSR DI BEFORE COMPLETING FORM.• REPRT'N R. GOVT ACCE:SION NO. 3. RECIPIENT'S CATALOG NUMBER
ATITLE (and ubttel • ,TYPE OF REPORT & PERIOD CO 0-• ~ ~~~~~ I " '. . i INA" JEE'P " •
1' . CARGO AIRCRAFT AND SPACECRAFT U UN UR76X•-EC V#77,TI ORWARD RESTRAINT CRITERIA, 6-. PERFORMING ORG. REPORT NU Eq
7. • THoR.. .... _., CONTRACI OR GRANT NUMBER(s)
SVj/ ... I L.9. PER-FORMING ORGANIZATION NAME AND ADDRESS 10. PROGRAM ELEMENT. PROJECT. TASK
AREA & WORK UNIT NUMBERS
DEPUTY FOR ENGINEERING -AERONAUTICAL SYSTEMS DIVISION AFSC D156WRIGHT-PATTERSON AFB, OHIO 45433
"II. CONTROLLING OFFICE NAME AND ADDRESS I • aOPRT DATEASD/ENO QE11 UW W
WRIGHT-PATTERSON AFB, OHIO 45433 I4u- RA
14. MONITORING AGENCY NAME & ADDRESS(If different from Controlling Office) , J B 13.X..IJ .. of this report)
15a. DECL ASSI FICATION/DOWNGRADINGSCHEDULE
16. DISTRIBUTION STATEMENT (of this Report)
APPROVED FOR PUBLIC RELEASE, DISTRIBUTION UNLIMITED
'7. DISTRIBUTION STATEMENT (of the abstract entered in Block 20, If different from Report)
18. SUPPLEMENTARY NOTES
19. KEY WORDS (Continue on reverse aide if necessary end Identify by block number)
FORWARD RESTRAINT FOR AIRCRAFT; CARGO/SPACECRAFT RESTRAINT;AIRCRAFT/SPACECRAFT CRASH FORCES; AIRCRAFT FORWARD CRASH FORCES;AIRCRAFT FORWARD RESTRAINT CRITERIA; CLASS II MODIFICATION,AIRCRAFT MODIFICATION
20. STRACT (Continue on reverse do If necessary end Identify by block number)
-iRhis investigation was primarily conducted to review probability projec-tions of crashes of Air Force cargo aircraft as developed in 1971. The 1971effort resulted in considerable changes to the air cargo operations. This in-cluded a lowering of restraint criteria to 3Gs with an auxiliary 9G net system.The objective of this effort was to determine if further reductions could bemade through removal of the auxiliary 9G net, in addition to both aircraft andspacecraft cargo restraint criteria. Restraint and aircraft modificdtions were
DDI JAN 7 1473 EDITION OF IS OBSOLETE TE lIrINASSIFIED"ITY CL FITION OFOS (*hen
Cc
IINC.I ASSIFIEDSECURIT' CLASSIFICATION OF THIS PAGE('WI*n Date Enfered)
'BLOCK 20.
also examined.
This effort viewed probabilities, based on the original data fromJanuary 1960 to July 1971, and an expanded base to July 1976 for a totalof 40.4 million hours. Further, the original study viewed only majoraccidents; minor accidents have been added to this review.
Additionally, a review was made of previous efforts in this area todetermine the origin and rationale for the various criteria levels.
This review showed that the current criteria is based on crash testsi conducted on C-46 aircraft in 1949.
"•. The probabilities developed in 1971 were conservative relative toactual occurrence over the past few years. Further, new probabilitieswere developed that show removal of the barrier net is feasible andappropriate changes are recommended to the current criteria. Commercialexperience with barrier nets was also investigated and accidents wherebarriers were impacted are detailed.
IiII
UNCLASSIFIEDSECURITY CLASSIFICATION OF THIS PAGE(141ien Data nFoted)
FOREWORD
This report was prepared by Mr. J9.oshh.Weijna ren, of theEngineering Operations Office, Deputy for Engineering, AeronauticalSystems Division, Wright-Patterson AFB, Ohio. The purpose is toupdate and validate data originally contained in AFFDL TR-71-139,"Air Cargo k.estraint Criteria," and ASD TR-73-17, "Final Report-"Air Cargo Restraint Criteria." This effort was accomplished to define 'Iforward restraint criteria for cargo aircraft and spacecraft, andto find origins and rationale for the criteria.
The effort originally viewed cargo aircraft only but was ex-panded at the request of the National Aeronautics and Space Admini-stration to examine landing accidents in order to establish criteriafor the space shuttle. The effort was further expanded to investi-gate aircraft Class II Modification installations.
S. .. , " ......... •
!"iii
,A4
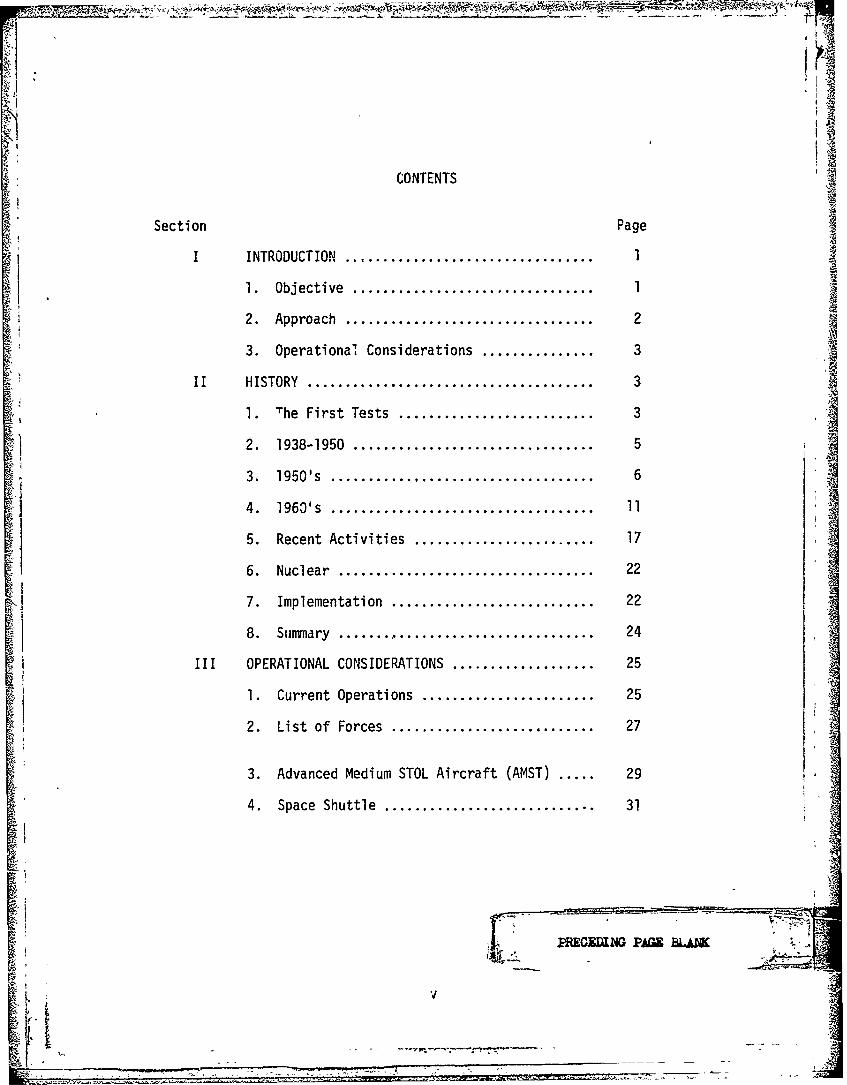
CONTENTS
Section Page
I INTRODUCTION ................................. 1
1. Objective ................................ 1
2. Approach ................................. 2
3. Operational Considerations ............... 3
II HISTORY ...................................... 3
1. The First Tests .......................... 3
2. 1938-1950 ................................ 5
3. 1950's ................................... 6
4. 1963's ................................... 11
5. Recent Activities ........................ 17
6. Nuclear .................................. 22
7. Implementation ........................... 22
8. Summary .................................. 24
III OPERATIONAL CONSIDERATIONS ................... 25
1. Current Operations ....................... 25
2. List of Forces ........................... 27
3. Advanced Medium STOL Aircraft (AMST) ..... 29
4. Space Shuttle ............................ 31
lV
[ ~~PRECXINO PAGE PLAB
V
.......... 2
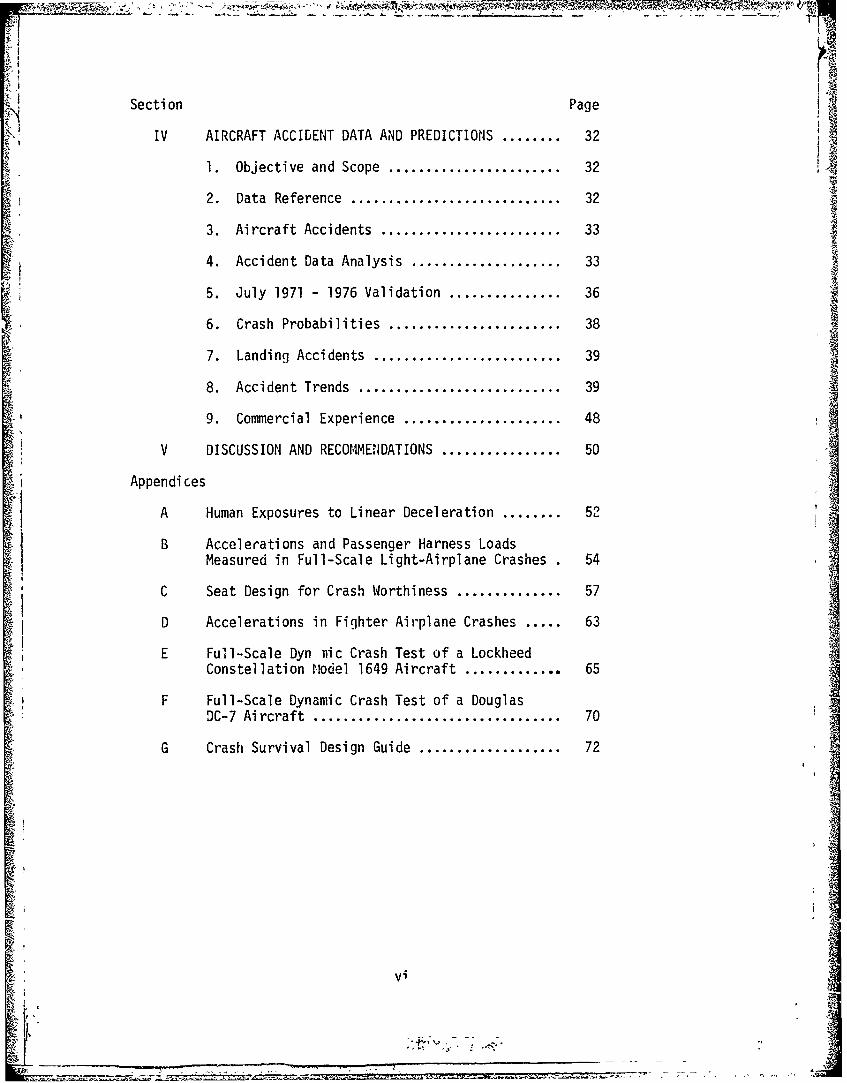
Secti on Page
IV AIRCRAFT ACCIDENT DATA AND PREDICTIONS ........ 32
1. Objective and Scope ....................... 32
2. Data Reference ............................ 32
3. Aircraft Accidents ........................ 33
4. Accident Data Analysis .................... 33
5. July 1971 - 1976 Validation ............... 36
6. Crash Probabilities ....................... 38
7. Landing Accidents ......................... 39
8. Accident Trends ........................... 39
9. Commercial Experience ..................... 48
V DISCUSSION AND RECOMMEN1DATIONS ................ 50
Appendices
A Human Exposures to Linear Deceleration ........ 52
B Accelerations and Passenger Harness LoadsMeasured in Full-Scale Light-Airplane Crashes 54
C Seat Design for Crash Worthiness .............. 57
D Accelerations in Fighter Airplane Crashes ..... 63
E Full-Scale Dyn iiic Crash Test of a LockheedConstellation Model 1649 Aircraft ............. 65
F Full-Scale Dynamic Crash Test of a DouglasDC-7 Aircraft ................................. 70
G Crash Survival Design Guide ................... 72
vi, .•
v•x
4 . ILLUSTRATIONS
Figure Page
1 First Intentional Air Corp Aircraft Crash DH-4 with Wright300 Engine - 1924 ............................................ 4
2 Acceleration Measurement ..................................... 12
3 On Board Experiments, Cameras and Fuselage Accelerometer
Locations .................................................... 13
4 Crushable Cargo Restraint Loads, 3040 Pound Pallet ........... 14, 15
5 Van Zelm Barrier Net ......................................... 24
6 C-141 Interior After Explosive Decompression ................. 26
7 Commercial Type Net .......................................... 28
"3 AMST Interior Troops Seated Alongside Cargo .................. 30
9 Space Shuttle ................................................ 31
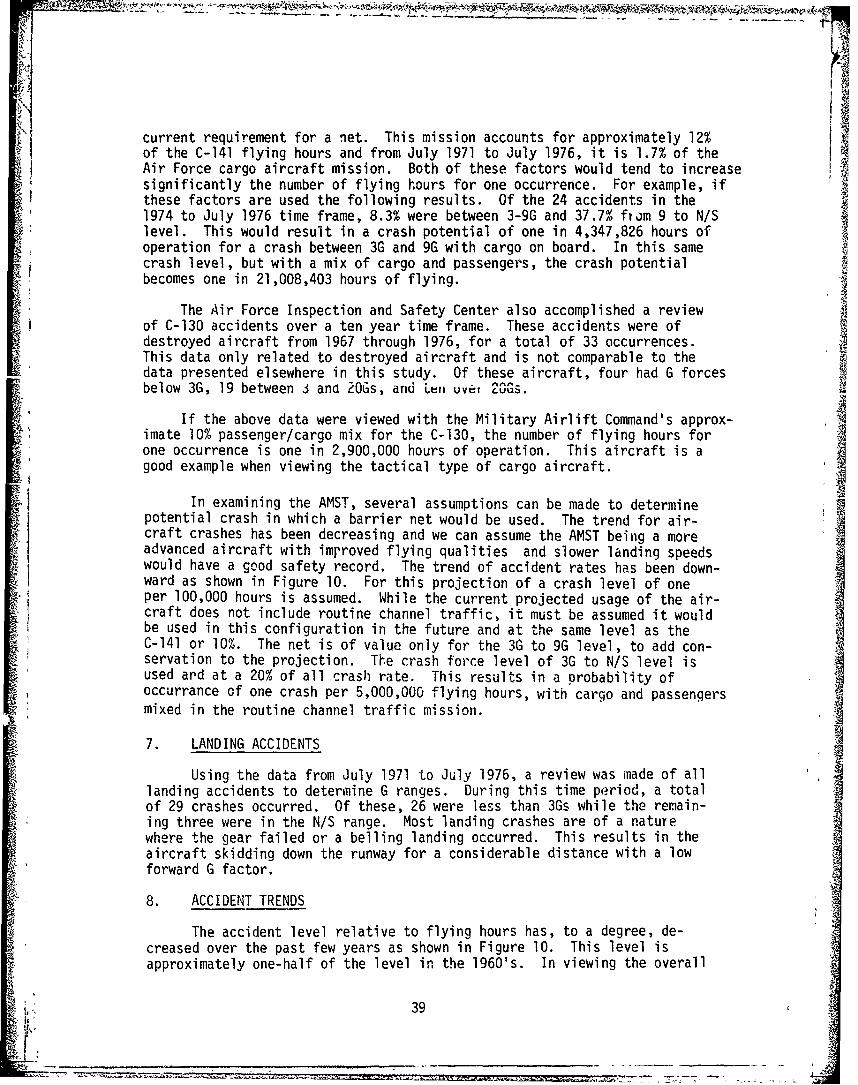
10 Cargo Accident Type .......................................... 40
11 Forward Fuselage Longitudinal Acceleration Measurements inLow Angle Impacts ............................................ 41
12 Air Canada DC-8F After Crash Looking in Entry Door ........... 47
B-l Mechanism for Light-Airplane Crash Investigation ............. 56
C-l Deceleration Pulse Components ................................ 58
C-2 Seat Response; Prolonged Deceleration Pulse .................. 59
E-1 L-1649 Crash Test Velocity - Time History .................... 67
LE-2 L-1649 Crash Test Velocity - Distance History ................ 68iE-3 Location of Floor Level Accelerometers for X, Y, and Z
kecordings L1649 ............................................. 69
F-l DC-7 Transport Crash Test Velocity - Time History ............ 71 IG-l Duration and Magnitude of Spineward Acceleration
Endured by Various Subjects (Taken from Reference 3) ......... 73
- ~vii]
ILLUSTRATIONS (Cont)
Figure Page
G-2 Duration and Magnitude of Headward AccelerationEndured by Various Subjects ................................ 74
G-3 Initial Pate of fhange of Spineward Acceleration Enduredby Varic.s Subjects Taken from Reference 3) ............... 75
G-4 r'•elerative Forces on the Body ............................ 77
vI
viii
411
TABLES
Number Page
I Percent Accident Ranges ............... 6
II ,iI-S-5705 - Structural Criteria Values .................. 7
III Acceleration of Floor .................................... 9
IV Aircraft Acceleration Relationships ...................... 11
V Aircraft Limit Load Factor ............................... !8
VI Weights for Various Restraint Systems .................... 19
VII Accidents Phase .......................................... 20
VIII Landing Forward G rorces ................................. 22
IX USAF Cargo Aircraft Operational and Accident Data ........ 34
x Accidents by Phase/Type .................................. 42
B-1 Deceleration Loads ....................................... 55
C-l Design Values of Longitudinal Airplane DecelerationPulses ........................ .......................... 61
ixI
I
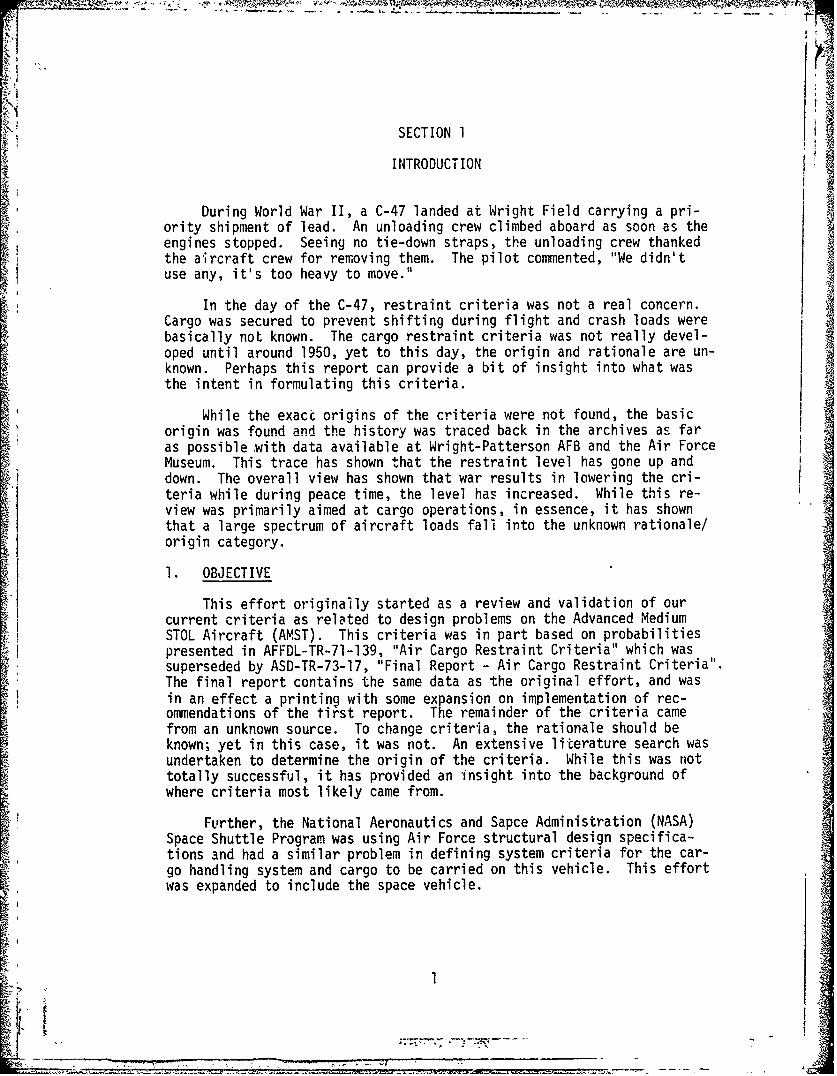
SECTION 1
INTRODUCTION
During World War II, a C-47 landed at Wright Field carrying a pri-ority shipment of lead. An unloading crew climbed aboard as soon as theengines stopped. Seeing no tie-down straps, the unloading crew thankedthe aircraft crew for removing them. The pilot commented, "We didn'tuse any, it's too heavy to move."
In the day of the C-47, restraint criteria was not a real concern.Cargo was secured to prevent shifting during flight and crash loads werebasically not known. The cargo restraint criteria was not really devel-
oped until around 1950, yet to this day, the origin and rationale are un-known. Perhaps this report can provide a bit of insight into what wasthe intent in formulating this criteria.
While the exact origins of the criteria were not found, the basicorigin was found and the history was traced back in the archives as faras possible .with data available at Wright-Patterson AFB and the Air ForceMuseum. This trace has shown that the restraint level has gone up anddown. The overall view has shown that war results in lowering the cri-teria while during peace time, the level has increased. While this re-view was primarily aimed at cargo operations, in essence, it has shown
that a large spectrum of aircraft loads fall into the unknown rationale/origin category.
1. OBJECTIVE
This effort originally started as a review and validation of ourcurrent criteria as related to design problems on the Advanced MediumSTOL Aircraft (AMST). This criteria was in part based on probabilitiespresented in AFFDL-TR-71-139, "Air Cargo Restraint Criteria" which wassuperseded by ASD-TR-73-17, "Final Report - Air Cargo Restraint Criteria".The final report contains the same data as the original effort, and wasin an effect a printing with some expansion on implementation of rec-ommendations of the first report. The remainder of the criteria camefrom an unknown source. To change criteria, the rationale should beknown; yet in this case, it was not. An extensive literature search wasundertaken to determine the origin of the criteria. While this was nottotally successful, it has provided an insight into the background ofwhere criteria most likely came from.
Further, the National Aeronautics and Sapce Administration (NASA)Space Shuttle Program was using Air Force structural design specifica-tions and had a similar problem in defining system criteria for the car-go handling system and cargo to be carried on this vehicle. This effortwas expanded to include the space vehicle.
!1
Another area of concern that had been raised is Class II Modifi-cations to our aircraft. These are temporary changes or alterationsto an aircraft to support research, development, design change, andcevelopment and operational test and evaluation programs. Here too,the same type of review was accomplished.
2. APPROACH
During the 1971 study (AFFDL-TR-71-139), time did not permit thefull literature search conducted for this effort. The search was con-ducted at the Wright-Patterson Technical Library, Air Force Museum,
Deputy for Engineering files and through the Defense DocumentationCenter. The results of this effort are presented in Section II.
The re-examination of the 1971 study provided two opportunities;first, a validation of the original projections by viewing what hashappened since various changes were enacted; second, a new set of prob-abilities can be computed by expand'rig the original data base of 1962through June 1971 to July 1976. In view of this, the data presented iathe report is being provided in both the original form and the expandeddata base for comparison and convenience.
The 1971 - 1976 data will also be shown. The methods that wereused in the 1971 study have been duplicated in developing the new over-all data. Secondly, only in a case such as this where a study is re-conducted, can you successfully use hindsight. Theý 1971 study viewedthe probabilities relative to flight. However, in numerous situations;the definition as to what is a flight, time of a flight, and missionprofile is truly not known. The intention of the use of flight as abase was to provide the probability on an average two hour flight of acrash. In view of change of average flight times, and other factorssuch as sorties and training times, tha data presented within this re-port will follow the traditional method of presentation of this type ofdata, accidents per flying hours. Suggestions have also been made thatthe probabilities be viewed relative to sorties. While this data isavailable from 1966 through June 1976, it is not considered to be a us-able data base. Sorties can consist of many landings and in trdining ofmany "touch and goes". It is not known which of these sorties are rel-ative to training, cargo missions, and cargo and passenger missions.Using the accidents per flying hour will present the best data base andact as an equalizer. As a matter of information, the data on number ofsorties will be provided. An addition to the study is the inclusion ofminor accidents that underwent an unplanned forward G force but did notresult in major damage or fatality. These are accidents that shouldhave been included originally.
2
7i .'--. .V
The data used for the accident review consisted of data collectedduring the 1971 study with updates to the present time frame and con-sisted of: computerized accident data summaries of all major and minoraccidents of cargo type aircraft from 1962 to July 1976, from the DeputyInspector General for Inspection and Safety, USAF, Norton AFB, California(IGDS); data on flying hours, landings and sorties from U.S. Air ForceAccident Bulletins and IGDS files; data on mixed configuration flyinghours for C-141 aircraft from Military Airlift Command files; major ac-cident reports from late 1968 to February 1971 in Aeronautical SystemsDivision files, of 64 consecutive accidents; major and minor accidentreports from mid-1973 to February 1976 in ASD files of 24 consecutiveaccidents, and C-130 accident data from a ten year time frame. The ap-plication of this data is discussed in Section IV.
3. OPERATIONAL CONSIDERATIONS
Several changes have been enacted based on a 1971 ASD/AFFDL study torestraint criteria. Further changes to the criteria were enacted as a resultof mission needs. These actions are detailed in Section II. This has resultedin various documents with different values and confusion outside of the com-munity directly involved in this subject. Further, the overall design andoperational concept of the AMST and the space shuttle presents new problemsrelated to the current design criteria. The changes and operation considera-tions are discussed in both Sections II and III.
SECTION II
HISTORY
Until this effort the best story as to the origin of cargo restraintcriteria has been a rumor that in 1957, at the National Advisory Committeefor Aeronautics (NACA) (forerunner to National Aeronautics and Space Ad-ministration (NASA) ). Lewis Test Cite odtside Cleveland, Ohio, a groupof engineers crash tested some all metal aircraft in an attempt to developa restraint criteria. That evening in a bar the criteria values were se-lected. We now know the names of some of the engineers, types of aircrafttested, and have some of the test data. This makes it doubtful the criteri-a was developed in the bar. The data developed is the same as values incurrent structures specifications and could have been its origin, but his-tory shows it was oiily a confirmation of criteria developed a few yearsearlier. It is still unknown for certain where the basic criteria evolved.Information in this section will be provided in chronological order. De-tail summaries of some of the source documents are provided as appendices.
1. THE FIRST TESTS
"From the earliest days the great dread of the aviator has been thatof fire, a dread certainly not without foundation during the war, when acertain type of plane won the sobriquet-of "Flaming Coffin" from the fre-quency with whiLh it burst into flames in the air. Even now that airplanesrarely take fire in the air, the percentage of planes which burst into
3
-I C-
flames upon crashing is sufficient to cause the menace still to lingerin the flyer's mind and it will continue to do so, until the possibil-
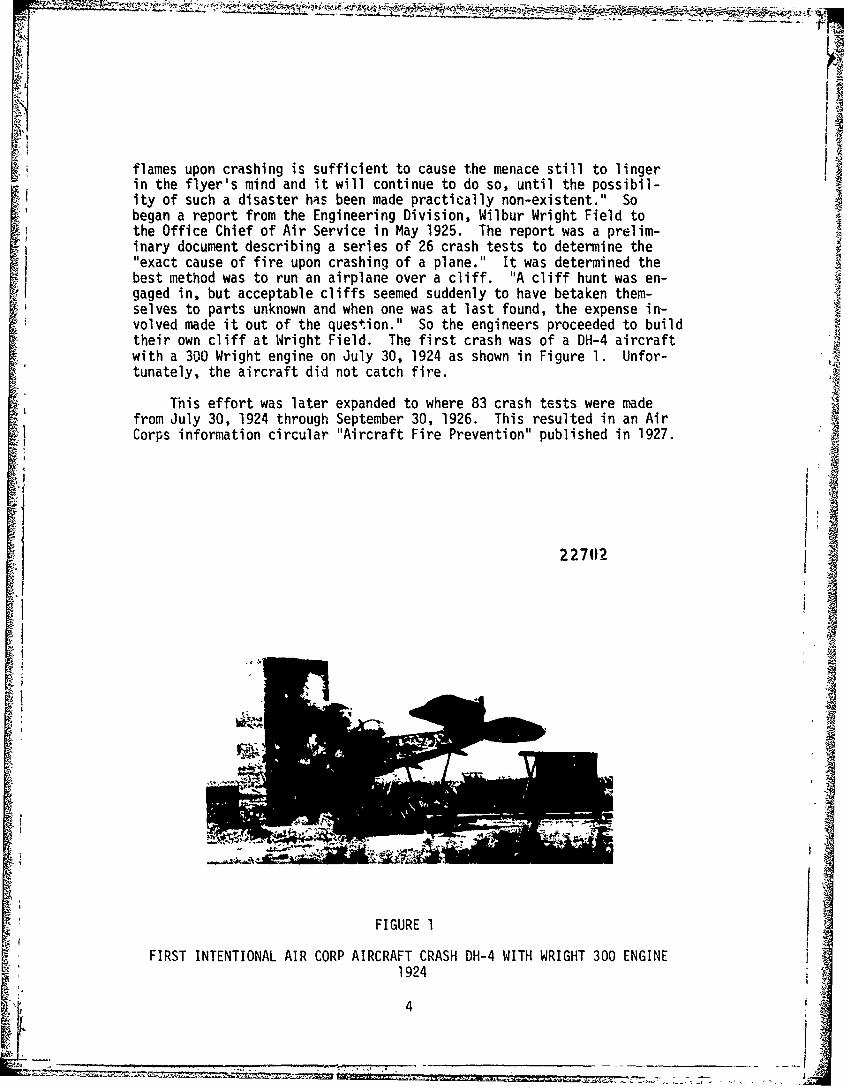
ity of such a disaster has been made practically non-existent." Sobegan a report from the Engineering Division, Wilbur Wright Field tothe Office Chief of Air Service in May 1925. The report was a prelim-inary document describing a series of 26 crash tests to determine the"exact cause of fire upon crashing of a plane." It was determined thebest method was to run an airplane over a cliff. "A cliff hunt was en-gaged in, but acceptable cliffs seemed suddenly to have betaken them-selves to parts unknown and when one was at last found, the expense in-volved made it out of the question." So the engineers proceeded to buildtheir own cliff at Wright Field. The first crash was of a DH-4 aircraftwith a 300 Wright engine on July 30, 1924 as shown in Figure 1. Unfor-tunately, the aircraft did not catch fire.
This effort was later expanded to where 83 crash tests were madefrom July 30, 1924 through September 30, 1926. This resulted in an AirCorps information circular "Aircraft Fire Prevention" published in 1927.
227112
FIGURE 1
FIRST INTENTIONAL AIR CORP AIRCRAFT CRASH DH-4 WITH WRIGHT 300 ENGINE1924
4!S~4
S.. .. .... . .. .. .. _ _ _ __.. . . . ._ _ _ _..
2. 1938 -1950The next document that was found was an Air Corps specification No.
C-1803A. November 15, 1938. This document had an emergency load factorin forward direction of 8Gs. On 5 December 1941, the document was a-mended to where this value was changed to 6Gs forward. In the same timeframe the ground loads handb(ok, ANC-2, October 15, 1941 was issued withthe following load factors:
LIMIT EMERGENCY GROUND LOADS
2.W up 3W down
l.W aft 1.33W forward
l.W lateral
Factor of safety 1.5
The emergency ground load was defined as follows: "Emergency landing struc-tures include those structural elements which are provided to protect theairplanes in the event of landings with a retracted landing gear and alsothe structural elements intended to protect the occupants of the airplanein the event of a 'turn-over'. Emergency landing structures extend intothe airplane as far as emergency ground loads are critical."
The next document found was the Army Air Force Specification R-1803-4A,22 October 1945 which specified the loads in accordance with Ground LoadsHandbook; ANC-.2. In Army Air Force Specification C-1803E,2 April 1946,the requirement to meet ANC-2 was deleted. However, no load criteria wasprovided for transport aircraft but rather it indicated the load factorswould be provided by the procuring-activity as required.
The first report found in this technical area was published in 1943 bythe Committee of Medical Research and Committee on Aviation Medicine of theNational Research Council. This report was included in a comprehensivereport number 440, dated July 9, 1945, also by the same committees. "TheRelationship of Injuries to Structures in Survivable Aircraft Accidents."The report covers 110 aircraft accidents with fore and aft seating and 75accidents with two abreast seating. These aircraft were high wing, 1000to 1500poundgross weight, basically built prior to World War II and did notutilize shoulder harne-s. During the twenty-eight month study period, there 4were 113 fatal accidencs, 185 "survivable", 84 "serious" (where serious wouldbe a minor accident today), and 343 minor accidents. If the minor and seriousaccidents were added together for 427 accidents, the ratios of minor to sur-vivable to fatal now approach a trend very similar to those we find in thamodern era as discussed in Section IV and shown here in Table I.
5
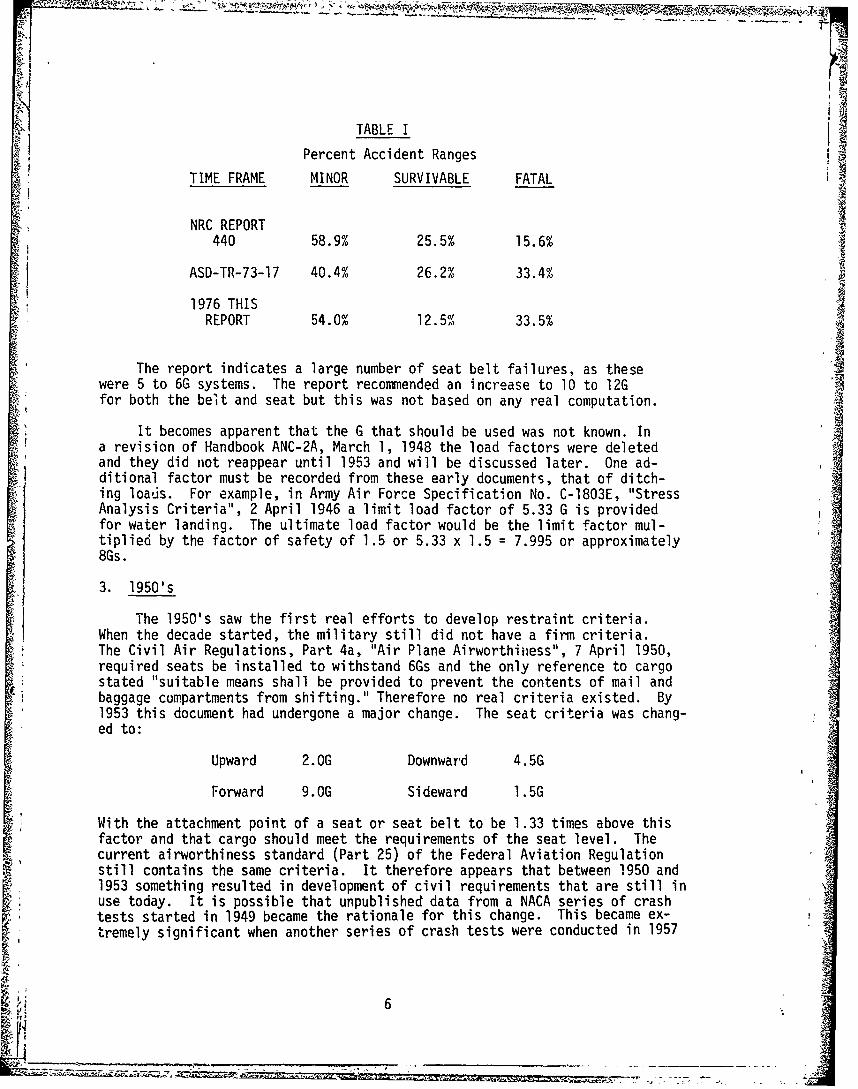
TABLE I
Percent Accident RangesTIME FRAME MINOR SURVIVABLE FATAL
NRC REPORT440 58.9% 25.5% 15.6%
ASD-TR-73-17 40.4% 26.2% 33.4%
1976 THISREPORT 54.0% 12.5% 33.5%
The report indicates a large number of seat belt failures, as these Alwere 5 to 6G systems. The report recommended an increase to 10 to 12Gfor both the belt and seat but this was not based on any real computation.
It becomes apparent that the G that should be used was not known. Ina revision of Handbook ANC-2A, March 1, 1948 the load factors were deletedand they did not reappear until 1953 and will be discussed later. One ad-ditional factor must be recorded from these early documents, that of ditch-ing loaus. For example, in Army Air Force Specification No. C-1803E, "StressAnalysis Criteria", 2 April 1946 a limit load factor of 5.33 G is providedfor water landing. The ultimate load factor would be the limit factor mul-tiplied by the factor of safety of 1.5 or 5.33 x 1.5 = 7.995 or approximately8Gs.
3. 1950's
The 1950's saw the first real efforts to develop restraint criteria.When the decade started, the military still did not have a firm criteria.The Civil Air Regulations, Part 4a, "Air Plane Airworthiness", 7 April 1950,required seats be installed to withstand 6Gs and the only reference to cargostated "suitable means shall be provided to prevent the contents of mail andbaggage compartments from shifting." Therefore no real criteria existed. By1953 this document had undergone a major change. The seat criteria was chang-ed to:
Upward 2.OG Downward 4.5G
Forward 9.OG Sideward 1.5G
With the attachment point of a seat or seat belt to be 1.33 times above thisfactor and that cargo should meet the requirements of the seat level. Thecurrent airworthiness standard (Part 25) of the Federal Aviation Regulationstill contains the same criteria. It therefore appears that between 1950 and1953 something resulted in development of civil requirements that are still inuse today. It is possible that unpublished data from a NACA series of crashtests started in 1949 became the rationale for this change. This became ex-tremely significant when another series of crash tests were conducted in 1957
6
using the same type of aircraft. Jusc as the first series of tests (1924-1926) were to determine causes of crash fires, so were these conducted from1949 to 1952. The tests were conducted by the NACA on four C-46 and 13C-82 aircraft to investigate fuel spill and resultant fires during a take-off accident without becoming airborne. Each test aircraft carried 1050gallons of fuel and impacted at speeds ranging from 80-105 MPH. These testsare covered in NACA TR!133 "Mechanism of Start and Development AircraftCrash Fires." However, the report does not provide any crash force data.Time velocity data, however, is provided and could have been used to deter-mine force loads.
During the same time period as the crash fire tests Major John Stappconducted a series of 53 experiments to determine human level of toleranceto G fo,'ces. This is the first significant effort to determine what loadsshould be to provide full protection to a human in a crash. While the effortdid not provide final values to design against but basically indicated alevel of 17G with a rate of onset of lO0OG per second while using standardair force harness and 38G with a 1350G per second onset rate using an addedinverted V-leg strap. The report further shows at a lower rate of onsethigher G levels can be withstood. Further details are presented in AppendixA. This Appendix A data on basic levels of human tolerance together withtests on aircraft structural strengths provide a close relationship that mayhave resulted in the higher G levels. It further shows an attempt to pro-vide protection to the highest possible level, based on human and aircrafttolerance.
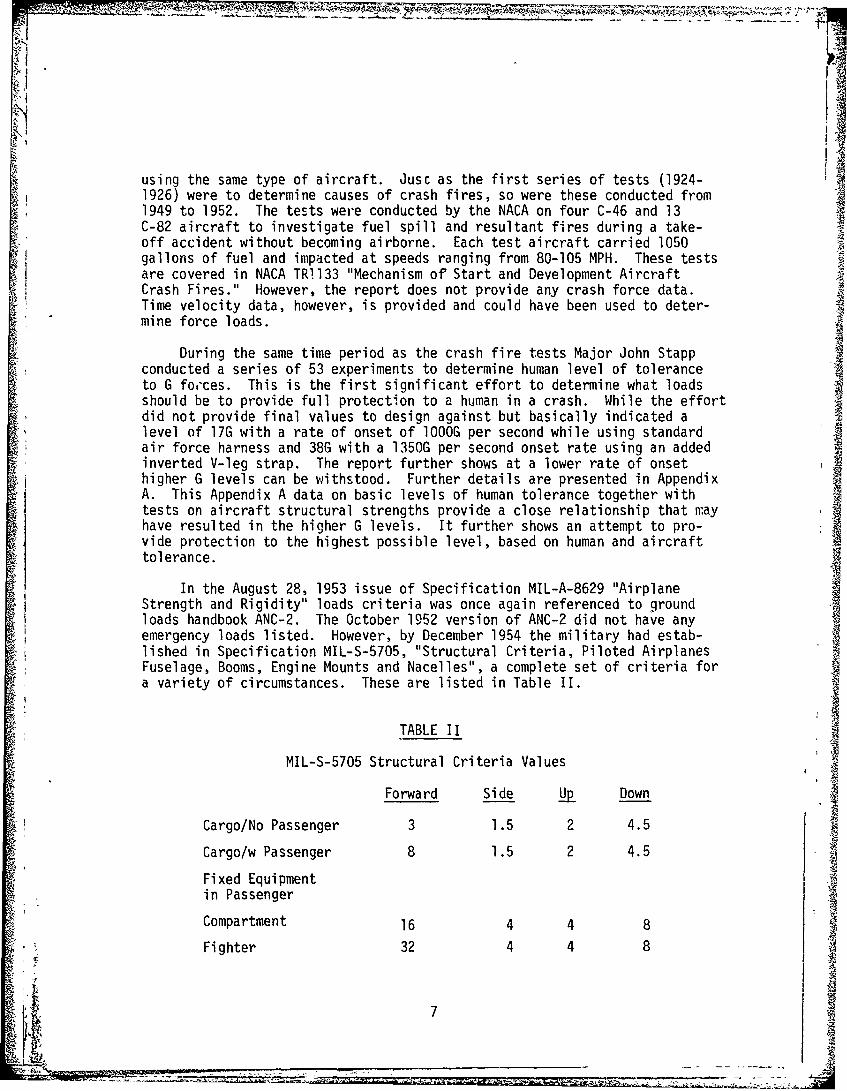
In the August 28, 1953 issue of Specification MIL-A-8629 "AirplaneStrength and Rigidity" loads criteria was once again referenced to groundloads handbook ANC-2. The October 1952 version of ANC-2 did not have anyemergency loads listed. However, by December 1954 the military had estab-lished in Specification MIL-S-5705, "Structural Criteria, Piloted AirplanesFuselage, Booms, Engine Mounts and Nacelles", a complete set of criteria fora variety of circumstances. These are listed in Table II.
TABLE II
MIL-S-5705 Structural Criteria Values
Forward Side Up Down
Cargo/No Passenger 3 1.5 2 4.5
Cargo/w Passenger 8 1.5 2 4.5
Fixed Equipmentin Passenger
Compartment 16 4 4 8
Fighter 32 4 4 8
7
Again, as with the civilian counterpart document we do not know how thesenumbers evolved. It is possible the 8G forward is related to ditchingloads, or the 1949 crash tests. The 3G forward is most likely derivedfrom the 1949 crash tests. A new factor is the 16G forward for fixedequipment. This is any equipment within the cargo compartment attachedto the aircraft, for example a fire extinguisher would have to be restrain-ed to this 16G level. A possible fallout of Major Stapp's effort.
Specification MIL-A-8421 "Air Transportability Requirements, GeneralSSpecification Fo"was published iNoebr15.This document provides
the criteria for equipment to be transported on military aircraft with a 3G"taxi load" and an 8G "crash load". Taxi load was most probably a wrong term-inology and should have been cvlled landing crash loads. At this point intime, basically all documents were providing the same criteria with theonly difference being the 8 and 9G between military and civilian require-ments. In 1969, Specification MIL-A-8421 and in 1971, Specification MIL-A-8865 were changed to 9G to end this difference and achieve commonality.
We now enter a new phase, that of crash testing aircraft to determinethe physics of a crash. It appears that the first crash tests related tocrash dynamics occurred in 1953. These tests conducted by NACA were onthree light aircraft with a maximum weight of 1220 pounds and are detailedin hppendix B. One interesting result of this test was the relationshipof floor to seat loading. A dummy in the seat saw G loads ranging from1.2 to 1.5 times higher than the aircraft floor directly below the seat.The loads on the dummy were 32G, 46G and 50 G with aircraft impact at 42,47 and 60 MPH respectively.
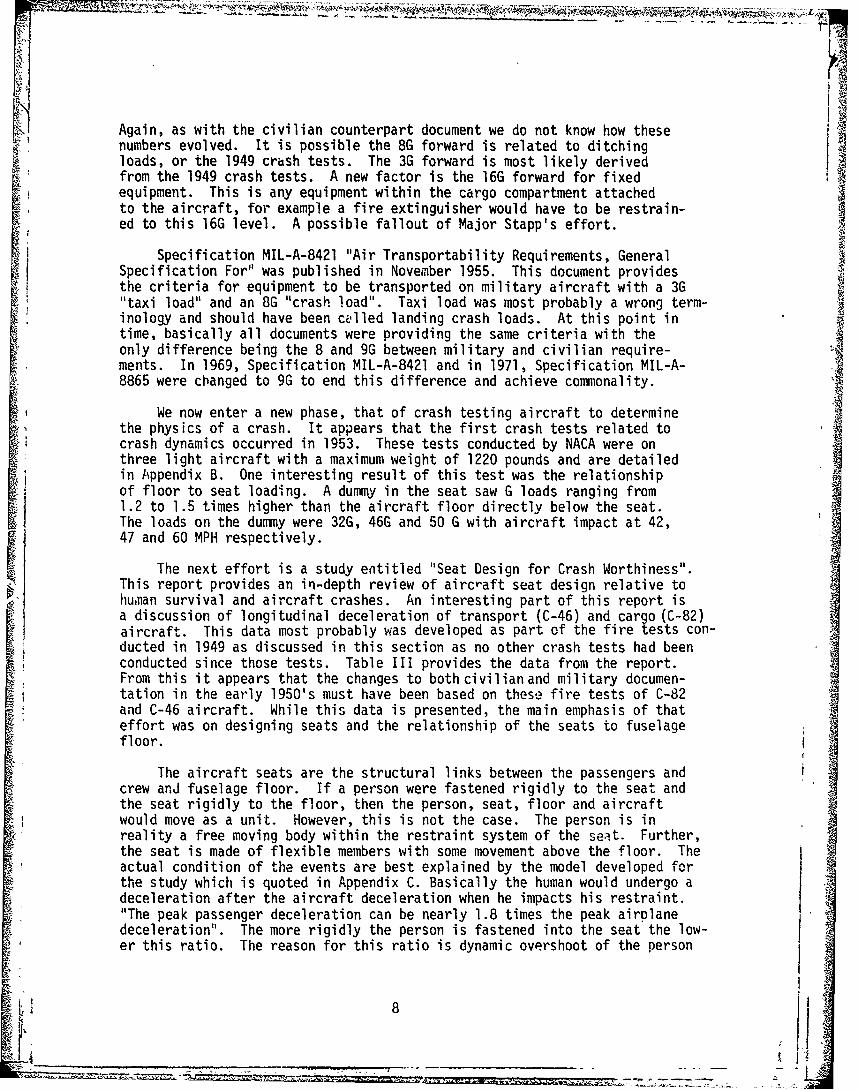
The next effort is a study entitled "Seat Design for Crash Worthiness".This report provides an in-depth review of aircraft seat design relative tohuman survival and aircraft crashes. An interesting part of this report isa discussion of longitudinal deceleration of transport (C-46) and cargo (C-82)aircraft. This data most probably was developed as part of the fire tests con-ducted in 1949 as discussed in this section as no other crash tests had beenconducted since those tests. Table III provides the data from the report.From this it appears that the changes to both civilian and military documen-
tation in the early 1950's must have been based on these fire tests of C-82and C-46 aircraft. While this data is presented, the main emphasis of thateffort was on designing seats and the relationship of the seats to fuselagefloor.
The aircraft seats are the structural links between the passengers andcrew anJ fuselage floor. If a person were fastened rigidly to the seat andthe seat rigidly to the floor, then the person, seat, floor and aircraftwould move as a unit. However, this is not the case. The person is inreality a free moving body within the restraint system of the seat. Further,the seat is made of flexible members with some movement above the floor. Theactual condition of the events are best explained by the model developed forthe study which is quoted in Appendix C. Basically the human would undergo adeceleration after the aircraft deceleration when he impacts his restraint."The peak passenger deceleration can be nearly 1.8 times the peak airplanedeceleration". The more rigidly the person is fastened into the seat the low-er this ratio. The reason for this ratio is dynamic overshoot of the person
8 j
4a t, I4 0 0 0
on W cy wU U C ) in)~
V 0 0 0 0 l
0) Vz97
AA
41 t)
0r 60 . 00 --o 00 0 0
~ CU fl O~ *-n cm V), 00 O) C 0
o 0
C.) 11 J l o n ') 0
<- 0 0 0
.2) 0 N U N N
10 1 4; 0 " .2 .:;0- '4S.. C a) c 05 0
J0 a -- 0") w 5Q " l 01 r. c2 c
S. U. ". .0 0 )
0 m.5.. 1. '.
43 0U-W 0) .2 CNX:S
M >S
f) ') N 10 -0 4
CS.W C00 ~
C.a 0.
__ J
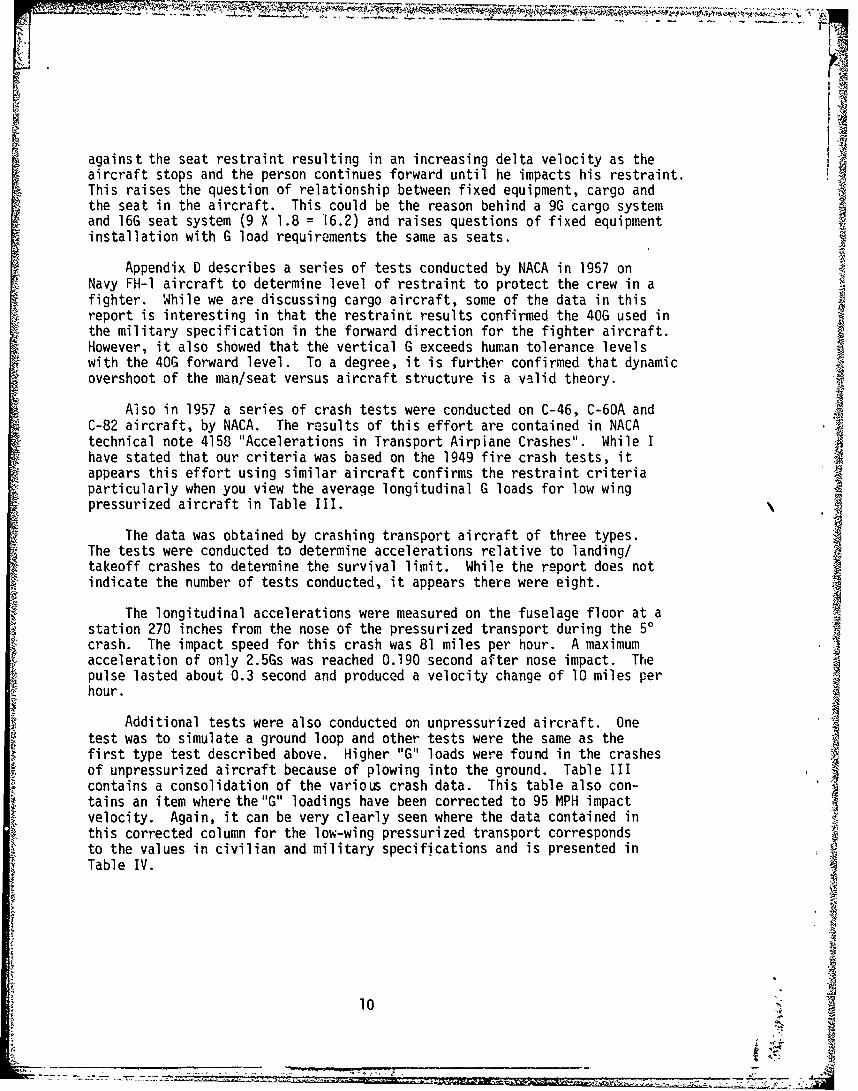
against the seat restraint resulting in an increasing delta velocity as theaircraft stops and the person continues forward until he impacts his restraint.This raises the question of relationship between fixed equipment, cargo andthe seat in the aircraft. This could be the reason behind a 9G cargo systemand 16G seat system (9 X 1.8 = '16.2) and raises questions of fixed equipmentinstallation with G load requirements the same as seats.
Appendix D describes a series of tests conducted by NACA in 1957 onNavy FH-l aircraft to determine level of restraint to protect the crew in afighter. While we are discussing cargo aircraft, some of the data in thisreport is interesting in that the restraint results confirmed the 40G used inthe military specification in the forward direction for the fighter aircraft.However, it also showed that the vertical G exceeds human tolerance levelswith the 40G forward level. To a degree, it is further confirmed that dynamicovershoot of the man/seat versus aircraft structure is a valid theory.
Also in 1957 a series of crash tests were conducted on C-46, C-60A andC-82 aircraft, by NACA. The results of this effort are contained in NACAtechnical note 4158 "Accelerations in Transport Airplane Crashes". While Ihave stated that our criteria was based on the 1949 fire crash tests, itappears this effort using similar aircraft confirms the restraint criteriaparticularly when you view the average longitudinal G loads for low wingpressurized aircraft in Table III.
The data was obtained by crashing transport aircraft of three types.The tests were conducted to determine accelerations relative to landing/takeoff crashes to determine the survival limit. While the report does notindicate the number of tests conducted, it appears there were eight.
The longitudinal accelerations were measured on the fuselage floor at a
station 270 inches from the nose of the pressurized transport during the 5'crash. The impact speed for this crash was 81 miles per hour. A maximumacceleration of only 2.5Gs was reached 0.190 second after nose impact. Thepulse lasted about 0.3 second and produced a velocity change of 10 miles perhour.
Additional tests were also conducted on unpressurized aircraft. Onetest was to simulate a ground loop and other tests were the same as thefirst type test described above. Higher "G" loads were found in the crashesof unpressurized aircraft because of plowing into the ground. Table IIIcontains a consolidation of the various crash data. This table also con-tains an item where the"G" loadings have been corrected to 95 MPH impactvelocity. Again, it can be very clearly seen where the data contained inthis corrected column for the low-wing pressurized transport correspondsto the values in civilian and military specifications and is presented inTable IV.
.-"I10
- - ----- 2MS
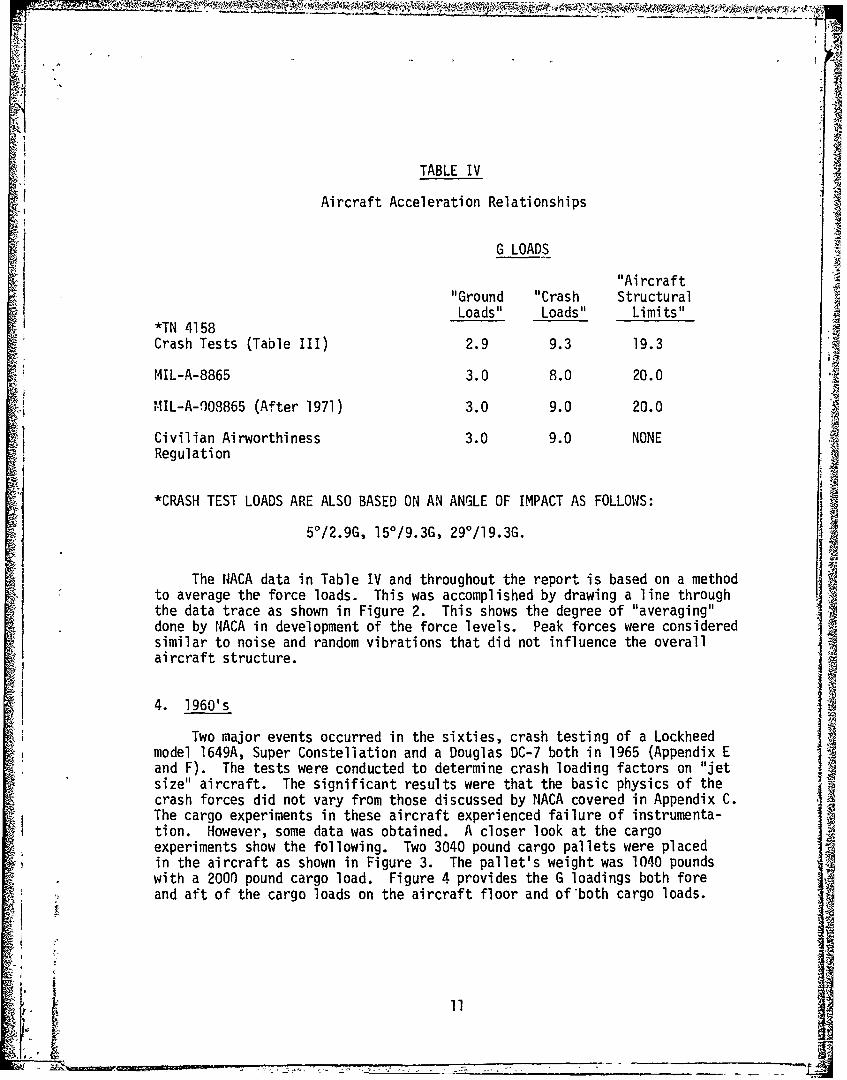
TABLE IV
Aircraft Acceleration Relationships
G LOADS
"Aircraft
"Ground "Crash Structural
Loads" Loads" Limits"*TN 4158Crash Tests (Table III) 2.9 9.3 19.3
MIL-A-8865 3.0 8.0 20.0
MIL-A-008865 (After 1971) 3.0 9.0 20.0
Civilian Airworthiness 3.0 9.0 NONERegulation
*CRASH TEST LOADS ARE ALSO BASED ON AN ANGLE OF IMPACT AS FOLLOWS:
50 /2.9G, 150 /9.3G, 29 0 /19.3G.
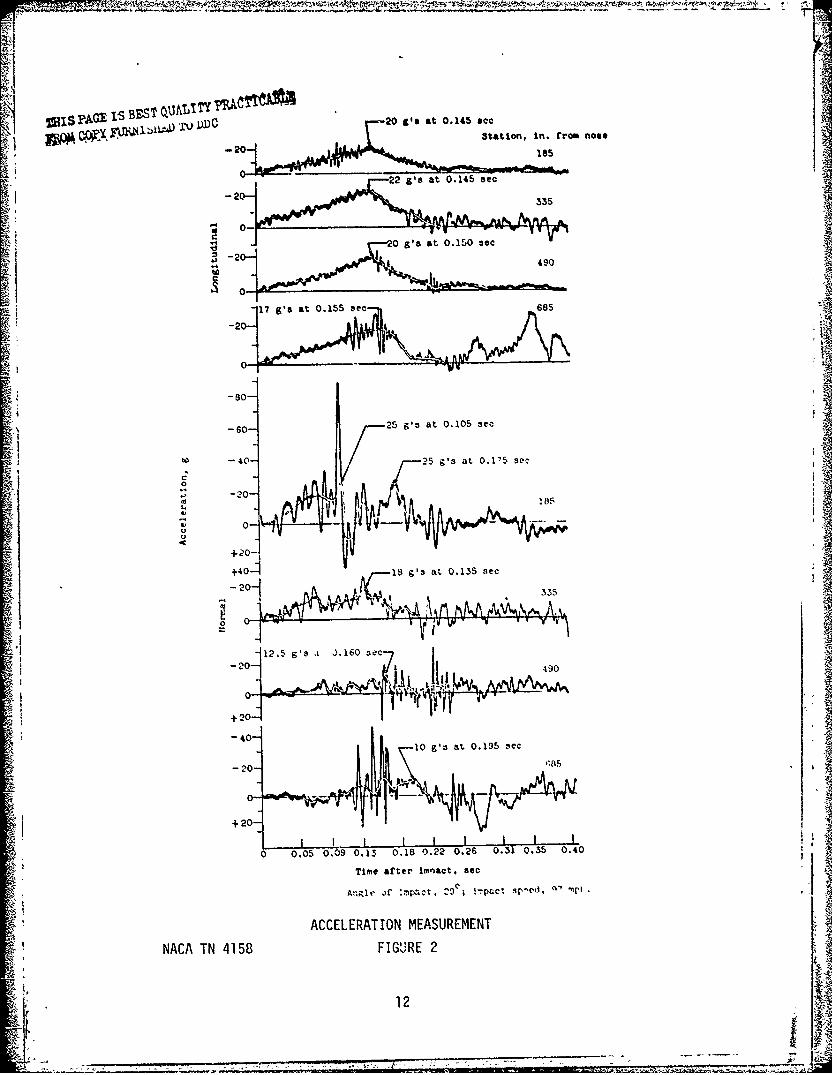
The 1ACA data in Table IV and throughout the report is based on a methodto average the force loads. This was accomplished by drawing a line throughthe data trace as shown in Figure 2. This shows the degree of "averaging"done by NACA in development of the force levels. Peak forces were consideredsimilar to noise and random vibrations that did not influence the overallaircraft structure.
4. 1960's
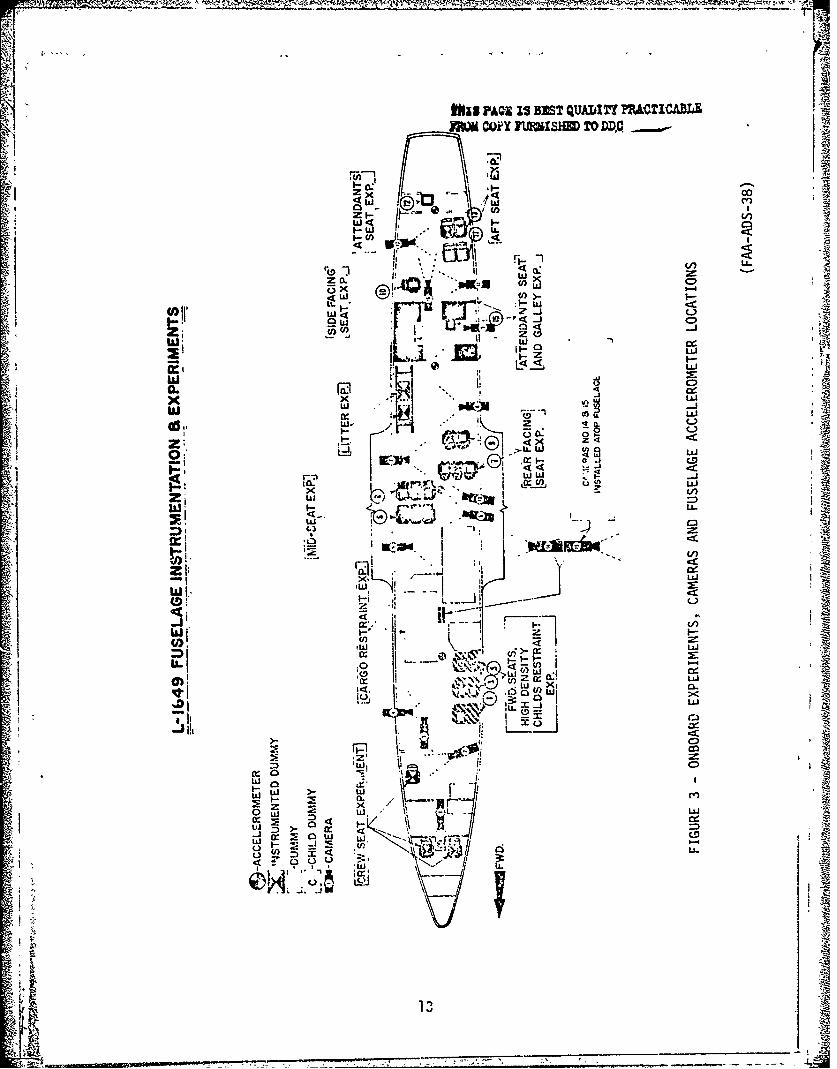
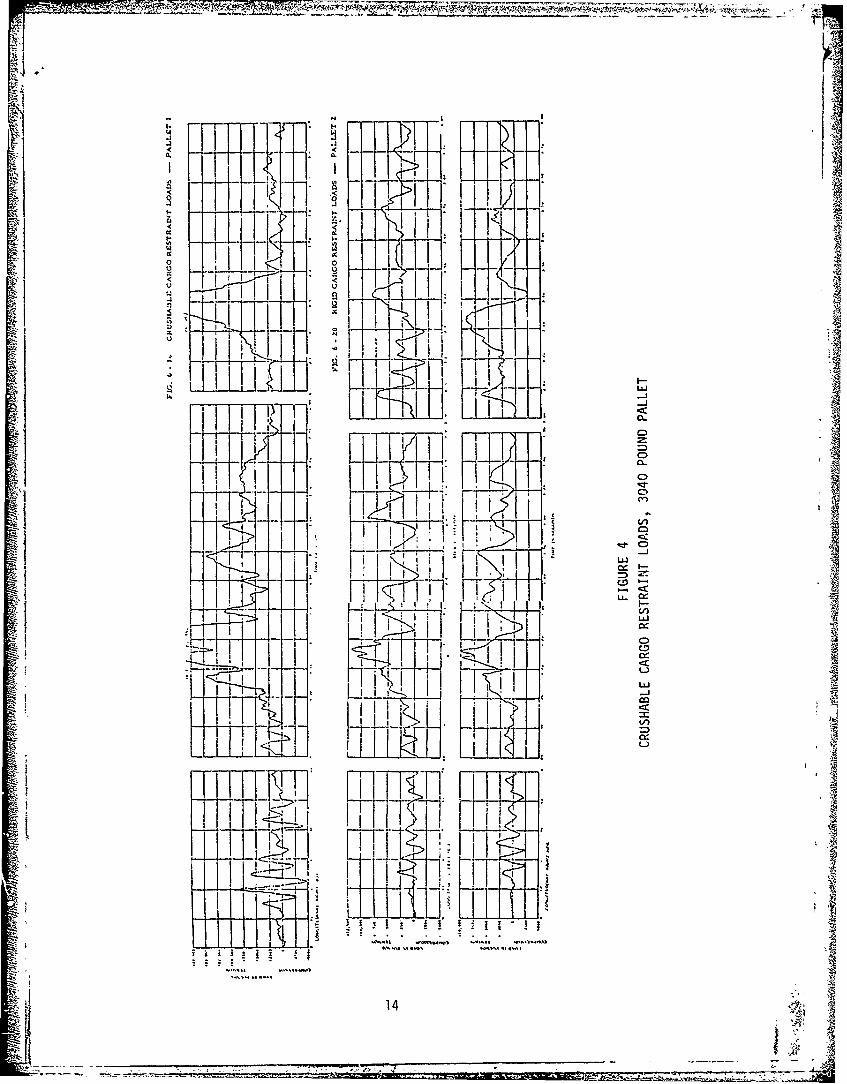
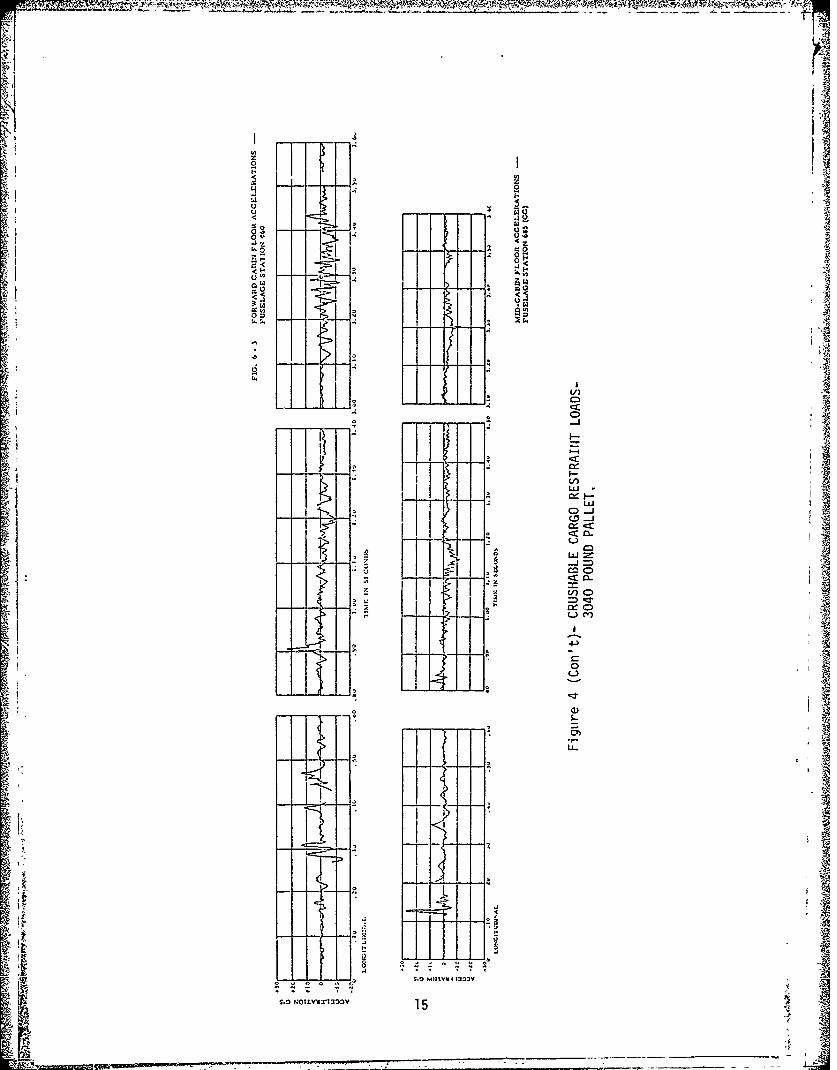
Two major events occurred in the sixties, crash testing of a Lockheedmodel 1649A, Super Constellation and a Douglas DC-7 both in 1965 (Appendix Eand F). The tests were conducted to determine crash loading factors on "jetsize" aircraft. The significant results were that the basic physics of thecrash forces did not vary from those discussed by NACA covered in Appendix C.The cargo experiments in these aircraft experienced failure of instrumenta-tion. However, some data was obtained. A closer look at the cargoexperiments show the following. Two 3040 pound cargo pallets were placedin the aircraft as shown in Figure 3. The pallet's weight was 1040 poundswith a 2000 pound cargo load. Figure 4 provides the G loadings both foreand aft of the cargo loads on the aircraft floor and of both cargo loads.
- -
Ewl
THIS ?AG IS BES't Qlj 2a t. &C Station, in. rrom noes
• -"22 gls at 0.145 bec
-2 0 5
S-8~0--
•~
-60 25 0gs at 0.105 sec
-60-
-17O gls at 0.155 sec
"•o -20-
0
+20-
+40- 9 g's at 0.135 sec
-20
- I-
'I0-
I
1
• ~~+0 ,JS T g'e ate 0.135t sec '
- 12.5 gNC T a .160 1ec
0-I
+ 20--q 9 1
-40-log3at 0.195 sec
-20-C8
+20-
0 0.05 0.09 0.13 0.18 0.22 0.26 0.l 0.35 0.40
A ~Time after imqact. sec I
ACCELERATION MEASUREMENT
NACA TN 4158 FIGURE 2
12r
UZIPAO I' BST QUALII¶Y PRACICABLE
Z 00<X< wx4e
(j))us!-~ w CiN ý a 4
--.. w
w~ LiiC
z U
zi A.. I
-'LL
ILI
Li
ct' Lii
II 0
z, X
w >Lii
C:)
w C)
w W,
ZI
A ___ ____
ir -P
oI I_ I
_-1 L _
PIFI Z'
T0 I I-I -- -
Ill II I -
I'A
a a>
I ->
HR
*1 I14
21
II 0
U LU
I.. cc
- U15
IMost of the continuing efforts of this decade are related to concepts
of improving passenger and crew survivability. This resulted in reviews ofall past data and in some cases even a view of selected civilian and militaryaircraft accidents. One of the problems found with this data is that theyfailed to view the entire spectrum of accidents. For -iaple, a major effortby Haley, et. al. viewed only accidents described as "at least one person wasinjured in the accident to the extent that he was hospitalized for 24 hoursand/or received bone fractures, excluding toes, fingers, and nose", and "at
least one person did survive the accident, or at least conclusive evidenceindicated that survival would have been possible if proper body restraint hadbeen used. The fact that the fuselage structure was not crushed to the ex-tent to preclude survival was taken as one indication that survival shouldhave been possible. The severity of the accident, including estimated
* velocity change, impact angle and estimated G levels, provided further evi-dence of survival potential". The study did not view minor impact accidents,such as "landing gear failures after touchdown, or any other impacts in whichthe decelerative forces on the occupants do not exceed about 4G "or catas-trophic impact forces". This resulted in viewing accidents only from approxi-mately 4G to 20G. The civilian accidents came from a ten year time span, 1955through 1964 and military from 1962 through 1965. This resulted in studyinga total of 61 accidents. A crash loads environment study indicated thatSbetween 1959 through 1963 the total number of civilian accidents was 326. Of
the 61 aircraft crashes, two-thirds had a fire that caused approximately one-half of all fatalities. It was also found that 58% of all the aircraft had afuselage break and this increased to 68% for aircraft that impacted at 10degrees or greater, However, the overall results of this effort must bevery carefully utilized due to the severe tailoring of the data. One inter-esting G factor, was the use of average G force which is defined as one-half of the maximum level over a time frame.
Dr. John Avery in a 1965 study entitled "Cargo Restraint Concepts forCrash Resistance" viewed past history crashas with the special object ofdeveloping criteria for survivable crashes of helicopters and the C-7 air-craft. Based on prior crash data, a dynamic forward r~straint diagram wasproposed. This was a triangular shape with a peak of 25G with a rise fromzero to peak in 0.125 seconds and same time for fall back to zero.
The report further views possible cargo nets for a C-7 type aircraft asa means to protect passengers. Four type of net systems are viewed includingboth direct restraint into aircraft attachments and use of load limiters builtinto net systems. The proposed restraint systems of this report were notadopted.
In 1966 another effort viewed the method for using load factors. Thiseffort resulted in a report entitled "Aircraft Cargo Restraint System" whichcites a "major fault" with current restraint systems and claims that to pro-vide adequate restraint, 39Gs as a static force should apply. The reportclaims that 39G static force is equivalent to a 25G dynamic response. Thereport further shows how the tie-down would be accomplished on various Armyloads to meet this "correct" criteria. The study also reviewed various designson energy absorbing devices that could be added to restraint systems to allowhigher G loads.
16
The 39G criteria proposed by the above report was not accepted for use.That same year a major change occurred in operational use of restraint cri-teria. The 8G criteria was causing problems during combat opa.'ations in SouthVietnam, in extended turn around time. As a matter of operational expediencythe restraint criteria was lowered to 4Gs. This corresponded to the 4G cri-teria that was used for airdrop with parachute recover.y. While the airdropload factor is another item whose origin is unknown, it is believed that this4G forward factor is a fallout of securing cargo to platforms to withstandground impact. The 8-9G criteria did not apply to these loads because theycould be jettisoned prior to a crash. The 4G crite-ia realized risks involved,such as crash on take-off where jettison could no0. be accomplished relativeto mission needs.
The criteria was lowered to 4G on combat missions or related exercisesfor aircraft such as C-130 and C-141 due to the jettison capability for alltypes of cargo. With time this filtered its way into a wide variety of air-craft missions. For example, many C-130s flew "tactical i..ssions" and there-fore used the 4G criteria, except with passengers on board.
Additional efforts in the sixties were related to consolidation ofpast efforts. One work of significance was published in 1967 entitled"Crash Survival Design Guide". It provides detail into human tolerancelevels, relates to levels of survivability accidents and not occurrence,and is covered in Appendix G.
5. RECENT ACTIVITIES
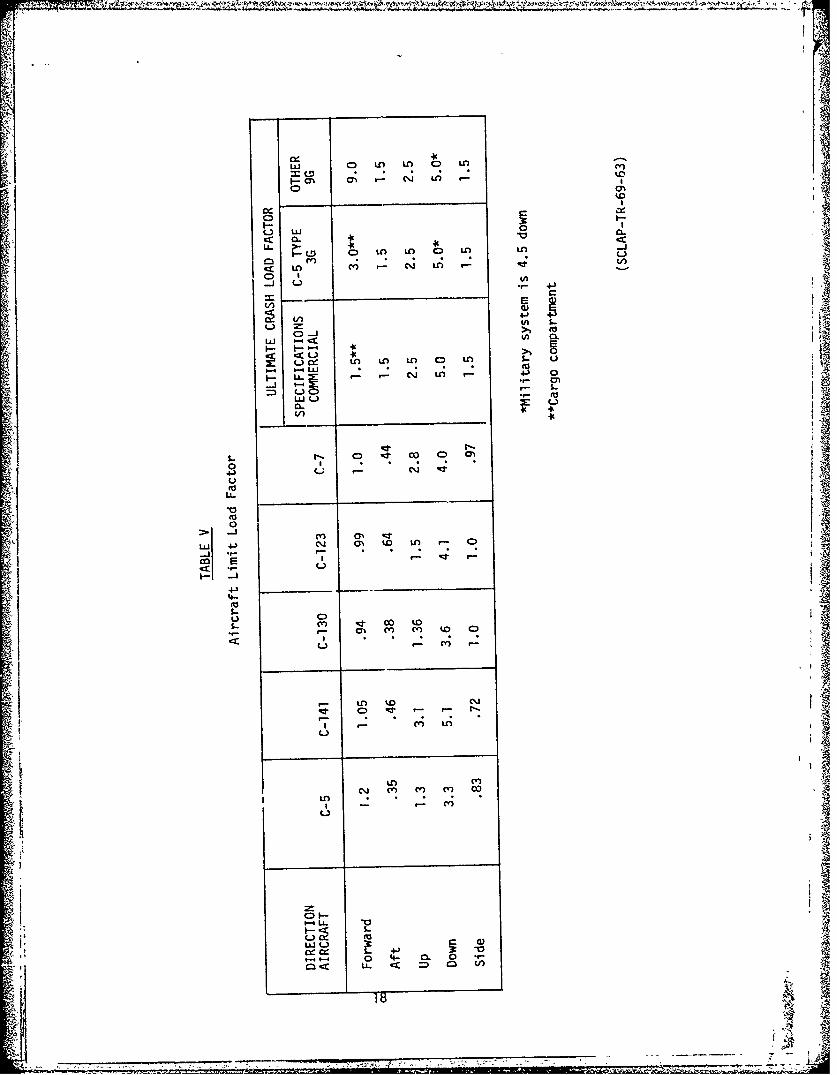
In November 1969, Lockheed-Georgia Company conducted a study for AirForce Systems Command as part of the USAF Mobility Support Forces StudyProgram. The prime objective of this effort was to provide weight andcosts incurred by the aircraft-installed material handling equipment undervarious conditions. The following aircraft were viewed: C-5, C-14r , C-130,C-123, and C-7. Four levels of restraint were identified. The first groupin Table V is that level of maximum acceleration that can be realized in
the cargo compartment without being in a failure condition. Any levelabove these would be a crash condition as defined in this report. Theselevels for all the aircraft studied are listed in Table V. The otherlevels were those proposed for Boeing 747 and Lockheed 500, as well asbasic military aircraft levels. These also have been presented in Table V.
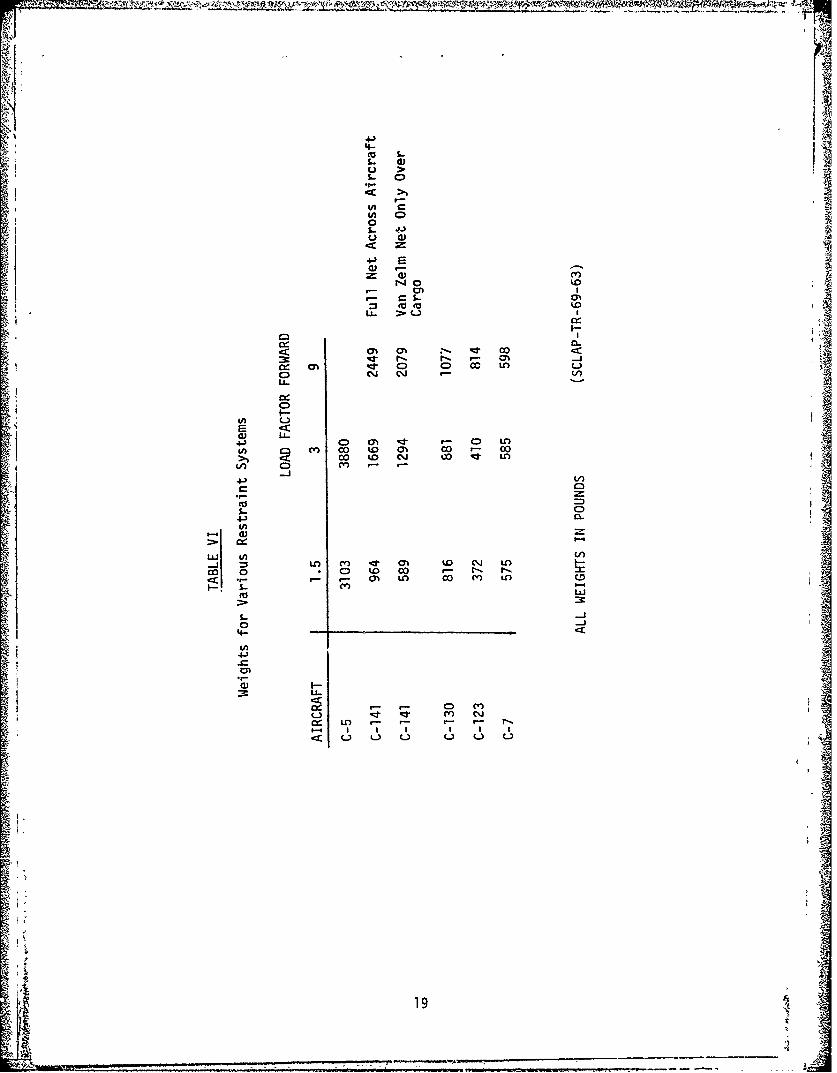
The cost estimates from this effort are not included as they would betotally unrealistic in today's time frame. To provide a relationship,weights are provided for each aircraft system and restraint load factor inTable VI. In the C-141, two sets of data are presented. One is for a fullface net across the entire aircraft fuselage. This is the type of net thatwould be required to meet full restraint requirements and is fully discussedin Section III. Basically, the cargo is secured at 3G with 9G protectionprovided by other means such as one of the barrier nets. The Van Zelm netin real use only covers the forward cargo load and does not prevent cargofrom flying over the first load.
17
-~, -~ -~ - -__--___--__ --
wn 0 ý UU 0
o 00
cm CEt o n
c,,
.J V) 4J
0-4
uCL 4O' O L C
(jl- U, U, U,) 00,
u ~ C) tuJ, ~4.
01 04__)___
co
0
Wj 4.) C~i ON to -
I- -_________________________to_______
F- S
C.. C Y) to CL)
'ptDC~
-: I-, P,
A 4 -)'4-
u >~
1- 0)
U>1
t4 0 tm
c. S- )
r-io co <
3cg r- -
(D Olbl:- ~ c i
U-
4-)0 C> 0* it C0 O
U)~0 rc#Q oi C - 00() 0CC) to g- o t L
C)
+)
WiwU('
LAJ w-(__ __ __ _
Ie r m k , L
01U
U-CD m
m. C')jL)O(
19
The Van Zelm design is also discussed in Section III. With the completionof this effort no challenge had been made to the original criteria. Untilthis point in time all effort seems to verify the criteria. Yet no oneasked the question; how often does this crash condition occur, what are therisks involved in movement at various G loads? In 1971 a joint AeronauticalSystems Division/AF Flight Dynamics Laboratory study effort was started todefine the various risk levels and resulted in Technical Reports AFFDL-TR-71-139and ASD-TR-73-17.
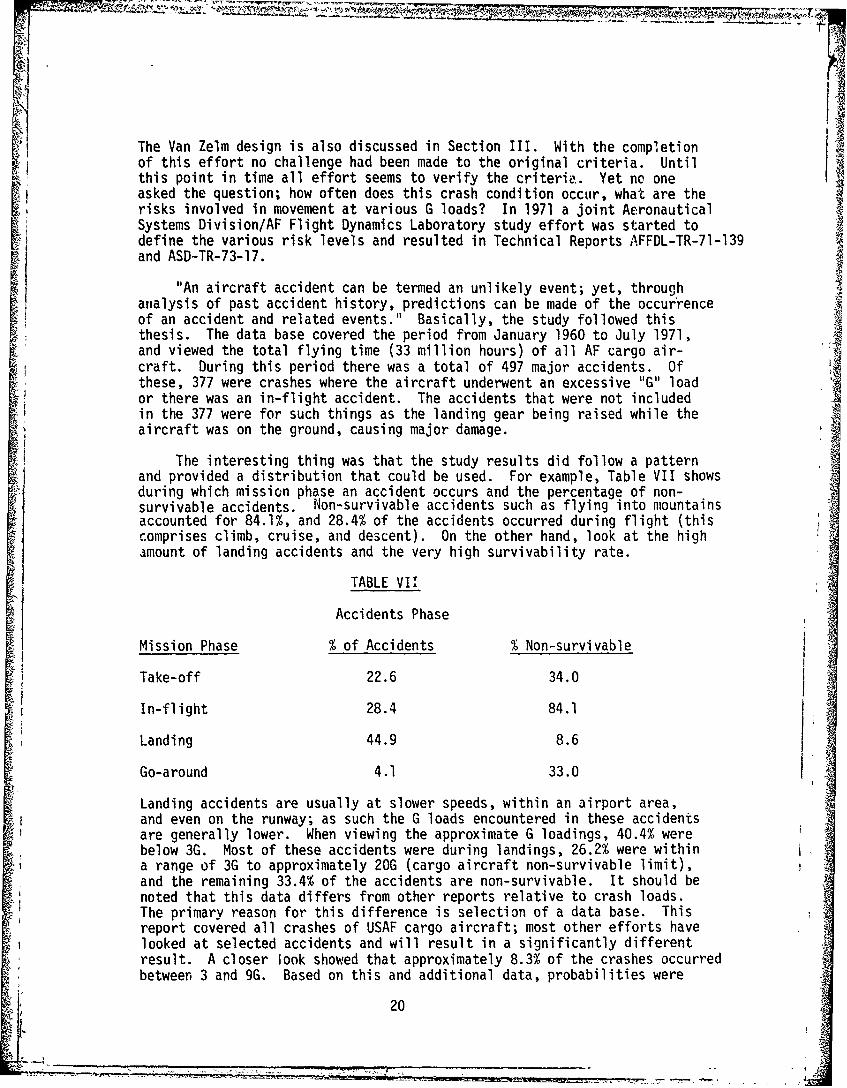
"An aircraft accident can be termed an unlikely event; yet, throughanalysis of past accident history, predictions can be made of the occurrenceof an accident and related events." Basically, the study followed thisthesis. The data base covered the period from January 1960 to July 1971,and viewed the total flying time (33 million hours) of all AF cargo air-craft. During this period there was a total of 497 major accidents. Ofthese, 377 were crashes where the aircraft underwent an excessive "G" loador there was an in-flight accident. The accidents that were not includedin the 377 were for such things as the landing gear being raised while theaircraft was on the ground, causing major damage.
The interesting thing was that the study results did follow a pattern
and provided a distribution that could be used. For example, Table VII showsduring which mission phase an accident occurs and the percentage of non-survivable accidents. Non-survivable accidents such as flying into mountainsaccounted for 84.1%, and 28.4% of the accidents occurred during flight (this
comprises climb, cruise, and descent). On the other hand, look at the highamount of landing accidents and the very high survivability rate.
TABLE VIT
Accidents Phase
Mission Phase % of Accidents % Non-survivable
Take-off 22.6 34.0
In-flight 28.4 84.1
Landing 44.9 8.6
Go-around 4.1 33.0
Landing accidents are usually at slower speeds, within an airport area,and even on the runway; as such the G loads encountered in these accidentsare generally lower. When viewing the approximate G loadings, 40.4% werebelow 3G. Most of these accidents were during landings, 26.2% were withina range of 3G to approximately 20G (cargo aircraft non-survivable limit),and the remaining 33.4% of the accidents are non-survivable. It should benoted that this data differs from other reports relative to crash loads.The primary reason for this difference is selection of a data base. Thisreport covered all crashes of USAF cargo aircraft; most other efforts havelooked at selected accidents and will result in a significantly differentresult. A closer look showed that approximately 8.3% of the crashes occurredbetween 3 and 9G. Based on this and additional data, probabilities were
20
that one crash would occur on an all cargo aircraft every 500,000 flights.If the flight was a mixed cargo/passenger mission, the possibility of crashwas one in every 1,500,000 flights. Between 3 and 9G, the probabilitiesthat a crash would occur on an all cargo aircraft is one in 1,500,000 flights. VOn a mixed cargo/passenger flight the possibility of crash is one in everyK 4,500,000 flights, again between 3 and 9G.
It became apparent we were operating under an extremely conservativecriteria, and that a reduction could be effected without much risk. Basedon this data, the Air Force, in December 1972, directed massive changes inthe restraint criteria. The change was to 3G with some exceptions.
Why change? The overriding factor was the low risk and a large costsavings potential. For example, under the old system, equipment that was tobe air transported, such as trucks, jeeps, AGE, etc., had to be built to a9G level although they seldom were. This requirement is now 3G, with arestraint reduction in design and production cost of the item. It can alsoresult in an item weight reduction. Another factor is that this now becomesa reasonable factor to design against. Tie-down on aircraft has also becomesimpler and another important facet is that nowall three cargo aircraft(C-130, C-141, and C-5) are rated at 3G for cargo. Another important areais in design of future cargo aircraft. These aircraft will be built with a3G rail onboard. In viewing the Advanced Medium STOL (first aircraft to bebuilt under the new criteria), it has been estimated the savings will be1000 pounds.
The most interesting factor found was the relationship between differentGs. At first glance that statement does not make sense. How can there bedifferent Gs? It is a question that has been with us for 35 years. Oneshould not talk in terms of Gs, but of force. During FAA crash tests, itwas found that instrumentation on pallet loads and seats recorded differentGs at the same lateral location in the aircraft. This can be explained asfollows: A seat is hard mounted to the aircraft floor while the pallet isfree to move on rollers within the rail system. This freedom allows theabsorption of energy as the pallet presses against the rail locks. Further,the shifting of cargo and give in the netting system acts in the same way.The result was that the cargo reacted to approximately one half the G forceof the seat. Another fact is that the crushing of the aircraft itself hasthe same effect, where the tail would see a very low G force compared tothe nose. An aircraft with 20G pilot seats, 16G passenger seats, and 9Gcargo restraint, is in reality compatible.
Throughout the history of doing this study many people could not relateto a G load. The following is to provide a basic guide of loads incurredduring various phases. In general, under a normal landing the G forces tendto be between 0.1 and O.2G; under an assault landing condition it is a littlehigher. The maximum landing loads that the C-130, C-141, and C-5 can gener-ate are 0.94, 1.05, and 1.20G, respectively. This is assuming full reversethrust, full braking, and a loose dirt runway. For any load above these,the aircraft is in a crash condition as defined by this report. This canalso be viewed as the distance required to stop these aircraft at variousG loads. Table VIII provides this information for three different landing
2
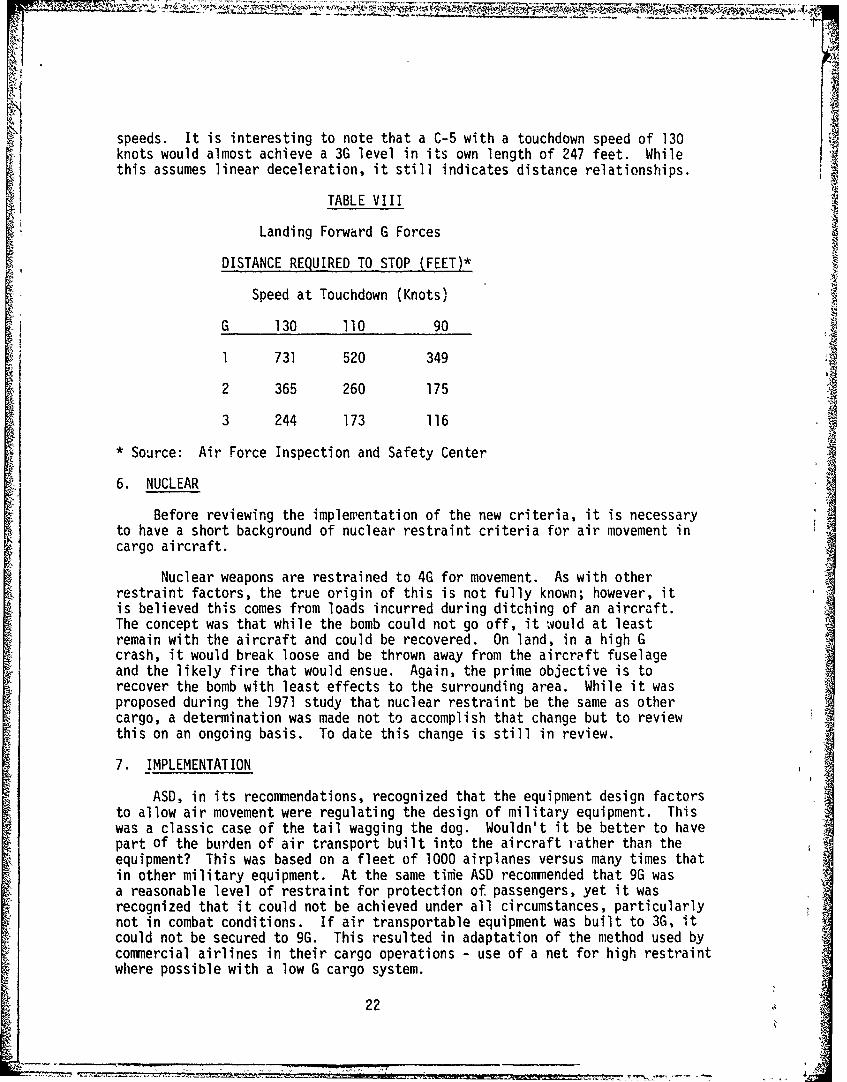
speeds. It is interesting to note that a C-5 with a touchdown speed of 130knots would almost achieve a 3G level in its own length of 247 feet. Whilethis assumes linear deceleration, it still indicates distance relationships.
TABLE VIII
Landing Forward G Forces
DISTANCE REQUIRED TO STOP (FEET)*
Speed at Touchdown (Knots)
G 130 110 90
1 731 520 349
2 365 260 175
3 244 173 116
* Source: Air Force Inspection and Safety Center
6. NUCLEAR
Before reviewing the implementation of the new criteria, it is necessaryto have a short background of nuclear restraint criteria for air movement incargo aircraft.
Nuclear weapons are restrained to 4G for movement. As with otherrestraint factors, the true origin of this is not fully known; however, itis believed this comes from loads incurred during ditching of an aircraft.The concept was that while the bomb could not go off, it would at leastremain with the aircraft and could be recovered. On land, in a high Gcrash, it would break loose and be thrown away from the aircraft fuselageand the likely fire that would ensue. Again, the prime objective is torecover the bomb with least effects to the surrounding area. While it wasproposed during the 1971 study that nuclear restraint be the same as othercargo, a determination was made not to accomplish that change but to reviewthis on an ongoing basis. To date this change is still in review.
7. IMPLEMENTATION
ASD, in its recommendations, recognized that the equipment design factorsto allow air movement were regulating the design of military equipment. Thiswas a classic case of the tail wagging the dog. Wouldn't it be better to havepart of the burden of air transport built into the aircraft rather than theequipment? This was based on a fleet of 1000 airplanes versus many times thatin other military equipment. At the same time ASD recommended that 9G wasa reasonable level of restraint for protection of passengers, yet it wasrecognized that it could not be achieved under all circumstances, particularlynot in combat conditions. If air transportable equipment was built to 3G, itcould not be secured to 9G. This resulted in adaptation of the method used bycommercial airlines in their cargo operations - use of a net for high restraintwhere possible with a low G cargo system.
22
However, because of landing on dirt runways, and assault landings, ASDand AFFDL proposed to maintain a minimum of 3G restraint criteria. Thiswas based on a landing mishap at 2G with a 1.5 safety factcr. Further,based on the very low risk factors, it was felt the then current systemwas over protective.
To meet the above, the USAF issued the following:
"ALMAJCOM 1882/72
1. Air cargo forward restraint criteria, with the exception of nu-clear weapons cargo, are lowered to a minimum of 3G. Nuclear weapons car-go will continue to be restrained to a minimum of 4G forward.
2. When passengers or nuclear weapons cargo are carried forward ofgeneral cargo, an HBU-8/A barrier net shall be positioned in front of thegenerdl cargo to achieve a minimum of 8G forward restraint.
3. Air transportability design requirements for items designed forair transport shall be revised to eliminate the 9G emergency forward re-straint criteria. The 3G forward flight and taxi load air transportabilitydesign equipment remain unchanged."
Further, in July 1974 and December 1972 two actions were taken by theChief of Staff that amended the original order as follows:
"The supplementary 8G forward restraint requirementfor cargo when personnel are seated in front of oralongside cargo, exclusive of missions carrying nu-clear cargo, may be waived to 3G only during thedeployment, employment or redeployment of US com-bat forces personnel and DOD civilians participat-ing in combat, contingency, joint airborne/air trans-portability training or exercise operations directedby major command or higher authority. Only essentialoperations, direct support, and command and controlpersonnel required to accompany the cargo on eachaircraft will be transported under this waiver."
It should be noted one error exists in the study, only major accidentswere examined. A large number of minor accidents occurred during the periodcovered by the study and these should have been included. The differencebetween a minor and major accident is basically related to man-hours to re-pair the aircraft or damaged beyond repair. For example, if man-hours ofrepair was less than 900 hours for a C-130, C-141, or C-5 but more than 150hours, it would be a minor accident, above the 900 hour level, a majoraccident. An example of a possible minor accident is landing with the gearup. Since most of these accidents are in the low G range it adds a conser-vative value to the original predictions. The review in Section IV has in-cluded all accidents.
23
8. SUMMARY
We assume from past reports that the 9G restraint criteria was basedon the degree of protection afforded passengers in the crash of an aircraft(C-46) at approximately 95 MPH, that the survivable limit is approximately
- 20G, that a relationship exists between the passenger and fuselage, andfuselage and cargo in the ratios of 1.2 - 1.8 to 1 and 1 to 0.5 respectively.Also a more compact fuselage such as a fighter can withstand higher G loadsand afford a much higher degree of protection than a larger cargo aircraft.
Finally restraint criteria in the past was based on providing maxi-mum possible protection without any relationship to occurrences .of crashes.
DACRON WEBBING NET
G.U-IDEIRESTRAINT RAILV
W( • ---LOAD LIMITER
I FLOOR TIE-DOWN
II
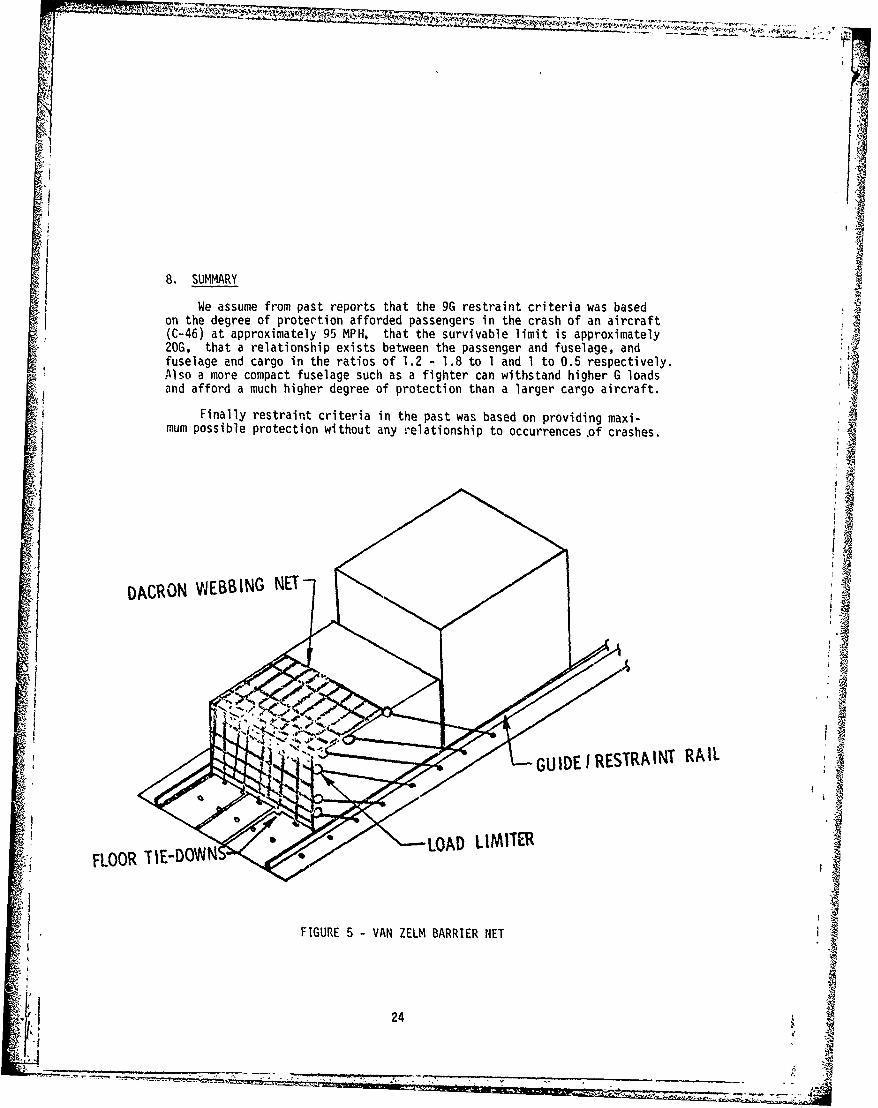
FIGURE 5 - VAN ZELM BARRIER NET
24
SECTION III
OPERATIONAL CONSIDERATIONS
SThe dvlpetof acriteria must also consider the real world
operational concepts and limitations.
:( I. CURRENT OPERATIONS
Currently all equipment that is designated air transportable is. built to meet the requirements of Specification MIL-A-8421, "Air
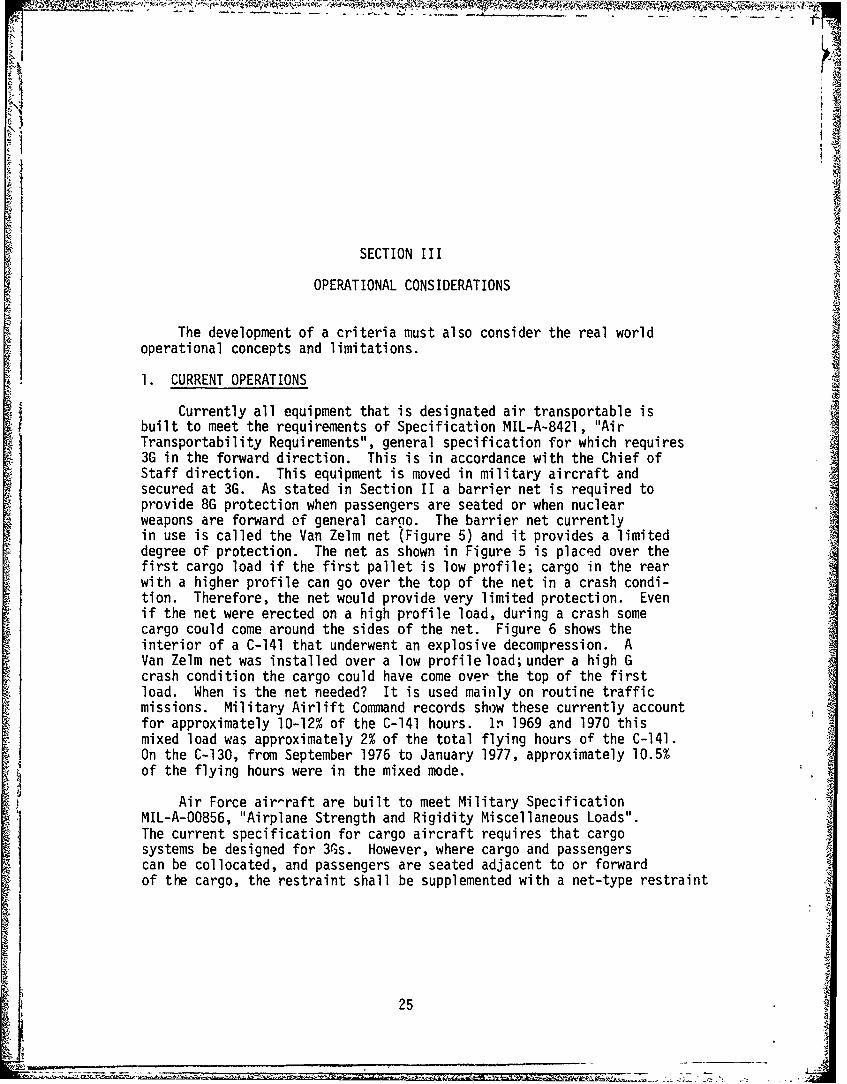
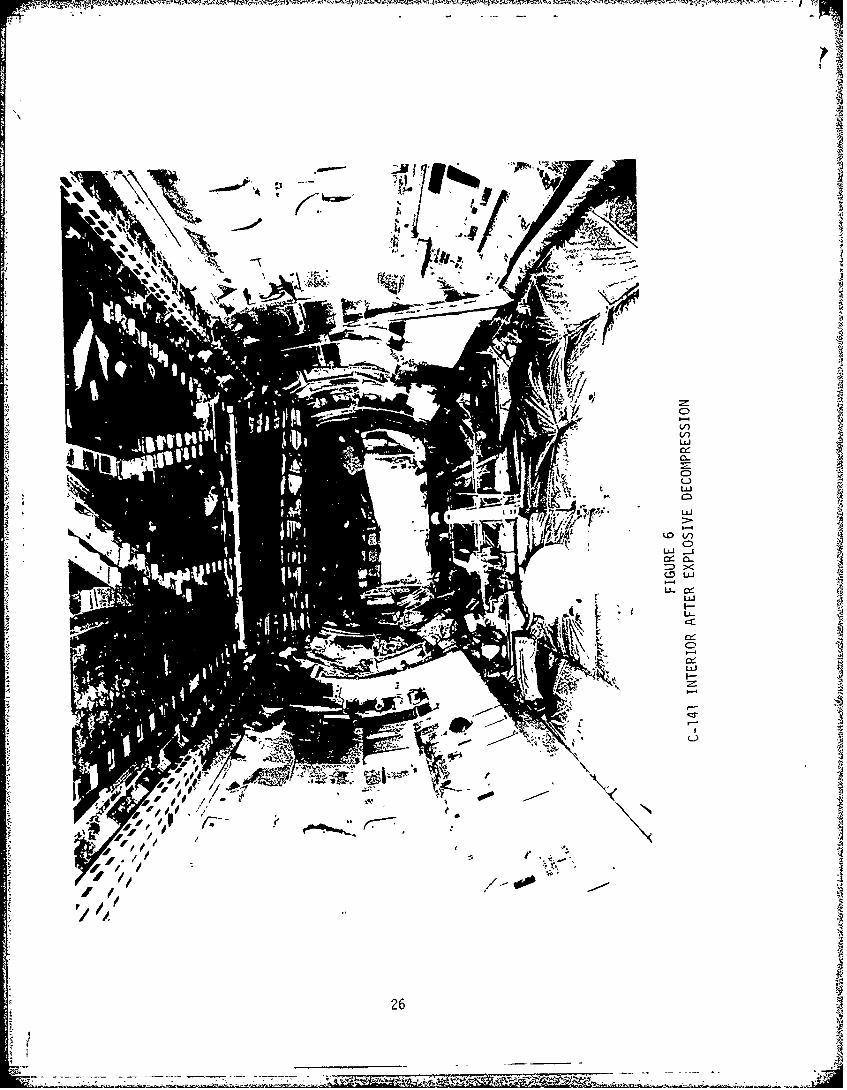
Transportability Requirements", general specification for which requires3G in the forward direction. This is in accordance with the Chief ofStaff direction. This equipment is moved in military aircraft andsecured at 3G. As stated in Section 11 a barrier net is required toprovide 8G protection when passengers are seated or when nuclearweapons are forward of general cargo. The barrier net currentlyin use is called the Van Zelm net (Figure 5) and it provides a limiteddegree of protection. The net as shown in Figure 5 is placed over thefirst cargo load if the first pallet is low profile; cargo in the rearwith a higher profile can go over the top of the net in a crash condi-tion. Therefore, the net would provide very limited protection. Evenif the net were erected on a high profile load, during a crash somecargo could come around the sides of the net. Figure 6 shows theinterior of a C-141 that underwent an explosive decompression. AVan Zelm net was installed over a low profile load; under a high Gcrash condition the cargo could have come over the top of the firstload. When is the net needed? It is used mainly on routine traffic •missions. Military Airlift Command records show these currently accountfor approximately 10-12% of the C-141 hours. In 1969 and 1970 thismixed load was approximately 2% of the total flying hours of the C-141.On the C-130, from September 1976 to January 1977, approximately 10.5%
! ~of the flying hours were in the mixed mode.
j ~Air Force air-raft are built to meet Military Specification
) MIL-A-O0856, "Airplane Strength and Rigidity Miscellaneous Loads".The current specification for cargo aircraft requires that cargosystems be designed for 3Gs. However, where cargo and passengerscan be collocated, and passengers are seated adjacent to or forward•
of the cargo, the restraint shall be supplemented with a net-type restraint
25
---•- "--- - ---.--. --------.----- - -
j
t - . 4;''r n
~~.JI
r./)
Lii
LLJJ
LL-wLLJ
IL-
A~t ~ .- * -
26
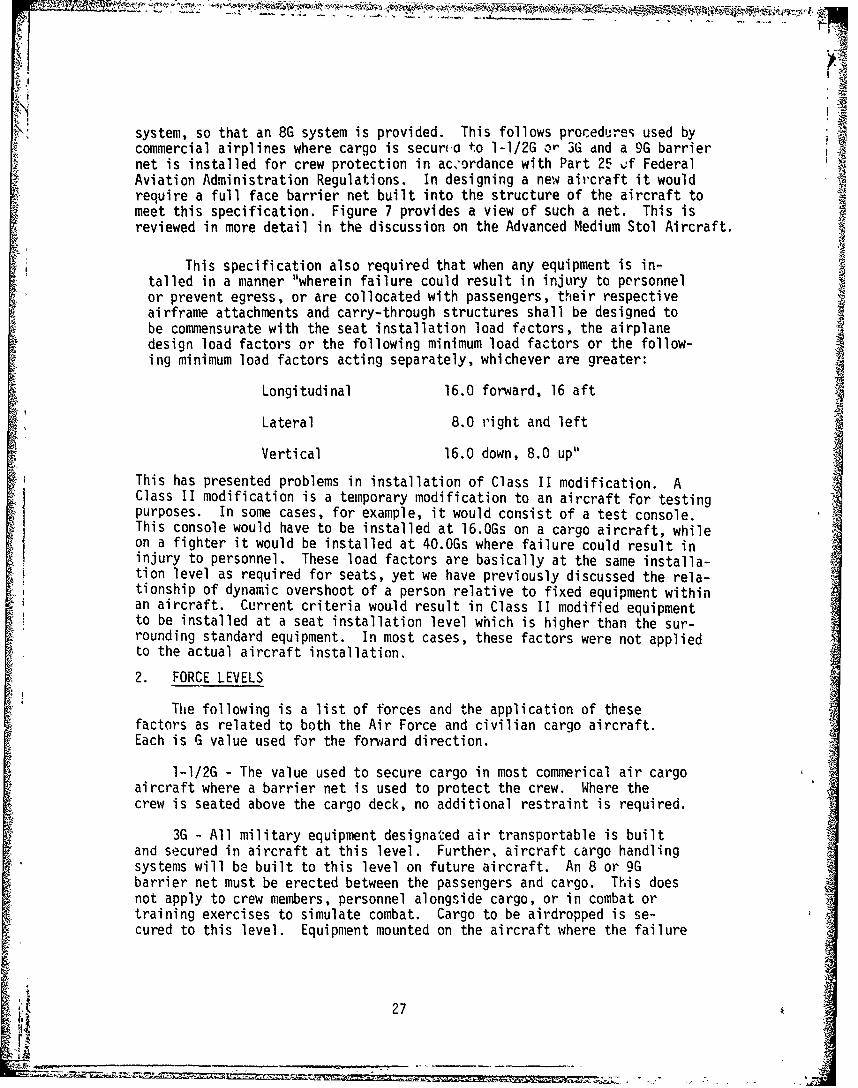
system, so that an 8G system is provided. This follows procedures used bycommercial airplines where cargo is secur(. to l-1/2G or 3G dnd a 9G barriernet is installed for crew protection in ac,'ordance with Part 2E of FederalAviation Administration Regulations. In designing a new aircraft it wouldrequire a full face barrier net built into the structure of the aircraft tomeet this specification. Figure 7 provides a view of such a net. This isreviewed in more detail in the discussion on the Advanced Medium Stol Aircraft.
This specification also required that when any equipment is in-tailed in a manner "wherein failure could result in injury to personnelor prevent egress, or are collocated with passengers, their respectiveairframe attachments and carry-through structures shall be designed tobe commensurate with the seat installation load factors, the airplanedesign load factors or the following minimum load factors or the follow-ing minimum load factors acting separately, whichever are greater:
Longitudinal 16.0 forward, 16 aft
Lateral 8.0 right and left
Vertical 16.0 down, 8.0 up"
This has presented problems in installation of Class II modification. AClass II modification is a temporary modification to an aircraft for testingpurposes. In some cases, for example, it would consist of a test console.This console would have to be installed at 16.0Gs on a cargo aircraft, whileon a fighter it would be installed at 40.OGs where failure could result ininjury to personnel. These load factors are basically at the same installa-tion level as required for seats, yet we have previously discussed the rela-tionship of dynamic overshoot of a person relative to fixed equipment withinan aircraft. Current criteria wou-ld result in Class II modified equipmentto be installed at a seat installation level which is higher than the sur-rounding standard equipment. In most cases, these factors were not appliedto the actual aircraft installation.
2. FORCE LEVELS
The following is a list of forces and the application of thesefactors as related to both the Air Force and civilian cargo aircraft.Each is G value used for the forward direction.
l-1/2G - The value used to secure cargo in most commerical air cargoaircraft where a barrier net is used to protect the crew. Where thecrew is seated above the cargo deck, no additional restraint is required.
3G - All military equipment designated air transportable is builtand secured in aircraft at this level. Further, aircraft cargo handlingsystems will be built to this level on future aircraft. An 8 or 9Gbarrier net must be erected between the passengers and cargo. This doesnot apply to crew members, personnel alongside cargo, or in combat ortraining exercises to simulate combat. Cargo to be airdropped is se-cured to this level. Equipment mounted on the aircraft where the failure
27
LI.,
LLI~
Cr-
28
N Iwill not result in injury or block egress to passengers or crew may beinstalled at this level.
4G - All nuclear weapons are secured to this level for air move-ment.
8G - The C-130 aircraft cargo handling system is built to this loadfactor. Until the advent of the C-141 aircraft, this was the primaryrestraint factor. The 463L cargo pallets are also built to this level.New pallets will be built to 3G.
9G - The C-141 aircraft cargo handling system was built to thisload factor to obtain civil aircraft certification. This level of pro-tection is also required for passengers seated forward of cargo. Thisis the required level for any barrier net system. In commercial air-craft, passenger and crew seats are secured to this factor as requiredby the Federal Aviation Administration.
[I lOG - Stowable and side facing troop seats are required to meetthis level.
16G - All fixed and removable miscellaneous equipment, which inthe event of a crash can insure personnel, must be secured to meet thislevel. Many passenger seats are built to this level for military use.
20G - If no seat specification is called for in the aircraft speci-¶ fication, such as the 16G seat, this load factor must apply, as well as
the level used for Air Force crew seats. This is generally consideredthe non-survivable limit crash load factor for cargo type aircraft.
40G - For aircraft other than cargo type aircraft where no seatspecification is stipulated, the seat must be capable of withstandingthis force level. This is considered the limit of human tolerarn:eand a person could survive a crash up to this level.
3. ADVANCED MEDIUM STOL AIRCRAFT (AMST)
The AMST presents a new problem relative to movement of personneland cargo. This wide body aircraft is configured to carry passengersalong the sides facing inward with cargo down the ceriter of the aircraft(Figure 8). Under some conditions, passengers may also be seated for-ward of cargo as is currently done on the C-130 and C-141.
To meet both the current operational requirements and the military,specification lowers the utilization of this aircraft. If cargo wereto be carried over the full length of the cargo compartment, no passengercould be seated alongside the cargo. Further, if only a partial cargoload was placed in the aircraft, a full net would be required. AllS~seats aft of the load position cannot be used and three feet forwardof the net cannot be used. This is to allow the net to move in a crash
29
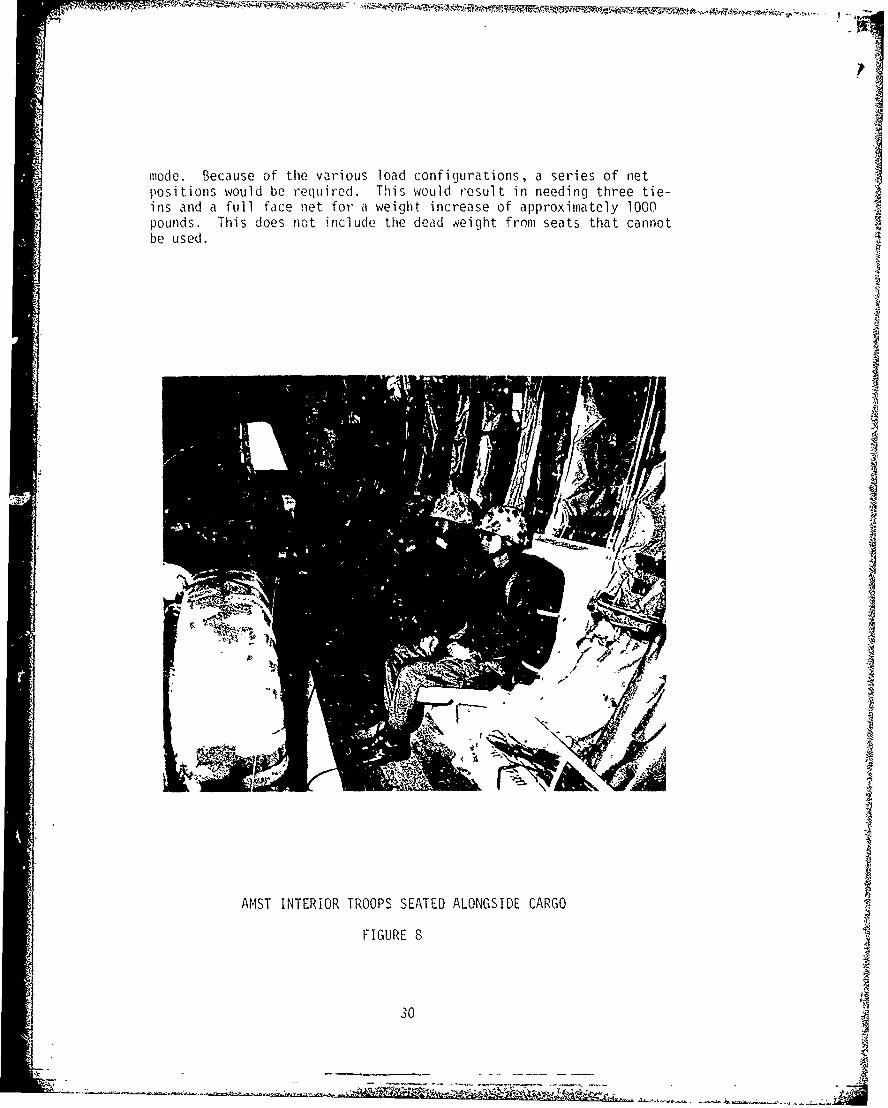
mode. Because of the various load configurations, a series of netpositions would be required. This would result in needing three tie-ins and a full face net for a weight increase of approximately 1000pounds. This does not include the dead oieight from seats that cannotbe used.
X
•I
•I
AMST INTERIOR TROOPS SEATED ALONGSIDE CARGO
FIGURE 8
30
4. SPACE SHUTTLE
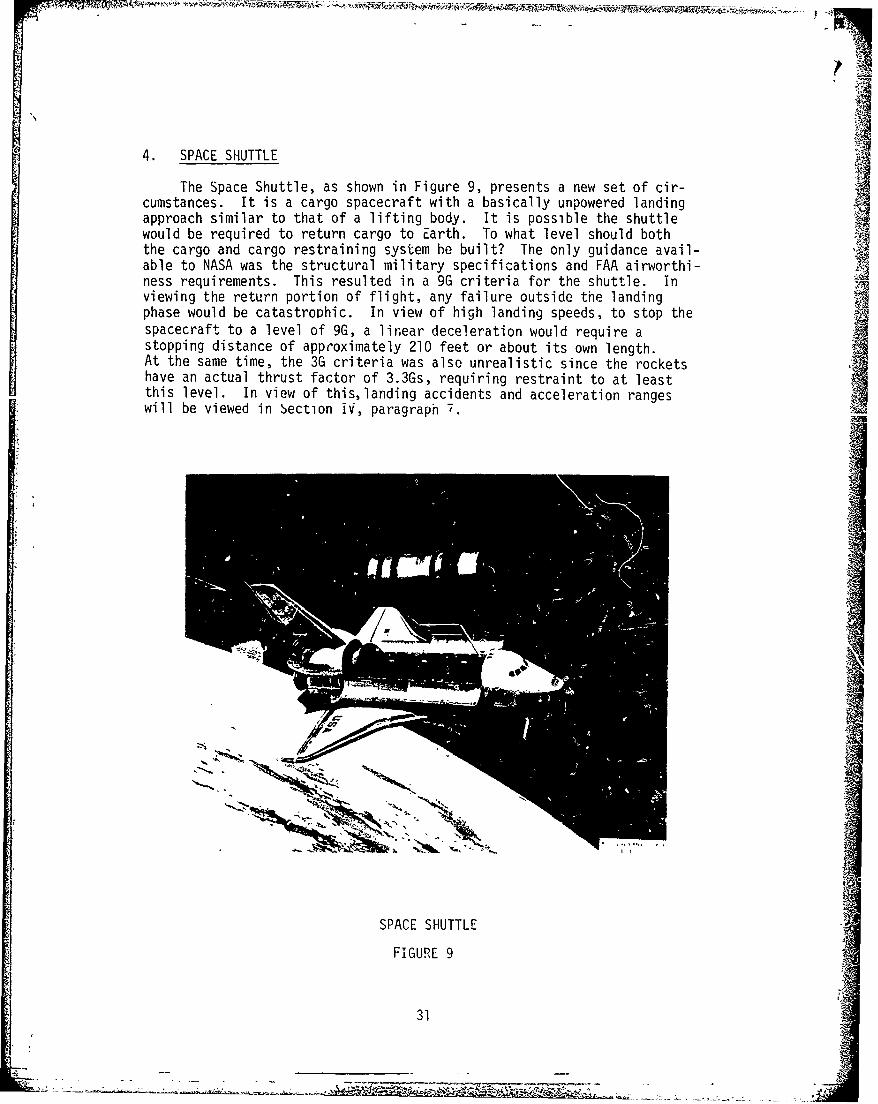
The Space Shuttle, as shown in Figure 9, presents a new set of cir-cumstances. It is a cargo spacecraft with a basically unpowered landingapproach similar to that of a lifting body. It is possible the shuttlewould be required to return cargo to Earth. To what level should boththe cargo and cargo restraining system he built? The only guidance avail-able to NASA was the structural military specifications and FAA airworthi-ness requirements. This resulted in a 9G criteria for the shuttle. Inviewing the return portion of flight, any failure outside the landingphase would be catastrophic. In view of high landing speeds, to stop thespacecraft to a level of 9G, a linear deceleration would require astopping distance of approximately 210 feet or about its own length.At the same time, the 3G criteria was also unrealistic since the rocketshave an actual thrust factor of 3.3Gs, requiring restraint to at leastthis level. In view of this,landing accidents and acceleration rangeswill be viewed in Section IV, paragraph 7.
SPACE SHUTTLE
FIGURE 9
31
SECTION IV
AIRCRAFT ACCIDENT DATA AND PREDICTIONS
In the original study AFFDL-TR-71-130, it was stated "an aircraftaccident can be termed an unlikely event; yet, through analysis of pastaccident history, predictions can be made of the occurrence of an acci-den-t Ad re!a'ted Anvntq". It appears that the predictions made in the1971 study were conservative in that the number and type of accidentshave remained within projected crash limits.
1. OBJECTIVE AND SCOPE
This re-examination of the same subject provides two opportunities,first to validate the projections provided in the original effort andsecond to broaden and correct the study base.
First, let us review the original effort from the viewpoint of anyneeded corrections. In the original effort, minor accidents were notincluded, those that underwent excessive forward G loadings should havebeen included to provide an overall viewpoint. While this has been donein this effort the effect will be to add a degree of conservatism to thedata base since accidents of this type are in the low G range. Anotherarea of concern has been the presentation of probabilities of relatedflights. An attempt was made to provide a more reasonable factor ratherthan flying hours. Several comments have been made to relate accidentprobabilities to sorties. However, this would be even less accurate thanuse of landings, since a sortie is made up of an unknown number of land-ings. Since many accidents occur during landings and touch and goes, itis not possible to form a consistent base for all of the data, all prob..abilities will be presented in terms of flying hours. The data from theoriginal study will be converted back into flying hours to provide abasis for comparison.
2. DATA REFERENCE
The data used includes the original set of data used in AFFDL-TR-71-139 and later on-going data to provide this update. The overallbase is as follows:
32
-111 r J
All major and minor accident data of Air Force Type C and T-29 air-craft from 1962 to July 1976 contained in the computerized accident datasystem maintained by the Deputy Inspector General for Inspection and Safety,USAF, Norton Air Force Base, California (IGDS) were used in the followinganalysis. Total flying hours, landings athd sorties were also obtained
from this system. Accident reports available at ASD were 64 consecutivemajor accident reports from late 1968 to February 1971 and 24 consecutivemj nd minor accidents from mid 1973 to July 1976.
3. AIRCRAFT ACCIDENTS
Air Force data is provided on all aircraft accidents and not crashes.For the purpose of this study a crash is defined as an excessive G forcein the forward direction. Within this data base the accidents are listeda- Pithpr mainr or minor with the difference being the number of hoursrequired to --pair the damage. The number of hours that set the categorylimit also vary according to the aircraft type. An accident can furthervary to an aircraft sitting in a hangar where an earthquake resulted inlight fixtures falling on the airplane causing minor damage or a mid-aircollision resulting in total loss of the aircraft where no ground crashoccurred; i.e., break up in air. These accidents have one item in common;they did not undergo any excessive forward G force. The total number ofaccidents from 1962 to July 1976 was 799 and of these, 461 were crashes.The following shows a relationship of these accidents to crashes from thedifferent studies conducted and explained in the report.
ACCIDENTS CRASHESMajor 1962 - July 1971 415 315
Major July 1971 - July 1976 61 55
Minor 1962 - July 1976 323 91
Total 1962 - July 1976 799 461
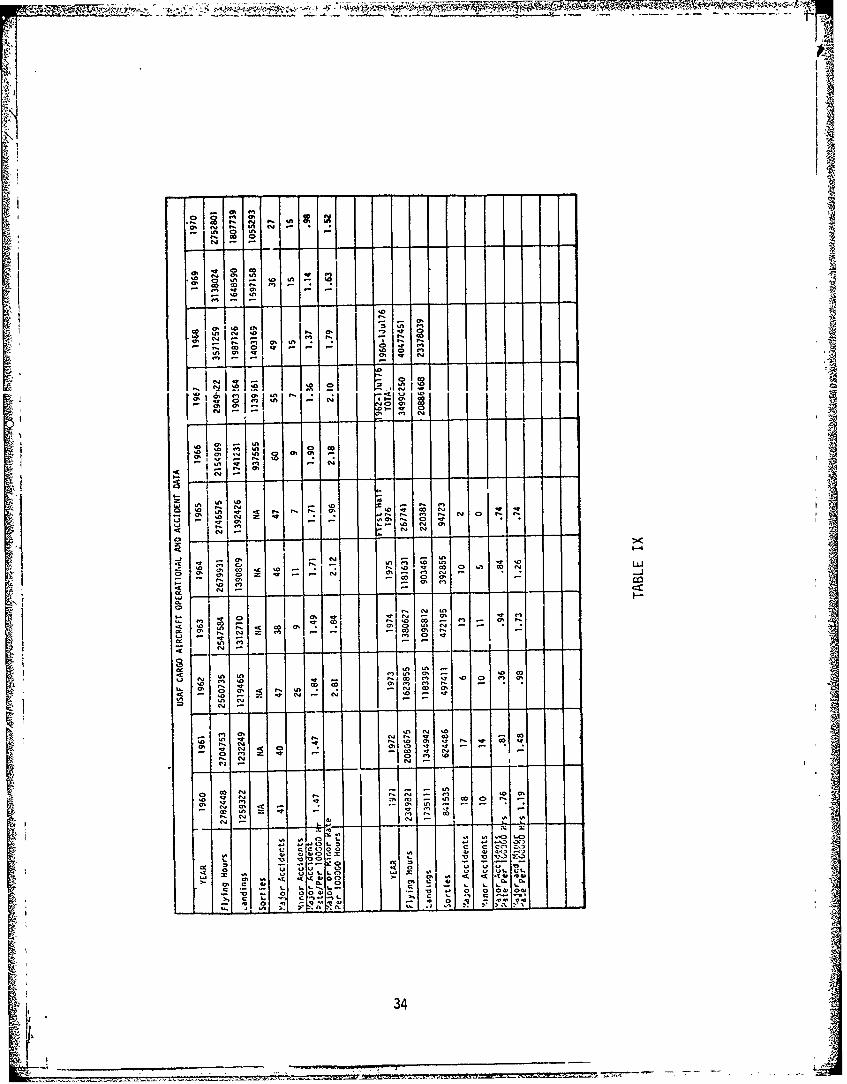
It can be seen, particularly in the minor accident category, far fewer ofthe accidents were crashes than in the major category. The time periodcovered includes both peacetime and combat operations and covers34,990,250 flying hours and 20,886,468 landings. The yearly totals areprovided in Table IX developed from AFISC data.
4. ACCIDENT DATA ANALYSIS
• Within this paragraph data from the original study will be providedfor comparison. Since that data was based on Ii.ajor accidents, the infor-mation will also be presented in both this manner and for total accidents.
33
4
41~ t- -
co o
E~In
c ,
Z~ In
0O0
iIn m
* IIx
W m2 ~ ~ ~ u 10c'o .3,N .N
Lo -t,-
-co
o o m 0 co 0 f
-03.1 Im
a:0ou u uN. imL 3 c cm u' I
0 o o o.0 - 0' N
3. o 0 3
1r ! > :7V a 0 0
- N34
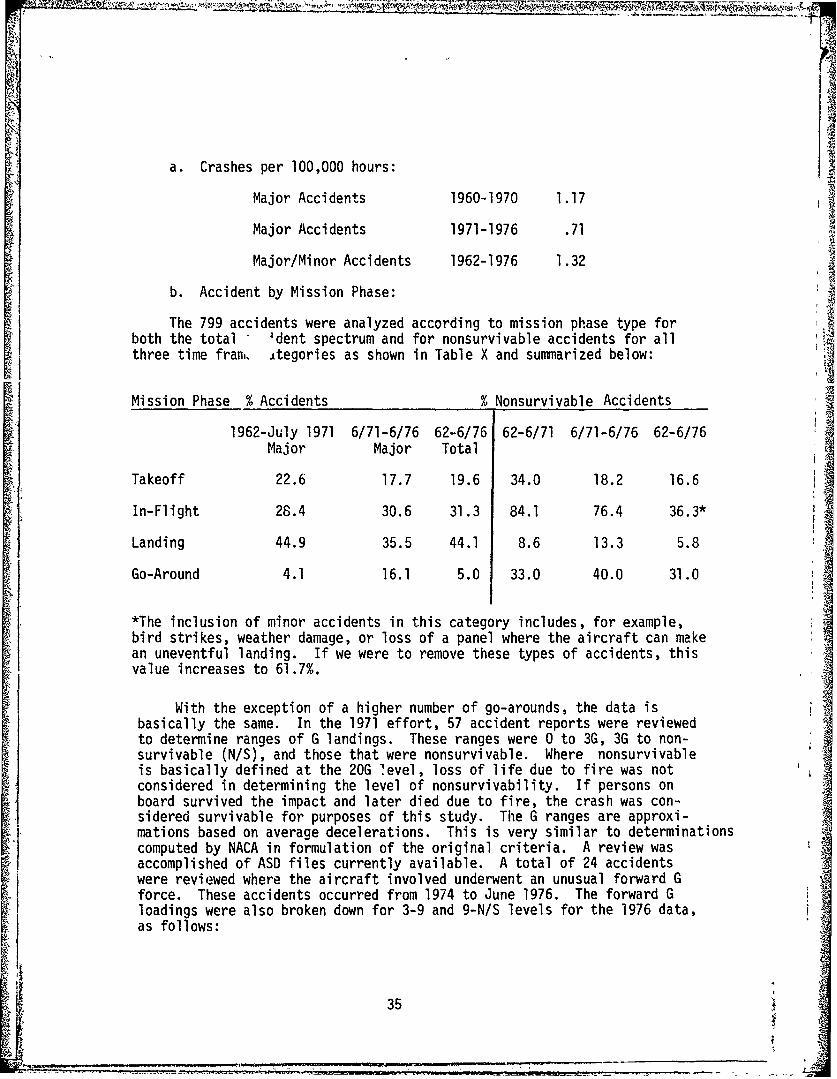
a. Crashes per 100,000 hours:
Major Accidents 1960-1970 1.17
Major Accidents 1971-1976 .71
Major/Minor Accidents 1962-1976 1.32
b. Accident by Mission Phase:
The 799 accidents were analyzed according to mission phase type forboth the total 4dent spectrum and for nonsurvivable accidents for allthree time fra,. Ategories as shown in Table X and summarized below:
Mission Phase % Accidents % Nonsurvivable Accidents
1962-July 1971 6/71-6/76 62-6/76 62-6/71 6/71-6/76 62-6/76
Major Major Total
Takeoff 22.6 17.7 19.6 34.0 18.2 16.6
In-Flight 28.4 30.6 31.3 84.1 76.4 36.3*
Landing 44.9 35.5 44.1 8.6 13.3 5.8
Go-Around 4.1 16.1 5.0 33.0 40.0 31.0
*The inclusion of minor accidents in this category includes, for example,bird strikes, weather damage, or loss of a panel where the aircraft can makean uneventful landing. If we were to remove these types of accidents, thisvalue increases to 61.7%.
With the exception of a higher number of go-arounds, the data isbasically the same. In the 1971 effort, 57 accident reports were reviewed
to determine ranges of G landings. These ranges were 0 to 3G, 3G to non-survivable (N/S), and those that were nonsurvivable. Where nonsurvivableis basically defined at the 20G level, loss of life due to fire was notconsidered in determining the level of nonsurvivability. If persons onboard survived the impact and later died due to fire, the crash was con-sidered survivable for purposes of this study. The G ranges are approxi-mations based on average decelerations. This is very similar to determinationscomputed by NACA in formulation of the original criteria. A review wasaccomplished of ASD files currently available. A total of 24 accidentswere reviewed where the aircraft involved underwent an unusual forward Gforce. These accidents occurred from 1974 to June 1976. The forward Gloadings were also broken down for 3-9 and 9-N/S levels for the 1976 data,as follows:
35
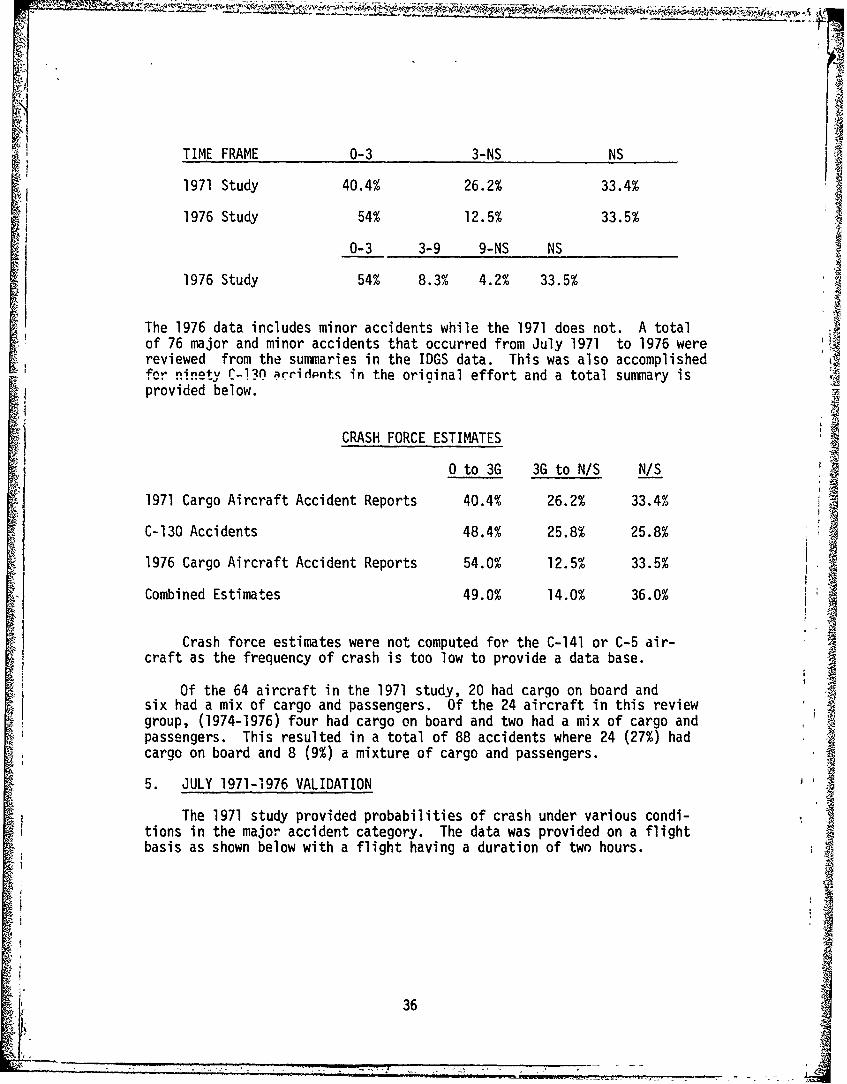
TIME FRAME 0-3 3-NS NS1971 Study 40.4% 26.2% 33.4%
•!0-3 3-9 9-NS NS
1976 Study 54% 8.3% 4.2% 33.5%
The 1976 data includes minor accidents while the 1971 does not. A totalof 76 major and minor accidents that occurred from July 1971 to 1976 werereviewed from the summaries in the IDGS data. This was also accomplished
S....,, r-iRn cridrints in the original effort and a total summary is! provided below.
r bCRASH FORCE ESTIMATES
_ _0 to 3G 3G to NIS NIS
1971 Cargo Aircraft Accident Reports 40.4% 26.2% 33.4%
C-130 Accidents 48.4% 25.8% 25.8%
1976 Cargo Aircraft Accident Reports 54.0% 12.5% 33.5%
Combined Estimates 49.0% 14.0% 36.0%
Crash force estimates were not computed for the C-141 or C-5 air-craft as the frequency of crash is too low to provide a data base.
Of the 64 aircraft in the 1971 study, 20 had cargo on board andsix had a mix of cargo and passengers. Of the 24 aircraft in this reviewgroup, (1974-1976) four had cargo on board and two had a mix of cargo andpassengers. This resulted in a total of 88 accidents where 24 (27%) hadcargo on board and 8 (9%) a mixture of cargo and passengers.
5. JULY 1971-1976 VALIDATION
The 1971 study provided probabilities of crash under various condi-tions in the major accident category. The data was provided on a flightbasis as shown below with a flight having a duration of two hours.
36
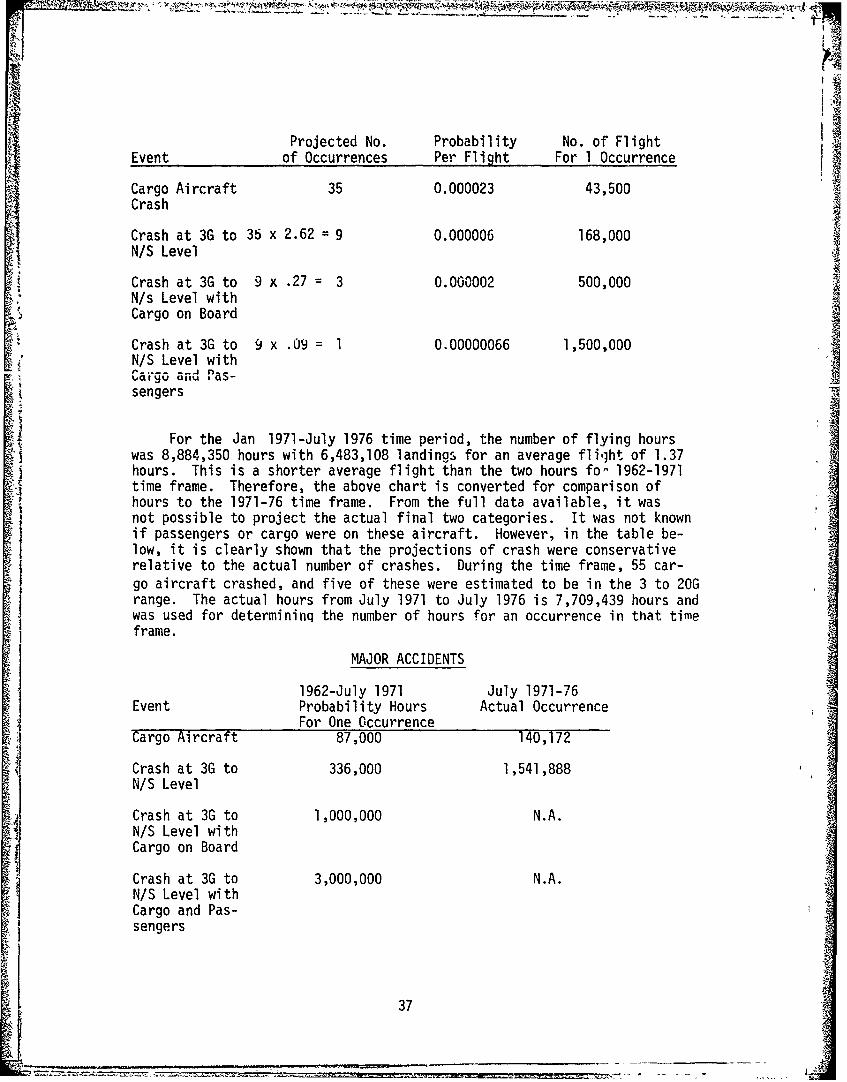
Projected No. Probability No. of FlightEvent of Occurrences Per Flight For 1 Occurrence
Cargo Aircraft 35 0.000023 43,500Crash
Crash at 3G to 35 x 2.62 = 9 0.000006 168,000N/S Level
!•Crash at 3G to 9 x .27 :3 0.000002 500,000
N/s Level withCargo on Board
Crash at 3G to 9 x .09 = 1 0.00000066 1,500,000N/S Level withCa[-jrj ,,r-- as-sengers
For the Jan 1971-July 1976 time period, the number of flying hourswas 8,884,350 hours with 6,483,108 landings for an average fli.1ht of 1.37hours. This is a shorter average flight than the two hours fo- 1962-1971time frame. Therefore, the above chart is converted for comparison ofhours to the 1971-76 time frame. From the full data available, it wasnot possible to project the actual final two categories. It was not knownif passengers or cargo were on these aircraft. However, in the table be-low, it is clearly shown that the projections of crash were conservativerelative to the actual number of crashes. During the time frame, 55 car-go aircraft crashed, and five of these were estimated to be in the 3 to 20Grange. The actual hours from July 1971 to July 1976 is 7,709,439 hours andwas used for determininq the number of hours for an occurrence in that timeframe.
MAJOR ACCIDENTS
1962-July 1971 July 1971-76Event Probability Hours Actual Occurrence
For One OccurrenceCargo Aircraft 87,000 140,172
Crash at 3G to 336,000 1,541,888N/S Level
Crash at 3G to 1,000,000 N.A.N/S Level withCargo on Board
Crash at 3G to 3,000,000 N.A.N/S Level withCargo and Pas-sengers
37
• .• -- .. . - - • , L , •... .... . . . . ... • _ -•, --- - ,- - -
.- A-
Of the 24 accidents in the range below the N/S level no injuries orfatalities were recorded as a result of moving cargo. The Air Force Inspec-tion and Safety Center, in a review of C-130 aircraft, found that in a 1972crash a loadmaster was injured from shifted cargo and in a 1975 crash aloadmaster received major injuries when equipment broke loose.
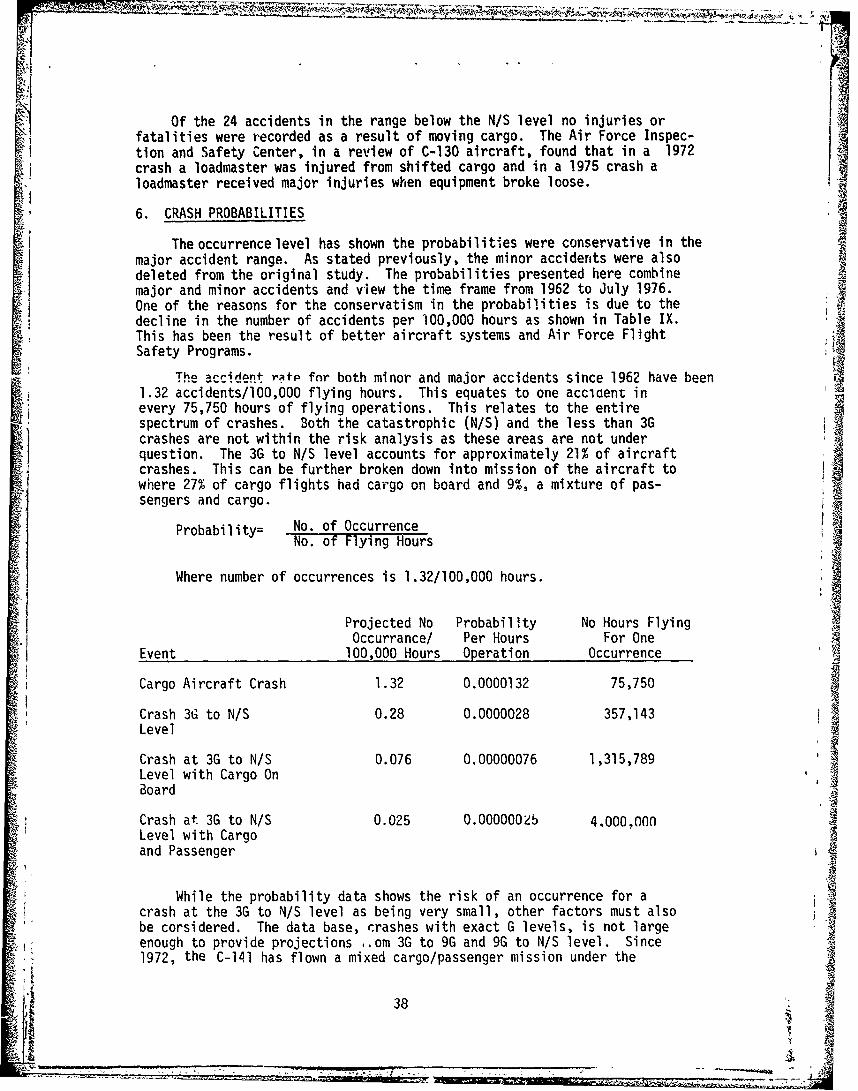
6. CRASH PROBABILITIES
The occurrence level has shown the probabilities were conservative in themajor accident range. As stated previously, the minor accidents were alsodeleted from the original study. The probabilities presented here combinemajor and minor accidents and view the time frame from 1962 to July 1976.One of the reasons for the conservatism in the probabilities is due to thedecline in the number of accidents per 100,000 hours as shown in Table IX.This has been the result of better aircraft systems and Air Force Flight (Safety Programs.
Theocrident r•tA for both minor and major accidents since 1962 have been1.32 accidents/l00,000 flying hours. This equates to one acciaent inevery 75,750 hours of flying operations. This relates to the entire 4
spectrum of crashes. Both the catastrophic (N/S) and the less than 3Gcrashes are not within the risk analysis as these areas are not underquestion. The 3G to N/S level accounts for approximately 21% of aircraftcrashes. This can be further broken down into mission of the aircraft towhere 27% of cargo flights had cargo on board and 9%, a mixture of pas-sengers and cargo.
Probability= No. of OccurrenceNo. of Flying Hours
Where number of occurrences is 1.32/100,000 hours.
Projected No Probability No Hours FlyingOccurrance/ Per Hours For One
Event 100,000 Hours Operation Occurrence
Cargo Aircraft Crash 1.32 0.0000132 75,750
Crash 3G to N/S 0.28 0.0000028 357,143Level
Crash at 3G to N/S 0.076 0.00000076 1,315,789Level with Cargo OnBoard
Crash at 3G to N/S 0.025 0.000000zb 4,000.000Level with Cargoand Passenger
While the probability data shows the risk of an occurrence for a icrash at the 3G to N/S level as being very small, other factors must also Abe corsidered. The data base, crashes with exact G levels, is not largeenough to provide projections .. om 3G to 9G and 9G to N/S level. Since1972, the C-141 has flown a mixed cargo/passenger mission under the
38
777 7-
current requirement for a net. This mission accounts for approximately 12%of the C-141 flying hours and from July 1971 to July 1976, it is 1.7% of theAir Force cargo aircraft mission. Both of these factors would tend to increasesignificantly the number of flying hours for one occurrence. For example, ifthese factors are used the following results. Of the 24 accidents in the1974 to July 1976 time frame, 8.3% were between 3-9G and 37.7% ftim 9 to N/Slevel. This would result in a crash potential of one in 4,347,826 hours ofoperation for a crash between 3G and 9G with cargo on board. In this samecrash level, but with a mix of cargo and passengers, the crash potentialbecomes one in 21,008,403 hours of flying.
* The Air Force Inspection and Safety Center also accomplished a reviewof C-130 accidents over a ten year time frame. These accidents were ofdestroyed aircraft from 1967 through 1976, for a total of 33 occurrences.This data only related to destroyed aircraft and is not comparable to thedata presented elsewhere in this study. Of these aircraft, four had G forcesbelow 3G, 19 between J ana 2OGs, and Len uvet 2OGs.
If the above data were viewed with the Military Airlift Command's approx-imate 10% passenger/cargo mix for the C-130, the number of flying hours forone occurrence is one in 2,900,000 hours of operation. This aircraft is agood example when viewing the tactical type of cargo aircraft.
In examining the AMST, several assumptions can be made to determinepotential crash in which a barrier net would be used. The trend for air-craft crashes has been decreasing and we can assume the AMST being a moreadvanced aircraft with improved flying qualities and slower landing speedswould have a good safety record. The trend of accident rates has been down-ward as shown in Figure 10. For this projection of a crash level of oneper 100,000 hours is assumed. While the current projected usage of the air-craft does not include routine channel traffic, it must be assumed it wouldbe used in this configuration in the future and at the same level as theC-141 or 10%. The net is of value only for the 3G to 9G level, to add con-servation to the projection. The crash force level of 3G to N/S level isused and at a 20% of all crash rate. This results in a orobability ofoccurrance of one crash per 5,000,000 flying hours, with cargo and passengersmixed in the routine channel traffic mission.
7. LANDING ACCIDENTS
Using the data from July 1971 to July 1976, a review was made of alllanding accidents to determine G ranges. During this time period, a totalof 29 crashes occurred. Of these, 26 were less than 3Gs while the rermain-ing three were in the N/S range. Most landing crashes are of a naturewhere the gear failed or a belling landing occurred. This results in theaircraft skidding down the runway for a considerable distance with a lowforward G factor.8. ACCIDENT TRENDS
The accident level relative to flying hours has, to a degree, de-creased over the past few years as shown in Figure 10. This level isapproximately one-half of the level in the 1960's. In viewing the overall
-, o -39
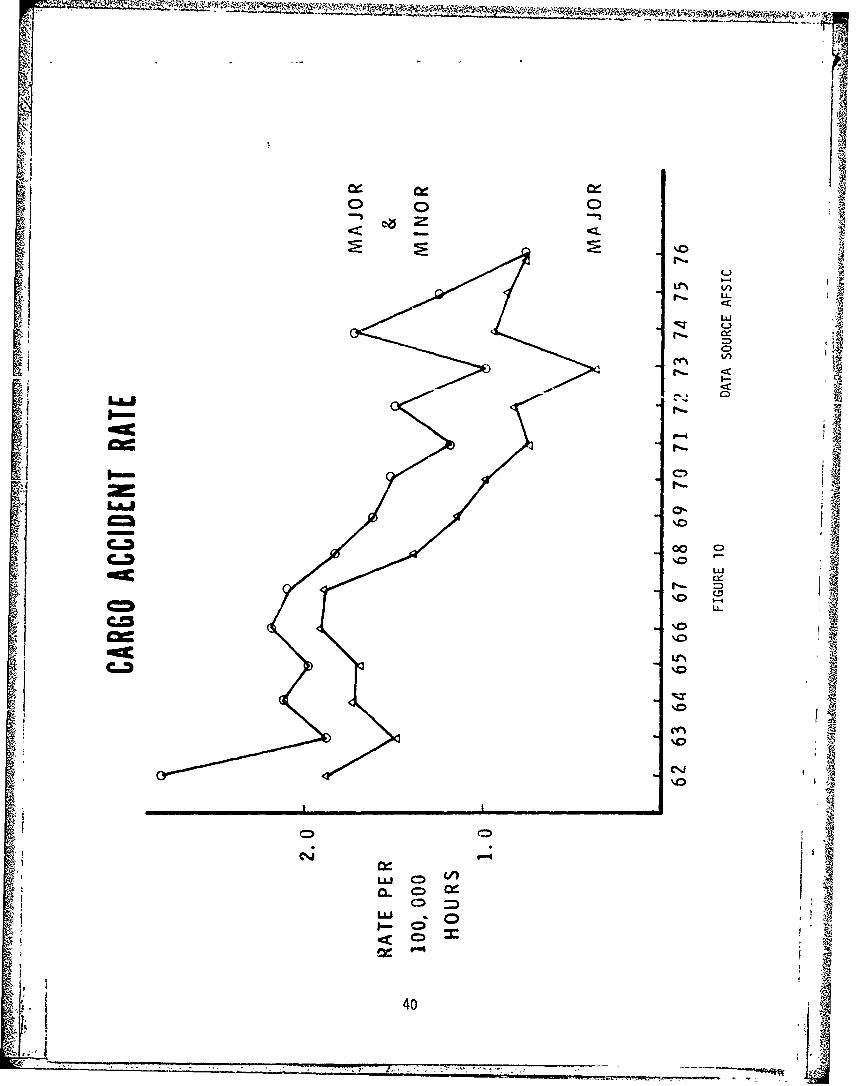
WC-,
IND
t-.
C.1
C- c1-
LII -Lci
I-<
40.
accident trend, most crashes occur either below 3Gs or in the nonsurvivablerange. The area in between has a very low incident rate.' This is due toimpact speed and angle of impact to meet this range. For example, asshown in Figure 11 for a 4 to 8 degree angle of impact, a 3-9"G" crashoccurs between 70 and 105 knots. Had the angle of impact been differentwith the same airspeeds, the crash force would be different. If an aircraftcrashed at an angle of 1 degree on a runway (belly landing), the "G" loadingswould be extremely low; yet if the angle of impact was 90 degrees, the
10 TO 22 FT
LONGITUDINAL ACCELEROMETER --. I
S- DEGREES TERRAIN .E
20
4!
1- 1Ax GMA
S~ACCELERATION
DURATION
0 5I:• sv / AsrRJ'O - DC-7
NACA DATA - C-46 -8SJet Fighter
0 40 80 120 160
INITIAL IMPACT VELOCITY - MPH
FIGURE 11 - FORWARD FUSELAGE LONGITUDINAL ACCELERATIONMEASUREMENTS IN LOW ANGLE IM4PACTS (USAAVLABS TR 67-16)
41
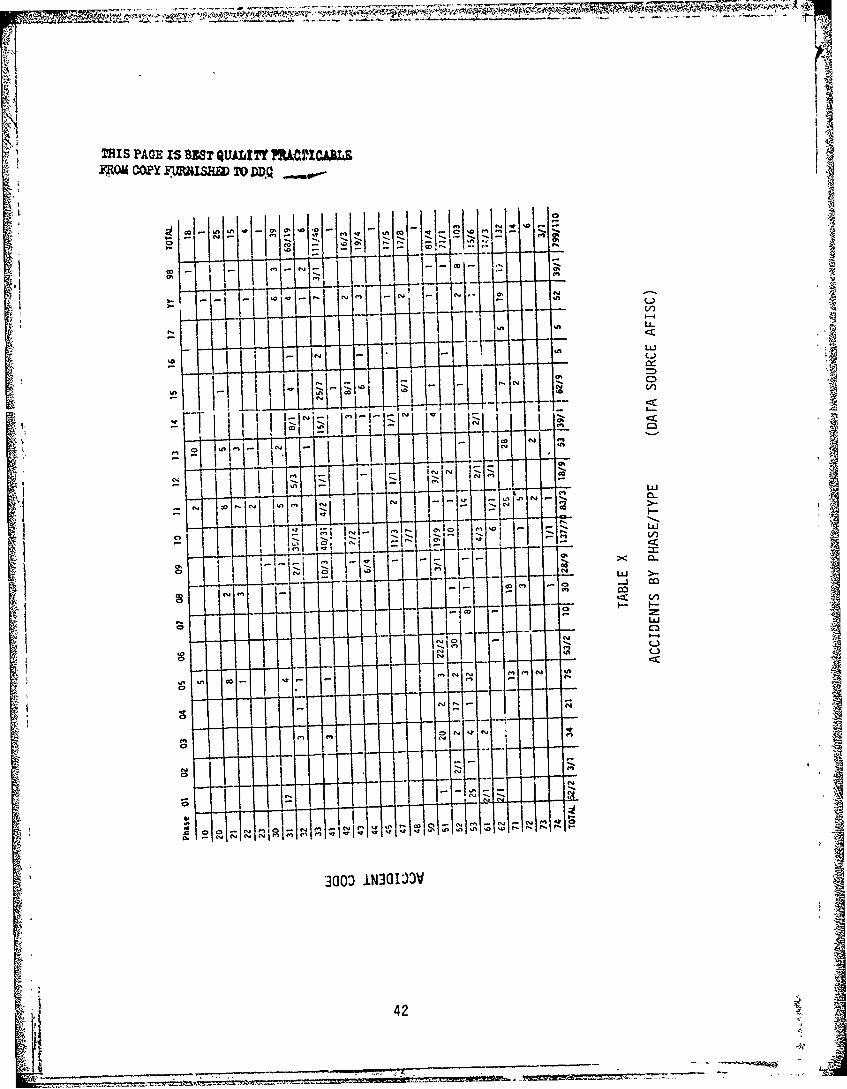
- -~ -N s"'~ q
TB IS PAGE is 335? QUAW Y UIIOt?~1AXLMROJ COPY FlAW1SM TO DD.Q
CIDI
V)
WI LL.-
Lii
coc
coI
WIIC-)L
C-4)
3003 IN3GL)3V
42
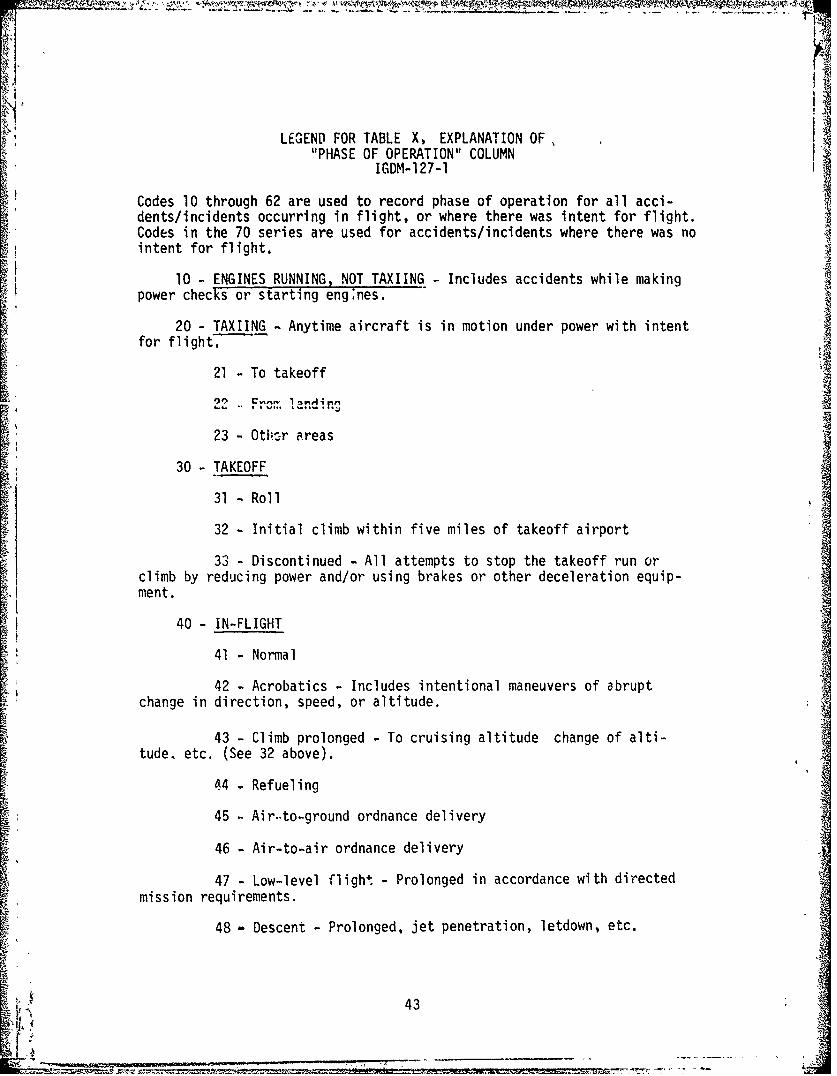
LEGEND FOR TABLE X, EXPLANATION OF,"PHASE OF OPERATION" COLUMN
IGDM-127-1
Codes 10 through 62 are used to record phase of operation for all acci-dents/incidents occurring in flight, or where there was intent for flight.Codes in the 70 series are used for accidents/incidents where there was nointent for flight.
10 - ENGINES RUNNING, NOT TAXIING - Includes accidents while making
power checks or starting eng;nes.
20 - TAXIING - Anytime aircraft is in motion under power with intentfor flight.
21 -To takeoff
23- Otikr areas
30 - TAKEOFF31 - Roll
32 - Initial climb within five miles of takeoff airport
33 - Discontinued -All attempts to stop the takeoff run orclimb by reducing power and/or using brakes or other deceleration equip-ment.
40 - IN-FLIGHT
41 - Normal
42 - Acrobatics - Includes intentional maneuvers of abruptchange in direction, speed, or altitude.
43 - Climb prolonged - To cruising altitude change of alti-tude. etc. (See 32 above).
44 ý Refueling
45 - Air-.to-ground ordnance delivery
46 - Air-to-air ordnance delivery
47 - Low-level flight - Prolonged in accordance with directedmission requirements.
48 - Descent - Prolonged, jet penetration, letdown, etc.
43
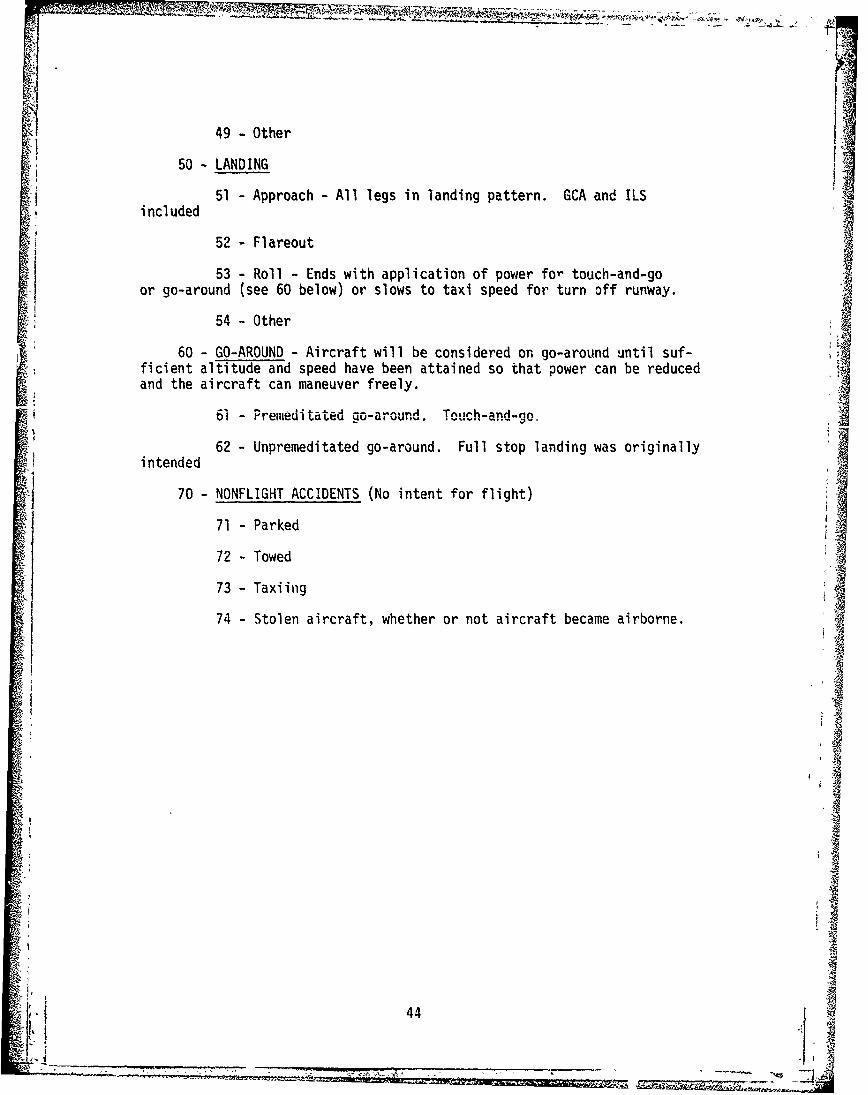
49 -Other
50 LANDING
51 - Approach - All legs in landing pattern. GCA and ILSincluded
52 - Flareout
53 - Roll - Ends with application of power for touch-and-goor go-around (see 60 below) or slows to taxi speed for turn off runway.
54 - Other
60 - GO-AROUND -Aircraft will be considered on go-around until suf-ficient altitude and speed have been attained so that power can be reducedand the aircraft can maneuver freely.
61 - Premeditated ao-around. Touch-and-go.
iee 62 - Unpremeditated go-around. Full stop landing was originally•I intended
70 - NONFLIGHT ACCIDENTS (No intent for flight)71 - Parked
72 - Towed
73 - Taxiing
74 - Stolen aircraft, whether or not aircraft became airborne.
i41'
g,[ ' g
qI
44i4
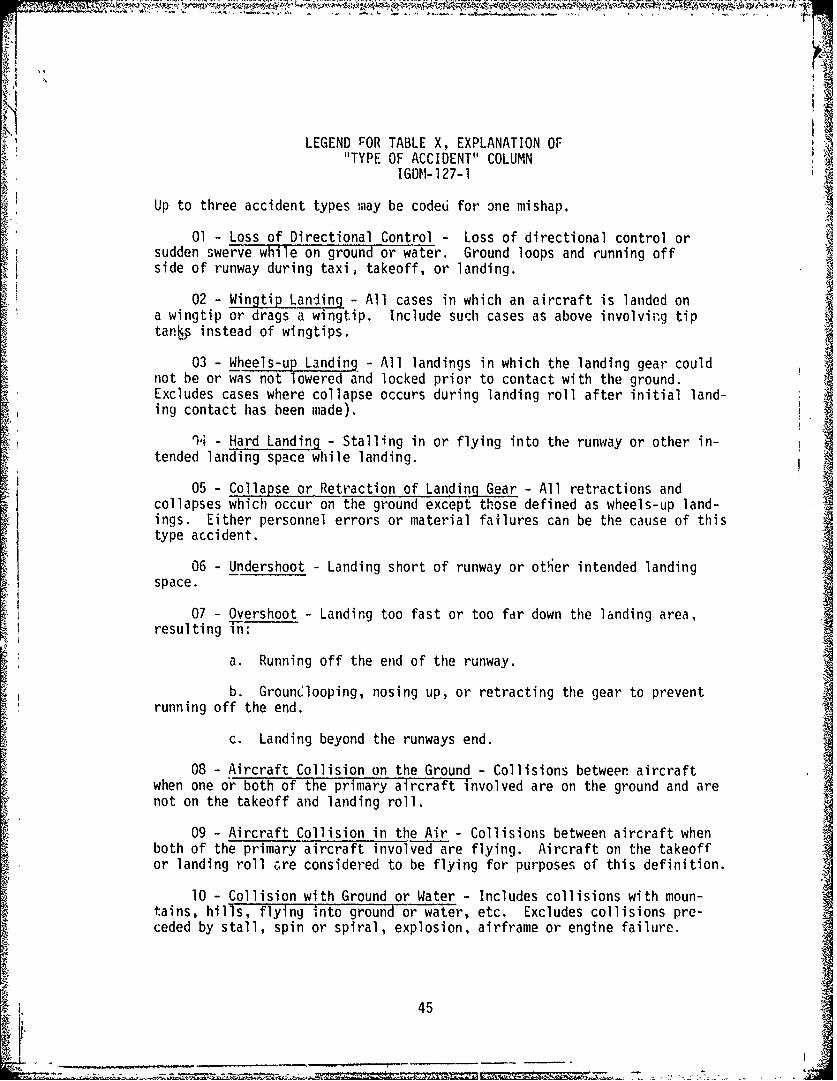
LEGEND FOR TABLE X, EXPLANATION OF"TYPE OF ACCIDENT" COLUMN
IGDM- 127-1
Up to three accident types may be coded for one mishap.
01 - Loss of Directional Control - Loss of directional control orsudden swerve while on ground or water. Ground loops and running offside of runway during taxi, takeoff, or landing.
02 - Wingtip Landing - All cases in which an aircraft is landed ona wingtip or drags a wingtip. Include such cases as above involving tiptans instead of wingtips.
03 - Wheels-up Landing - All landings in which the landing gear couldnot be or was not lowered and locked prior to contact with the ground.Excludes cases where collapse occurs during landing roll after initial land-ing contact has been made).
14 - Hard Landing - Stalling in or flying into the runway or other in-
tended landing space while landing.
05 - Collapse or Retraction of Landing Gear - All retractions andcollapses which occur on the ground except those defined as wheels-up land-ings. Either personnel errors or material failures can be the cause of thistype accident.
06 - Undershoot -Landing short of runway or ot.her intended landingspace.
07 - Overshoot - Landing too fast or too fdr down the landing area,I resulting 3n:
a. Running off the end of the runway.
b. GrounClooping, nosing up, or retracting the gear to preventrunning off the end.
c. Landing beyond the runways end.
08 - Aircraft Collision on the Ground - Collisions between aircraftwhen one or both of the primary aircraft involved are on the ground and arenot on the takeoff and landing roll.
09 - Aircraft Collision in the Air - Collisions between aircraft whenboth of the primary aircraft involved are flying. Aircraft on the takeoffor landing roll cre considered to be flying for purposes of this definition.
10 - Collision with Ground or Water - Includes collisions with moun-tains, hills, flying into ground or-water, etc. Excludes collisions pre-ceded by stall, spin or spiral, explosion, airframe or engine failure.
L~. 45
11 - Other Collisions - Collisions with any object other thanplanes oc ground or water. (1) Aircraft in flight collides withpower lines, trees, tow targets, birds, etc; (2) Aircraft is engagedin taxiing, takeoff roll, or landing' roll, and collides with any objectother than aircraft, such as poles, buildings, fences, etc.
12 - Spin or Stall - Mishaps in which the aircraft spins or stallsinto the ground or water. Excludes hard landings and those stalls whichoccur above the landing space during the leveling-off process.
13 - Fire and/or Explosion on Ground - Mishaps resulting from andcaused by fire and/or explosion on the ground.
-' 14 - Fire and/or Explosion in the Air - Mishaps resulting from andcaused by fire and/or explosion in the air.
15 - Airframe Failure - Mishaps resulting from failure of any partof the airframe, such as wingspars, empennage, hinges and fuselage skin.Includes structural failure where safe landing was effected with nofurther damage. Includes cases where the canopy or hatches come off inflight and are not caused by the action or inaction of person(s).
16 - Abandoned Aircraft - Aircraft abandoned in flight by all per-sonnel capable of piloting aircraft.
17 - Propeller or Jet Mishap on Ground - Mishaps in which a personsufters injury from contact with a rotating propeller or from a turbo-jet-engine intake. Also used for mishaps caused by prop or jet blastresulting in injury to personnel or damage to any equipment, building,etc. 4
YY - Not Applicable - Enter this code where no other type of Acci-dent is used.
98 -Type of Accident -Not determined.
V .46iI!
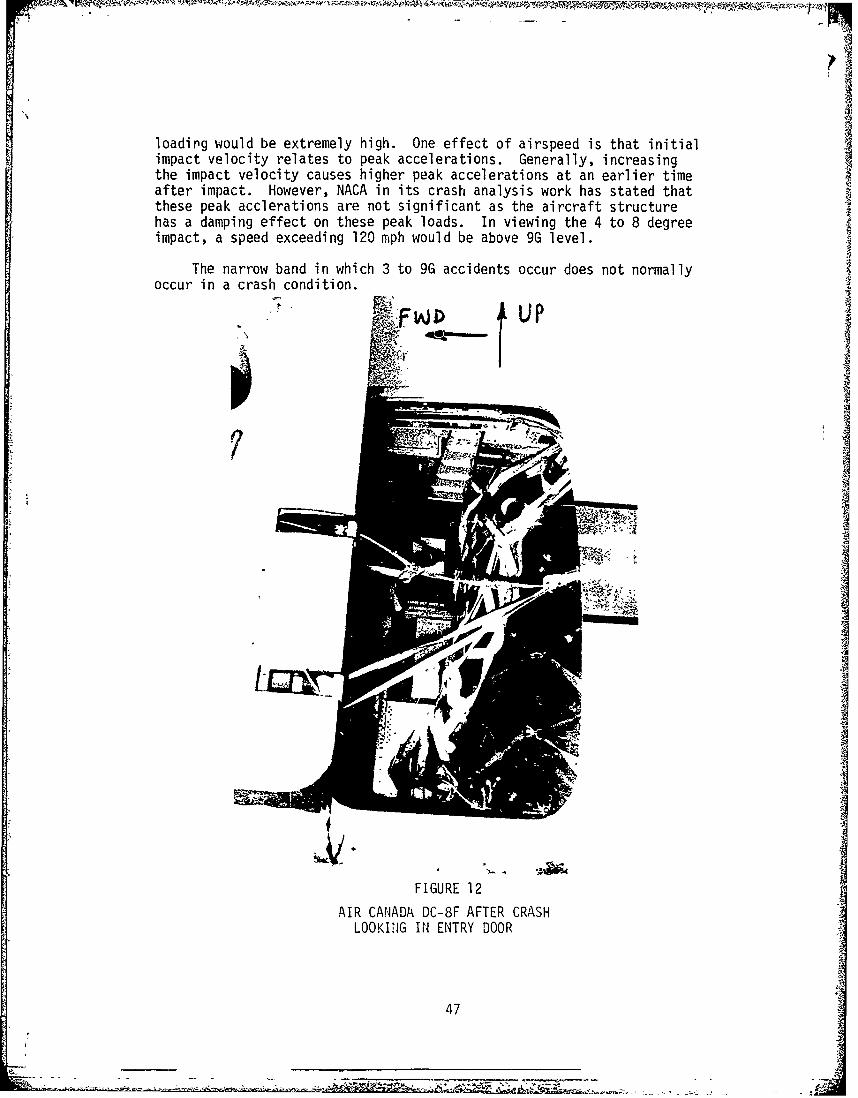
loading would be extremely high. One effect of airspeed is that initialimpact velocity relates to peak accelerations. Generally, increasingthe impact velocity causes higher peak accelerations at an earlier timeafter impact. However, NACA in its crash analysis work has stated thatthese peak acclerations are not significant as the aircraft structurehas a damping effect on these peak loads. In viewing the 4 to 8 degreeimpact, a speed exceeding 120 mph would be above 9G level.
The narrow band in which 3 to 9G accidents occur does not normallyoccur in a crash condition.
_ UP
47
1
FIGURE 12
AIR CANADA DC-8F AFTER CRASHLOOKI!IG IIN ENTRY DOOR
47
T__ _I__ _ _ _I
9. COMMERCIAL EXPERIENCE
This study has used as its data base the total military cargo aircraftoperations for a 14-year period. A comparative study of commercial environ-ment would be extremely difficult since the data is not available within theconfines cf one organization. In view of this, the approach taken was toobtain information of any cargo transport crash where a barrier net wasimpacted. The three major airframe manufacturers, Lockheed-Georgia Co.,Boeing Co., and McDonnell Douglas Co., were queried to determine if anyof the aircraft they had built were involved in this type of accident.The accident data files of the National Transportation Safety Board andFederal Aviation Administration were also used as a source. In addition,the members of the Society of Automotive Engineers, Aerospace EquipmentDivision, Air Cargo and Aircraft Ground Equipment and Systems Committee,were asked to determine if any such accidents had occurred within theorganizations they represented. This committee, through its cargo restraintpanel, represents the aerospace industry in this technical area. It wasthrough this committee that most of the data in this area was obtained.Representatives of the following airlines were contracted for informationrelative to this study:
The Flying Tiger Line, Inc.American Airlines, Inc.Trans World Airlines, Inc.Air FranceAlitalia Italian AirlinesLufthansa German AirlinesPan American World AirwaysIberia AirlinesSeaboard World Airlines
One of the major problems is that US manufactured aircraft areoperated outside of the United States and in many cases, the operationaldata from these aircraft are not classified by type of mission of aircraft,i.e., cargo. Further, this data is not kept by aircraft type but rather bycarrier. It is reasonable to assume that commercial operations are atleast similar in comparison to the military system in terms of flying hourswhen viewing this on a world wide basis.
Both Boeing and Lockheed were unable to identify any use of a barriernet for its intended purpose on crashes involving their civilian aircraft.It was found that in some cases cargo was not restrained and this cargoshifted into the barrier on landing.
The following is a summary of aircraft accidents where the barrier netwas impacted.
a. A Douglas DC-B-63F crashed on approach to Naha Air Base on July 27,1970. The aircraft struck the water approximately 2,000 feet from the run-way threshold breaking off the tail section, the nose section just aft ofthe cargo door, the wing sections, engine pods, the nose gear, and otherportions. The barrier net is located aft of the door and as the cargo
48
impacted the net, the loading may have been responsible for separationof the cockpit from the fuselage. After separation, additional cargowent out the front end of the aircraft. The cargo was restrained to1 I/2Gs. The barrier net forward movement prevented the cargo doorfrom opening. Three of the crew members that survived the crash weretrapped in the cockpit, which was in 5-8 feet of water, and subsequentlydied of drowning.
b. An Air Canada DC-8F was involved in an accident after the pilotaborted takeoff just after beginning rotation. The aircraft had six pal-lets of cargo forward of passenger seating. The following is from a letterreport from Douglas Aircraft Company dated 11 November 1977.
"The airplane overran the end of the runway, slid 1,400 feetin a nose-down attitude through soft mud 6-8 inches deep,hit a ditch six feet wide and six feet deep (forcing thelanding gear aft), and slid another 700 feet on its bellyto a stop.
The cargo system was designed for 1.5G forward load andretained control of the load with no appreciable loadimposed on the forward barrier net, as can be seen in theenclosed Photo l." (Figure 12)
c. There have recently been some instances of accidents involvingaircraft and the movement of livestock. Two recent cases involve a JapanAirlines DC-8 and a Convair 880. While the final accident reports havenot been issued in these accidents, preliminary reports indicate in bothcases that the cattle on board the aircraft were not really restrained.For example, a Convair 880 went to the end of the runway in Miami, Florida,in December 1976. Just past the runway end, the aircraft slowly rolledinto a drainage ditch where it came to rest nose down. The cattle alldied and impacted a 9G barrier bulkhead. The crew survived.
The movement of livestock presents different hazards beyond the normalcargo movement and in essence should not be used to determine whatrestraint levels could have been used. If the livestock could be pro-perly restrained to 1 1/2 or 3G, it is possible they would not haveimpacted the barrier in these crashes.
In viewing the commercial activities, only one accident, the FlyingTiger DC-8F, can be correlated to the types of accidents viewed where abarrier net was effective. But even in this accident the crew did notsurvive. The rescue teams could not use power tools to free the crew dueto jet fuel on the water from break up of the aircraft. It may be assumedthat if this accident had occurred on land, there would have been a postcrash fire.
49
IiME
SECTION V
SUMMARY
Historically, restraint criteria has been based on the structurallimit of a pressurized fuselage. This is an approximate 9G level.The reasoning was to provide protection to passengers to the levelavailable from the surrounding aircraft. It was also well known thatthe human could survive much higher loads and studies into the dynamicsof seats in the crash resulted in a higher, but compatible, restraintfor passengers and crew. This data has also shown inconsistencieswithin structural design specifications.
One factor that appears to have been overlooked is that the envelopeof speed and angle of impact to crash between 3 and 9G is very small. Itbecame evident in researching crash loads factors to develop probabilitiesthat very few accidents occur in this range. The actual crash conditionis the same for either cargo aircraft or spacecraft, in landing mode asused by the space shuttle, and they will react in the same basic manner.The external forces against 0he air vehicle during a crash will be basi-cally the same. The forces i ,ternally will vary based on vehicle design.
The crash event itself is rare, occurring on the average of onceevery 75,750 hours of flight. Upon narrowing this to a particular loadrange and operation, 3 to 9G with passengers and cargo mixed, for tacticalaircraft the value at a 10% mix is 2,900,000 hours. For all cargo air-craft, it becomes an extremely rare event of one possible occurrence per4,000,000 hours of operation. The level of risk becomes acceptableespecially when considering the only time 9G protection is required todayis on routine flights. This only accounts for approximately 2% of theAir Force mission, and approximately 10-12% on C-130 and C-141 aircraft.The probabilities developed within this report have shown a conservativetrend from the data in the 1971 effort. Several factors can account forthis; the most significant is the type of aircraft currently being usedby the military. Each new generation of aircraft has shown higher safetyrecords with corresponding reductions in number of accidents. Anotherfactor has been the inclusion of minor accidents to provide a full pic-ture of the crash spectrum.
The most significant factor of this study ',as been a complete vali-dation of data and predictions made it, the 197' study using the data fromthe end of that study to July 1976. This adds another degree of confi-dence to the decision making process.
Further reviews f- the three prime United States commercial air framemanufacturers and cow "cial carriers have had the same basic experienceof crashes within thE -j-9G range, as shown by use of the barrier net.There has been only one true occurrence when viewing a fixed cargo system.This effort was aimed at examining military operations. The data withinthis report has been used by both the Aeronautical Systems Division andNASA to change various criteria as listed below. The civilian fleet can
50
also use the data in determining what design criteria to utilize. Forexample, either a 3G positive locking rail system or a 3G net in con-junction with current 1 l/2G rail system would provide an adequate systemrather than the 9G system in use today.
As a result of this effort, the following actions were taken:
1. MIL-A-008865 has been revised.
a. Eliminate the need for auxiliary restraint systems above the 3Gcargo handling systems. Trade studies should be performed to determinerisk factors and level of restraint required.
b. Reduce restraint criteria for fixed installations to a loadfactor equal to aircraft structural load factors and not seat installa-tion factors within structural design documentation for both new aircraftand Class II modifications.
2. NASA has established that restraint factors for spacecraft and pay-load be based on operational load factors with safety factor (currentsafety factor is 1.4).
51
APPENDIX A
HUMAN EXPOSURES TO LINEAR DECELERATIONPart 2, AIR FORCE TECHNICAL REPORT 5915
byMajor John Paul Stapp, USAF (MC) Dec 1951
h Fifty-three experiments are reported in which twelve healthy malehuman volunteers were exposed to linear deceleration at right angles tothe long axis of the body. For comparison, the subject was seated fac-ing backward in two cases. The range of deceleration from lOG at 575Gper second rate of change deceleration configurations increasing by a-bout 5G increments. A second group of six runs provided a range of de-celeration of 14.OG at 281G per second to 45.4G at 493G per second.Duration of deceleration ranged from .15 to .35 seconds for all experi-ments. Measurement of harness loading during deceleration by means ofbonded strain gauge tensiometers attached to a symmetrical half of theharness allowed comparison of loadings for three harness configurationsand served as a check on accelerometer data in twenty-two experiments.The weight of the subject multiplied by the deceleration reading at thechest was compared with the total loading of the harness measured simul-taneously by the tensiometers, with good agreement. The limited numberof channels confined measurements during a run to physical factors, sothat physiological and clinical data consisted of such measurements be-fore and after runs as electrocardiogram, X-rays when indicated, opthal-moscopic examination, testing of reflexes, urinalysis and dye excretiontests, pulse, respiration, temperature and blood pressure, and detailedinterrogation for subjective data. In all cases were subjects wereadequately restrained, findings were essentially negative below the levelof 30G, with due allowance for mild abrasions, contusions, and transienteffects due to excitement and exertion. At the 30 to 35G plateau, slightsigns of shock such as palor, sweating, falling blood pressure, and risingpulse were occasionally present with rate of change of deceleration aboveIOOOG per second. In two runs above 38G at more than 1300G per secondrate of change of deceleration, definite shock levels of blood pressure,pulse, and respiration occurred, with near syncope in one case and withtwo brief episodes of syncope in the other. At the same 38G level butwith rate of change of 330G per second, and at 45.4G at 493G per second,blood pressures were elevated and pulse and respiration increased to ex-ertion levels but there was no sign of shock. Venous pressure in theveinules of the eyes evidently exceeded 80mm.Hg. in this last run sincemild retinal hemorrhage and bulbar conjunctival petechiae were produced.
Subjectively, limits of voluntary tolerance were approached at 17.OGat lOOOG per second rate of onset with the standard Air Force harnessconfiguration, at 38.OG at 1350G per second with the inverted V leg strapadded to the shoulder straps and lap belt assembly, and at about 46.OGwith rate of change of deceleration of about 50OG per second, using thelatter configuration. Much higher levels can be survived, although re-versible injurious effects may intervene. Of eight harness configurationstested, including the standard AF design, the minimum modification to pro-vide adequate restraint up to the maximum exposure to deceleration in thisperiod of experiements is the addition of the inverted V leg strap. Theprinciples of crash harness design and requirements for adequate protec-
52
h
tion are discussed.
This effort is considered a major step forward in development ofseat/aircraft restraint systems in that basic levels of human limitswere defined.
53
As
I
'1 APPENDIX B
"ACCELERATIONS AND PASSENGER HARNESS LOADS MEASURED IN FULL-SCALE LIGHT-AIRPLANE CRASHES" by A. MARTIN EBAND, SCOTT H.
SIMPKINSON, AND DONALD D. BLACK, NACA TN 2991 August 1953
Three light aircraft (steel-tube, fabric covered, tandem, two-seat) were crashed at impact speeds from 42 to 60 MPH into a 55 degreeslope earthen wall. The wall was oriented 66 degrees to the line ofaircraft travel. Only deceleration values were obtained for the rearseat of this aircraft. Data was collected for the front seat because"collapse of the front portion of the cabin is often fatal to the frontpassenger (pilot)".
In the 47 MPH test a commercial type seat belt was used while inAl the other tests shoulder harness were used. The peak loads from the
tests are contained in Table B-I, extracted from the Appendix B report.The deceleration loads show that loads imposed on the dummy exceed thefuselage loads and ranged from 1.2 to 1.5 times the fuselage load.This is explained in Appendix D.
Figure B-l shows the test set up.
IIA 54
I.
LI'V
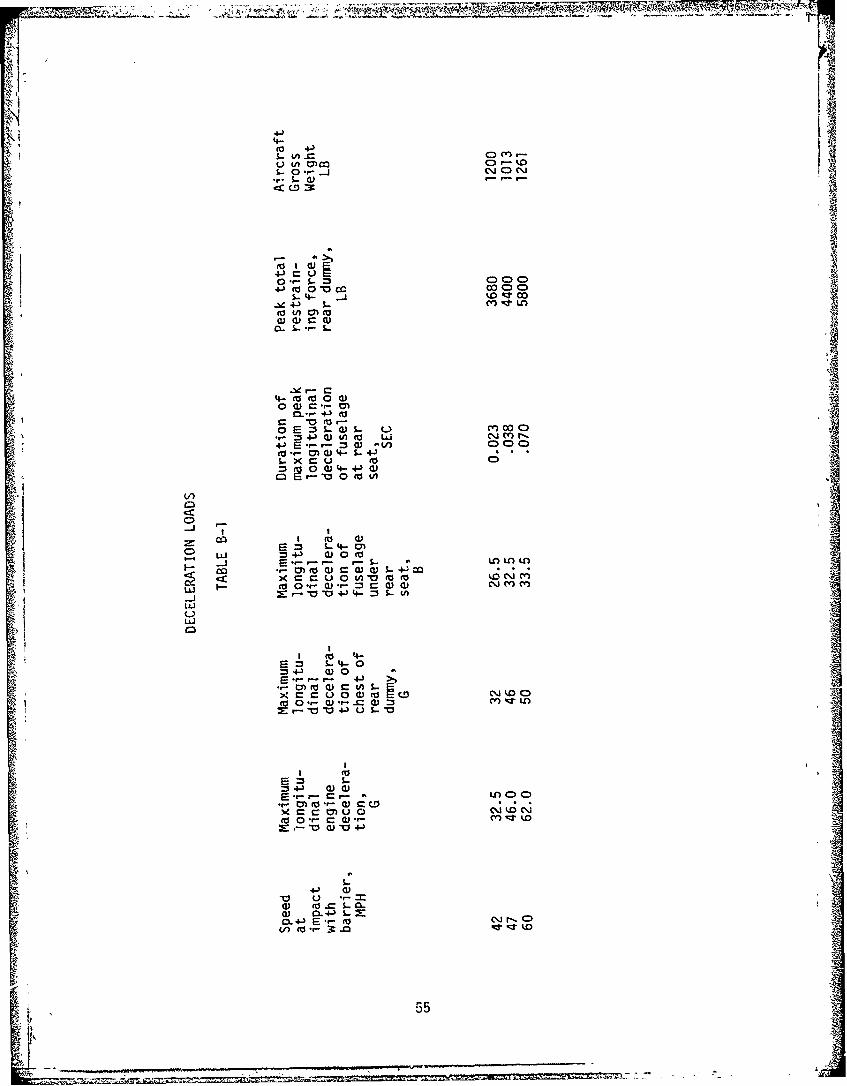
P I
r 5-C) M
C:)0 Eo
4- () a 0C0Q. S .. C)CDC
- '.d 4-) S-CY L
toE S05 (A) (hc(aQ*()r_ 4 0)tlO L
CL S
0 fl r C
4-)
= -) .tQ) ~0 M L-C~ m
4J U r. *'3c L 0Ccor.) md 4- S- 4J
:34- 0 0 m
(ACO~.
C> S- 4- 0
LLJ 4-) o) 055-j -r-- r- -S-Ln L L1
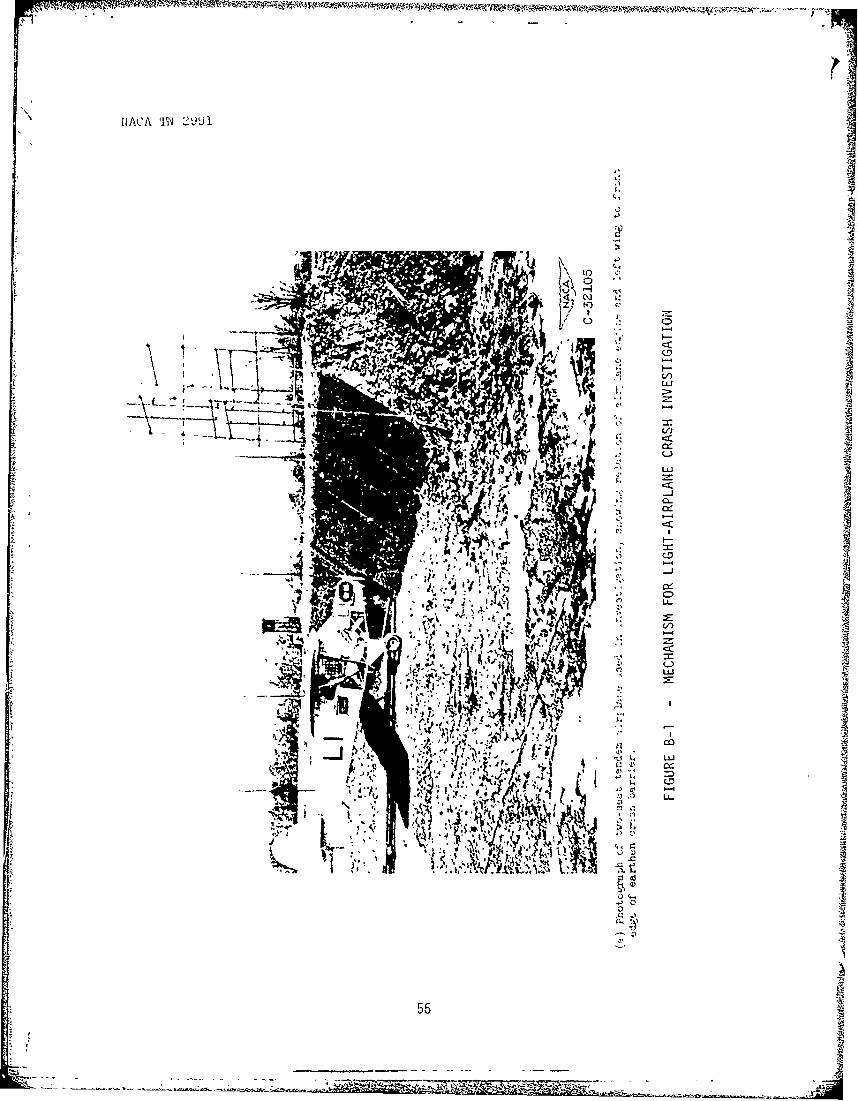
"4 NACA 11" 21091
TII4p
to C.
CD,
IL-
141
~;. ~ / I o4:1 L., LI
14(1
56
* !
APPENDIX C
NACA TR 1332 AND NACA TN 3777
SEAT DESIGN FOR CRASH WORTHINESSBY
I. Irving Pinkel and Edmond G. RosenbergTR June 25, 1956, TN October 1956
(THIS REPORT CARRIES TWO NUMBER DESIGNATIONS)
These reports provide an in-depth review of aircraft seat design re-lative to human survival and aircraft crashes, This report is broken in-to two parts, the first part shows the relation of aircraft decelerationand the seat, with the second part showing tiow to design seats. In thisreview only the part relative to aircraft deceleration is reviewed.
The aircraft seat is a structural link between the passenger andfuselage floor (the term passenger can also apply to the crew). If thepassenger were fastened rigidly to the seat and the seat rigidly to thefloor, then the passenger, seat and floor would move as a unit. How-ever, this is not the case. The passenger is a f;ee moving body withinthe restraint system of the seat; further, the seat is made of flexiblemembers with some movement above the floor. The actual condition of theevents are best explained by the model developed for this report which isquoted herein:
"MODEL OF DECELERATION PULSE FOR SEAT DESIGN"
""Since the rate of rise of the airplane deceleration proved to be animportant quality, it is necessary to describe the airplane decelerationmore accurately. The model used for the deceleration pulse must include adescription of the rate of rise as well as the magnitude and duration. Thehalf-sine pulse does not allow an ;ndependent specification of these factors.
A proposed model for the airplane deceleration that better approximatesactual deceleration measurements is shown in Figure C-1. The base decelera-
tion pulse is divided into three time zones: a rise time during which theairplane deceleration grows to maximum value, a dwell during which the de-celeration has a constant value, and a decay time taken equal to the risetime. it is recognized that there is no necessary relation between the riseand decay times. However, peak seat decelerations will most likely occurduring the dwell. For this reason, the decay time is not as important asthe rise time. Very little is lost by the convenience gained by equatingthe rise and decay times.
As before, secondary pulses are superimposed on the base pulse. Thesecondary pulse may vary considerably in shape. A half-sine pulse repre-sents a reasonable approximation for the secondary pulses which are ofshort duration compared with the base pulse. Secondary pulses may appearanywhere on the base pulse and may attain peak magnitudes greater than thatof the base pulse.
57
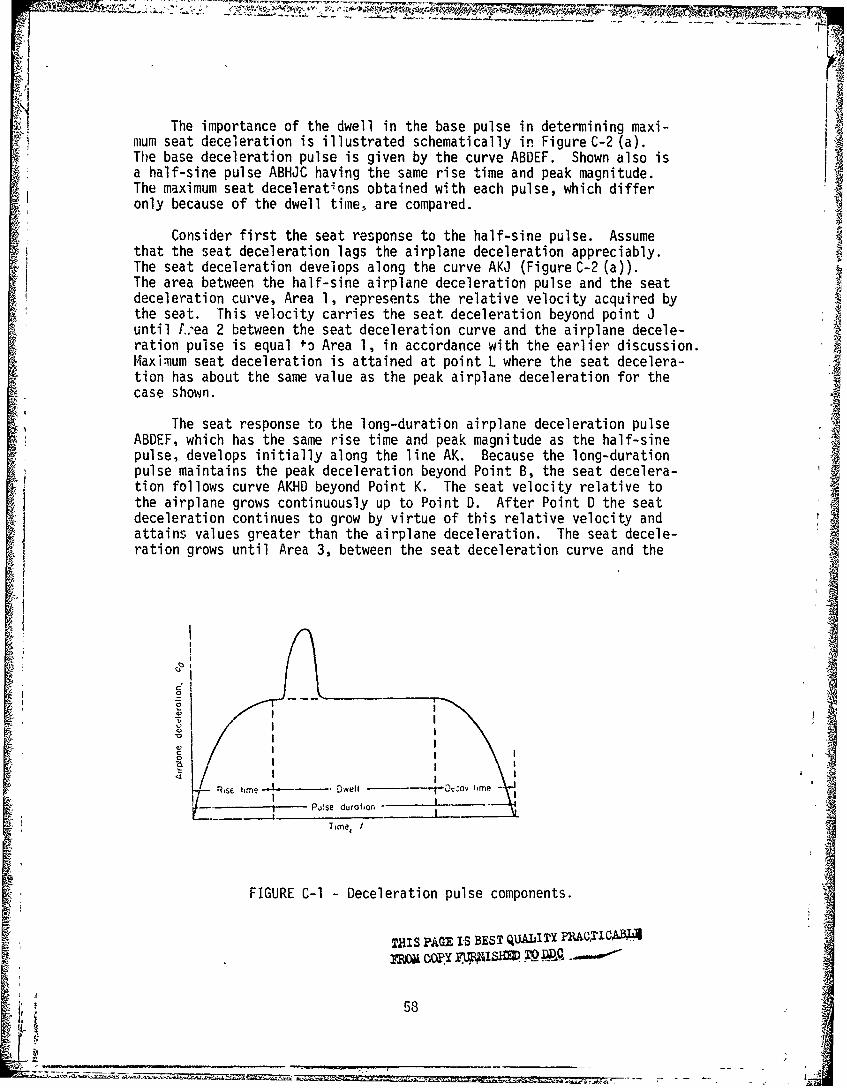
* ;
The importance of the dwell in the base pulse in determining maxi-ilium seat deceleration is illustrated schematically in Figure C-2 (a).The base deceleration pulse is given by the curve ABDEF. Shown also isa half-sine pulse ABHJC having the same rise time and peak magnitude.The maximum seat decelerations obtained with each pulse, which differonly because of the dwell time, are compared.
Consider first the seat response to the half-sine pulse. Assumethat the seat deceleration lags the airplane deceleration appreciably.The seat deceleration develops along the curve AKJ (Figure C-2 (a)).The area between the half-sine airplane deceleration pulse and the seatdeceleration curve, Area 1, represents the relative velocity acquired bythe seat. This velocity carries the seat deceleration beyond point Juntil L.ea 2 between the seat deceleration curve and the airplane decele-ration pulse is equal +o Area 1, in accordance with the earlier discussion.Maximum seat deceleration is attained at point L where the seat decelera-tion has about the same value as the peak airplane deceleration for thecase shown.
The seat response to the long-duration airplane deceleration pulseABDEF, which has the same rise time and peak magnitude as the half-sinepulse, develops initially along the line AK. Because the long-durationpulse maintains the peak deceleration beyond Point B, the seat decelera-tion follows curve AKHD beyond Point K. The seat velocity relative tothe airplane grows continuously up to Point D. After Point D the seatdeceleration continues to grow by virtue of this relative velocity andattains values greater than the airplane deceleration. The seat decele-ration grows until Area 3, between the seat deceleration curve and the
Rs11. Dwell - --- rOýo tim
"I~
_ _ __ Pj!se durolon-
Time, I
FIGURE C-1 - Deceleration pulse components.
THIS PAGE IS BEST Q Y C'zomA
MO', ,OXRPIi - N
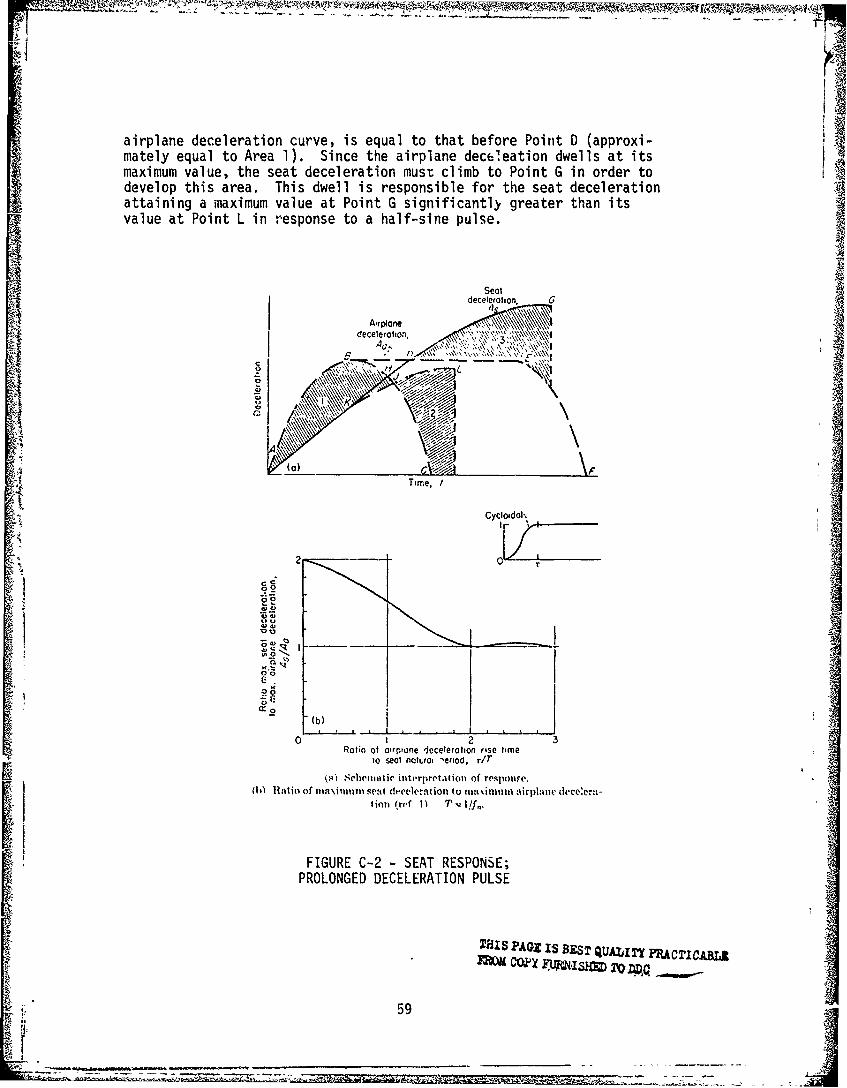
airplane deceleration curve, is equal to that before Point D (approxi-mately equal to Area 1). Since the airplane decEleation dwells at itsmaximum value, the seat deceleration must climb to Point G in order todevelop this area. This dwell is responsible for the seat decelerationattaining a maximum value at Point G significantly greater than itsvalue at Point L in response to a half-sine pulse.
Sealdecelerton,
Tin'e, ,
Cycloidol,
'NII00
2 1
00
C..
210-0
,0 W ~ lntr••nc /Ratio of a'irpane djeceleration rise time
to seal notLvo lenaod. r/T
(.'i Schemtatie interpretation of responre.0i) 16 tin of 111ai\01t11i1 Seat deceleration to nti \itntuti airphit"c deccer:c -
tion (ref 1) T I !f,
FIGURE C-2 - SEAT RESPONSE;PROLONGED DECELERATION PULSE
?A0Z IS BEST QUALITY FRACTICABL
4 59
The ratio of maximum seat deceleration to maximum airplane decele-ration for a base deceleration pulse having a dwell time appreciablylonger than the rise time is given to a useful approximation in thisproblem in Figure C-2 (b). The values As/Aa in this figure are computedon the assumption that the rise time portion of the airplane decelera-tion pulse has the cycloidal shape shown on the fi~.". In view of thevariety of possible shapes for this curve that may actually apoear incrashes, further refinement in the definition of the rise time curve isnot justified. In Figure C-2 (b), t is the airplane deceleration risetime and T is the period of the natural seat oscillation; T is relatedto the seat natural frequency through the expression.
T=l/fn
According to Figure C-2 (b), the peak seat deceleration can beequal to twice the peak airplane deceleration when the period of theseat natural oscillation is large compared to the rise time for theairplane deceleration. When the ratio t/T is greater than 2, the air-plane and seat deceleration peaks are about the same.
Since the ratio t/T increases with seat stiffness for a given air-plane deceleration rise time, stiff seats will give lower seat decelera-tions than flexible seats of low natural frequency."
A proposed description of the second deceleration is shown in"Table C-l" for airplanes having a landing speed of 180 feet per second.The residual stiffness should be high enough to serve in a second decele-ration whose primary and secondary pulse amplitudes have the values shownin the appropriate columns. The pulse durations and rise times shouldbe the same for the first and second decelerations. For the case whereA V is equal to 180 feet per second in the first deceleration, no second
deceleration will occur since the airplane will have come to rest.
The report defines transport as a low or middle wing aircraft (C-46)and cargo as a high wing aircraft (C-82).
Deep seat-pap cuchions introduce the same objectionable slack in avertical directior '- use of extra seat cushioning, sometiims prac-ticed in aircraft. , ses the danger of back injuries in a verticaldeceleration pulse. propel, seat-pan cushion should compress completelyunder the weight of the occupant and bring his buttocks in substantialcontact with the seat pan. The illusion of greater protection providedby deep cushioning comes from sensations of comfort experienced whenforces equal to the weight of the occupant are exerted. When these forcesgrow to 10 and 20 times the occupants' weight in a deceleration pulse,the protection afforded by the deep cushion no longer exists. Instead,the detrimental effects of slack appear as the occupant compresses thecushion and acquires velocity with respect to the seat pan he will ulti-mately strike.
60
Vý77;ý-
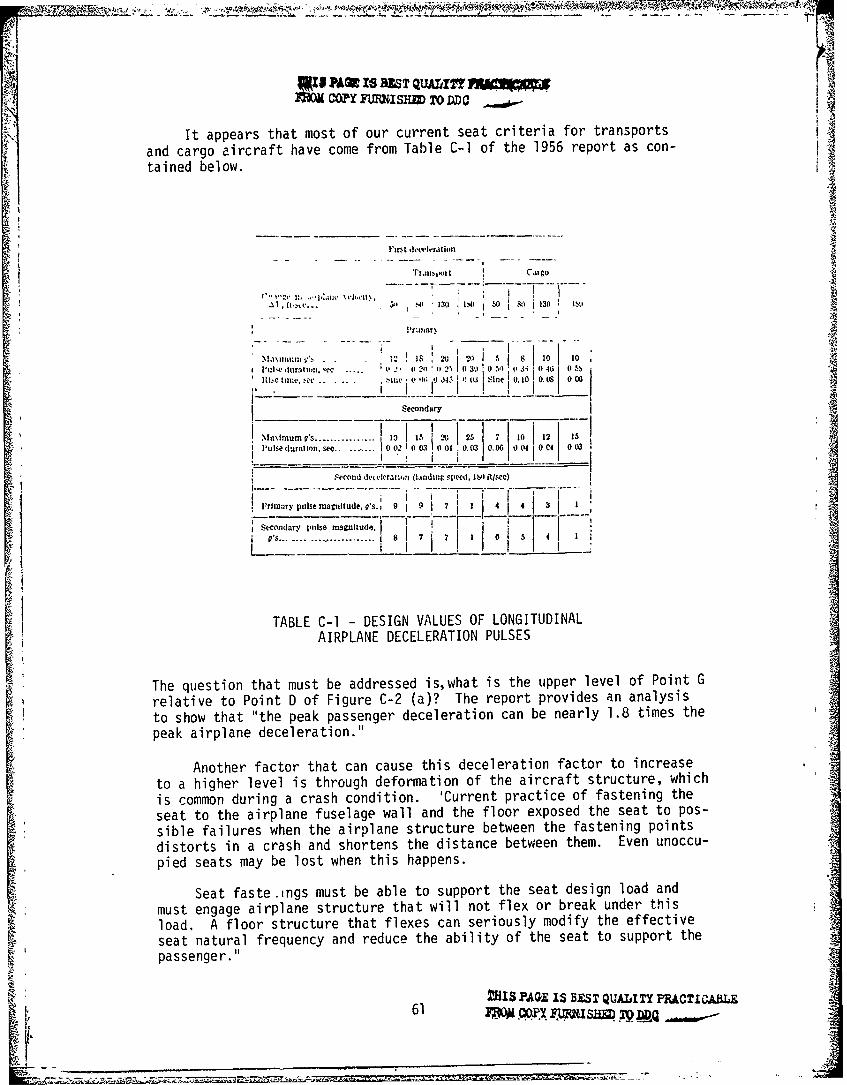
alPA 1IZST QUAVIZiflugi Wryl YLISI{M TO DDC
It appears that most of our current seat criteria for transports
and cargo aircraft have come from Table C-i of the 1956 report as con-
tained below.
First deItehrtltion
H 1, 0 1.. . .. '... 0. . . . 130 1I i
M \hll, -IS 20 20 1 8 j10 10411' dirsilui,. ýec ---- 2 ' 0 I 21 0 21 3910 ',, I to & 1 45 0 s
)Iih. toI~v -10 ')II J4 J ! (U: Si~ neiO 0100. (is 008 J
Secondary
.fn•i O'st............... 13 1 I 2 0,1 I10 12 013 .0 0 00 x 503
ul,-edur.4s e 0 03 0 01 0. 1 0. OG .- .
Second 1 detele 1',lI (6i.,ding speed,. I& bl ./see)
PrTinmary pulse magnitude, 9 's. 1 ,9 9 7 1 4,4 3 1
St-condar' pulse magnieuder_ _ - ii . . . . . . ... .... ................. 7 6 5 4
TABLE C-1 - DESIGN VALUES OF LONGITUDINALAIRPLANE DECELERATION PULSES
The question that must be addressed is,what is the tipper level of Point G
relative to Point D of Figure C-2 (a)? The report provides an analysis
to show that "the peak passenger deceleration can be nearly 1.8 times the
peak airplane deceleration."
Another factor that can cause this deceleration factor to increase
to a higher level is through deformation of the aircraft structure, which
is common during a crash condition. 'Current practice of fastening the
seat to the airplane fuselage wall and the floor exposed the seat to pos-
sible failures when the airplane structure between the fastening points
distorts in a crash and shortens the distance between them. Even unoccu-
pied seats may be lost when this happens.
Seat faste .ings must be able to support the seat design load and
must engage airplane structure that will not flex or break under this
load. A floor structure that flexes can seriously modify the effective
seat natural frequency and reduce the ability of the seat to support the
passenger."*
N, MIS? IS Ul.•ST QUALITY PUACTICAaE61 Ik~Q..
$1 The same effect is true when considering passengers in aft-facing! Iseats or in the vertical direction. Cushioning provided for comfort is
in conflict with the ability of the seat to hold in a crash. To cover4 the resultant "G" on the passenger some of the cushioning may have to be
comprised. For example: In an aft-facing seat the body would undergo ahigher G force due to the travel into the cushion which will result ina larger relative velocity in comparison to the decelerating aircraft.
UA
I
62
Ja76
_________________________________ _______ _______
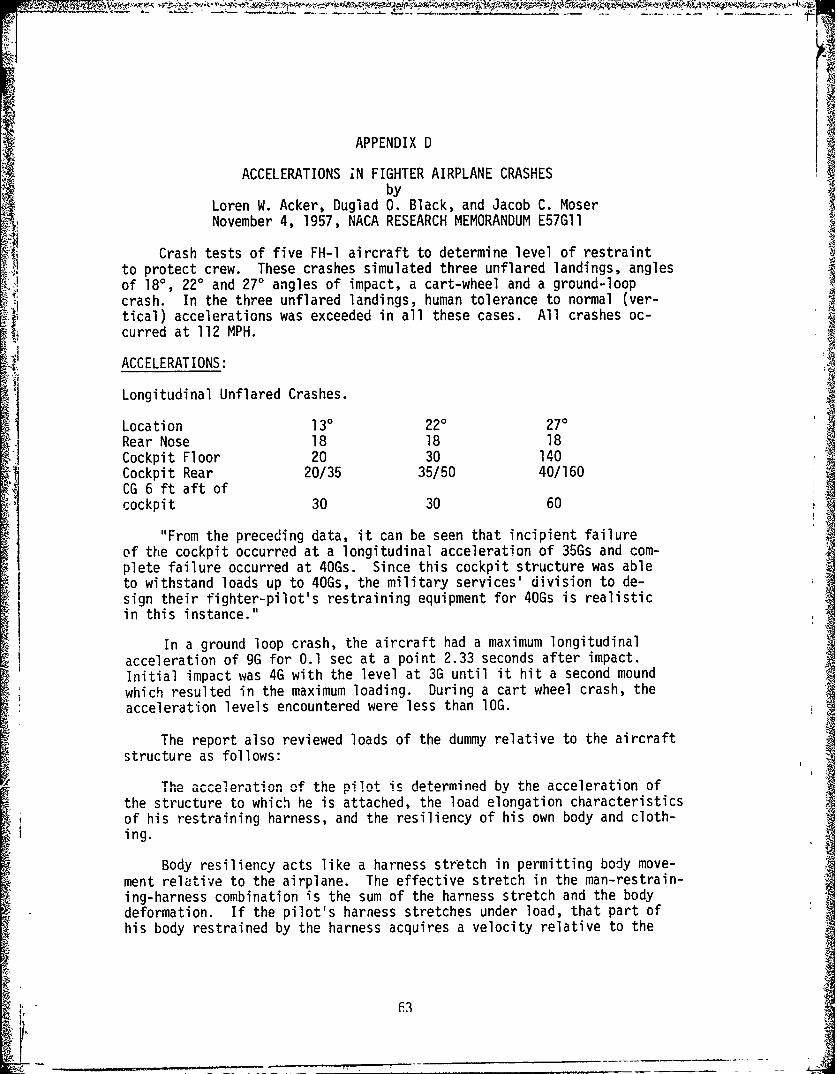
APPENDIX D
ACCELERATIONS iN FIGHTER AIRPLANE CRASHESbyLoren W. Acker, Duglad b. Black, and Jacob C. MoserNovember 4, 1957, NACA RESEARCH MEMORANDUM E57GIl
Crash tests of five FH-l aircraft to determine level of restraintto protect crew. These crashes simulated three unflared landings, anglesof 18', 220 and 270 angles of impact, a cart-wheel and a ground-loopcrash. In the three unflared landings, human tolerance to normal (ver-tical) accelerations was exceeded in all these cases. All crashes oc-curred at 112 MPH.
ACCELERATIONS:
Longitudinal Unflared Crashes.
Location 130 220 270Rear Nose 18 18 18Cockpit Floor 20 30 140Cockpit Rear 20/35 35/50 40/160CG 6 ft aft ofcockpit 30 30 60
"From the preceding data, it can be seen that incipient failureof the cockpit occurred at a longitudinal acceleration of 35Gs and com-plete failure occurred at 40Gs. Since this cockpit structure was ableto withstand loads up to 40Gs, the military services' division to de-
, Isign their fighter-pilot's restraining equipment for 40Gs is realisticin this instance."
In a ground loop crash, the aircraft had a maximum longitudinalacceleration of 9G for 0.1 sec at a point 2.33 seconds after impact.Initial impact was 4G with the level at 3G until it hit a second moundwhich resulted in the maximum loading. During a cart wheel crash, theacceleration levels encountered were less than lOG.
The report also reviewed loads of the dummy relative to the aircraftstructure as follows:
The acceleration of the pilot is determined by the acceleration ofthe structure to which he is attached, the load elongation characteristicsof his restraining harness, and the resiliency of his own body and cloth-ing.
Body resiliency acts like a harness stretch in permitting body move-ment relative to the airplane. The effective stretch in the man-restrain-ing-harness combination is the sum of the harness stretch and the bodydeformation. If the pilot's harness stretches under load, that part ofhis body restrained by the harness acquires a velocity relative to the
i63

airplane, the pilot's body will experience a deceleration equal to that
of the airplane plus the additional deceleration required to bring thepilot's body back to the speed of the airplane. If the airplane decele-ration declines while the harness is still stretching, his peak decele-
Sration may not attain the peak airplane deceleration. Otherwise, thepilot's deceleration may exceed that of the airplane. If the pilot isattached rigidly to the structure, he will undergo the same decelerationas the structure to which he is attached.
The anthropomorphic dummy used in this study could not be expectedto duplicate exactly the resiliency of a human; therefore, the responseof the dummy to accelerations may be somewhat different from that of ahuman. However, the data obtained with this dummy should give some in-dication of the accelerations a human might experience.
The restraining harness used in this study was a~tached directly tithe bulkhead at the rear of the cockpit. The seat, t"°efore, was notinvolved in the support of the dummy in the longitudinal direction.
For example, in the 130 unflared crash the dummy saw an accelerationpath of 45G as compared with 35G with the rear bulkhead. The followingconclusion is quoted "in some crashes the normal accelerations measuredon the dummy's hip were as much as twice those measured on the cockpitfloor."
With respect to vertical accelerations, the report indicatesthe level of human tolerance is 20 to 25G before injuries to the spine,this is almost 1/2 of the lonnitudinal direction (40G). In these crashesit was found that while it is concedable that a man can withstand thelongitudinal forces the normal forces far exceeded the survivable limit.For example, in the 22' unflared crash the initial G loading was 35G oncockpit floor and 50G on dummy's hips. During a second impact the load-ings were 55G on the floor and approximately 120G at the dummy's hips.This high G force was a result of the seat failure.
In the 40 ground loop initial G loadingson the dummy's hips were 5Gs.When the aircraft skidded over a bank and fell approximately five to sixfeet, the normal acceleration on the dummy's hips was 18Gs. This wouldhave been the only survivable crash conducted during this program.
Jf
S64
fi
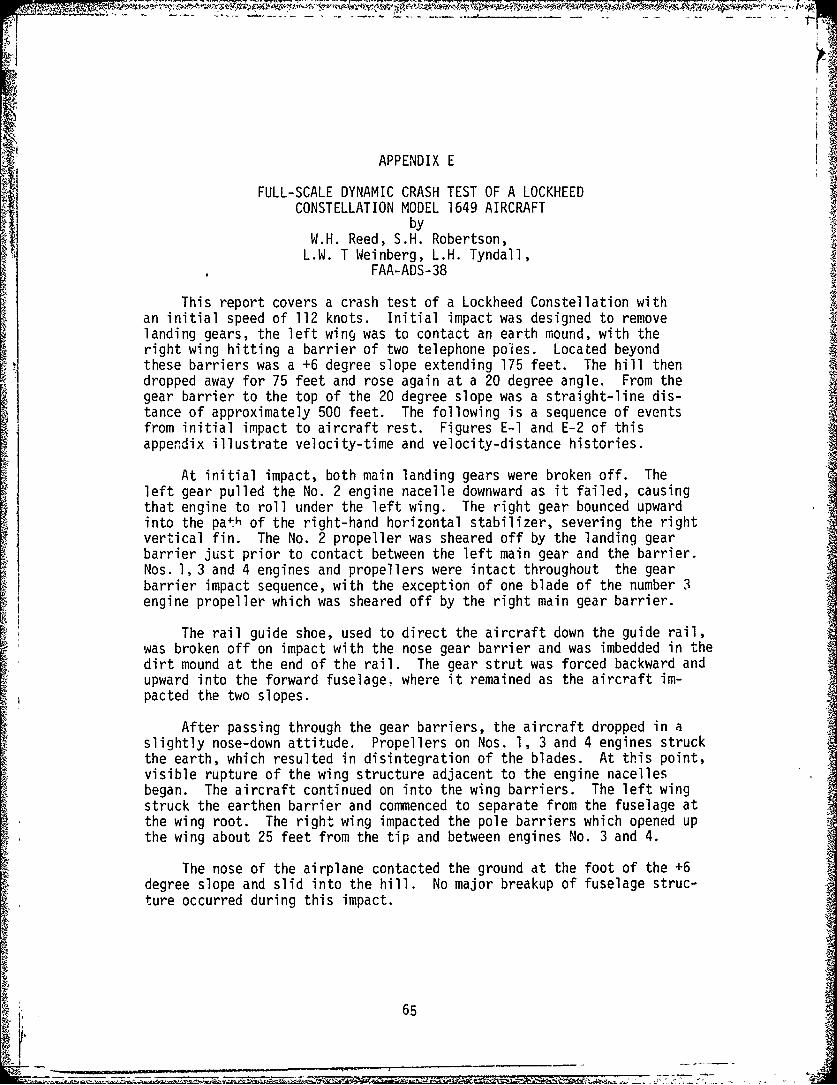
APPENDIX E
FULL-SCALE DYNAMIC CRASH TEST OF A LOCKHEEDCONSTELLATION MODEL 1649 AIRCRAFT
byW.H. Reed, S.H. Robertson,
L.W. T Weinberg, L.H. Tyndall,FAA-ADS-38
This report covers a crash test of a Lockheed Constellation withan initial speed of 112 knots. Initial impact was designed to removelanding gears, the left wing was to contact an earth mound, with theright wing hitting a barrier of two telephone poles. Located beyondthese barriers was a +6 degree slope extending 175 feet. The hill thendropped away for 75 feet and rose again at a 20 degree angle. From thegear barrier to the top of the 20 degree slope was a straight-line dis-tance of approximately 500 feet. The following is a sequence of eventsfrom initial impact to aircraft rest. Figures E-1 and E-2 of thisappendix illustrate velocity-time and velocity-distance histories.
At initial impact, both main landing gears were broken off. Theleft gear pulled the No. 2 engine nacelle downward as it failed, causingthat engine to roll under the left wing. The right gear bounced upwardinto the pa t h of the right-hand horizontal stabilizer, severing the rightvertical fin. The No. 2 propeller was sheared off by the landing gearbarrier just prior to contact between the left main gear and the barrier.Nos. 1,3 and 4 engines and propellers were intact throughout the gearbarrier impact sequence, with the exception of one blade of the number 3
engine propeller which was sheared off by the right main gear barrier.
was The rail guide shoe, used to direct the aircraft down the guide rail,
was broken off on impact with the nose gear barrier and was imbedded in thedirt mound at the end of the rail. The gear strut was forced backward andupward into the forward fuselage, where it remained as the aircraft im-pacted the two slopes.
After passing through the gear barriers, the aircraft dropped in aslightly nose-down attitude. Propellers on Nos. 1, 3 and 4 engines struckthe earth, which resulted in disintegration of the blades. At this point,visible rupture of the wing structure adjacent to the engine nacellesbegan. The aircraft continued on into the wing barriers. The left wingstruck the earthen barrier and commenced to separate from the fuselage atthe wing root. The right wing impacted the pole barriers which opened upthe wing about 25 feet from the tip and between engines No. 3 and 4.
The nose of the airplane contacted the ground at the foot of the +6degree slope and slid into the hill. No major breakup of fuselage struc-ture occurred during this impact.
65
1 V
After passing the crest of the +6 degree slope, the airplane ro-tated to a slightly nose down attitude before impacting the 20 degreeslope. Impact with the 20 degree slope produced two fuselage breaks; aftof the cockpit between fuselage stations 370 and 380, and aft of the gal-
Small fires occurred, had the aircraft crashed under normal condi-tions. With regular fuel on board, this crash would have resulted infire of the entire aircraft.
Basically the crash would be considered a 20G crash condition.
.4.
" its
66
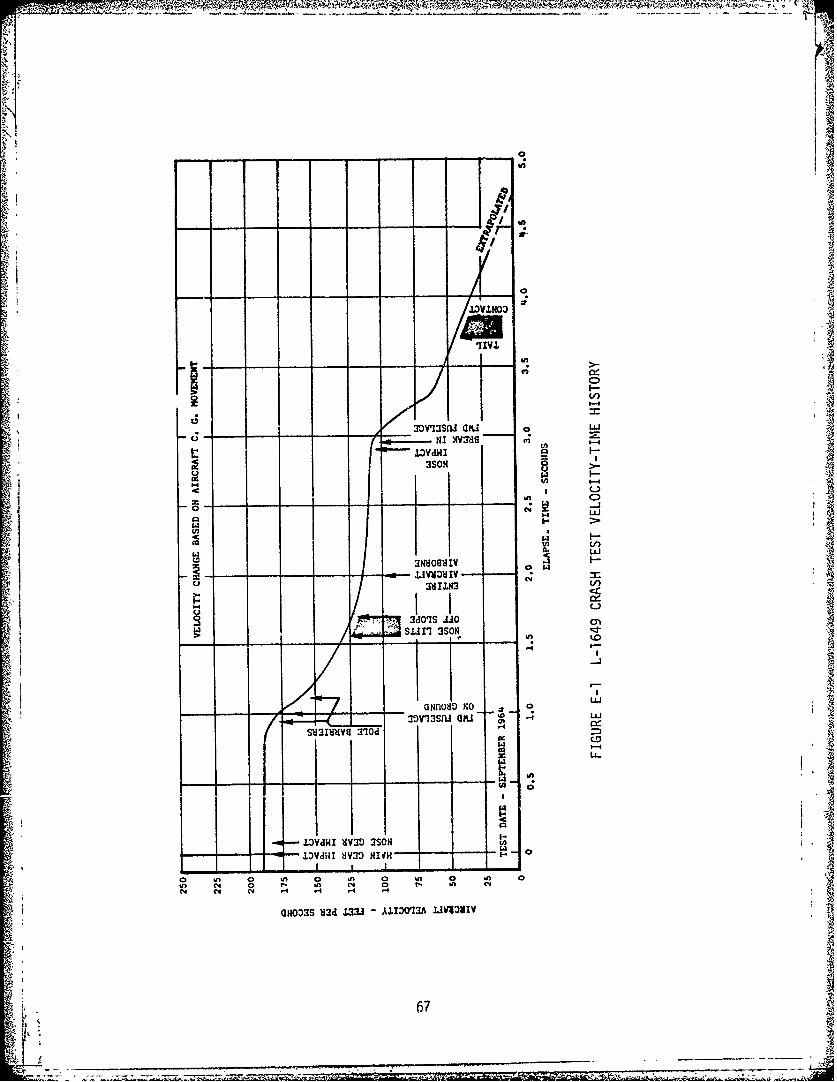
I boi
JD~dwI'71
3so0
C,)
cI
z ~LiC.,0u~ I-
3d0'IS UO IIS~d31HHVE 310d 15
L3VdWI ~IV30 3SOH1±)VdIII "i39 NIVN
-,~~ 7,I . I - - -A
u ~ (4 0 f- kn N' 0 t-. Inl (4
('4 N' ell 4 4 .4 .
QHOM3S S3d 1333 - U!3OtiA IJVVDVIV
67I
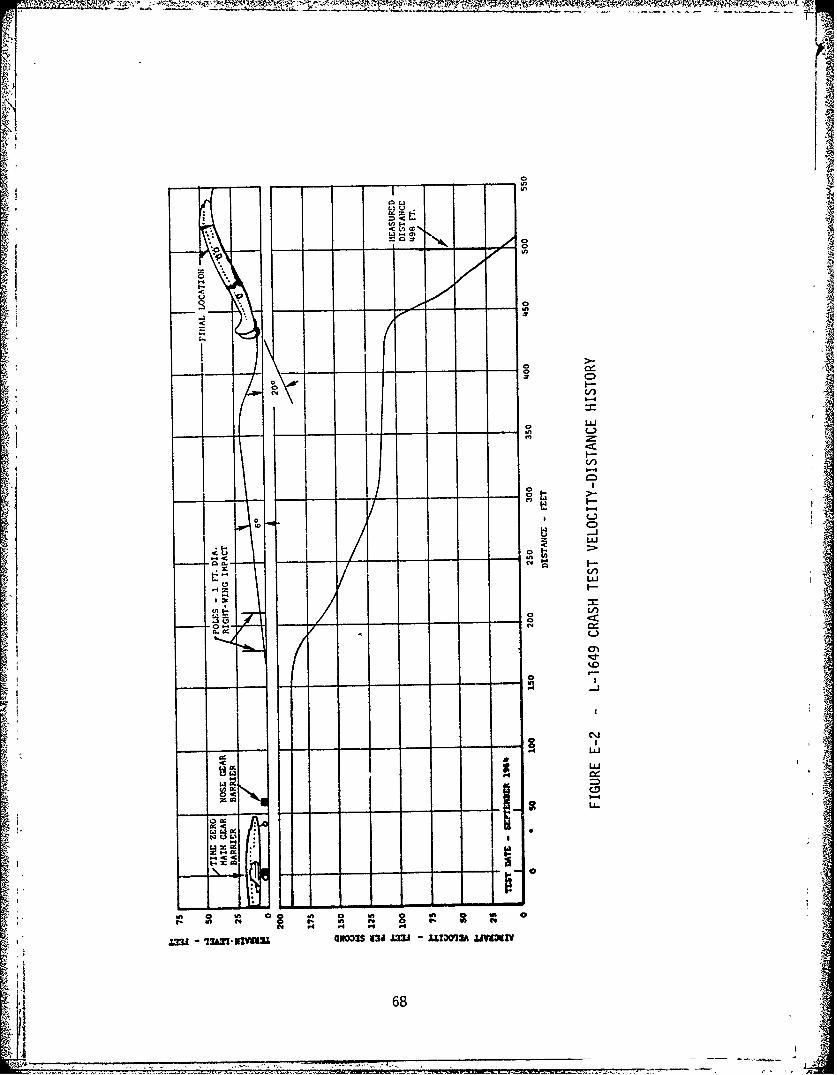
o o CO
4--.. : .
¶3 0J
y S *
('4V I
in 0 hf-Sf
Sý c , 6
ONI 93 L UOMA MO)
680
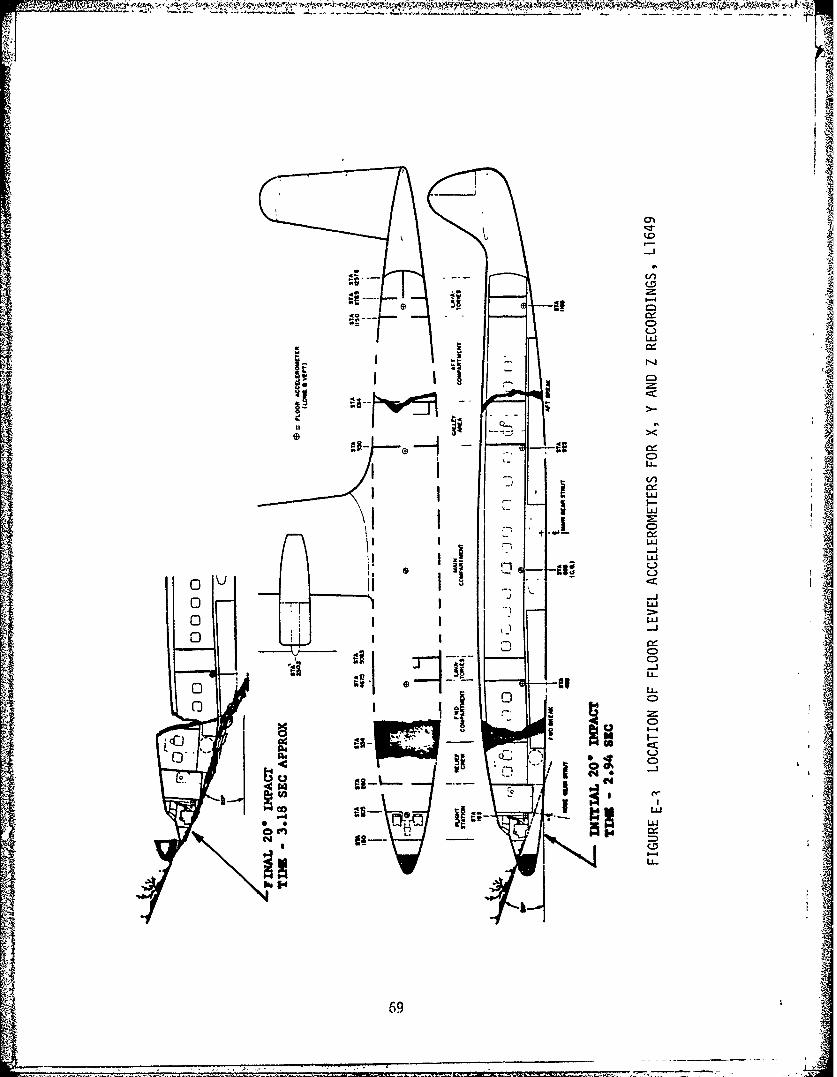
~, - Al
-Jý
C-)
Lii
r-i
C/)
LU-ID-
LU-
-LJL; ~ L-
69-, 4.
APPENDIX F
FULL-SCALE DYNAMIC CRASH TEST OF ADOUGLAS DC-7 AIRCRAFT
byW.H. Reed, S.H. Robertson, L.W.T. Weinberg,
and L.H. Tyndall, FAA-ADS-37, April 1965
This report provides data on a DC-7 crash test conducted by the FlightSafety Foundation for the Federal Aviation Agency. In the test the air-craft was accelerated to 139 knots, landing gear was removea by impact-ing special barriers at which time the aircraft becam airborne until itimpacted the following barrers:
First, the left wing impacted against an earthen mound to simulate alow-wing accident. At the same time the right wing impacted telephonepoles to simulate trees. Next, the fuselage was to impact against a +8degree slope, go over the slope and become airborne again and then impacta +20 degree slope.
A voltage control regulator failed in the on-board data system result-ing in loss of all data except that in the cockpit. The cockpit floorshowed longitudinal acceleration ranging from 23G at initial impact to 27Gon the 8 degree slope and 47G on the 20 degree slope. While the pilotand co-pilot could have survived, the impact on the +8 degree slope, theywould not have survived the 20 degree impact deceleration forces. A re-view of vertical accelerations also shows the pilot and co-pilot could nothave survived this crash. Figure F-I of this appendix illustrates the ve-locity-time history.
4
II
is•, 70
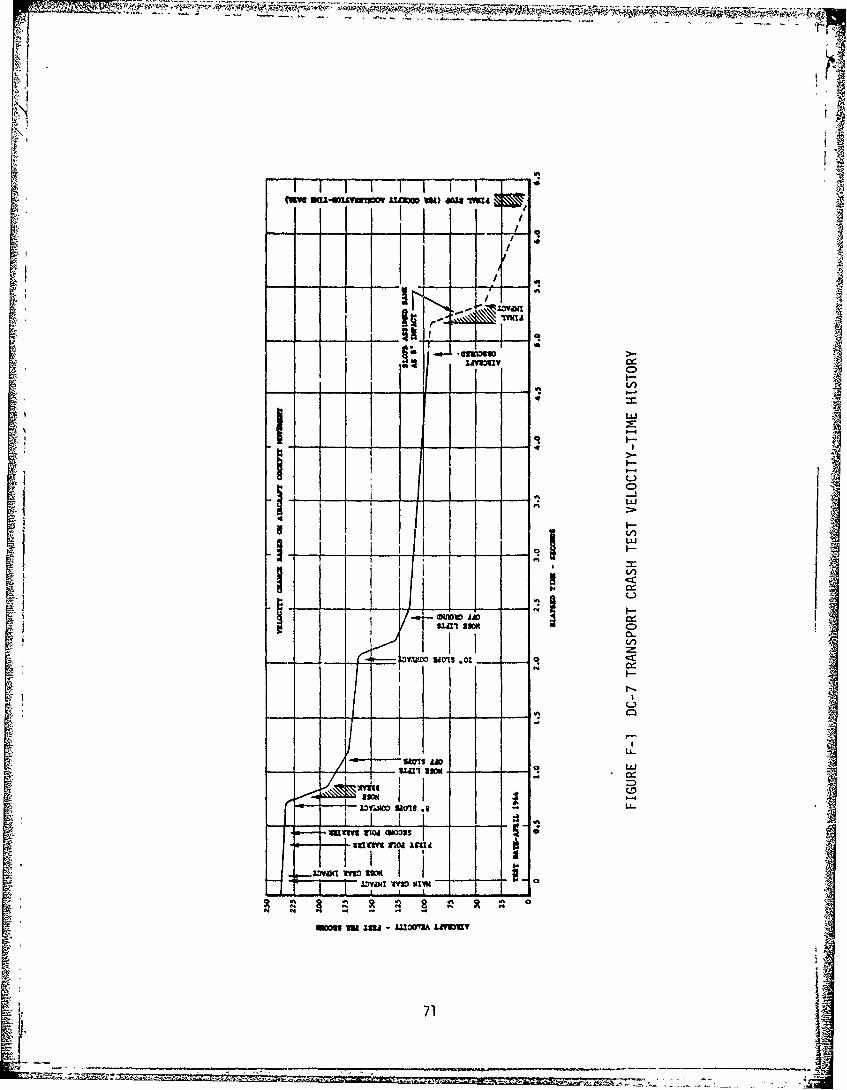
10= U00U1swWWY Lim= Uad) WMai
I , V1
IITCD,
IIm I1'VMS i CD,
ISm!-4- u013. 0
inod amisvial i 3n xtZS
71
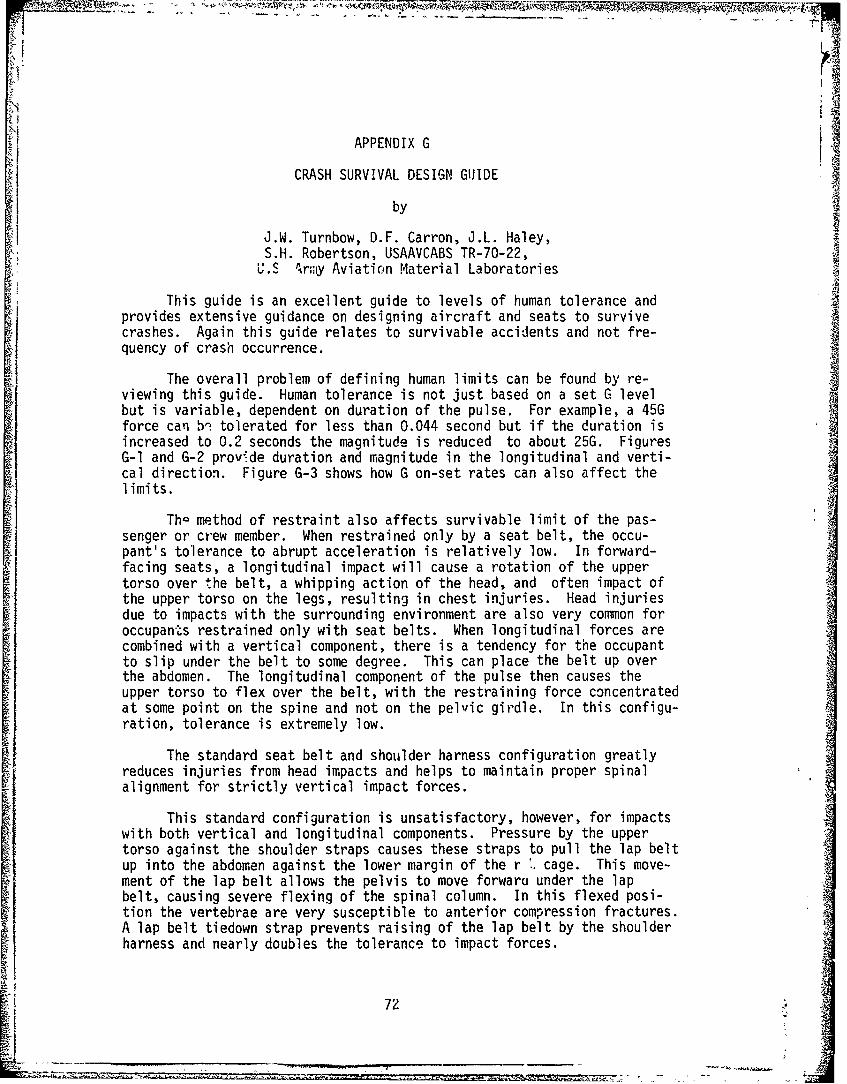
APPENDIX G
CRASH SURVIVAL DESIGN GUIDE
by
J.W. Turnbow, D.F. Carron, J.L. Haley,S.H. Robertson, USAAVCABS TR-70-22,
U.S '%r;-iy Aviation Material Laboratories
This guide is an excellent guide to levels of human tolerance andprovides extensive guidance on designing aircraft and seats to survivecrashes. Again this guide relates to survivable accidents and not fre-quency of crash occurrence.
The overall problem of defining human limits can be found by re-viewing this guide. Human tolerance is not just based on a set G levelbut is variable, dependent on duration of the pulse. For example, a 45Gforce can bi tolerated for less than 0.044 second but if the duration isincreased to 0.2 seconds the magnitude is reduced to about 25G. FiguresG-1 and G-2 provide duration and magnitude in the longitudinal and verti-cal direction. Figure G-3 shows how G on-set rates can also affect thelimits.
Tho method of restraint also affects survivable limit of the pas-senger or crew member. When restrained only by a seat belt, the occu-pant's tolerance to abrupt acceleration is relatively low. In forward-facing seats, a longitudinal impact will cause a rotation of the uppertorso over the belt, a whipping action of the head, and often impact ofthe upper torso on the legs, resulting in chest injuries. Head injuriesdue to impacts with the surrounding environment are also very common foroccupants restrained only with seat belts. When longitudinal forces arecombined with a vertical component, there is a tendency for the occupantto slip under the belt to some degree. This can place the belt up overthe abdomen. The longitudinal component of the pulse then causes theupper torso to flex over the belt, with the restraining force concentratedat some point on the spine and not on the pelvic girdle. In this configu-ration, tolerance is extremely low.
The standard seat belt and shoulder harness configuration greatlyreduces injuries from head impacts and helps to maintain proper spinalalignment for strictly vertical impact forces.
This standard configuration is unsatisfactory, however, for impactswith both vertical and longitudinal components. Pressure by the uppertorso against the shoulder straps causes these straps to pull the lap beltup into the abdomen against the lower margin of the r '. cage. This move-ment of the lap belt allows the pelvis to move forwaru under the lapbelt, causing severe flexing of the spinal column. In this flexed posi-tion the vertebrae are very susceptible to anterior compression fractures.A lap belt tiedown strap prevents raising of the lap belt by the shoulderharness and nearly doubles the tolerance to impact forces.
72
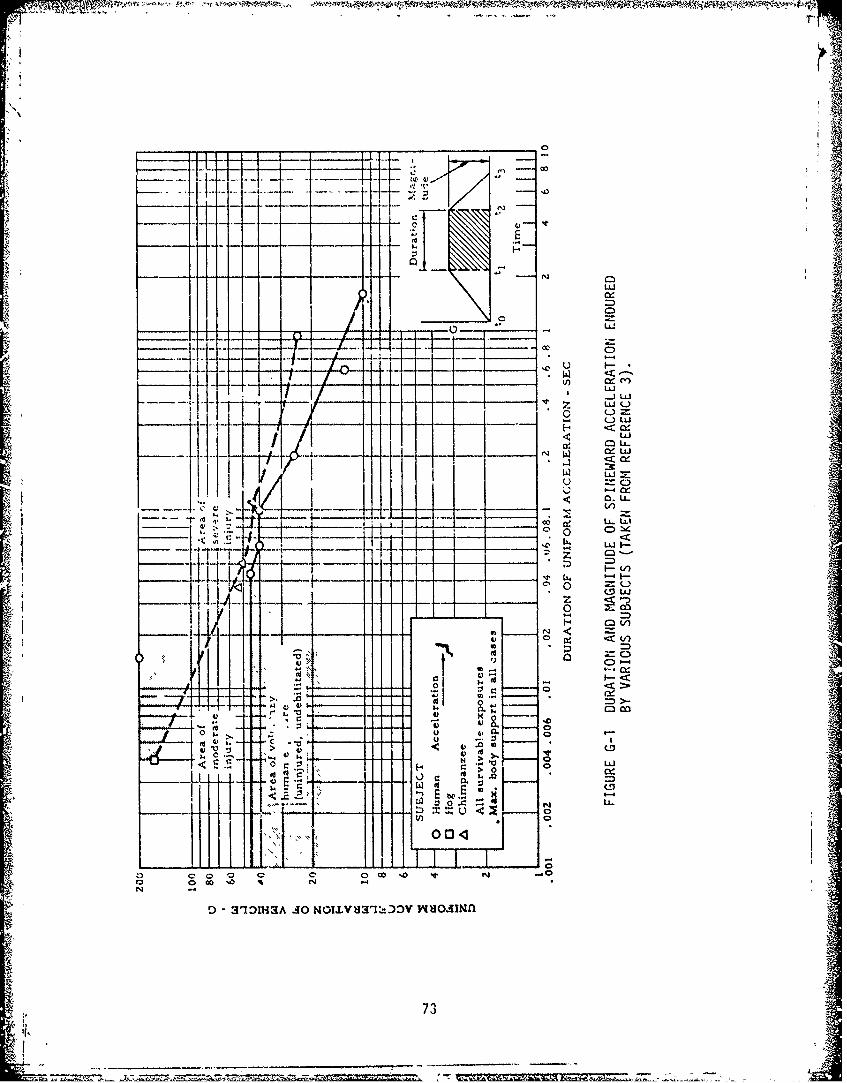
- rf-
00
- -1- - - - ----.--- --- UL.
0:LL
u.J
0.LL
N- -4
73 V
<____
It-- o --
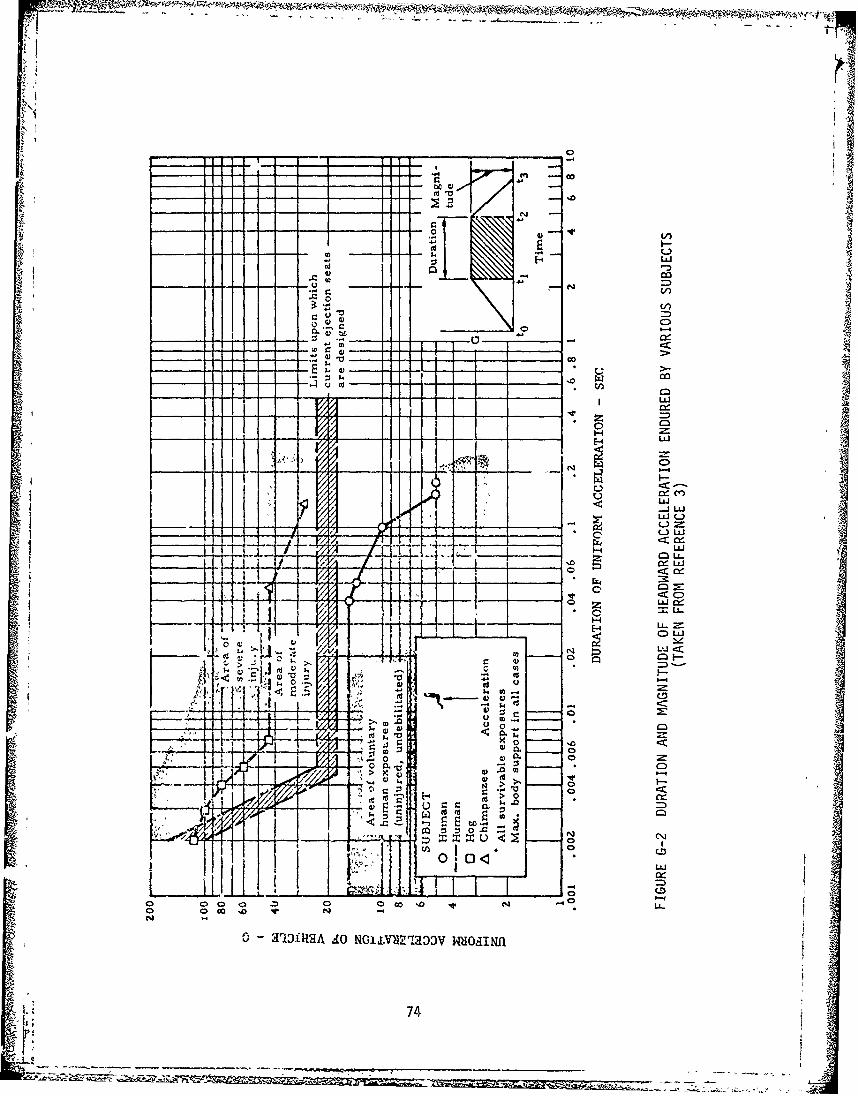
'~V~co
- I.'
LU.
N
V/)
0 C C
- - -1
IT I I1+ C
ILl
I__ N10JL.~ ___ _
-~i _ _
I-
'4)C U -'
CD
?q q
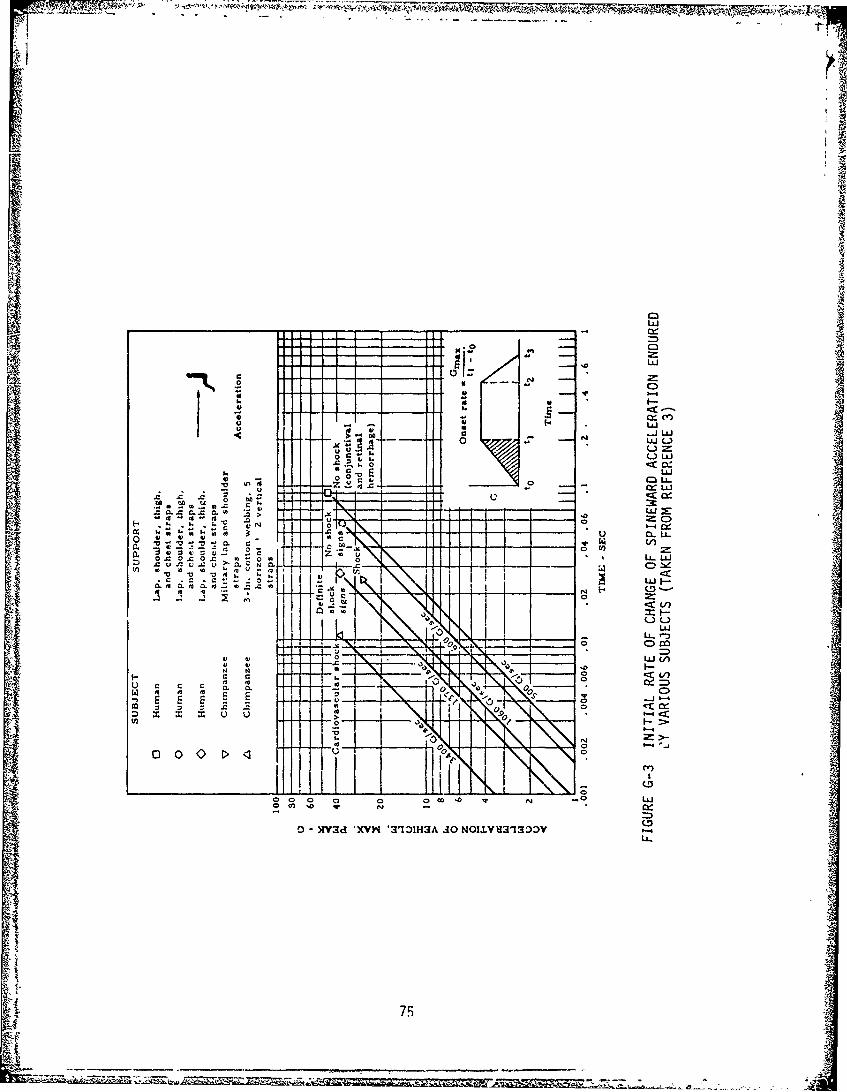
w
40)
=a -jL)LJ
Lui
- 00
o~ C/)o CdZ
0 .4 LL - r f
CC V
c.~co
E 0 1""o F-
0 o
- (D
75
The amount of slack in the restraint system can affect toleranceto a given input acceleration pulse. In general, the more rigid thelink between the occupant and the seat, the greater the occupants'tolerance to an abrupt acceleration. A loose restraint system canresult in the occupant's receiving a magnification of the accelerativeforce applied to the seat. This applied force will accelerate the seatover a certain distance. The inertia of the occupant will cause him tomaintain a near constant velocity, independant of the decreasing veloc-ity of the seat, until the slack in the restraint system is taken up.As this point is reached, the velocity of the occupant is abruptly re-duced to that of the seat at relatively high G levels, even exceedingthat of the seat. This is often referred to as "dynamic overshoot"which is a complex phenomenon involving the elasticity, geometry, andmass distribution of the occupant restraint and seat system.
Acceleration Forces on the Body (Figure G-4) apply to the following:
Tolerance Limits to Headward Acceleration: The human tolerancelimit for headward, eyeballs-down (+Gz) acceleratiun is a pulse ofapproximately 25G maintained for approximately 0.1 second. Injuries,primarily compression fractures of spinal vertebrae, do, on occasion,occur at this level. However, these fractures are not necessarily ofthe nature to incapacitate the occupant, and his ability to extricatehimself from wreckage should not be seriously impaired. The 25G tol-erance fgure is based on experimental testing of the strength of humanvertebrae and studies involved in the development and testing of variousejection seat systems and escape capsule landing systems.
Tolerance to vertical impact loads is greatly reduced when thespinal column is in a flexed position or is misaligned laterally. Forthis reason, a tight shoulder harness to hold the occupant's shoulderstightly against the seat back is an important factor in tolerance toheadward accelerations.
Tolerance Liwits to Tailward Acceleration: The human tolerancelimit for tailward, eyeballs-up (-Gz) acceleration is approximately 15Gfor a duration of 0.1 second. The shoulder harness/seat-belt restrainthas been used in all human testing with tailward accelerations. Mostexperiments have also included a seat belt tiedown strap, and the 15Gtolerance limit is based on this latter configuration.
Tolerance Limits to Spineward Acceleration: The human tolerancelimit for spineward, eyeballs-out (-G ) acceleration is approximately45G for a duration of 0.1 second or 29G for a duration of 0.2 second.Restraint in the experiments establishing these limits was by means ofa double-thickness, 3-inch wide shoulder harness; a seat belt with thighstraps, and a chest bel'. With less optimum restraint systems, somedebilitation and injuries will occur at this force level.
Tolerance Limits to Sternumward Acceleration: The human tolerancelimit for sternumward, eyeballs-in (+Gx) acceleration has not been accu-rately established. Due to the high degree of restraint provided by full-
76
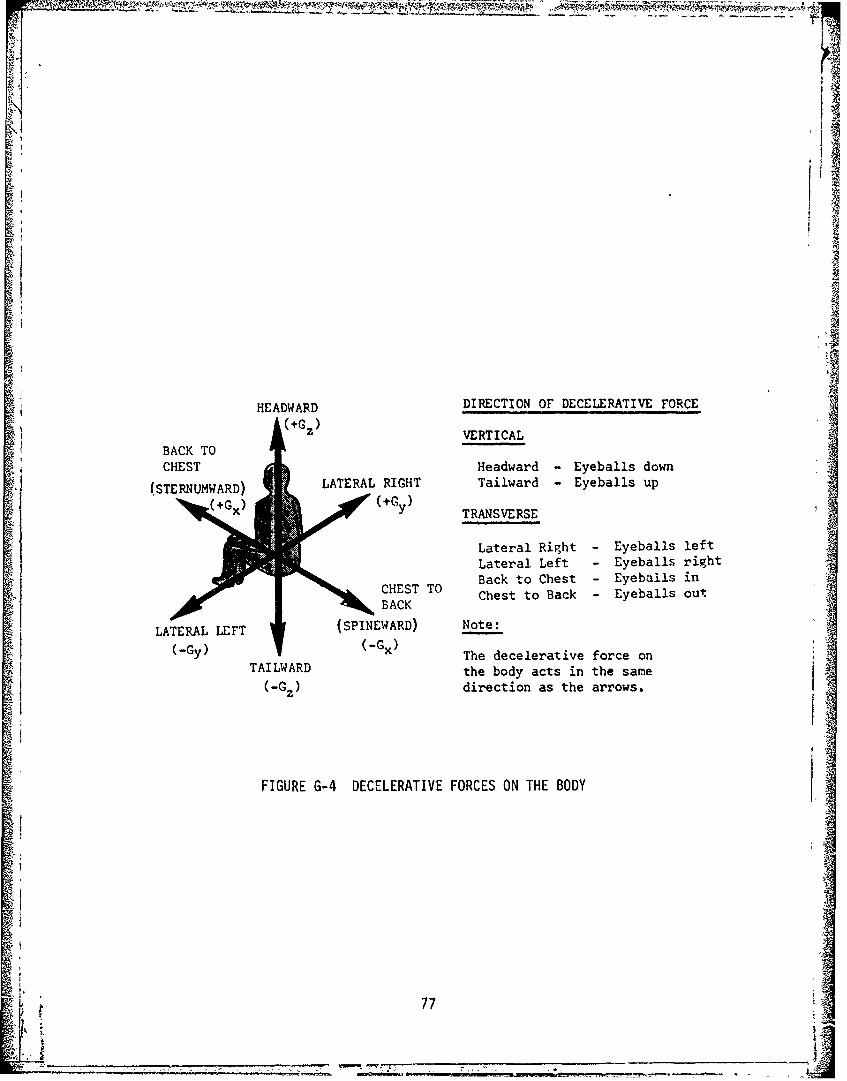
&
"I
HEADWARD DIRECTION OF DECELERATIVE FORCE
VERTICALi ~~BACK TO' !
SCHEST Headward - Eyeballs down
e (STERNUMWARD) LATERAL RIGHT Tailward - Eyeballs up(STERNMW(+D ) +TRANSVERSE
Lateral Right - Eyeballs leftLateral Left - Eyeballs right
SBack to Chest - Eyeballs in
CHEST TO Chest to Back - Eyeballs outA BACK
LATERAL LEFT (SPINEWARD) Note:
(-Gy) (-G x) The decelerative force onTAILWARD the body acts in the same
(-GZ) direction as the arrows.
K
FIGURE G-4 DECELERATIVE FORCES ON THE BODY
I
!i77
- - - --
length seat back in this configuration, it can be safely assumed thattolerance is greater than for spineward acceleration. A maximum of 83Gwith a base duration of 0.04 second was experienced on one run in abackward-facing seat. However, the subject was extremely debilitated,went into shock following the test, and required on-the-scene medicaltreatment. Human tolerance to sternumward acceleration, therefore,probably falls somewhere between this figure of 83G for 0.04 second and45G for 0.1 second, which is the accepted end point for the -Gx (eye-balls-out) case.
Tolerance Limits to Lateral Acceleration: Very little research hasbeen conducted on human tolerance to lateral (vC ) accelerations. Twostudies, one involving restraint by a lap belt •lone and the other in-volving restraint by the seat belt/shoulder-harness configuration, pro-vide the principal available data. With restraint by the seat belt a-lone, volunteers were able to withstand a pulse with an average peak ofapproximately 9G for a duration of approximately 0.1 second. At thislevel, the tests were discontinued due to increasing danger from lateral
spinal flexion. In the experiments with restraint by seat belt andshoulder harness, volunteers were able to withstand a pulse with anaverage G of approximately 11.5 for a duration of approximately 0.1second and suffered no permanent physiological changes. Tests were dis-continued at this level due to possible cardiovascular involvement ex-perier,•ed by one of the two subjects tested. No end points for humantolerank'e to lateral impacts were proposed in the reports of these ex-periment,. The only reasonable conclusions from these data at this timeare that a pulse of l1.5G with a duration of 0.1 second is readily sus-tained by subzcj-s restrained by a seat belt and shoulder harn.ss andthat the human survival limit is at some point beyond this level, prob-ably at least 20G for 0.1 second.
It should be noted the above limits are based on shoulder harnessand in some cases additional restraint devices. Only in one test series
was only a lap belt used. This should result in caution in use of thisdata.
The guide further defines a dynamic triangular pulse based on timeand accelerations. Typical proposed design rules are shown in the tablebelow for 95th percentile survivable crashes.
IMPACT DIRECTION AVfps PEAKG AVERAGEG PULSE T SEC
Light Fixed-WingLongitudinal Cockpit 50 30 15 .104Longitudinal Passenger 50 24 12 .130
Vertical 42 48 24 .054Lateral 25 16 8 .097
Fixed Wing TransportLongitudinal Cockpit 64 26 13 .153Longitudinal Passenger 64 20 10 .200Vertical 35 36 18 .060Lateral Cockpit 30 20 10 .093Lateral Passenger 30 16 8 .116
7A
Airframe crash wcrthiness is a major area of discussion. What canbe done in the area of designing an airframe to lower effective Gs in acrash? For example, if the forward fuselage were to deform on impact andform a scoop it will plow into the earth. The plowing will result inhigher G forces than skidding. Therefore, a crash on a concrete surfacewould not have plowing and a lower G force. The fuselage can also bebuilt to better withstand these forces. Additionally, seats as well ascargo restraint systems can be designed to absorb some of these forcesand various designs are shown.
~off
7i
79
BIBLIOGRAPHY
Avery, James P., Cargo Restraint Concepts for Crash Resistance, U.S.Army Aviation Materiel Laboratories, June 1965.
Black, D.O., Facilities and Methods Used in Full-Scale Airplane Crash-Fire Investigations, NACA RME51LO6, March 1952.
Civil Air Regulations, Part 4b - Airplane Airworthiness Transport Cate-gories, Civil Aeronautics Board, December 1953.
Denzin, E.C., A Decelerator for Human Experimentation, AF-TR-5973,February 1950.
Fitzgibbon, D.P. and Vollmer, Reuben P.,Crash Loads Environment Study,August 1967, FAA Technical Report DS-67-2.
Haley, Joseph L., et. al., Floor Accelerations and Passenger Injuriesin iransport Aircraft Accidents, May 1967, USAALABS TR 67-16, U.S. ArmyTviatio' Materiel Laboratories.
Pinkel, 1.1., et. al., Mechanism of Start and Development of AircraftCrash Pires, NACA TR-1133 August 1952.
Pinkel, I.I., et. al., Mechanism of Start and Development of AircraftCrash Fires, NACA RME52FO6.
Reed, William H., Cargo Restraint Experiment, Full-Scale Crash Test ofCH-34 Helicopter, Memorandum Report AUSERM65-19, U.S. Army AviationMateriel Laboratories, 1965.
Ru..so, A., Aircraft Cargo Restraint System, USAAVLABS TR-66-50, U.S.Army Aviation Materiel Laboratories, September 1966.
Stapp, J.P., Human Exposures to Linear Deceleration, Part 2, AF-TR-5915,December 1951.
Tuttie, Warren D., et. al., Cargo Restraint Requirements for STOL TypeAirrraft, Directorate of Aerospace Safety, March 1977.
MIL-A-8865, Airplane Strength and Rigidity - Miscellaneous Loads,November 7, 1973.
MIL-A-8421, Air Transportability Requirements, General Specification For,October 25, 1974.
MIL-A-8629, Airplane Strength and Rigidity, August 1953.
MIL-S-5705, Structural Criteria, Piloted Airplanes Fuselage, Booms, EngineMounts and Nacelles, December 1954.
IL ip
ANC-2, Ground Loads Handbook, October 15, 1941; March 1, 1948; October1952.
Air Corps Specification No. C-1803A, November 15, 1938.
Air Corps Specification No. C-1803A, December 5, 1941.
Army Air Force Specification R-1803-4A, October 22, 1945.
Army Air Force Specification C-1803E, April 2, 1946.
Williams, J.L., et. al., Cargo Restraint Criteria and Methods Study,SCLAP-TR-69-63, Lockheed-Georgia Co. and Air Force Systems Command,November 1969.
Weingarten, J.L., et. al., Air Cargo Restraint Criteria, AFFDL-TR-71-139,January 1972.
Weingarten, J.L., et. al., Final Report - Air Cargo Restraint Criteria,ASD-TR-73-17, April 1973.
Preston, G.M., et. al., Accelerations in Transport Airplane Crashes,NACA-TN-4158, Lewis Flight Propulsion Laboratory, February 1958.
Reed, W.H., et. al., Full-Scale Dynamic Crash Test of a Douglas DC-7Aircraft, FAA-ADS-37, Federal Aviation Agency, April 1965.
Reed, W.H., et. al., Full-Scale Dynamic Crash Test of a LockheedConstellation Model 1649 Aircraft, FAA-ADS-38, Federal Aviation Agency,October 1965.
IGDM 127-1, Aircraft Accident and Incident Classification Elements andFactors, Department of the Air Force.
Turnbow, J.W., et. ai., Crash Survival Design Guide, USAAVLABS TechnicalReport 70-22, US Army Aviation Materiel Laboratories.
Aircraft Accident Report, Flying Tiger Line, Inc., Douglas DC-8-63F,N785 Ft., NTSD-AAR-72-10, National Transportation Safety Board, July 27,1970.
Aircraft Accident Report, Flying Tiger Line, Inc., Douglas DC-8-63F,N785 Ft., Airline Pilots Association, February 1971.
Letter Report, Boeing Commercial Airplane Company, March 31, 1977,Reference Number B-8720-170
Letter Report, Lockheed-Georgia Co., 3 May 1977
Letter Report, Douglas Aircraft Co., 11 November 1977, Reference NumberCl-250-A-H7H
81*U.S.Government Printing Office: 1978 - 757-080/625