CARES Act Relief Aquaculture Working Group
18
CARES Act Relief Aquaculture Working Group • Call will be recorded • Please mute when you aren’t talking CARES Relief Aquaculture Working Group - June 10, 2020 Slide 1
Transcript of CARES Act Relief Aquaculture Working Group

CARES Act Relief Aquaculture Working Group
• Call will be recorded
• Please mute when you aren’t talking
CARES Relief Aquaculture Working Group - June 10, 2020Slide 1

Aquaculture Working Group
Goal: Advise larger advisory panel and DMF on sector-specific spending plan
Participants: Jeff Kennedy(co-chair); Tom Shields(co-chair); Mark Begley; Jack Blake; Aaron Brochu; Bill Doyle; Josh Reitsma; Scott Soares
CARES Relief Aquaculture Working Group - June 10, 2020Slide 2

Today’s Agenda
Introductions
CARES Relief Background
Discussion• Eligibility
• Payment Calculation
Next Steps
CARES Relief Aquaculture Working Group - June 10, 2020Slide 3
CARES Act Funding Disaster Relief
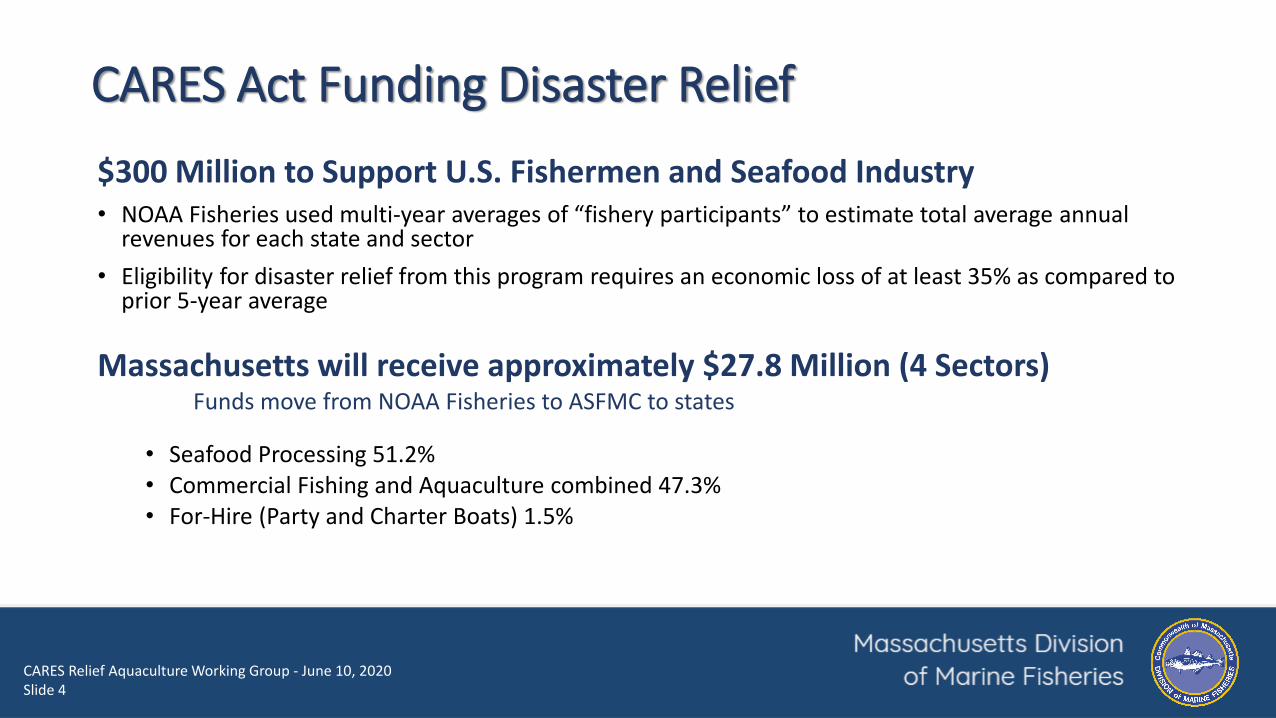
$300 Million to Support U.S. Fishermen and Seafood Industry• NOAA Fisheries used multi-year averages of “fishery participants” to estimate total average annual
revenues for each state and sector
• Eligibility for disaster relief from this program requires an economic loss of at least 35% as compared to prior 5-year average
Massachusetts will receive approximately $27.8 Million (4 Sectors)Funds move from NOAA Fisheries to ASFMC to states
• Seafood Processing 51.2%• Commercial Fishing and Aquaculture combined 47.3%• For-Hire (Party and Charter Boats) 1.5%
CARES Relief Aquaculture Working Group - June 10, 2020Slide 4

Value Estimates Among Four Sectors
51.2%45.2%
2.1% 1.5%
% of Estimated Annual Revenue by Sector -for Massachusetts
Seafood Processing
Commercial Fishing
Aquaculture
For-Hire
• Total revenue for all sectors = $1.4 billion
• If losses across all sectors combined reach 35%, then total state losses may be $500 million
• $28 million will not make industry “whole”
SectorPct of Total
Annual Value
(millions)
Wholesale Dealers 51.2% 716
Wild Capture Fisheries 45.2% 630
Aquaculture 2.1% 30
For-Hire (Party/Charter boats) 1.5% 21
Grand Total 100% 1,397
CARES Relief Aquaculture Working Group - June 10, 2020Slide 5

CARES Relief Aquaculture Working Group - June 10, 2020Slide 6
Revised Sector Allocation Proposal
Commercial Fishing: $11,828,404Aquaculture: $1,152,652
DMF recommends realigning the combined commercial/aquaculture percentage to more closely align
with each sectors current losses:
• ~68% aquaculture loss;• ~33% all commercial fisheries loss.

1
• Develop Spending Plan
• 2 or 3 meetings
2• Spending Plan Approval
3
• Application Period
• Review Period
4
• Award
• Appeals
5• Payments
Timeline
CARES Relief Aquaculture Working Group - June 10, 2020Slide 7

Aquaculture Sector (farm-raised shellfish)
- Aquaculture-growers primarily produce oysters and quahogs.
Oysters account for ~97% of all aquaculture landed value.
Aquaculture raised oysters account for ~97% of the value of all oyster harvest.
- Massachusetts Wholesale Dealers report those sales(landings) in SAFIS
- Growers were severely impacted by the loss of restaurant trade as 70 % of all seafood
is sold in restaurants and other food service companies.
• 391 Total Aquaculture Permit Holders
• 272 Growers (preliminary data)
• Who are residents and >17yo
• Have 2020 propagation or aquaculture permit
• With activity 2017-19
CARES Relief Aquaculture Working Group - June 10, 2020Slide 8

CARES Relief Aquaculture Working Group - June 10, 2020Slide 9
*Atlantic Surf Clams are not included as 2020 landings are unavailable to the Fisheries Statistics Project. **Data pulled as of 5/21/20
-100.00%
-80.00%
-60.00%
-40.00%
-20.00%
0.00%
20.00%
40.00%
60.00%
80.00%
FEB MAR APR
Perc
ent
Ch
ange
Change in Value for Aggregated Shellfish*
-100.00%
-80.00%
-60.00%
-40.00%
-20.00%
0.00%
20.00%
40.00%
60.00%
80.00%
FEB MAR APR
Perc
ent
Ch
ange
Change in Value for Top Shellfish Species
QUAHOG RAZOR CLAM SOFTSHELL CLAM
EASTERN OYSTER SEA SCALLOP
Shellfish Ex-Vessel Value **

Mandatory Eligibility Criteria
• Massachusetts Resident
• Holds a 2020 Shellfish Propagation or Aquaculture permit
• Suffered a documentable 35% or greater loss in revenue compared to previous
5-year average due to Covid-19 impacts (can be established by self-certification)
• The net benefit of all CARES relief funds received CANNOT total
more than normal revenues (can be established by self-certification)
• Be >17 years of age as of the end of the application period
• No federal violations
CARES Relief Aquaculture Working Group - June 10, 2020Slide 10

Eligibility – Discussion Points
• Does Unemployment or PPP or other COVID-19 relief disqualify or
reduce payout (e.g. drop to lower tier)?
• Eligibility period: Aquaculture Activity in one of last 3 years (2017-2019)
March through May? (does this need to be harmonized with CF sector)
• Should there be some minimum revenue requirement to qualify?
If so, how much/how would this be determined?
CARES Relief Aquaculture Working Group - June 10, 2020Slide 11

Other Relief
What are the other pandemic relief to be taken into account?
• Loans vs direct relief payments• Payroll Protection Program (PPP)• Economic Injury Disaster Loans• SBA Loans and Debt Relief
CARES Relief Aquaculture Working Group - June 10, 2020Slide 12

CARES Relief Aquaculture Working Group - June 10, 2020Slide 13
Aquaculture Data Source• SAFIS Dealer Data
• Dealers electronically report all transactions, including price paid to growers, with commercial fishermen on a weekly basis.
• Data are held strictly confidential and only released in aggregate.
• Gapfilling metrics used to replace null or 0 reported prices with species/market/grade/unit averages (normal practice when assessing annual value)
• Query-• Pulled highest estimated annual ex-vessel value of aquaculture landings in the
previous 3 years (2017-2019) by permit holder.• Data were pulled 6/3/2020.• Caveats:
• Dealer data may attribute landings to wrong permit number.• Aquaculture landings may be mis-identified, particularly in 2019 as the review has not yet
been finalized.

Determining Minimum $ Eligibility
CARES Relief Aquaculture Working Group - June 10, 2020Slide 14
• Each bin contains 27 growers
• 100th percentile not displayed
• Majority of permit holders sell < $48,000/year
• 75% of permit holders sell < $149,000/year
$2,800 $8,900 $16,500$28,600
$47,800$68,700
$112,400
$187,000
$296,300
$0
$50,000
$100,000
$150,000
$200,000
$250,000
$300,000
$350,000
10th 20th 30th 40th 50th 60th 70th 80th 90th
Ex-V
esse
l In
com
e
Percentile of Growers Ranked by Annual Ex-Vessel Value
Maximum Single Year Landings Value of Growers

Approach – Discussion Points
• Scaled or Tiered payments
• Should tiered – discrete payment system or calculation be used?
(If no scaling/tiering and all eligible, the payment would be approx $4,200 per permitted grower)
• Should payments be scaled?
• Maximum cap or ceiling on payment to single entity?
• Time period for losses e.g. March through May???
• Other program?
CARES Relief Aquaculture Working Group - June 10, 2020Slide 15
Goal should be to have simplistic, transparent approach using easily verifiable data.

Preferred Tiered Payment System
• 272 growers
• With minimum eligibility value of $15K -> 29%
• Divide remaining permits holders into quartiles
• 48 growers per Quartile
• Each Tier equals the number of shares
• Calculate number of shares (1x48)+(2x48)+(3x48)+(4x49) = 484 Total shares
• Calculate value of share by dividing sector allocation by total shares
$1,152,652 / 484 = $2,382
CARES Relief Seafood Processor Working Group- June 8, 2020CARES Relief Aquaculture Working Group - June 10, 2020Slide 16
Tier/ Quartile
Count of Harvesters
Min Value Max Value
Estimated Payment
Per Permit0 79 $0 $15,000 $01 48 $15,000 $42,800 $2,3822 48 $42,800 $82,000 $4,7633 48 $82,000 $205,000 $7,1454 49 $205,000 $1,200,000 $9,526
Why is this approach preferred?1) Conceptually simple.2) Graduated payment based on total annualized revenue. 3) Estimated payments do not exceed 35% of tier’s minimum value. 4) Attempts to balance relative loss against total loss.

Next Steps
• Do we need a second working group meeting?
• Working Group draft-• Recommendations for eligibility • Any scaling factors to increase payment based on scale of business• What filters should be considered? Min/max; COVID-19 Relief; etc.• Establish application period for sector to apply
• Compile the overall recommendation for submittal to Administration,ASMFC and NOAA Fisheries.
CARES Relief Aquaculture Working Group - June 10, 2020Slide 17