Career Tracking of Doctorate Holders - esf.org · Index of Tables Table 1. Survey response rate by...
68
Career Tracking of Doctorate Holders Pilot Project Report
Transcript of Career Tracking of Doctorate Holders - esf.org · Index of Tables Table 1. Survey response rate by...

Career Tracking of Doctorate HoldersPilot Project Report

AXA Research Fund – AXA RF
Protecting its clients and the community from risks is at the core of AXA’s purpose. Convinced that researching today will help better protecting tomorrow, the AXA Group created the AXA Research Fund in 2007. Its mission is to boost scientific progress and discoveries that contribute to understand and better prepare against environmental, life and socio-economic risks.
www.axa-research.org
Fonds National de la Recherche – FNR
Since its creation in 1999, the Fonds National de la Recherche (FNR – National Research Fund) has become a key actor in building a high-quality research system in Luxembourg. The FNR provides funding for all branches of science and the humanities with an emphasis on strategically aligned research domains.
www.fnr.lu
The Goethe Graduate Academy – GRADE
The Goethe Graduate Academy – GRADE supports junior researchers from all faculties at the Goethe University Frankfurt. Its purpose is to educate outstanding leaders – inside and outside academia. Therefore GRADE offers a diverse and high-quality programme for doctoral candidates and postdocs.
www.grade.uni-frankfurt.de
Paul Scherrer Institute – PSI
The Paul Scherrer Institute, PSI, is the largest research centre for natural and engineering sciences within Switzerland. It performs world-class research in three main subject areas: Matter and Material; Energy and the Environment; and Human Health. By conducting fundamental and applied research, PSI works on long-term solutions for major challenges facing society, industry and science.
www.psi.ch
The Special Programme for Research and Training in Tropical Diseases, a co-sponsored programme of UNICEF, UNDP, the World Bank and WHO
TDR, the Special Programme for Research and Training in Tropical Diseases, is a global programme of scientific collaboration that helps facilitate, support and influence efforts to combat diseases of poverty. It is hosted at the World Health Organization (WHO), and is sponsored by the United Nations Children’s Fund (UNICEF), the United Nations Development Programme (UNDP), the World Bank and WHO.
www.who.int/tdr
European Science Foundation – ESF
ESF is committed to achieving the highest quality science in Europe to drive progress in research and innovation. We help our Member Organisations collaborate internationally on research programmes that we coordinate in almost every scientific domain. We provide services to the science community, including peer review, evaluation and conferences, as well as support career tracking. ESF also hosts high-level expert boards and committees to support them in achieving their objectives.
www.esf.org
Project Team
Dr Maria Manuela NogueiraProject Manager and Editor Senior Science Officer, ESF
Rhona Heywood-RoosProject Coordinator and Editor Principal Administrative Officer, ESF
Siobhan PhillipsSurvey Methodology Advisor and Lead Author Senior Science Officer, ESF
Dr Beate ScholzExternal Advisor and Focus Group Facilitator Scholz Consulting Training Coaching
Martin HynesESF Chief Executive and Project Champion
www.esf.org/career-tracking-pilot
Pictures: © iStockISBN: 978-2-36873-013-3Printing: Ireg – Strasbourg

Contents
Foreword 5
Executive Summary 7
1. Introduction 12
2. Methodology 132.1 Data protection arrangements 13
2.2 Questionnaire design 13
2.3 Contact, follow-up procedures and statistical analysis 14
2.4 Focus groups and organisational specific statistical reports 16
3. Results 173.1 Profile of respondents 17
3.2 Relationship between doctoral completion time and age, scientific domain and route (structured or classical) 17
3.3 Employment status, areas and gender 18
3.4 Nature of employment 18
3.5 Salary levels and relationship to occupational area, gender and age 19
3.6 Gender, seniority and salary levels 21
3.7 Post-doctorate choices and supports 22
3.8 Mobility 22
3.9 Extent to which doctorate holders work or study in other countries/regions 24
3.10 Impacts 25
3.11 Satisfaction with current working environment 26
3.12 Assessment of questionnaire 27
4. Discussion and Conclusions 284.1 Methodological approach 28
4.2 Career trajectories and gender 29
4.3 Doctorate completion times and tenure 29
4.4 Sectoral mobility 31
4.5 Geographic mobility 32
5. Recommendations 345.1 Future studies 34
5.2 Recommendations of relevance to doctorate holder funding/sponsoring organisations 34
5.3 Recommendations of relevance to European policy-makers 35
Appendices 37Appendix I: Compilation of findings from focus groups 39
Appendix II: Online questionnaire results 44
Appendix III: Independent Samples Student’s t test on satisfaction levels with aspects of working situation 60
Appendix IV: Glossary of statistical terms 62
Appendix V: List of abbreviations and acronyms 64

Index of Tables
Table 1. Survey response rate by Participating Organisation (PO) 15
Table 2. Researchers by career stage and gender 19
Table 3. Occupational area and gender 19
Table 4.Salary levels (all respondents and all types of employment) 20
Table 5. Salary/stipend levels by occupational group 20
Table 6. Male and female full-time salary levels 21
Table 7. Geographic mobility 23
Table 8. Respondents’ region of origin (citizenship), region of doctorate and current region of work 24
Table 9. Respondents who completed post-doctoral positions in or prior to 2012 24
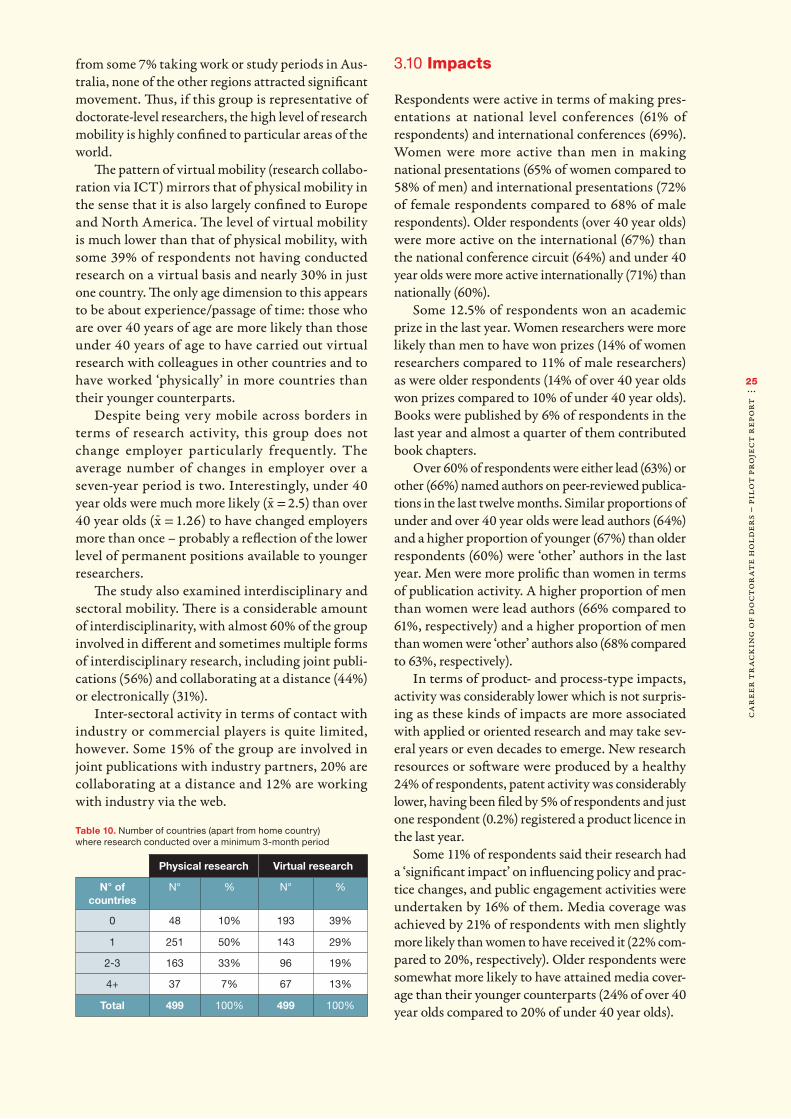
Table 10. Number of countries (apart from home country) where research conducted over a minimum 3-month period 25
Table 11. Comparison of outputs/impacts for permanent and temporary post-holders in previous twelve months 26

Care
er T
rack
ing
of D
oct
orat
e H
olde
rs –
Pil
ot
Proj
ect
Repo
rt
3
Acknowledgements
This career tracking pilot study could not have been carried out without the financial, intellectual and collegiate support of the participating organisations: the AXA Research Fund (AXA RF), France, the Fonds National de la Recherche (FNR), Luxembourg, the Goethe Graduate Academy (GRADE), Goethe University Frankfurt, Germany, the Paul Scherrer Institute (PSI), Switzerland, and TDR, the Special Programme for Research and Training in Tropical Diseases, a co-sponsored programme of UNICEF, UNDP, the World Bank and WHO.
The active and enthusiastic participation in all stages of an unfolding process of Julien Desfloquet (AXA RF), Ulrike Kohl (FNR), Dr Heike Zimmermann-Timm (GRADE), Dr Ines Günther-Leopold (PSI) and Dr Pascal Launois (TDR) was of inestimable benefit to the ESF team in helping define and shape the project initially and achieve the overarching, collective and individual organisational goals.
Equally strong thanks and warm appreciation are extended to the two international experts: Professor Maresi Nerad, Center for Innovation and Research in Graduate Education (CIRGE), University of Washington, Seattle, USA and Dr Eric Iversen, Senior Researcher, Nordic Institute for Studies in Innovation, Research and Education (NIFU), Oslo, Norway, for meticulously peer reviewing the survey template and for making many helpful and insightful suggestions for improvement prior to its launch.
The willingness of the majority of doctorate holders surveyed and focus group participants to share their career experiences, challenges and wisdom was instrumental to the success of the project. We would like to express our strong appreciation to them and very much hope that our efforts reflect and do justice to their valued contributions.
The project team is also extremely grateful to the ESF staff members who tested the preliminary version of the survey and gave early and essential feedback on its comprehensibility and relevance: Julia Boman, Nan-Chin Chu, Dr Leonard Ciubotaru, Emmanouil Detsis, Dr Marie Fleck, Sarah Moore, Dr Marie Pelé, Dr Antti Tahvanainen and Dr Jean-Claude Worms.
Maria Manuela Nogueira Project Manager on behalf of the Project Team


Care
er T
rack
ing
of D
oct
orat
e H
olde
rs –
Pil
ot
Proj
ect
Repo
rt
5The formation and post-doctoral development of researchers is expensive. Yet such investment is accepted as a critical element in the development of advanced societies. Are we making the right choices?
The European Science Foundation (ESF) has studied research careers through various members’ initiatives, culminating in the work of the Member Organisation Fora ‘Research Careers’ and ‘European Alliance on Research Careers’1. An overview of this work can be found on the ESF website. The ESF and members also designed a variety of initiatives to sup-port career formation and early career researchers; one example being the European Young Investigator Awards (EURYI)2 scheme. Continued policy devel-opment work in this domain is carried out by the Science Europe Working Group on Research Careers3.
When seeking data on the effectiveness of vari-ous initiatives taken by individual Member States, private funders and the European Commission, one is struck by the relative paucity of up-to-date information in Europe. This is in contrast with data available from the US National Science Board4, which is comprehensive and forms a very sound basis for the formulation of appropriate policies.
With the evidence that we have, there are funda-mental differences between the US and Europe. The mobility between sectors of the economy is entirely different, with Europe still demonstrating low inter-sectoral mobility. Many nations have instigated tools to encourage increased collaboration, with shared
1. www.esf.org/oslo-workshop (final meeting of ‘European Alliance on Research Careers’: www.esf.org/earcd)2. www.esf.org/euryi 3. www.scienceeurope.org/policy/working-groups/research-careers 4. Science and Engineering Indicators: http://www.nsf.gov/statistics/seind14/
training and even joint positions. Much work has yet to be done in these areas with the aim of increasing the variety of career paths available to those with high skills and thus obtaining the best return on the initial investment by both society and the indi-vidual.
Geographic mobility is another story. However, the movement tends to be one-way – from Southern or peripheral countries into Northern European countries.
One of the most striking conclusions aris-ing from this career tracking pilot project is the observed difference in performance and satisfaction levels between those with employment continu-ity and those with temporary contracts. Those on permanent contracts are more productive and are also significantly more satisfied with the scientific environment of their workplace, its organisational culture and the support available for their career development. This is consistent with the ‘European Charter for Researchers’5 which supports key ele-ments in the European Union’s policy to make research an attractive career, itself a vital feature of its strategy to stimulate growth in the economy and in employment. The pervasive employment uncer-tainty during repeated post-doctoral appointments is a critical problem that militates against both the attractiveness of research as a career to new and tal-ented entrants, and the output of those researchers who have already commenced on that path.
It is probably the case that individual institu-tions have firm constraints that preclude opening up many more tenure-track positions. However, the overall conditions of employment of fully qualified
5. European Commission (2005). http://ec.europa.eu/euraxess/pdf/brochure_rights/am509774CEE_EN_E4.pdf [accessed online 2015]
Forewordl l l

Care
er T
rack
ing
of D
oct
orat
e H
olde
rs –
Pil
ot
Proj
ect
Repo
rt
6
and experienced researchers in Europe demand innovation to introduce concepts of ‘flexicurity’: to ensure conditions that minimise the impact of temporary periods between funding and contracts and to facilitate mobility into the highest areas of demand.
I would like to thank the following organisa-tions for their participation in the pilot project: the AXA Research Fund (AXA RF), France; the Fonds National de la Recherche (FNR), Luxembourg; the Goethe Graduate Academy (GRADE), Goethe University Frankfurt, Germany; the Paul Scherrer Institute (PSI), Switzerland; and TDR, the Special Programme for Research and Training in Tropical Diseases, a co-sponsored programme of UNICEF, UNDP, the World Bank and WHO.
Continued development of studies such as this pilot will provide sound evidence to aid policy mak-ers and those who devise funding support.
Martin HynesESF Chief Executive

Care
er T
rack
ing
of D
oct
orat
e H
olde
rs –
Pil
ot
Proj
ect
Repo
rt
7Introduction
This career tracking pilot study of doctorate-holding researchers has its origins in a 2012 ESF Member Organisation (MO) Forum report ‘Developing Research Careers In and Beyond Europe’, which artic-ulated a need for information on doctorate holders’ mobility patterns, making use of career surveys and statistical information across research institutions and different countries in Europe and beyond.
The aims of this career tracking study were:•To provide a mechanism for evidence-based human
resource/knowledge economy policy planning in an international, institutional and cross-sectoral setting
•To produce an online post-doctoral careers pro-gression and outcome instrument containing international reference indicators and data for mon-itoring, evaluation and policy planning purposes
•To gather relevant demographic, career mobility and social and economic outcome data including skills utilisation patterns and transfers
•To facilitate the identification of intervention points or actions to achieve desirable career pro-gression
•To pilot the processes involved in securing the necessary permissions in compliance with data protection and ethical obligations, to allow differ-ent participating research organisations to access the anonymised data and conduct supplementary analyses
•To provide participating organisations with an analysis of aggregate trends referenced to the OECD, Eurostat, Marie Curie, Wellcome Trust, UNESCO, US National Science Foundation (NSF) variables as relevant, and other salient metrics
•To provide participating organisations with anonymised top line data on their R2s (assuming statistical thresholds are met)
•To explore the sampling requirements of a scaled-up study and the feasibility of different methodologi-cal options.
Methodology
Five organisations participated in the project: the AXA Research Fund (AXA RF), France; the Fonds National de la Recherche (FNR), Luxembourg; the Goethe Graduate Academy (GRADE), Goethe University of Frankfurt, Germany; the Paul Scherrer Institute (PSI), Switzerland; and TDR, the Special Programme for Research and Training in Tropical Diseases, a co-sponsored programme of UNICEF, UNDP, the World Bank and WHO.
Each Participating Organisation (PO) contacted its population of doctorate holders over time periods of up to seven years for inclusion in the survey target sample.
The questionnaire was designed in consultation with the POs and referenced to existing macro-level surveys of doctorate holders. The range of topics included demographics, virtual, physical, sectoral and occupational mobility, research outcomes, roles and responsibilities, competence development, and skills utilisation.
Dr Eric Iversen from the Nordic Institute for Studies in Innovation, Research and Education (NIFU), Norway, and Professor Maresi Nerad from the Center for Innovation and Research in Graduate Education (CIRGE) at the University of Washington, Seattle, US, peer-reviewed the questionnaire prior to finalisation.
Executive Summaryl l l

Care
er T
rack
ing
of D
oct
orat
e H
olde
rs –
Pil
ot
Proj
ect
Repo
rt
8
age and security of employment: the older the cohort, the greater the level of permanent employ-ment. Only 27% of those under 40 years of age had permanent full-time contracts compared to 73% of those over 40 years of age.
•The vast majority of respondents work as researchers (88%), mainly in public sector institu-tions (82%) followed by non-profit organisations (7%), the private sector (5%) and others including public-private partnerships (5%).
•The principal reasons cited by those who had opted for non-research careers concerned dif-ficulties or barriers related to research careers specifically. Interest in other careers or posts were less important factors than challenges in getting a suitable or tenured research post.
•Men and women are concentrated in different occupational groupings with a much higher pro-portion of men than women in management, computer and physical science occupations and a higher proportion of women than men in social science occupations. Similar proportions work in life sciences, healthcare and education.
•There is no obvious evidence of gender pay dif-ferences within or across different occupational groups, but larger/representative country-based samples would be required to confirm this find-ing.
•The post-doctorate choices made by respondents were strongly informed by tradition and academic considerations mainly to do with strengthening their chances of gaining employment and deepen-ing their experience in their doctoral field.
•A high proportion is clearly willing to travel for career and academic progression purposes. Few (just 10%) had not worked or studied in another country, some 50% had worked in one country besides their home country and 40% had worked in multiple countries.
•Not surprisingly, the highest amount of mobility was within Europe followed by North America, with nearly half of the respondents having worked in more than two European countries other than their home country.
•While a scaled-up study is needed to reach robust conclusions about geographic mobility patterns, the findings indicate that in Europe there is strong geographical movement from Southern or peripheral countries into Northern European countries. A high proportion of those who move from the periphery to Northern European coun-tries (France, Germany, Switzerland, etc.) to undertake their doctorates stay in the doctorate destination country subsequently.
•Notwithstanding the level of physical/geographic
The final sample comprised 880 doctorate holders of whom 499 responded: this represents a response rate of 57%. Data were imported into the Statistical Package for the Social Sciences (SPSS) for analysis. Descriptive and inferential statistics were performed as appropriate to the subgroup size and variable relationships/comparison points under study.
Focus groups were held with small groups of between three and six doctorate holders from each of the POs (see Appendix I). PO-specific focus group reports were prepared and complemented by a set of PO-specific statistical reports that contained comparative analyses referenced to the benchmark results of all respondents/cohorts (see Appendix II).
Results
A summary of the main statistical results is pre-sented below.•One third of the sample is currently in post-doc-
torate positions, another third completed their post-doctorate position in the last two years, and the final third completed the post-doctorate phase prior to 2011.
•The majority of respondents are working or study-ing in Europe (74%). Most are under 40 years of age, over half are men, just over 40% have chil-dren and 12% have other caring responsibilities. Less than 10% of the sample took a career break for a year or more and of those a higher propor-tion were women.
•Nearly half of those taking career breaks found it difficult or very difficult to return to their previ-ous position. This was more of an issue for men than for women.
•On average it took respondents 4.3 years to complete their doctorate. The majority (70%) of doctorates were achieved via the classical route (wholly research-based with supervisor/appren-tice relationship). Younger respondents were significantly more likely to complete in a shorter time period than their older peers.
•There were no gender differences in completion times. However, those who completed doctorates in Social Sciences and Humanities domain areas took significantly longer than those completing doctorates in exact science domains.
•The employment level of respondent doctorate holders is very high (99%) with the majority in full-time employment (89%), but with a minority in tenured posts (35%). Men were no more likely than women to be in tenured posts.
•There is a very strong linear relationship between

Care
er T
rack
ing
of D
oct
orat
e H
olde
rs –
Pil
ot
Proj
ect
Repo
rt
9
movement, this group does not change employer particularly frequently (the average is twice), but with younger respondents more likely to have changed more often, reflecting their lack of job security.
•The pattern of virtual mobility (research col-laboration via ICT) is much lower than physical mobility, but mirrors it in the sense that it is also largely confined to Europe and North America.
•There is a considerable amount of interdiscipli-narity. However, inter-sectoral activity in terms of contact with industry or commercial players is quite limited. Some 15% of the group are involved in joint publications with industry partners; 20% are collaborating at a distance and 12% are work-ing with industry via the web.
•In terms of levels and types of output, respond-ents were most prolific in terms of conference presentations and publications, as befits a pre-dominantly basic research-oriented group. Some 12.5% won an academic prize in the last year, new research resources or software were produced by a healthy 24% of respondents, patents were filed by 5% of respondents and just one respondent (0.2%) registered a product licence in the last year.
•Some 11% of respondents said that their research had a ‘significant impact’ on influencing policy and practice changes, 16% undertook public engagement activities, and media coverage was achieved by 21% of respondents.
•There were notable differences between the out-puts/impacts produced in the previous twelve months by those on permanent contracts com-pared to their peers on temporary contracts.
•Those on temporary contracts were more likely to have presented work at international conferences. Those on permanent contracts were more likely to have been awarded an academic prize than those on temporary contracts (15% compared to 11%), twice as likely to have filed a patent, nearly three times as likely to have had an impact on policy and considerably more likely to have undertaken public engagement activities.
•The aspects of their working environment respondents were most satisfied with were firstly the prestige of the organisation for which they work, followed by the scientific environment, the contribution they feel they are making to society and, equally, the research infrastructure of the organisation in which they work.
•The lowest or most negatively rated factors6 included ‘job security’, closely followed by ‘sup-
6. Most of the smaller number of comments attributed to ‘other’ also concerned lack of job security and low remuneration rates.
port for career development’ and ‘organisational culture’.
•A negative rating for ‘job security’ was strongly associated with employment status – some 62% of those in temporary contracts said they were ‘fairly’ or ‘very dissatisfied’ with this aspect of their current employment situation compared to 19% of those on permanent contracts.
Conclusions
The pilot demonstrated that it is possible to produce data that are highly representative of the POs under study and which are of considerable value for pol-icy-making and benchmarking purposes at national and institutional levels. This approach, and the tool devised to survey alumni, is a highly appropriate and cost-effective way to investigate career mobility patterns in a cross-sectional or longitudinal manner, and across a wider range of research funding and research performing organisations.
The shorter average doctorate completion time of younger respondents is consistent with the con-siderable decrease in the median PhD completion time reported by the (US) Council of Graduate Schools over the past two decades. Reasons for the reduction in completion time include shorter funding periods and the possible commodification/reduction in quality of the PhD as more and more countries dramatically expand their doctoral educa-tion programmes.
Higher numbers make for more competition in respect of post-doctorate and tenured positions. Tenure or the increasing lack of it is a major issue causing instability at structural, professional and personal levels. For those in the pilot who opted for non-research careers, the low level of tenured oppor-tunities was the main reason cited.
One of the most striking findings from the sur-vey is that those on permanent contracts were more productive than those on temporary contracts in key areas, i.e. they were:•Twice as likely to produce patents•Nearly three times as likely to have had a signifi-
cant impact on policy or practice•More likely to have been awarded an academic
prize•Nearly twice as likely to have undertaken public
engagement activities
Those on permanent contracts were also signifi-cantly more satisfied with the scientific environment of their workplace, its organisational culture and career development support.

Care
er T
rack
ing
of D
oct
orat
e H
olde
rs –
Pil
ot
Proj
ect
Repo
rt
10
(95%) and intervals. For most if not all countries in Europe, sample sizes required are unlikely to be larger than 1,000 persons.
•Great care should be taken in conducting analysis of gender, salary and geographic movements across national boundaries because of the potential for statistical distortions, based on sampling errors, to arise. Large national samples are needed for a cross-country comparative analysis of this nature.
Recommendations of relevance to doctorate holder funding/sponsoring organisations•Universities and post-doctorate funding/spon-
soring institutions should establish/maintain up-to-date contact details for their alumni to enable follow-up studies to be conducted routinely.
•Doctorate holders are highly geographically mobile for career and knowledge advancement purposes. Mobility has benefits and costs at national, institutional and individual levels. While awareness of the benefits is widespread, the pres-sure to be geographically mobile can be difficult for those who have family/caring responsibilities. Doctorate, particularly post-doctorate, sponsoring institutions need to recognise this in their funding models and ensure that mobility is not a perceived or real precondition for funding or advancement.
•The academic career expectations of doctorate candidates need to be managed in ways that rec-ognise that only a tiny proportion of those who undertake PhDs will progress into a career in aca-demia. More should be done to develop greater awareness of, and knowledge about, relevant careers outside of academia in consultancy, indus-try, government and elsewhere.
•Those responsible for post-doctorate education and employment at national level should examine how well they prepare PhD students and post-doctorates for employment outside academia and make necessary improvements/adjustments to training.
Recommendations of relevance to European policy-makers•While this study is not definitive, it appears that
geographic mobility in Europe from peripheral to Northern European economies is largely unidi-rectional. A lack of adequately funded doctorate and post-doctorate opportunities in peripheral countries/Southern Europe risks undermining development and driving further asymmetries. Policies that monitor and support more balanced regional inflows/retention of doctorate holders need to be explored at national and European level.
If those on permanent contracts are more pro-ductive in terms of societal and economic impacts and more satisfied with important aspects of their work environment, the system of temporary con-tracts that prevails is not of benefit to science nor to society and needs to be examined.
The tenure issue is not divorced from other mar-ket failures. The preference of doctorate holders is usually a career in academia despite the chal-lenges involved in securing a tenured position. This preference is not sustainable in the context of ever-increasing numbers of doctorate holders seeking employment in a sector that is already oversupplied. Addressing the reasons for low levels of transfer to other employment sectors, including information asymmetries about alternative career choices and the perceived lack of attractiveness of employment in the private sector, needs to be centre stage on European and national policy agendas.
There is a strong rationale for this study to be scaled-up in future. This would allow a more robust exploration of the implications of the current early career model for doctorate holders and ongoing study of what appear to be important geographic mobility trends. It would facilitate the develop-ment of nuanced policy responses at regional and national level to a number of risks, including that of an increasingly two-tier Europe, which is, of course, completely antithetical to the aims of the European Research Area (ERA).
Recommendations
Future studies•The pilot study should be widely disseminated
and efforts made to scale it up to a larger study. Consideration should be given to country-level studies employing sampling frames compatible with representativeness and rigorous analysis of gender, tenure and other trends.
•Ideally, a probability-based sampling method would be used to select institutions and samples for inclusion in future studies either at the level of university/funding/sponsoring organisations or from centralised national databases.
•In terms of practicalities, a minimum institutional end sample size of circa 100 doctorate holders is needed to allow even basic statistical analysis at organisational level. Hence, only those institutions with these kinds of numbers should be included in any sampling frame.
•National target sample size should be determined on the basis of the number of doctorate holders in the population and standard confidence levels

Care
er T
rack
ing
of D
oct
orat
e H
olde
rs –
Pil
ot
Proj
ect
Repo
rt
11
•Temporary/insecure employment is a cause of considerable dissatisfaction and stress amongst the post-doctorate population. The lack of tenure-track positions for doctorate-holding researchers should be critically examined with a view to devel-oping alternative models that provide structured opportunities for tenured employment.
•The growing supply of doctorate holders and the lack of absorptive capacity in academic institu-tions need to be explicitly recognised by European policy-makers and actively addressed in terms of university career guidance, employer engage-ment and practical course-based preparation for research posts in finance, industry and other sec-tors.
Care
er T
rack
ing
of D
oct
orat
e H
olde
rs –
Pil
ot
Proj
ect
Repo
rt
12 This career tracking7 pilot study of doctorate-hold-ing researchers has its origins in an ESF Member Organisation (MO) Forum report entitled: ‘Developing Research Careers In and Beyond Europe’ (2012), which was produced through the collaborative efforts of 21 research organisations. It drew on the findings of an international workshop co-hosted by the ESF and the National Research Fund (FNR) of Luxembourg in February 2012 which, for the first time, put career tracking of researchers on the international research policy agenda.
The MO Forum report recognised that the realisa-tion of a successful European Research Area (ERA) was dependent on a critical mass of skilled researchers and diversity of research groups. It articulated a need for information on research careers in Europe and beyond, making use of career surveys and statistical information across research institutions and different countries in Europe and beyond.
This study attempts to overcome some of the obstacles identified in the MO Forum report, includ-ing feasibility issues and comparative data challenges by designing a joint methodology and collaborative approach to the career tracking survey design and implementation. As such, the aims were:•To provide a mechanism for evidence-based human
resource/knowledge economy policy planning in an international, institutional and cross-sectoral setting
•To produce an online post-doctoral careers pro-
7. Defined as initiatives that follow up researchers’ careers over a certain time period to understand researchers’ career pathways and/or surveys that trace back careers over several years. Cohort studies at several moments in time or longitudinal surveys are considered to fit the definition. ESF Member Organisation Forum ‘European Alliance on Research Careers, Developing Research Careers in and beyond Europe’ (2012). European Science Foundation, Strasbourg (p. 15). http://www.esf.org/fileadmin/Public_documents/Publications/mof _research_careers.pdf [accessed online 2015]
gression and outcome instrument containing international reference indicators and data for mon-itoring, evaluation and policy planning purposes
•To gather relevant demographic, career mobility and social and economic outcome data including skills utilisation patterns and transfers
•To facilitate the identification of intervention points or actions to achieve desirable career progression
•To pilot the processes involved in securing the neces-sary permissions in compliance with data protection and ethical obligations, to allow different participat-ing research organisations to access the anonymised data and conduct supplementary analyses
•To provide participating organisations with an anal-ysis of aggregate trends referenced to the OECD, Eurostat, Marie Curie, Wellcome Trust, UNESCO, US National Science Foundation (NSF) variables as relevant, and other salient metrics
•To provide participating organisations with anonymised top line data on their Recognised Researchers (R2s8), assuming statistical thresholds are met
•To explore the sampling requirements of a scaled-up study and the feasibility of different methodologi-cal options.
The approach taken to achieving these objectives is outlined in the following section.
8. According to the European Commission’s communication ‘Towards a European Framework for Research Careers’ (2011) http://ec.europa.eu/euraxess/pdf/research_policies/Towards_a_European_Framework_for_Research_Careers_final.pdf [accessed online 2015], the four career stages are: R1: First Stage Researcher (up to the point of PhD) / R2: Recognised Researcher (PhD holders or equivalent who are not yet fully independent) / R3: Established Researcher (researchers who have developed a level of independence) / R4: Leading Researcher (researchers leading their research area or field).
1.Introductionl l l

Care
er T
rack
ing
of D
oct
orat
e H
olde
rs –
Pil
ot
Proj
ect
Repo
rt
13A call for interested research performing and fund-ing organisations to join a pilot doctorate holders career tracking project was launched in late 2013. Five organisations joined the project: the AXA Research Fund (AXA RF), France; the Fonds National de la Recherche (FNR), Luxembourg; the Goethe Graduate Academy (GRADE), Goethe University of Frankfurt, Germany; the Paul Scherrer Institute (PSI), Switzerland; and TDR, the Special Programme for Research and Training in Tropical Diseases, a co-sponsored programme of UNICEF, UNDP, the World Bank and WHO.
The Participating Organisations (POs) in the pilot study were asked to quantify their popula-tion of doctorate holders over time periods of up to seven years. The populations of doctorate com-pleters in all of the POs ranged from circa 100 to over 300 persons. It was agreed that the sampling frame would constitute the full population of doc-torate completers in each of the POs because the numbers were relatively small for statistical analy-sis purposes.
POs were asked to cleanse their contact lists of doctorate holders (or their equivalent) with a view to providing ESF with valid and up-to-date contact details.
2.1 Data protection arrangements
Before handing over any contact details to ESF, POs complied with the data protection require-ments of their jurisdiction. At that point, potential survey participants were told about the detailed data protection and confidentiality arrangements that were in place for the survey, which included destroying all contact details before conducting
any survey analysis and avoidance of any questions likely to yield sensitive or identifying information of any kind (dates of birth, thesis titles, sub-disci-plinary field, institutional names, etc.). They were also given written assurances that contact details would be used only for the purposes of contacting the doctorate holders during the activity period of the survey. The data protection standards were also detailed in the contracts between the ESF and the POs. The modalities of the survey were declared to the Commission Nationale de l’Informatique et des Libertés (CNIL)9, the independent French administrative authority protecting privacy and personal data.
2.2 Questionnaire design
The questionnaire was designed with reference to existing macro-level surveys of doctorate com-pleters conducted by OECD, Eurostat, Marie Curie, Wellcome Trust, UNESCO, US National Science Foundation (NSF) and others. Items of interest to the POs were also designed. The range of topics included demographics, virtual, physical, secto-ral and occupational mobility as well as research outcomes, roles and responsibilities, competence development, and skills utilisation. Participants were also asked to rate the questionnaire in terms of its clarity, relevance and design and to indicate their willingness to engage in follow-up surveys. Several early drafts of the questionnaire were pre-tested in-house by ESF staff members. In addition, the draft questionnaire was internationally peer-reviewed by two independent experts:
9. http://www.cnil.fr/english/
2.Methodologyl l l

Care
er T
rack
ing
of D
oct
orat
e H
olde
rs –
Pil
ot
Proj
ect
Repo
rt
14
•DrEricIversen from the Nordic Institute for Studies in Innovation, Research and Education (NIFU), Norway
•ProfessorMaresiNerad from the Center for Innovation and Research in Graduate Education (CIRGE) at the University of Washington, Seattle, US
Both reviewers were enthusiastic about the initia-tive and made a number of helpful suggestions to improve and fine-tune the questionnaire. It was sub-sequently circulated to all POs, whose comments were taken into account for the final version.
The final questionnaire contains 52 questions written in English. The first draft had around 40 questions, but a number were disaggregated for purposes of clarity. The design aim was to achieve a user-friendly experience while collecting a com-prehensive range of data. Approximately one third of the questions were obligatory, to facilitate the col-lection of metadata for cohort, sensitivity and other forms of analysis (e.g. mobility between academia and industry).
2.3 Contact, follow-up procedures and statistical analysis
Over 90% of doctorate holders (or their equivalent) contacted by the POs allowed their names go for-ward for survey contact purposes. PO contact lists were then handed over to the ESF and names and email addresses were entered into the online survey database. The survey was launched with an explana-tory cover note from the ESF in early September 2014. A key objective was to achieve a response rate of 60% and an estimate of the willingness of respondents to engage in this exercise over time (longitudinally).
The survey and personalised contact message was sent to each of the 988 potential respondents. Emails that bounced or failed were classified as invalid and removed from the sample. POs were asked for replacement/valid emails and those that were supplied were added to the sample.
Any queries received by the ESF team were dealt with on an individual basis, including practical questions on completing the survey and reassur-ances about bona fides. The number of respondents was logged on a daily basis, and the response level per PO on a weekly basis (see Figure 1).
Figure 1. Tracking responses to the survey
Invita(on to 988 recipients Failed: 101
16 opt-‐outs (9 previous, 7 new) & 85 bounced
response rate
177
Reminder 1 sent to 728 recipients + 44 updated
emails
Failed: 21 10 opt-‐outs & 11 bounced
response rate (+144)
321
Reminder 2 sent to 598 recipients + 6 updated emails
Failed: 14 5 opt-‐outs & 9 bounced
response rate (+54)
375
Reminder 3 sent to 536 recipients
Failed: 10 2 opt-‐outs & 8 bounced
response rate (+47)
422
Reminder 4 sent to 487 recipients
Failed: 2 2 opt-‐outs
response rate (+31) 453
Reminder 5 sent to 452 recipients + 102 new (updated) emails
Failed: 6 4 opt-‐outs & 2 bounced
response rate (+46)
499

Care
er T
rack
ing
of D
oct
orat
e H
olde
rs –
Pil
ot
Proj
ect
Repo
rt
15
As would be expected, response levels peaked at the beginning of the survey and there was an increased response level immediately after each fol-low-up reminder. A total of five follow-up reminder letters were issued. Where there was a notable difference in response levels across POs, the organ-isation concerned was contacted to take a special measure in the form of a targeted message from the PO. This provided an additional layer of cleansing, as certain emails failed at this stage, despite hav-ing been reported as valid via the email validation software tool.
It became very clear that one of the POs (GRADE) had not been able to cleanse lists as per the protocol. The level of failed email addresses was much higher than was the case for other POs and the response rate was much poorer (only 6% after the first week compared to 41% for the highest PO response rate). One of the issues was that some of the GRADE doctorate holders did not associate ‘GRADE’ with their post-doctoral support/fund-ing as there had been a name change in 2009. This may have added to the non-response rate. After dis-cussion with GRADE, email addresses were fully cleansed and supplemented where possible. GRADE also sent out a message to explain how the doctorate holders were related to it via the Goethe University of Frankfurt. However, it proved difficult to redress the balance as the initial momentum had been lost. GRADE’s final response rate remained significantly lower than other POs, despite additional efforts highlighting the importance of thorough checking of email addresses at the outset and communication of the relationship with the funding body.
The survey was closed in early November 2014 and all respondents were thanked. As can be seen from Table 1, the final sample comprised 880 doc-torate holders (i.e. the initial 988 minus invalid emails and opt-outs) of whom 499 responded (57%). The collective response rate of those organisations that were able to fully follow the protocol was 70% – high by any standards. This response rate signi-fies that the doctorate holder cohort is responsive and interested in providing feedback on their post-
doctoral experiences and that a longitudinal study would be possible if the sample was large enough and the cleansing and follow-up protocols followed.
It should be noted that while the target group for the pilot survey is doctorate holders, there are distinct differences between the PO respondent groups. For example, the PSI group are not alumni, they are either internal post-doctorates or in more senior PSI researcher positions.
There are other differences that produced statis-tical distortions, which are noted in the analysis. For example, salary levels in Switzerland skew average levels upwards and lower salary levels in low- and middle-income countries which are the TDR target countries have the opposite effect.
The survey data were imported into the Statistical Package for the Social Sciences (SPSS) for analysis. Descriptive statistics (frequencies, means and cross tabs), and inferential statistics (Pearson correlations10 and Student’s t test of independent means11) were performed as appropriate to the sub-group size and variable relationships/comparison points under study. For example, tabulations were largely confined to study of subgroups of over 100
10. A Pearson correlation measures the strength of the relationship between two variables, for example age and incidence of cancer or smoking and incidence of lung cancer. There is a statistically significant (i.e. the difference is greater than chance) correlation between smoking and incidence of lung cancer. The’ r’ score is a positive or negative measure of the strength of the relationship. A perfect positive/negative relationship measures 1.00/-1.00. In real life perfect correlations do not exist. Correlation should not be confused with causation – a strong correlation (highly positive or negative r score) might be suggestive of causation but further analysis to rule out coincidental or other factors, is required. 11. A Student’s t test measures the significance of the difference between two mean (average scores). It enables an assessment of whether or not the difference between mean scores is due to chance or other factors. For example, we might have a hypothesis that a group of men and women would score the same (null hypothesis) on a test of verbal reasoning. The t test allows an assessment of whether any difference between the average scores is due to chance or intrinsic differences (the p value or probability level). The standard benchmark is 5% (p=.05). When the p value is smaller than the significance level the null hypothesis is rejected and an alternative hypothesis is accepted. A result is seen as ‘significant’ when the p value is smaller than the significance level i.e. when the probability of what we observed occurring given the null hypothesis is true – a p value smaller than the cut-off point. Lower p values indicate higher levels of significance. A p value of .001** is ‘more significant’ than one of .05*.
Table 1. Survey response rate by Participating Organisation (PO)
Organisation N° – valid sample N° respondents Response rate
AXA Research Fund (AXA RF) 128 110 86%
Fonds National de la Recherche (FNR) 139 84 60%
Goethe Graduate Academy (GRADE) 314 105 33%
Paul Scherrer Institute (PSI) 182 122 67%
Special Programme for Research and Training in Tropical Diseases (TDR)
117 78 67%
Total 880 499 57%

Care
er T
rack
ing
of D
oct
orat
e H
olde
rs –
Pil
ot
Proj
ect
Repo
rt
16
subjects, i.e. broader groupings that included gen-der, older and younger age categories and region. Means were produced for comparisons of variables where Likert12 scores or interval forms of measure-ment were used.
2.4 Focus groups and organisational specific statistical reports
A series of focus groups was organised with small groups of between three and six doctorate holders from each of the POs. The purpose was to comple-ment and contextualise the survey while allowing participants to explore open questions and issues arising spontaneously and from the survey analysis. Each PO identified candidates from its contact list and tried to ensure a reasonable balance in respect of gender, age and scientific domain.
An independent facilitator convened the ses-sions and all focus groups were asked the same broad questions. Discussions were recorded and any similarities/differences were analysed. The modera-tor wrote up individual reports for each PO. Broad themes across focus groups or illuminating com-ments are threaded through the discussion section (Section 4). A summary of the focus groups’ content is provided in Appendix I.
The focus group reports were complemented by a set of organisational statistics for each PO and short organisationally specific reports that were ref-erenced to the benchmark results of all respondents/cohorts.
12. See http://www.simplypsychology.org/likert-scale.html
Care
er T
rack
ing
of D
oct
orat
e H
olde
rs –
Pil
ot
Proj
ect
Repo
rt
17North America (4%); South America (3%); Central America (1%) and Australia/New Zealand (1%).
In terms of age profile, most of the respond-ents (83%) are under 40 years of age with 47% in the 31-35 years age cohort. Women respondents are slightly younger than men: 85% of women are under 40 years of age compared to 82% of men.
Over half of the respondents are men (57%), just over 40% have children and 12% have other caring responsibilities. Male respondents were more likely (45%) than women (36%) to have children. Less than 10% of the sample took a career break for a year or more and a higher proportion of women (13% of women) did so than men (9% of men).
For those who did take a career break, nearly half (47%) found it difficult or very difficult to return to their previous position or into another suitable one (x̄ = 2.5)15. Male respondents found it more difficult (x̄ = 2.57) than women (x̄ = 2.41) to re-enter after a career break.
3.2 Relationship between doctoral completion time and age, scientific domain and route (structured or classical)
A very high proportion of the respondents had com-pleted their doctorates (93%) as would be expected. A small number had equivalent level qualifications or were in the process of completing doctorates.
The mean amount of time taken for respondents to complete their doctorate was 4.3 years16. The long-
15. The range was 1 (very easy) to 4 (very difficult). The closer the mean is to 1, the easier it was to re-enter.16. Those who had not completed their doctorates were excluded from the calculation.
The survey results are presented below and dis-cussed in Section 4. Responses to individual items are presented in Appendix II.
3.1 Profile of respondents
The 499 respondents had all been supported by their sponsoring organisations during their post-doctoral period. The support provided ranged from one year (12%) or less (7%)13 to three years (15%) or more (15%), with the majority (52%) receiv-ing support for two years. There was considerable variation across the POs in terms of the number of years for which support was provided. Two of the POs provided support for three years or more to the majority of their beneficiaries whereas for others two years of support was the average. Interestingly, those who were supported for three years or more rated the importance of their spon-soring organisation higher (mean, x̄ = 1.99) than those who received support of less than two years (x̄ = 2.28)14.
Some 32% of the sample is currently in post-doctorate positions, another third (33%) completed their post-doctorate position in the last two years, some 27% completed between 2007 and 2011 and a final few (6%) completed their post-doctorate posi-tion at some point prior to 2007 (see Appendix II for a more precise breakdown).
The respondents are currently working or study-ing in all regions in the world: the majority are in Europe (74%); followed by Africa (10%); Asia (7%);
13. Most of these are people who are in post-doctorate positions currently.14. The lower the mean (x̄, rating average), the higher the level of agreement, i.e. a lower mean indicates a higher satisfaction level.
3.Resultsl l l

Care
er T
rack
ing
of D
oct
orat
e H
olde
rs –
Pil
ot
Proj
ect
Repo
rt
18
est time taken was 13 years and three years was the shortest. There was a positive correlation between age and number of years to completion (r=.243).
An Independent Samples Student’s t test was per-formed to see if the different doctorate completion time of older and younger groups was statistically significant. The t test performed shows that ‘under 40 year olds’ were significantly more likely to com-plete their doctorate in a shorter time than ‘over 40 year olds’ (p<.001).
Differences in completion time between men and women were not statistically significant (p=.236) indicating that gender was not a factor in doctoral completion time.
Another t test was performed to examine the difference in mean scores between those who had doctorates in life or physical (exact) sciences and those with doctorates in social sciences and humani-ties (SSH). The t test showed that those with SSH doctorates took significantly longer than those who undertook doctorates in exact science domains (p=.001).
The relationship between the amount of time taken for doctorate completion and type of doc-toral course (classical, which was defined for the purposes of this study as independent research study under guidance of supervisor or structured, defined as involving combination of defined course work and independent research) was also examined. The majority of respondents (70%) achieved their doc-torate through classical means and it was expected that those who undertook the structured course would complete in a shorter period.
Some 28% of those who undertook structured doctorates achieved them in three years compared to 25% of their classical peers; 35% completed in four years compared to 43% of structured doctorate and relatively similar numbers took longer than four years as those doing classical doctorates. A Pearson correlation was performed to measure the strength of this relationship and it indicated that there was no significant relationship between length of time taken to complete a doctorate and the route taken (classical or structured).
3.3 Employment status, areas and gender
Most of the respondents (89%) are employed in full-time positions, either permanent (35%) or – more frequently – temporary positions (54%). Some 4% are in part-time posts and a very small proportion is self-employed (1%). The rate of unemployment amongst respondents is also very low (1%).
Most of the respondents (58%) are employed or engaged by a research institution and grant-funded by an external party. Some 37% are directly funded by the organisation for which they work. Those who are directly funded are only slightly more likely (37% of directly funded respondents) than the indi-rectly funded group (35%) to be in secure tenured posts.
There is a very strong linear relationship between age and security of employment; the older the cohort, the greater the level of permanent employ-ment. Only 27% of those under 40 years of age had permanent full-time contracts compared to 73% of those over 40 years of age.
In terms of gender differences, men were no more likely than women to be in full-time perma-nent employment (35% of male compared to 35% of female respondents). While the numbers are very small, women were twice as likely as men to be in part-time employment (7% of women com-pared to 3% of men) or self-employed (2% of women compared to 1% of men). Men were correspond-ingly more likely than women to be in temporary full-time posts (57% of men compared to 50% of women).
3.4 Nature of employment
The vast majority of respondents work in public sector institutions (82%) followed by non-profit organisations (7%), the private sector (5%), and others including public-private partnerships (5%).
Some 49% of respondents are in posts that are externally funded, 42% are directly employed and funded by the organisation they work in and 8% are in ‘other’ employment arrangements.
Most of the respondents (88%) work as academic researchers as per the Frascati definition17 (88% of under 40 year olds compared to 86% of over 40 year olds). Those who do not work as researchers were asked to indicate the reasons for not working in research. The most important reason cited was the lack of security of tenure associated with research posts (x̄ = 1.70) followed by difficulty in getting an academically suitable position (x̄ = 1.81) and lack of structure in research careers (x̄ = 2.05). Hence, the results indicate that main reasons people opted for other careers are to do with difficulties or struc-tural barriers related to research careers specifically. Interest in other careers (x̄ = 2.25) or interesting
17. OECD. Frascati Manual: Proposed Standard Practice for Surveys on Research and Experimental Development, 6th edition (2002). www.oecd.org/sti/frascatimanual [accessed online 2015]

Care
er T
rack
ing
of D
oct
orat
e H
olde
rs –
Pil
ot
Proj
ect
Repo
rt
19
women work in life sciences, healthcare and edu-cation. Significantly higher proportions of women work in social science occupations.
3.5 Salary levels and relationship to occupational area, gender and age
Some 95% of respondents provided their sal-ary levels, with just 5% preferring not to disclose. Salary levels follow a normal distribution curve with a downwards skew because of lower pay rates in African, South American and Eastern European countries compared to other regions and an upwards skew because of the higher than average salary levels of Swiss/PSI-based respondents.
As can be seen from Table 4, some 23% of respondents earned less than €30,000 and 19% earned between €30,000 and €40,000. Some 22% earned between €40,000 and €60,000 and 24% earned salaries in the next band, €60,000-€85,000. Just 7% earned over €85,000.
The €60,000-€85,000 salary band is the most frequently referenced (the mode) by respondents. However, if the PSI (Swiss-based) respondents are taken out of the analysis, the proportion of non-Swiss respondents occupying this salary band drops
alternative posts (x̄ = 2.22) were less important fac-tors than challenges in getting a secure and suitable research post.
Of the majority who work as researchers, 7% described themselves as R1s or first stage research-ers, 54% identified themselves as R2s or recognised researchers, 30% as R3s or established researchers and 8% as R4s or leading researchers.
As can be seen from Table 2, slightly higher pro-portions of women (58%) than men (50%) described themselves as R2s or recognised researcher and cor-respondingly lower proportions of women (26%) described themselves as R3s or established research-ers than men (33%). Similar proportions of men and women described themselves as R4s or leading researchers.
In terms of occupational areas, the highest proportion of respondents work in life science occupations (32%) followed by physical science occupations (25%), education (14%), social sciences (12%), IT/mathematical occupations, (11%) man-agement occupations (8%) and healthcare (7%).
As Table 3 demonstrates, men and women are concentrated in different occupational groupings. There are much higher proportions of men than women in management, computer and physical sci-ence occupations. Similar proportions of men and
Table 2. Researchers by career stage and gender
X30 Male Female Total
Career stage N° % N° % N° %
R1 First Stage Researcher 19 8% 11 6% 30 7%
R2 Recognised Researcher 123 50% 102 58% 225 54%
R3 Established Researcher 80 33% 45 26% 125 30%
R4 Leading Researcher 19 8% 14 8% 33 8%
Other (please specify) 3 1% 4 2% 7 2%
Total 244 100% 176 100% 420 100%
Missing (skipped question) 79
Total 285 213 499
Table 3. Occupational area and genderPercentages do not add up to 100% because respondents may work in more than one occupational area.
Men Women
Occupational area N° % N° %
Management 27 9% 11 5%
Computer & Mathematical 44 15% 10 5%
Life Sciences 82 29% 79 30%
Physical Sciences* 85 30% 33 15%
Social Sciences 26 9% 34 16%
Healthcare 21 7% 13 6%
Education 38 13% 33 15%
Other 24 8% 29 14%
* Disproportionate number of male Swiss respondents producing equivalent of sampling type error/distortion.

Care
er T
rack
ing
of D
oct
orat
e H
olde
rs –
Pil
ot
Proj
ect
Repo
rt
20
Table 4. Salary levels (all respondents and all types of employment)The cumulative percentage is based on the 458 respondents who indicated a salary bracket (i.e. it excludes those who preferred not to disclose their salary).
Salary Frequency (N°) Valid % Cumulative %
Under €10,000 23 4.8% 5.0%
€10,000-€15,000 23 4.8% 10.0%
€15,001-€20,000 13 2.7% 12.9%
€20,001-€25,000 20 4.1% 17.2%
€25,001-€30,000 28 5.8% 23.4%
€30,001-€40,000 92 19.0% 43.4%
€40,001-€60,000 109 22.5% 67.2%
€60,001-€85,000 117 24.2% 92.8%
€85,001-€100,000 26 5.4% 98.5%
€100,001-€200,000 6 1.2% 99.8%
Over €200,000 1 0.2% 100%
Prefer not to say 26 5.4%
Total 484 100%
Missing (skipped question) 15
Total 499
Table 5. Salary/stipend levels by occupational groupRespondents may work in more than one occupational area and have ticked the same salary scale in several areas.Missing values (skipped question) are excluded from the table.
Management Business & Financial
Computer & Mathematical
Architecture & Engineering
Life Sciences
Salary N° % N° % N° % N° % N° %
Prefer not to say 6 16% 0 0% 4 7% 0 0% 9 6%
Under €10,000 2 5% 0 0% 2 4% 0 0% 9 6%
€10,000-€15,000 3 8% 0 0% 2 4% 0 0% 9 6%
€15,001-€20,000 2 5% 0 0% 2 4% 0 0% 2 1%
€20,001-€25,000 1 3% 0 0% 0 0% 0 0% 7 4%
€25,001-€30,000 0 0% 1 20% 3 6% 1 6% 11 7%
€30,001-€40,000 5 14% 1 20% 7 13% 2 13% 40 26%
€40,001-€60,000 11 30% 2 40% 13 24% 1 6% 36 23%
€60,001-€85,000 4 11% 0 0% 15 28% 11 69% 27 17%
€85,001-€100,000 2 5% 0 0% 4 7% 1 6% 5 3%
€100,001-€200,000 1 3% 1 20% 1 2% 0 0% 1 1%
Over €200,000 0 0% 0 0% 1 2% 0 0% 0 0%
Total 37 100% 5 100% 54 100% 16 100% 156 100%
Physical Sciences Social Sciences Education, Training & Library
Healthcare
Salary N° % N° % N° % N° %
Prefer not to say 3 3% 0 0% 2 3% 3 9%
Under €10,000 0 0% 3 5% 7 10% 2 6%
€10,000-€15,000 1 1% 0 0% 6 9% 8 24%
€15,001-€20,000 1 1% 3 5% 4 6% 4 12%
€20,001-€25,000 2 2% 3 5% 4 6% 2 6%
€25,001-€30,000 4 3% 5 9% 6 9% 2 6%
€30,001-€40,000 17 15% 14 25% 14 20% 1 3%
€40,001-€60,000 14 12% 18 32% 20 29% 4 12%
€60,001-€85,000 56 48% 9 16% 6 9% 5 15%
€85,001-€100,000 17 15% 0 0% 1 1% 2 6%
€100,001-€200,000 1 1% 2 4% 0 0% 0 0%
Over €200,000 0 0% 0 0% 0 0% 0 0%
Total 116 100% 57 100% 70 100% 33 100%

Care
er T
rack
ing
of D
oct
orat
e H
olde
rs –
Pil
ot
Proj
ect
Repo
rt
21
There are apparent gender differences in sal-ary levels at first glance, however18. These are more pronounced at upper than lower levels across all respondent posts. Similar proportions of men and women (circa 20% for both) earn under €30,000 per year. Nearly 50% of female respondents earn between €30,000 and €60,000 per year compared to 38% of male respondents. Some 30% of male respondents earn between €60,000 and €85,000 compared to 21% of female respondents and at the higher level (over €85,000), while numbers are small, both men and women appear to be equally well rep-resented. At the highest level (over €100,000), there are equivalent numbers of men and women but the numbers are too small to allow meaningful analysis.
However, it should be noted that there is a higher proportion of men than women in the PSI (Swiss-based) group, most of whom are physical scientists, earning much higher salaries than average. This dis-torts male versus female salary levels in the upper bands for the entire group of respondents.
If the PSI respondents are removed from the analysis, the distribution of salaries shifts down-wards and the seeming gender difference disappears. Without the PSI respondents, the €40,000-€60,000 salary band is the most frequently cited (27.5% of non-PSI respondents) with 25% earning salaries in the band below (€30,001-€40,000) and just 12%
18. The relationship between pay and gender is complicated by the higher proportion of women in part time positions. In order to control for this factor, pay rates of men and women in full-time permanent and full-time temporary posts only were examined.
to 10% with just 3% of non-Swiss respondents earn-ing over €85,000.
Occupational factors may play a role in salary level as can be seen from Table 5. However, geo-graphic distortions mean that these data should be treated with considerable caution and viewed as purely illustrative, requiring a scaled-up study before any firm conclusions might be drawn.
Respondents employed in physical science occu-pations tend to earn higher salaries than those in other occupational areas. Some 64% of those in physical sciences earn more than €60,000 compared to just 39% of those in computer and mathemati-cal occupations, 21% of those in healthcare and life sciences, and 19% of those in social sciences and management roles. However, it should be noted that the PSI respondents are heavily represented in the physical sciences occupational group, pushing average salaries upwards.
3.6 Gender, seniority and salary levels
In terms of seniority, there are no gender differences worthy of comment in terms of respondent men or women disproportionately occupying different lev-els of the academic hierarchy. The male and female share of senior and junior lecturer, researcher, and head of department posts is of similar proportions as is the gender breakdown of senior levels on the Frascati system.
Table 6. Male and female full-time salary levelsThe cumulative percentage is based on the 243 male and 173 female respondents who indicated a salary bracket (i.e. it excludes those who preferred not to disclose their salary).
Men Women
Salary N % Cumulative %
N % Cumulative %
Under €10,000 9 4% 4% 7 4% 4%
€10,000-€15,000 12 5% 9% 7 4% 8%
€15,001-€20,000 8 3% 12% 2 1% 9%
€20,001-€25,000 9 4% 16% 6 3% 13%
€25,001-€30,000 13 5% 21% 13 7% 20%
€30,001-€40,000 43 17% 39% 44 24% 46%
€40,001-€60,000 53 21% 60% 45 25% 72%
€60,001-€85,000 76 30% 92% 37 21% 93%
€85,001-€100,000 16 6% 98% 9 5% 98%
€100,001-€200,000 3 1% 99.6% 3 2% 100%
Over €200,000 1 0.4% 100% 0 0% 100%
Prefer not to say 10 4% 7 4%
Total 253 100% 180 100%
Missing (skipped question) 9 0 9
Grand total 262 180 442

Care
er T
rack
ing
of D
oct
orat
e H
olde
rs –
Pil
ot
Proj
ect
Repo
rt
22
earning salaries above €60,000. There are no strong gender differences at any of the salary levels: 10% of men and women earn under €25,000; 31% of men and 35% of women earn €25,001-€40,000; 28% of men and 27% of women earn €40,000-€60,000; and 11% of men and 13% of women earn over €60,000. In fact, women are slightly over-represented in the highest band.
If over 40 year olds are isolated as a subgroup, there are no evident gender differences in salary lev-els. However, much larger national samples would be required to make any firm conclusions about gen-der differences beyond the narrow confines of this pilot. It is also important to point out more gener-ally that interpreting salary data across borders is fraught with difficulty because of differing taxation and purchasing power levels.
3.7 Post-doctorate choices and supports
The post-doctorate choices made by respondents were strongly informed by tradition and aca-demic considerations. The most important reason (x̄ = 1.50) for respondents accepting their first post-doctorate position was it being seen as a “necessary step toward desirable employment in (their) field”. The second most important reason (x̄ = 1.88) was attaining additional training in their doctoral area. Other reasons were not rated as being of the same level of importance but, of these, training in another field (x̄ = 2.37) and suitable location (x̄ = 2.45) were rated as being more important than working with a specific person (x̄ = 2.70) or organisation (x̄ = 2.76).
In terms of the importance of different supports to secure the first post-doctorate position, social and professional contacts were rated as most important (x̄ = 2.16) closely followed by academic advisors (x̄ = 2.17). Internet advertisements or web searches followed professional, social and academic contacts in terms of importance (x̄ = 2.48) and previous jobs also played a similarly important role (x̄ = 2.56). The least influential supports included professional recruiters (x̄ = 3.60) and university career guidance services (x̄ = 3.41).
Respondents were also asked about the influence of their sponsoring body (who for many is also the first post-doctorate employer). Sponsors (x̄ = 2.1) and first post-doctorate employers (x̄ = 1.89) were rated strongly in terms of importance. Interestingly, over 40 year olds were much more likely (67%) than their younger counterparts (39%) to rate their doc-torate sponsor as very important in helping them achieve their academic and career goals. Under 40
year olds were also less inclined to rate the impor-tance of their first post-doctorate employer (43%) as very important as over 40 year olds (58%). Perhaps the wisdom of hindsight or perspective over time trumps the more immediate perspective.
3.8 Mobility
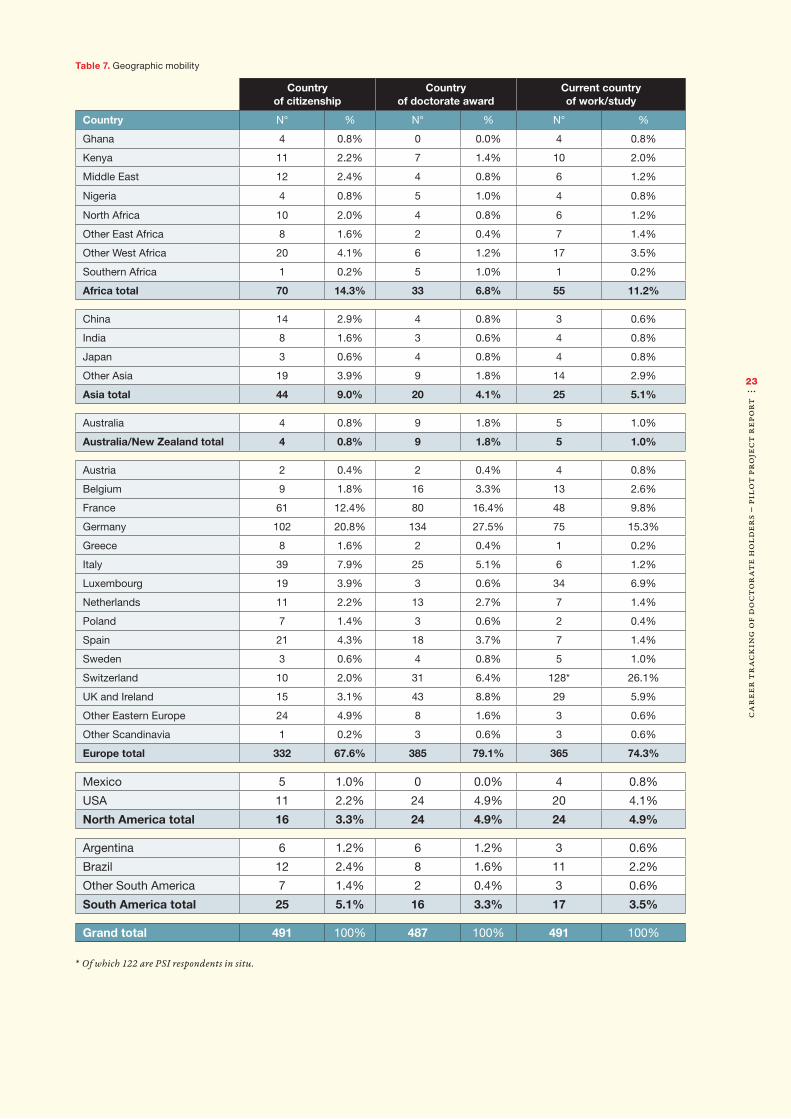
The study was designed to assess different aspects of mobility, including geographic and sectoral mobil-ity. A high proportion is clearly willing to travel for career and academic progression purposes. Table 7 tracks the movements of respondents from their countries of origin into doctorate-level education and from there into their current positions and loca-tion. It should be noted that it is difficult to make any far-reaching judgments from the country-level trends that appear because the sample is too small (499) for the number of countries to support defini-tive analysis.
A scaled-up study would be required to fully explore what appear to be very interesting trends from this pilot. For example, it is evident that on a regional basis there is more geographic mobility within Europe than within some other regions, even allowing for small numbers. The micro-analysis that was performed to produce Table 7 showed that in African and South American countries, where the TDR respondents are concentrated, the extent to which these respondents were likely to return to their country of origin was much greater than the trend in Europe and other areas. The TDR policy to discourage brain drain amongst its higher degree holders is clearly effective.
At regional level (see Table 8), it is clear that there is a stronger trend in Europe of geographic movement from Southern or peripheral countries into Northern European countries with higher numbers of elite universities.
Most of the group under study are in post-doctorate positions, mainly in the country of sponsorship. A high proportion (70%) were awarded doctorates in Northern Europe and now work there (72%). A better sense of the geographic mobility choices that people make can be gleaned from the location of those who completed their post-doctor-ate phase some years ago. A subgroup of those who completed in or prior to 2012 was isolated for the analysis presented in Table 9.
As can be seen, 65% of later career stage respond-ents work in Northern Europe by reference to 73% who were awarded doctorates in Northern European universities. While the numbers are very small, by contrast, some 2% of peripheral European respond-
Care
er T
rack
ing
of D
oct
orat
e H
olde
rs –
Pil
ot
Proj
ect
Repo
rt
23
Table 7. Geographic mobility
Country of citizenship
Country of doctorate award
Current country of work/study
Country N° % N° % N° %
Ghana 4 0.8% 0 0.0% 4 0.8%
Kenya 11 2.2% 7 1.4% 10 2.0%
Middle East 12 2.4% 4 0.8% 6 1.2%
Nigeria 4 0.8% 5 1.0% 4 0.8%
North Africa 10 2.0% 4 0.8% 6 1.2%
Other East Africa 8 1.6% 2 0.4% 7 1.4%
Other West Africa 20 4.1% 6 1.2% 17 3.5%
Southern Africa 1 0.2% 5 1.0% 1 0.2%
Africa total 70 14.3% 33 6.8% 55 11.2%
China 14 2.9% 4 0.8% 3 0.6%
India 8 1.6% 3 0.6% 4 0.8%
Japan 3 0.6% 4 0.8% 4 0.8%
Other Asia 19 3.9% 9 1.8% 14 2.9%
Asia total 44 9.0% 20 4.1% 25 5.1%
Australia 4 0.8% 9 1.8% 5 1.0%
Australia/New Zealand total 4 0.8% 9 1.8% 5 1.0%
Austria 2 0.4% 2 0.4% 4 0.8%
Belgium 9 1.8% 16 3.3% 13 2.6%
France 61 12.4% 80 16.4% 48 9.8%
Germany 102 20.8% 134 27.5% 75 15.3%
Greece 8 1.6% 2 0.4% 1 0.2%
Italy 39 7.9% 25 5.1% 6 1.2%
Luxembourg 19 3.9% 3 0.6% 34 6.9%
Netherlands 11 2.2% 13 2.7% 7 1.4%
Poland 7 1.4% 3 0.6% 2 0.4%
Spain 21 4.3% 18 3.7% 7 1.4%
Sweden 3 0.6% 4 0.8% 5 1.0%
Switzerland 10 2.0% 31 6.4% 128* 26.1%
UK and Ireland 15 3.1% 43 8.8% 29 5.9%
Other Eastern Europe 24 4.9% 8 1.6% 3 0.6%
Other Scandinavia 1 0.2% 3 0.6% 3 0.6%
Europe total 332 67.6% 385 79.1% 365 74.3%
Mexico 5 1.0% 0 0.0% 4 0.8%
USA 11 2.2% 24 4.9% 20 4.1%
North America total 16 3.3% 24 4.9% 24 4.9%
Argentina 6 1.2% 6 1.2% 3 0.6%
Brazil 12 2.4% 8 1.6% 11 2.2%
Other South America 7 1.4% 2 0.4% 3 0.6%
South America total 25 5.1% 16 3.3% 17 3.5%
Grand total 491 100% 487 100% 491 100%
* Of which 122 are PSI respondents in situ.

Care
er T
rack
ing
of D
oct
orat
e H
olde
rs –
Pil
ot
Proj
ect
Repo
rt
24
ents work in those same countries by reference to the 8% that completed doctorates in peripheral European countries. It can be inferred that even over a considerable time period, the majority of those who move from the periphery to the centre/Northern Europe for academic and early career development purposes stay in the region in which they did their doctorate and started their post-doc-torate career.
As noted elsewhere, the geographic trend for international (mainly TDR) respondents is different to that seen in Europe, reflecting an explicit policy to ensure the return of valuable trained Medical Doctors and researchers to their country of origin.
3.9 Extent to which doctorate holders work or study in other countries/regions
The survey asked respondents to indicate how many different countries they had worked or studied in for a continuous period of more than three months. This is a highly mobile group of people. Few (just 10%) had not worked or studied in another coun-try and some 50% had worked in only one country besides their home country. Another 40% had worked in multiple countries. Not surprisingly, the highest amount of mobility was within Europe, with nearly half of the respondents having worked in more than two European countries other than their home country. North America was the next most referenced area for work or study assignments with over a third having worked or studied in the US or Canada for a minimum of three months. Apart
Table 8. Respondents’ region of origin (citizenship), region of doctorate and current region of work
Region of origin Region of doctorate Current region of work
Region N° % N° % N° %
Northern Europe 234 49% 330 70% 349 72%
Eastern Europe 31 7% 11 2% 5 1%
Southern Europe 69 14% 45 10% 14 3%
West Africa 28 6% 11 2% 26 5%
East Africa 11 2% 7 1% 10 2%
Asia 56 12% 24 5% 31 6%
North America 11 2% 24 5% 20 4%
South America 32 7% 12 3% 26 5%
Australia 4 1% 9 2% 5 1%
Total 476 100% 473 100% 486 100%
Missing (skipped question) 23 26 13
Grand total 499 499 499
Table 9. Respondents who completed post-doctoral positions in or prior to 2012
Region of origin Region of doctorate Current region of work
Region N° % N° % N° %
Northern Europe 93 46% 144 73% 133 65%
Eastern Europe 12 6% 4 2% 2 1%
Southern Europe 19 9% 11 6% 2 1%
West Africa 21 10% 7 4% 18 9%
East Africa 6 3% 4 2% 6 3%
Asia 23 11% 7 4% 17 8%
North America 3 1% 9 5% 6 3%
South America 25 12% 9 5% 20 10%
Australia 0 0% 3 2% 2 1%
Total 202 100% 198 100% 206 100%
Missing (skipped question) 14 18 10
Grand total 216 216 216
Care
er T
rack
ing
of D
oct
orat
e H
olde
rs –
Pil
ot
Proj
ect
Repo
rt
25
from some 7% taking work or study periods in Aus-tralia, none of the other regions attracted significant movement. Thus, if this group is representative of doctorate-level researchers, the high level of research mobility is highly confined to particular areas of the world.
The pattern of virtual mobility (research collabo-ration via ICT) mirrors that of physical mobility in the sense that it is also largely confined to Europe and North America. The level of virtual mobility is much lower than that of physical mobility, with some 39% of respondents not having conducted research on a virtual basis and nearly 30% in just one country. The only age dimension to this appears to be about experience/passage of time: those who are over 40 years of age are more likely than those under 40 years of age to have carried out virtual research with colleagues in other countries and to have worked ‘physically’ in more countries than their younger counterparts.
Despite being very mobile across borders in terms of research activity, this group does not change employer particularly frequently. The average number of changes in employer over a seven-year period is two. Interestingly, under 40 year olds were much more likely (x̄ = 2.5) than over 40 year olds (x̄ = 1.26) to have changed employers more than once – probably a reflection of the lower level of permanent positions available to younger researchers.
The study also examined interdisciplinary and sectoral mobility. There is a considerable amount of interdisciplinarity, with almost 60% of the group involved in different and sometimes multiple forms of interdisciplinary research, including joint publi-cations (56%) and collaborating at a distance (44%) or electronically (31%).
Inter-sectoral activity in terms of contact with industry or commercial players is quite limited, however. Some 15% of the group are involved in joint publications with industry partners, 20% are collaborating at a distance and 12% are working with industry via the web.
3.10 Impacts
Respondents were active in terms of making pres-entations at national level conferences (61% of respondents) and international conferences (69%). Women were more active than men in making national presentations (65% of women compared to 58% of men) and international presentations (72% of female respondents compared to 68% of male respondents). Older respondents (over 40 year olds) were more active on the international (67%) than the national conference circuit (64%) and under 40 year olds were more active internationally (71%) than nationally (60%).
Some 12.5% of respondents won an academic prize in the last year. Women researchers were more likely than men to have won prizes (14% of women researchers compared to 11% of male researchers) as were older respondents (14% of over 40 year olds won prizes compared to 10% of under 40 year olds). Books were published by 6% of respondents in the last year and almost a quarter of them contributed book chapters.
Over 60% of respondents were either lead (63%) or other (66%) named authors on peer-reviewed publica-tions in the last twelve months. Similar proportions of under and over 40 year olds were lead authors (64%) and a higher proportion of younger (67%) than older respondents (60%) were ‘other’ authors in the last year. Men were more prolific than women in terms of publication activity. A higher proportion of men than women were lead authors (66% compared to 61%, respectively) and a higher proportion of men than women were ‘other’ authors also (68% compared to 63%, respectively).
In terms of product- and process-type impacts, activity was considerably lower which is not surpris-ing as these kinds of impacts are more associated with applied or oriented research and may take sev-eral years or even decades to emerge. New research resources or software were produced by a healthy 24% of respondents, patent activity was considerably lower, having been filed by 5% of respondents and just one respondent (0.2%) registered a product licence in the last year.
Some 11% of respondents said their research had a ‘significant impact’ on influencing policy and prac-tice changes, and public engagement activities were undertaken by 16% of them. Media coverage was achieved by 21% of respondents with men slightly more likely than women to have received it (22% com-pared to 20%, respectively). Older respondents were somewhat more likely to have attained media cover-age than their younger counterparts (24% of over 40 year olds compared to 20% of under 40 year olds).
Table 10. Number of countries (apart from home country) where research conducted over a minimum 3-month period
Physical research Virtual research
N° of countries
N° % N° %
0 48 10% 193 39%
1 251 50% 143 29%
2-3 163 33% 96 19%
4+ 37 7% 67 13%
Total 499 100% 499 100%
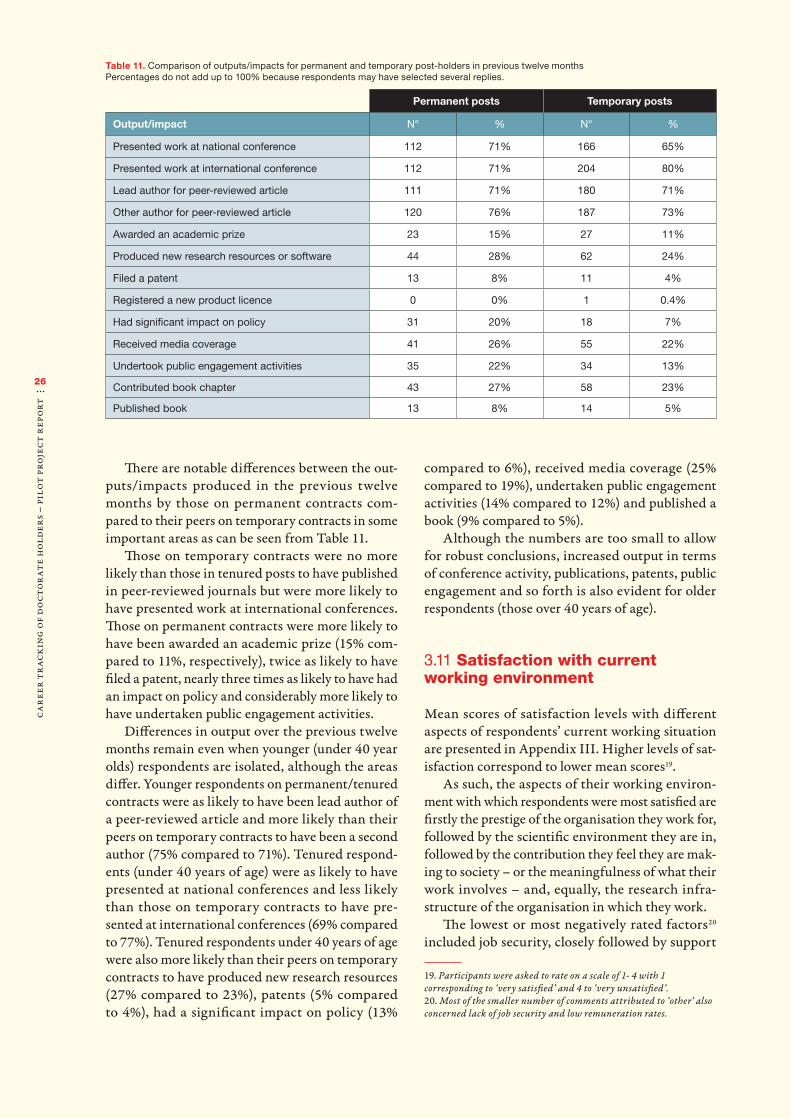
Care
er T
rack
ing
of D
oct
orat
e H
olde
rs –
Pil
ot
Proj
ect
Repo
rt
26
There are notable differences between the out-puts/impacts produced in the previous twelve months by those on permanent contracts com-pared to their peers on temporary contracts in some important areas as can be seen from Table 11.
Those on temporary contracts were no more likely than those in tenured posts to have published in peer-reviewed journals but were more likely to have presented work at international conferences. Those on permanent contracts were more likely to have been awarded an academic prize (15% com-pared to 11%, respectively), twice as likely to have filed a patent, nearly three times as likely to have had an impact on policy and considerably more likely to have undertaken public engagement activities.
Differences in output over the previous twelve months remain even when younger (under 40 year olds) respondents are isolated, although the areas differ. Younger respondents on permanent/tenured contracts were as likely to have been lead author of a peer-reviewed article and more likely than their peers on temporary contracts to have been a second author (75% compared to 71%). Tenured respond-ents (under 40 years of age) were as likely to have presented at national conferences and less likely than those on temporary contracts to have pre-sented at international conferences (69% compared to 77%). Tenured respondents under 40 years of age were also more likely than their peers on temporary contracts to have produced new research resources (27% compared to 23%), patents (5% compared to 4%), had a significant impact on policy (13%
compared to 6%), received media coverage (25% compared to 19%), undertaken public engagement activities (14% compared to 12%) and published a book (9% compared to 5%).
Although the numbers are too small to allow for robust conclusions, increased output in terms of conference activity, publications, patents, public engagement and so forth is also evident for older respondents (those over 40 years of age).
3.11 Satisfaction with current working environment
Mean scores of satisfaction levels with different aspects of respondents’ current working situation are presented in Appendix III. Higher levels of sat-isfaction correspond to lower mean scores19.
As such, the aspects of their working environ-ment with which respondents were most satisfied are firstly the prestige of the organisation they work for, followed by the scientific environment they are in, followed by the contribution they feel they are mak-ing to society – or the meaningfulness of what their work involves – and, equally, the research infra-structure of the organisation in which they work.
The lowest or most negatively rated factors20 included job security, closely followed by support
19. Participants were asked to rate on a scale of 1- 4 with 1 corresponding to ‘very satisfied’ and 4 to ‘very unsatisfied’.20. Most of the smaller number of comments attributed to ‘other’ also concerned lack of job security and low remuneration rates.
Table 11. Comparison of outputs/impacts for permanent and temporary post-holders in previous twelve monthsPercentages do not add up to 100% because respondents may have selected several replies.
Permanent posts Temporary posts
Output/impact N° % N° %
Presented work at national conference 112 71% 166 65%
Presented work at international conference 112 71% 204 80%
Lead author for peer-reviewed article 111 71% 180 71%
Other author for peer-reviewed article 120 76% 187 73%
Awarded an academic prize 23 15% 27 11%
Produced new research resources or software 44 28% 62 24%
Filed a patent 13 8% 11 4%
Registered a new product licence 0 0% 1 0.4%
Had significant impact on policy 31 20% 18 7%
Received media coverage 41 26% 55 22%
Undertook public engagement activities 35 22% 34 13%
Contributed book chapter 43 27% 58 23%
Published book 13 8% 14 5%

Care
er T
rack
ing
of D
oct
orat
e H
olde
rs –
Pil
ot
Proj
ect
Repo
rt
27
for career development and organisational cul-ture. Slightly negative assessments were also made of their work organisations’ research grant man-agement capacities, and mentoring and training support; both of these factors are important com-ponents in terms of furthering career development potential.
A negative rating for job security was obviously strongly associated with employment status – 62% of those in temporary contracts said they were fairly or very dissatisfied with this aspect of their current employment situation compared to 19% of those on permanent contracts, where issues of job security presumably affect their staff rather than themselves, unless of course the respondents work for organi-sations that are insecure in terms of funding or ongoing viability.
3.12 Assessment of questionnaire
Given the pilot nature of the exercise, an assessment of the quality of the instrument and its future uti-lisation was attempted. Overall, respondents rated the process well21. The highest levels of satisfaction were with the clarity of questions (x̄ = 1.63) fol-lowed by design (x̄ = 1.77) and relevance (x̄ = 1.85). Participants were also invited to make open-ended comments at the end of the questionnaire. A num-ber of respondents indicated that the questions were more relevant to those who had followed a pure research career than others. Encouragingly, participants indicated a strong willingness to com-plete this questionnaire in three years’ time if asked (85% answered yes).
21. On a scale of 1-4 where 1 is ‘very good’ and 4 is ‘very poor’.

Care
er T
rack
ing
of D
oct
orat
e H
olde
rs –
Pil
ot
Proj
ect
Repo
rt
28 The main findings of interest and their implications where relevant are discussed below. Relevant themes and quotes from the focus groups are threaded through the discussion to illuminate or provide context for the statistical findings.
4.1 Methodological approach
The high response rate achieved is very encouraging in terms of scaling-up or repeating this type of pilot exercise in the future. Those POs who followed the survey protocol (rigorous email cleansing, initial con-tact/rationale for the survey explained by PO prior to launch by ESF) had response rates of 60%-86%. To put this in context, a review of response rates by Nulty (2008) put the average response rate for online surveys at 30%.22 The survey was clearly relevant to those in the sampling frame as it is well established that response rates increase as respondents’ affinity to subject matter increases. No amount of message crafting can make a person fill in a survey form if it is not meaningful to them.
Nevertheless, the high response rate would not have been achieved without repeated personalised follow-ups at regular intervals. The effort involved paid off in the sense that the pilot demonstrated that it is possible to achieve response rates far higher than those routinely reported in the literature. In doing so, data were produced that are highly representa-tive of the populations under study and, ultimately, the piloted approach can provide data of considerable value for policy-making and benchmarking purposes.
22. Nulty, D.D. The adequacy of response rates to online and paper surveys: what can be done? Assessment & Evaluation in Higher Education Vol. 33, No. 3, June 2008, 301–314 [accessed online 2015] <https://www.uaf.edu/files/uafgov/fsadmin-nulty5-19-10.pdf>
It is worth noting that the questionnaire/tool that was devised as part of this study is suitable for surveying heterogeneous groups of doctorate holders, including recent post-doctorates through to those who work at senior levels in academia, medicine and industry. However, analysts need to be alert to intra-organisational features or variances in salary, gender and geographic location that can cause distortions in overall trends, particularly if sample numbers are relatively small. Having said that, this approach, and the tool devised, is a highly appropriate and cost-effective way to investigate career mobility patterns on a cross-sectional or lon-gitudinal manner. It provides a means of producing organisationally specific data on doctorate holders and their mobility patterns. Moreover, when con-ducted with a number of doctorate/post-doctorate research performing or funding organisations, the added benefits include a collective approach to opti-mising response rates and hence representativeness and value. Another significant benefit is the ability to create a central statistical database of doctorate holders, which can be used to benchmark and act as a comparison/reference pool for analysis at research organisation level.
There are a number of methodological learning points which emerged from the study and these will be incorporated into the guide which accompanies this study. Examples include the use of separate col-lectors for each organisation rather than trying to identify host organisations through questions on the survey template. The availability of or capac-ity to provide verified contact details for alumni is important as is communication of clear and con-cise arrangements for data protection and survey manage ment purposes.
4.Discussion and Conclusionsl l l
Care
er T
rack
ing
of D
oct
orat
e H
olde
rs –
Pil
ot
Proj
ect
Repo
rt
29
4.2 Career trajectories and gender
There was strong consensus across the focus groups that the support provided by sponsoring institutions (AXA RF, TDR, GRADE, FNR and PSI) was very valuable, enabling knowledge and skills develop-ment through contact with established researchers, with peers and through the alumni network. The support provided to participants seems to have inspired the desire for a reciprocal sharing of skills and support to those coming into the post-doctorate system. Positive experiences incentivised beneficiar-ies to pass on knowledge and work-based experience to those under their supervision.
That less than 10% took a career break is not surprising in a recessionary environment. Almost half of those who did so found it difficult or very difficult to return to a similar post. Taking a career break is clearly risky to a research career that typi-cally involves a long apprenticeship-type period. This risk was greater for men who found it more difficult than women to return into an equivalent position, reflecting a greater acceptance on the part of employers for women to take career breaks from the workforce. Significantly more men than women respondents had children. If it is more risky for men to take parental leave, it is difficult to see how gender-typing, the behaviours it shapes and the negative effects for women’s progression and men’s family life can be challenged.
Most of those who engaged in the pilot survey followed a very similar and traditional career path from doctoral completion into post-doctorate posi-tions and from there (or those) into occupationally relevant full-time research positions in mainly pub-lic sector or not-for-profit research institutions.
The overall employment rate of this cohort is high, with only 1% unemployed. Doctorate holders are highly employable; however, there are signifi-cant issues with the nature of the higher education employment market, as is discussed below and was raised by the Researcher’s Report 201423 and by the OECD Careers of Doctorate Holders (CDH) report:
“These high employment rates, however, may mask relatively precarious working conditions. CDH data confirms that… temporary contracts are far more prevalent among those who received their degree less than five years ago.” (p.8)24
23. Deloitte (2014) Researcher’s Report 2014. EU Commission DG Research and Innovation. http://ec.europa.eu/euraxess/index.cfm/services/researchPolicies [accessed online 2015]24. OECD (2013) Key Findings of the OECD KnowInno Project on the Careers of Doctorate Holders. www.oecd.org/sti/cdh [accessed online 2015).
Very few (circa 5%) of the respondents work in the private sector. Respondents’ gendered concentra-tion in different science domains also appears to reflect traditional choices with men disproportion-ately represented in exact sciences and women more concentrated in the social sciences.
On a positive note, there do not appear to be any gender differences in the proportions of men and women occupying senior posts, which is an encouraging finding. In addition, women are only marginally (2%) more likely than men to be in less secure (externally funded) posts. Male and female salary levels are equivalent, although a larger study would be required to make firm conclusions on this matter. The salary banding used was quite wide and may have concealed differences.
4.3 Doctorate completion times and tenure
The shorter completion time by younger doctor-ate holders in this study is consistent with the considerable decrease in the median PhD comple-tion time taken reported by the (US) Council of Graduate Schools over the past two decades25. The shorter time taken in the US to achieve doctorates in engineering and physical sciences compared to humanities and social sciences is also consistent with the findings of this pilot study.
There are various reasons (that differ across institutions and countries) for the reduction in com-pletion time including shorter funding periods and, more controversially, the possible commodification/reduction in quality of the PhD as more and more countries dramatically expand their doctoral educa-tion programmes26.
Between 1998 and 2006, the number of PhDs awarded in the OECD countries increased by some 40% prompting discussion of PhD bubbles, dimi-nution in quality and concerns that an expensively educated group would not find suitable careers and displace others in posts that traditionally did not require a PhD. As an editorial put it in Nature27:
“The problem is widely discussed, yet many PhD programmes remain firmly in the traditional
25. Bell, N.E. Council of Graduate Schools (CGS) (2010) Data Sources: Time-To-Degree for Doctorate Recipients. https://www.cgsnet.org/ckfinder/userfiles/files/DataSources_2010_03.pdf[accessed online 2015]26. Fix the PhD. Nature 472, 259–260 (2011.) http://www.nature.com/nature/journal/v472/n7343/full/472259b.html[accessed online 2015] 27. Cyranoski, D., Gilbert, N., Ledford, H., Nayar, A., Yahia, M. Education: The PhD factory. Nature 472, 276-279 (2011). http://www.nature.com/news/2011/110420/full/472276a.html[accessed online 2015]

Care
er T
rack
ing
of D
oct
orat
e H
olde
rs –
Pil
ot
Proj
ect
Repo
rt
30
mould – offering an apprenticeship for academic research, even as numbers of academic positions stagnate or decline. Yes, there are many worth-while careers outside academia for science PhD holders… Widening concerns about dismal job prospects are dissuading some of the brightest can-didates from taking the PhD route.Something needs to change – but what? Ideally, the system would produce high-quality PhD hold-ers well matched to the attractive careers on offer. Yet many academics are reluctant to rock the boat as long as they are rewarded with grants (which pay for cheap PhD students) and publications (produced by their cheap PhD students). So are universities, which often receive government sub-sidies to fill their PhD spots.”
The editorial noted that the proportion of people with science PhDs who get tenured academic posi-tions in the sciences had been dropping steadily and that industry had not fully absorbed the addi-tional supply. It pointed out that in 1973, 55% of US doctorates in the biological sciences secured tenure-track positions within six years of completing their PhDs, and only 2% were in a post-doctorate or other untenured academic position. By 2006, only 15% were in tenured positions six years after graduating.
While not directly comparable for several rea-sons, not least of which is the small number in the subgroup of respondents who completed their doctorates six years ago (73) and the fact that they had all gone through a post-doctorate position which presumably boosted their chances of secur-ing tenure, their tenure rate of 9% is of illustrative comparative interest. By contrast, the tenure rate of those in the pilot who completed some time ago (those over 40 years of age) is 76%.
The trend noted in Brechelmacher (2015)28 of a growing reliance on externally funded posts in academia is borne out by this study with nearly half (49%) of the respondents working in exter-nally funded posts. This is a double-edged sword. On the one hand external funding creates more post-doctorate positions, on the other these tend to be of fixed-term duration and insecure in nature. Tenure or the increasing lack of it is a major issue causing instability at structural, professional and personal levels. For those in the pilot who opted for non-research careers, the low level of tenured opportunities was the main reason cited. Those who
28. Brechelmacher, A. Park, E. Ates, G. Campbell, D.F.J. (2015) The Rocky road to Tenure – Career paths in Academia. In Fumasoli, T. et al. (Eds.) Academic Work and Careers in Europe: Trends, Challenges, Perspectives Volume 12, 2015 Springer. http://link.springer.com/chapter/10.1007/978-3-319-10720-2_2 [accessed online 2015]
completed their doctorates relatively recently risk long-term stints in poorly paying and, increasingly, multiple post-doctorate positions (see OECD CDH study, op. cit.) with little opportunity for progres-sion or security. This is usually after an extended period in education and relatively late entry to the workforce. Knock-on consequences pointed out in the Deloitte Researcher’s Report 2014 (op. cit.) can include poor working conditions, inadequate social security cover and underfunded pension provision.
Not surprisingly, this issue came out strongly in the survey with employment insecurity being the greatest source of career dissatisfaction amongst researchers and the highest cited reason for with-drawal from research careers. It was also the subject of critical comments in the focus groups:
“Ongoing moves and staff changes caused discon-tinuities in some units and contributed to lower research outputs.”“Sometimes, available infrastructure could not be operated appropriately due to lack of knowledge or experience as the persons in charge had left.”“I want to stay in research, but at what cost – there is a point where ongoing insecurity and instability will cause me to leave what should be a fulfilling career.”
There was consensus across the focus groups that the introduction/expansion of tenure-track sys-tems would bind knowledgeable and experienced researchers to an institution. All commentators found the practice of “having to string together a number of post-doctorate phases” problematic. Instead they would like to see a system where post-docs are encouraged to progress into stable employment or out of the system. As one focus group participant put it:
“Policy-makers should try to deal with the bot-tlenecks in the European system by allowing for a greater number of different career pathways in universities. A more holistic approach to career development and recognition with less emphasis on winning big grants and publication outputs would be a step in the right direction.”
One of the most striking findings from the survey is that the evidence suggests this type of system is inefficient and damaging. Comparisons between the researchers on permanent contracts and those on temporary contracts belie the notion that the flexibility of temporary contracts are beneficial for employers. Those on permanent contracts were:•Twice as likely to produce patents•Nearly three times as likely to have had a signifi-
cant impact on policy or practice

Care
er T
rack
ing
of D
oct
orat
e H
olde
rs –
Pil
ot
Proj
ect
Repo
rt
31
•More likely to have been awarded an academic prize
•Nearly twice as likely to have undertaken public engagement activities.
Satisfaction levels in a number of key areas are also higher in statistically significant ways. Specifically, those with permanent/tenured contracts were sig-nificantly more satisfied with the following aspects of their current working environment:•The scientific environment of their workplace
(p<.05)•The organisational culture of their workplace
(p=.001)•Career development support (p=.01).
While cause and effect cannot be fully distin-guished, these findings should provide food for thought. They appear to dovetail with those of Peterson et al. (2012)29 who found that short-term contracts (amongst physicists) can amplify the effects of competition and uncertainty, making careers more vulnerable to early termination, not necessarily due to lack of individual talent and per-sistence, but because of random negative production shocks. They concluded that short-term contracts may increase the strength of the ‘rich-get-richer’ mechanism in science and hinder the upward mobil-ity of young scientists.
If, as seems to be the case, those on permanent contracts are more satisfied with important aspects of their work environment and are more produc-tive in terms of societal and economic impacts, the traditional and increasing trend towards less secure contracts needs to be examined as it is of benefit neither to science nor to society. Lack of tenure-track structures and crushing levels of competition for very few posts are bad for science and costly in the sense that investment in fourth level education is not being fully realised. Negative policy impacts include early withdrawal from science careers and others that are more difficult to quantify but take in motivation, research team/work discontinuities and good will.
4.4 Sectoral mobility
In parallel with the lack of tenure-track positions, the study suggests that there is a lack of sectoral transfer from post-doctorate positions into indus-
29. Petersen, A.M., Riccaboni, M., Stanley, H.E., Pammolli, F. Persistence and uncertainty in the academic career. Proc. Natl. Acad. Sci. USA. 109 (14), 5213–5218 (2012). http://www.pnas.org/content/109/14/5213.full [accessed online 2015]
try and very little contact with industry in terms of research collaborations, publications or even web interactions. It should be recognised that the group under study are largely academia-based post-doc-torates, engaged in basic research and their reported impacts reflect that reality, led as they are by pub-lications, conference presentations and research awards as distinct from product and process inno-vations.
The preference and orientation of a high pro-portion of PhD candidates and doctorate holders is towards a career in academia, despite the extraor-dinary challenges involved in securing a tenured position. This preference is not necessarily uncom-promising, however. There is interesting evidence from the US (see Sauermann and Roach, 201230) that the perceived attractiveness of academic careers decreases significantly over the course of the PhD programme, despite the fact that advisors strongly encourage academic careers over non-academic careers. Conversely, there were increases in the attractiveness of non-academic careers.
Sauermann and Roach interpret their find-ings to mean that students enter graduate school with overly positive views of academic careers and change their expectations on experiencing aca-demic life first-hand, together with learning about the advantages of career paths outside of academia and realising over time that they cannot compete for scarce academic jobs and thus cease to ‘want’ them.
The European context, like that of the US, is one of ever-increasing numbers of doctorate hold-ers seeking employment in a sector that is already oversupplied. Addressing the reasons for low levels of transfer/the perceived lack of attractiveness of employment in the private sector needs to be centre stage on European and national policy agendas.
There are increasing numbers of doctorate holders going into industry. Demand will need to continue to intensify if the absorption rate of higher numbers of doctorate holders emerging from the education system into suitable research-based employment is to be increased. As the Nature (2011) article points out (op. cit.), few countries, but notably Germany, have successfully tackled the over-sup-ply problem by redefining the PhD as training for high-level positions in careers outside academia. Undoubtedly, more could be done by policy-makers and industry to encourage transition pathways into industry and from industry into academia, making it more attractive to doctorate holders while also
30. Sauermann, H., Roach, M. Science PhD Career Preferences: Levels, Changes, and Advisor Encouragement. PLoS ONE. 7(5): e36307 (2012). http://journals.plos.org/plosone/article?id=10.1371/journal.pone.0036307 [accessed online 2015]

Care
er T
rack
ing
of D
oct
orat
e H
olde
rs –
Pil
ot
Proj
ect
Repo
rt
32
helping to address the same/similar barriers to more collaborative work between industry and academia occurring.
Some of these barriers are attitudinal, reflecting lack of knowledge and sometimes negativity on the part of university staff about careers outside aca-demia. Lack of knowledge or awareness translates into information gaps where prospective doctorate students are not provided with the means to make informed judgments about the likely career paths as well as the costs and benefits of doctoral level study. The quality of career guidance provided at doctorate level may need examination and was the subject of critical commentary at all of the focus groups.
Other barriers are structural and institutional and would require questioning the reliance on publications as the proxy for recognition, quality and tenure worthiness and developing incentive systems that recognise successful industry employ-ment periods and partnerships. Interventions are also needed to ensure that doctorate-level educa-tion addresses the competences needed to transition into and succeed in non-academic settings where the vast amount of research is actually taking place. The required measures may even include reassessing the primacy of the competitive funding principal investigator-led model which relies on a strong sup-ply of low-cost post-doctorates.
4.5 Geographic mobility
Geographic movement is often an expectation – if not a requirement – of the post-doctorate phase. However, it is not unproblematic given that the post-doctorate period often coincides with other life stage factors that favour more stability. All focus group members had been very mobile, at least dur-ing earlier phases of their careers. For some funding schemes (AXA RF and FNR), mobility was an eli-gibility criterion. Major mobility driving forces included new or advanced learning opportunities, the chance to work with specific researchers or the opportunity to use state-of-the-art technology. However, a number of participants were critical about mobility requirements, especially those who had dual career pressures and family commitments. Across all focus groups, the willingness of partners and family to submit to regular movement was a key factor in shaping decisions. Either participants were able to move with their partners, which ena-bled several mobility phases, or they decided to base themselves in one place when they started a family or they lived alone/delayed having a family because of mobility issues.
These findings are consistent with those of the Mobility Patterns and Career Paths of EU Researchers (MORE 2)31 study which found that professional factors were stronger driving forces than personal reasons amongst those who did make geographic moves, but that family reasons acted as a barrier or constituted reasons for those deciding not to be mobile.
In terms of physical movement patterns, a scaled-up study would allow more in-depth explo-ration of the apparent geographic trends from this pilot. It would be very interesting and worthwhile to explore whether the regional movement of respond-ents from Southern or Eastern European countries into Northern European countries is replicated with larger numbers. The implications of such movement include the further weakening of already fragile economies. A EurActiv article32 noted that the tradi-tionally modest level of migration between different EU countries is changing in the wake of the reces-sion and other social factors. The report states that while limited data exist, the most recent wave of migration is characterised by much greater numbers of young highly educated researchers and scientists moving, and not by choice, making for very worry-ing long-term consequences:
“The countries of the South need a reorientation of their productive model towards high value-added, extrovert industries, in order to secure sustain-able, long-term growth, capable to sustain their current living standards. The flight of their best and brightest will not facilitate this transition. The danger is that some of these countries will get stuck in a low growth model, characterized by low-skilled economic activity. Indeed, data about new enterprises created during the crisis in Greece, demonstrates an alarming domination of new entrepreneurship by consumption-oriented, low skilled services such as restaurants, bars and clothing retail. Overall, 90% of new companies created in 2012 were in low value-added sectors.”
The concern is well-placed. Language barriers to movement for those with doctorate-level education are minimal given the near universality of English language communication in the science community. Cuts to research funding in peripheral EU states are
31. IDEA Consult, et al. (2013) Support for continued data collection and analysis concerning mobility patterns and career paths of researchers. European Commission Research Directorate-General. Brussels. http://ec.europa.eu/euraxess/index.cfm/services/researchPolicies [accessed online 2015]32. Katsikas, D. Brain drain, a new challenge for the Eurozone. EurActiv Opinions (25 November 2013) http://www.euractiv.com/innovation-enterprise/brain-drain-new-challenge-eurozo-analysis-531938 [accessed online 2015]

Care
er T
rack
ing
of D
oct
orat
e H
olde
rs –
Pil
ot
Proj
ect
Repo
rt
33
undoubtedly also propelling this movement. The findings of the 2014 Public Funding Observatory report33 of the European University Association (EUA) are noteworthy in this regard:
“It is predominantly Southern and Eastern European countries that are suffering consistent cuts to university funding. This also correlates with the impact of the crisis; countries who suffered greater economic downturns are unsurprisingly making more significant cuts… Higher education landscapes may emerge from the crisis with deeply altered features; the resulting loss of talent is also affecting the longer-term competitiveness of these economies. This contrasting situation represents a challenge for Europe as a whole, whose global competitiveness is harmed by such imbalances and weaknesses in the European Higher Education and Research Areas.” (p.20)
Clearly, there is a need for this situation to become a policy imperative for national and European level authorities. The evidence from the pilot study is that those who move from peripheral to Northern European countries for their doctorate-level educa-tion tend to stay in those countries because of better prospects. While not wanting to extrapolate too much, it appears that those countries that invest in high-quality doctoral education and provide decent post-doctorate support stand to attract and retain these valuable people in their workforces.
Those countries that have less attractive fourth-level education systems will lose their best knowledge capital to educationally attractive regions in ever greater numbers unless measures are put in place to prevent this happening. Investing in fourth-level educational establishments and tenure-track post-doctorate opportunities in peripheral countries would help matters as would making contingencies between doctorate level funding/sponsorship abroad and post-qualification employ-ment in the originating country, as is successfully practised by the TDR. At a macro level, the impli-cations of the growing ERA/knowledge economy disparities are serious and will have far-reaching geo-political effects if nothing is done.
33. European University Association (2014). EUA Public Funding Observatory 2014. http://www.eua.be/Libraries/Governance_Autonomy _Funding/PFO_analysis_2014_ final.sflb.ashx [accessed online 2015]
Final commentsThere is a strong rationale for this study to be scaled-up in future. The technical challenge of designing an attractive and meaningful instrument has been met and responded to in high enough numbers to allow confidence that national-level exercises would be very worthwhile. Adherence to this approach would produce valid and generalisable results that could serve as benchmarks for comparative or longitudinal studies allowing the monitoring of doctorate-level absorption into different sectors and the research/scientific achievements associated with different factors, pathways and experiences. A scaled-up study would allow a more robust exploration of the implications of the current early career model for doctorate holders and ongoing study of what appear to be important geographic mobility trends that could undermine recovery of peripheral coun-tries causing long-term structural consequences. It would facilitate the development of nuanced policy responses at regional and national level to a number of risks, including that of an increasingly two-tier Europe, which is of course completely antithetical to the aims of the ERA.
Care
er T
rack
ing
of D
oct
orat
e H
olde
rs –
Pil
ot
Proj
ect
Repo
rt
34 The main recommendations arising from the report are presented below under the headings of method-ology/future career tracking studies, institutional and European policy recommendations.
5.1 Future studies
•The pilot study should be widely disseminated and efforts made to scale it up to a larger study. Consideration should be given to country-level studies employing sampling frames compatible with representativeness and rigorous analysis of gender, tenure and other trends.
•Ideally, a probability-based sampling method would be used to select institutions and samples for inclusion in future studies either at the level of university/funding/sponsoring organisations or from centralised national databases.
•In terms of practicalities, a minimum institutional end sample size of circa 100 doctorate holders is needed to allow even basic statistical analysis at organisational level. Hence, only those institutions with these kinds of numbers should be included in any sampling frame.
•National target sample size should be determined on the basis of the number of doctorate holders in the population34 and standard confidence levels (95%) and intervals35. For most if not all countries in Europe, sample sizes required are unlikely to be larger than 1,000 persons.
•Great care should be taken in conducting analy-sis of gender, salary and geographic movements
34. See for example statistics on doctorate holders in: http://www.oecd.org/sti/inno/CDH%20FINAL%20REPORT-.pdf 35. Sample size calculators are readily available online.
across national boundaries because of the poten-tial for statistical distortions, based on sampling errors, to arise. Large national samples are needed for cross-country comparative analysis of this nature.
5.2 Recommendations of relevance to doctorate holder funding/sponsoring organisations
•Universities and post-doctorate funding/spon-soring institutions should establish/maintain up-to-date contact details for their alumni to enable follow-up studies to be conducted routinely.
•Doctorate holders are highly geographically mobile for career and knowledge advancement purposes. Mobility has benefits and costs at national, institutional and individual levels. While awareness of the benefits is widespread, the pres-sure to be geographically mobile can be difficult for those who have family/caring responsibilities. Doctorate-sponsoring institutions need to recog-nise this in their funding models and ensure that mobility is not a perceived or real precondition for funding or advancement.
•The academic career expectations of doctorate can-didates need to be managed in ways that recognise that only a tiny proportion of those who undertake PhDs will progress into a career in academia. More should be done to develop greater awareness of, and knowledge about, relevant careers outside of academia in consultancy, industry, government and elsewhere.
•Those responsible for post-doctorate education and employment at national level should examine how well they prepare PhD students and post-
5.Recommendationsl l l

Care
er T
rack
ing
of D
oct
orat
e H
olde
rs –
Pil
ot
Proj
ect
Repo
rt
35
doctorates for employment outside academia and make necessary improvements/adjustments to training.
5.3 Recommendations of relevance to European policy-makers
•While this study is not definitive, it appears that geographic mobility in Europe from peripheral to Northern European economies is largely unidi-rectional. A lack of adequately funded doctorate and post-doctorate opportunities in peripheral countries/Southern Europe risks undermining development and driving further asymmetries. Policies that monitor and support more balanced regional inflows/retention of doctorate holders
need to be explored at national and European level.•Temporary/insecure employment is a cause of
considerable dissatisfaction and stress amongst the post-doctorate population. The lack of tenure-track positions for doctorate-holding researchers should be critically examined with a view to devel-oping alternative models that provide structured opportunities for tenured employment.
•The growing supply of doctorate holders and the lack of absorptive capacity in academic institu-tions need to be explicitly recognised by European policy-makers and actively addressed in terms of university career guidance, employer engagement and practical course-based preparation for research posts in finance, industry and other sectors.


Care
er T
rack
ing
of D
oct
orat
e H
olde
rs –
Pil
ot
Proj
ect
Repo
rt
37
Appendices


Care
er T
rack
ing
of D
oct
orat
e H
olde
rs –
Pil
ot
Proj
ect
Repo
rt
39
1. Participant population
On average, four persons attended the focus groups. Although participating organisations (POs) had been requested to ensure different levels of experi-ence when setting up the focus groups, the majority of participants had completed their doctorates at least three to four years before. Obviously, they were more inclined to participate than their junior col-leagues who had also been invited.
Participants were mostly alumni of a specific funding programme or an institution; some were still employed at the same institution; AXA RF fellows and PSI participants all still received fund-ing from their programme or worked at the same institution. This applied to some of the GRADE participants, too. Those who had been funded through the fellowship schemes had usually been supported for two years; longer funding periods were only possible for TDR fellows. GRADE or PSI focus group members had been usually funded through positions at the institution. Post-doctorates at PSI were sometimes urged to acquire their own funding externally.
2. Current career stage
With the exception of one focus group, participants were usually in their second post-doctorate phase. According to the European Framework for Research Careers the majority of participants could thus be considered at the interface of the R2 and R3 stages, some had already reached the R3 level. Only three participants had left academia, working in NGOs or running their own institutes, sometimes still research-related.
To date, only six persons had achieved tenured positions. From the Europe-based participants on permanent contracts, one person was no longer in academia and two persons were based at differ-ent levels of the universities. Even for those whose post-doctorates had lasted for five years or more, the employment situation was in most cases still not sta-ble. In the words of one participant: “Ongoing moves and staff changes had caused discontinuities in some units and had contributed to lower research outputs. Sometimes, available infrastructure could not be operated appropriately due to lack of knowledge or experience as the persons in charge had left.” Another point of criticism referred to career prospects.
Participants felt that increases in responsibility within the institution did not necessarily coincide with being offered better career options.
The more advanced post-doctorates had manage-rial responsibilities – with up to 30 staff members in one case – or supervision responsibilities for doctoral candidates or student assistants, or were in charge of a doctoral training programme. Those who had been able to attain a leadership position meanwhile, be it in a university or non-research context, were highly satisfied with their current occupation and planned to advance their position by employing more staff and raising additional funds.
One conclusion was that although all partici-pants worked in very different research fields, their high-level qualification had enabled them to embark in other research fields or cross-disciplinary areas. This applied specifically to those participants who had done undergraduate or post-graduate studies in the life sciences or physics. For instance, a physics degree could be adapted to apply to economics-related research topics or meteorological research. We need to acknowledge, though, that due to the structure of the programmes or POs, humanities and social sciences were under-represented.
Participants at more advanced career stages usually acted at least as day-to-day supervisors – sometimes as main supervisors – of doctoral can-didates, a task that they largely enjoyed. They saw a primary responsibility in creating a reliable and stable structure for their supervisees.
3. Satisfaction with the institution/assets reported
The main source of satisfaction with their fellow-ship programme or institution was that it enabled working with specific researchers. Opportunities for networking within the peer group and commu-nity-building together with incentives for alumni work counted almost equally highly. Participants from one of the POs reported that contacts estab-lished at the beginning of a doctorate often persisted throughout the (post-)doctoral phase and even beyond. Where schemes or institutions did not offer such opportunities for interaction and net-working this was seen as a downside. Particularly in programmes that operated at an international scale, alumni appreciated the idea of a global com-munity, but better ways to stay in touch were seen
Appendix I: Compilation of findings from focus groupsAuthored by Dr Beate Scholz

Care
er T
rack
ing
of D
oct
orat
e H
olde
rs –
Pil
ot
Proj
ect
Repo
rt
40
as essential, both with programme officers and with other alumni.
If focus group participants had been very sat-isfied with the programme or institution, they wished to pass on their positive experience to the next generation of PhDs or post-doctorates. Positive experience as supervisees incentivised beneficiar-ies to engage in doctoral education and teaching of graduate students. Many participants looked back to a multiple supervision experience during their own doctoral qualification; either a main supervi-sor or an additional advisory committee had been involved, or dual supervision, sometimes as cotu-telle with one supervisor in the home country and an additional (sometimes the main) supervisor in the host country. Difficulties with supervisors were exceptional and led in individual cases to a change of supervisors. Some participants, especially in less favoured regions, were strongly committed to engage in graduate schools. They understood their engagement in teaching as a contribution to national capacity building, and were sometimes involved in setting up new doctoral programmes from scratch. Given their own mobility experience, some took considerable efforts to help incoming students.
In the case of the programmes that provided fel-lowships, having gained a certain degree of research independence by accounting for their own salaries was seen as a major asset by a number of partici-pants. However, there could be two sides to the coin, as one participant pointed out: “If the salary did not come along with own research money this could create dependencies from the research environment, especially where systems tended to be rather hierar-chical”. Even where uncertainties about the own professional future persisted, the three fellowship schemes were seen as particular career enhancers. Participants highlighted opportunities for broad-ening their scope by means of workshops and/or professional skills programmes. In addition, the availability of professionals from the respective institutions for personal matters, problem and con-flict solving or showing an interest in their career development was welcomed. Some current or former fellows praised the commitment by their respective funders and particularly appreciated the participa-tion of the organisation in the career tracking pilot study.
4. Perceived problems of the programme/ the institutionScientific visa issues, especially for non-Europeans coming into Europe, hindered some participants in getting their projects started and were also a later obstacle to attend scientific conferences.
Where fellowships covered only a period of two years, participants mainly criticised this period as being too short to achieve a decent output or to make a difference in terms of research impact. However, this might vary between disciplines; gen-erally, participants from theoretical research fields did not agree with this statement. The publication culture in the different disciplines determined the view on this matter: where research was mainly pub-lished during short time-spans or in the framework of conference proceedings, the duration of the fel-lowship did not matter as much.
The lack of career advice was criticised through-out the focus groups. A participant of one PO would “prefer offers of direct career counselling to courses that primarily addressed how to improve one’s CV”. Some participants from another PO mentioned they had heard about career advice offered by the insti-tution’s human resources department, but were not sure what this service included.
5. Mobility concepts
a. Geographic mobilityExcept for a small number of participants who
stayed in the same region, all focus group members had been very mobile, at least during earlier phases of their careers. In some schemes previous mobility had been even an eligibility criterion. Major driv-ing forces for geographic mobility were “the wish to learn new techniques or work with specific researchers or use state-of-the-art technology”. However, some were critical of programme-related mobility require-ments, especially those who lived in dual career couple arrangements.
Interestingly, fellows from less privileged regions outside Europe gave little consideration to economic signals as motivation to go abroad. All wished to return to their home countries and to contribute to national capacity building. This was different for European participants. As stated by the fellows from one PO: “the lack of resources in their home coun-tries (in terms of research infrastructure and personal revenues) had been the major driving force for inter-
Appendix I: Compilation of findings from focus groups
Care
er T
rack
ing
of D
oct
orat
e H
olde
rs –
Pil
ot
Proj
ect
Repo
rt
41
national mobility”, i.e. for their decision to move to their current host country. The same applied for another PO; a participant reported that the economic conditions in their European country of origin had become worse during the stay abroad so that a return after having completed the fellowship did not seem to be a valid option. Other incoming researchers had decided to stay in the host country because they had been able to develop stable condi-tions for their family life, rendering further moves difficult.
All in all, partnership and family seem to be the key parameters for geographic mobility or sta-bility decisions. Either participants were able to move with their partners, which enabled several mobility phases, or they decided to stop long-term mobility when they started a family or they lived apart because of being mobile and suffered from the situation. These findings applied to all focus groups. Participants at one PO articulated diverg-ing opinions on the value of geographic mobility. A few participants had deliberately decided to move to the host country in Europe in order to do a doc-torate in view of the availability of fellowships, the opportunity to evade the doctoral entry examina-tions, e.g. in the US, the wish to work with specific researchers and/or because of the reputation of research institutions. For some, the post-doctoral phase coincided with the wish for increasing local stability. One participant highlighted the impor-tance of favourable research infrastructures in the wider region and good conditions for intersectoral mobility in the surroundings for the decision to stay in the region.
b. Virtual mobilityIn general, participants agreed that previous
long-term or even short-term stays or conference visits had been crucial for preparing the ground for future virtual mobility experiences as an “avenue to collaborative research”. Arguments referred to opportunities to select places that were important for collaboration or to become a member of inter-national or even global networks.
In some cases, where participants had left their country of origin, collaborations with domestic researchers allowed contacts to be maintained, even if returning to that country did not seem to be an option. In other cases, working relations during a post-doctorate phase abroad or with own supervised doctoral candidates had become so productive that
it made sense to maintain them after leaving. For other participants, the current position necessar-ily involved virtual collaborations as their projects had a decentralised structure, enabling them to link two previous supervisors, thereby connecting two research strands which up to that point had been unconnected.
However, some participants also identified potential difficulties of virtual mobility, including competition between team members that hindered the joint use of techniques, and that sometimes teams would not work at the highest level of efficiency due to intercultural communication problems. A positive point was that dealing with such issues might help to increase personal trouble-shooting capacities.
c. Interdisciplinary mobilityInterdisciplinary mobility was the most contro-
versial mobility issue under discussion: focus group participants were rather critical about switching dis-ciplines, although in a few cases they had received job offers from other fields because they worked at the interface between research fields. Yet they saw considerable difficulties in peer review, given that results from interdisciplinary work could often not be published in the main journals of the field or because the respective peer group would not con-sider them as equally valuable. Some participants were not convinced that interdisciplinary work would lead to better results than research in a single discipline. One participant stated that interdiscipli-nary cooperation often seemed to be imposed on researchers, while others considered the synergy with others as essential, particularly in fields with high levels of specialisation.
First degrees in a specific discipline sometimes laid the foundations to qualify for a doctorate in another discipline, especially if the respective disci-pline had not been taught in the country of origin. For others, a move into new fields of research did not imply interdisciplinary work per se, but meant apply-ing their own disciplinary approaches to a different discipline or using them in a different methodologi-cal setting within their original discipline.
d. Intersectoral mobilityIntersectoral mobility seemed most widespread
for persons working in the biomedical field, e.g. clinical trials in a company. Cooperation with national policy-makers allowed the transfer of
Appendix I: Compilation of findings from focus groups
Care
er T
rack
ing
of D
oct
orat
e H
olde
rs –
Pil
ot
Proj
ect
Repo
rt
42
results (translation from bench to bedside), involv-ing the establishment of policy guidelines and policy development, e.g. for prevention or fight-ing of epidemics. Some grants enabled fellows to bridge the gap between basic research and technol-ogy development. Throughout the focus groups a few participants had gained intersectoral mobility experience, not only by working with or in indus-try, but also through cooperation with ministries or governmental agencies.
For others, research topics were related to other sectors and, thus, necessarily incorporated science outreach activities to the fields that they explored. Other experience referred to prolonged internships or short-term contracts in management or consul-tancies that provided additional insights for future research questions or approaches. Some considered intersectoral mobility as a potential back-up plan, in case they could not realise their preferred career goal, i.e. staying in academic research.
Some participants agreed that, for the time being, intersectoral mobility, including potential career opportunities in the private sector, was not of major importance to them, even if the current host institution did not offer further career oppor-tunities.
6. Career plans (or development after grant) and next steps
Participants from outside Europe (and particularly the TDR cohort) had very different employment contracts to their European counterparts. All worked under reliable contract conditions, ranging from five-year tenure to permanent positions. Some were already in open-ended contracts before they received funding from a PO and even used leaves of absence to do a doctorate or realise a post-doc-torate stay. However, where participants worked on open-ended contracts, long-term job stability was not taken for granted, but participants were aware that continuing a career in the same institution required additional activities, e.g. raising (addi-tional) research funds.
In most other focus groups, those who were still working in the same field of their post-doctorate or at the same institution – and independently of whether their position was permanent or temporary – wished to move on. Reasons included feeling less inspired, wanting to do more applied research or
having the objective to gain more responsibility and work with others in a team. Some focus group mem-bers confirmed that in view of the perceived lack of internal career opportunities at their current insti-tution they had to move on, either by going abroad or by applying for a professorship at a university or, if unavoidable, to another post-doctorate position. Some persons were explicitly in the process of apply-ing for professorships taking into account the need to move countries, at least, within Europe.
In general, those participants who still worked as post-doctorates in public research institutions, mainly in a second post-doctorate phase, were not entirely sure if they wished to continue, especially in view of the high level of insecurity associated with temporary contracts. Despite this, participants still wished to pursue a research career in academia. Moving to a company was seen as the second best option, considering that the revenues were not nec-essarily higher than in the public research domain. A couple of participants felt either uninformed about career opportunities in the private R&D sec-tor or discouraged by the risks related to starting an own institute or company.
Although a research career in a public research institution was described as preferable, participants described a number of pre-conditions that would have to be guaranteed. Some individuals would consider alternative career tracks if the need to be mobile interfered with their personal lives and particularly their relationships. Others indicated a preparedness to accept a part-time position, poten-tially outside academia, if funds to carry on with the projected research topic should not be available. In this case, doing research during their spare time could become an option.
A small number was confident that continuing their research career would work out, either because their achievements to date were promising enough or because they had already been offered positions during previous stages of their career without hav-ing had to apply for jobs.
Altogether, the second post-doctorate phase was the crucial decision-making stage for continu-ing to pursue a research career or opting out. The envisaged strategies for preparing the next career step in research, namely building an independent research team, differed considerably. Whereas some individuals were prepared to undertake a third post-doctorate phase in a different country, e.g. with the aim to get a foot in the door of a favoured institu-
Appendix I: Compilation of findings from focus groups

Care
er T
rack
ing
of D
oct
orat
e H
olde
rs –
Pil
ot
Proj
ect
Repo
rt
43
tion, others planned to build a team and achieve a tenure-track position right away. Some tried to accelerate this procedure by applying for prestigious five-year fellowships or grants.
There was large agreement across the focus groups in Europe that a tenure-track system should be put in place in order to bind knowledgeable and experienced researchers to an institution. All found it problematic that countries (particularly in Western Europe) encouraged the stringing together of a number of post-doctorate phases, instead of encouraging movement up or out of the system. In view of the bottlenecks in the academic pyramid, participants called on policy-makers to allow for a greater number of different career tracks in uni-versities. Less emphasis should be given to winning big grants and to publication output. Instead, addi-tional qualifications should be better appreciated.
Appendix I: Compilation of findings from focus groups

Care
er T
rack
ing
of D
oct
orat
e H
olde
rs –
Pil
ot
Proj
ect
Repo
rt
44
ESF carried out a survey of doctorate holders from the five POs in autumn 2014. There were 499 respondents. The response counts per question are provided below. Open-ended comments are not included for reasons of confidentiality. For cer-
tain questions, multiple answers were possible (the response percent or count may therefore not be equal to the number of respondents for that question). The report provides information on the survey method-ology and gives a fuller analysis of survey data.
Appendix II: Online questionnaire results
Researcher Career Tracking Pilot Survey
1. Which of the following organisations sponsored, funded or hosted you during your post-doctorate stage of career development (if you do not have a doctorate, please substitute the equivalent period)?
Answer Options Response Percent Response Count
AXA Research Fund, France 22,1% 110
Fonds National de la Recherche (FNR), Luxembourg 17,1% 85
Goethe Graduate Academy (GRADE), Goethe University Frankfurt/Main, Germany
20,7% 103
Paul Scherrer Institut (PSI), Switzerland 24,5% 122
Special Programme for Research and Training in Tropical Diseases (TDR) 15,5% 77
Other, please specify: 0,2% 1
answered question 498
skipped question 1
2. For how many years did your sponsoring/funding organisation fund, host or support your post-doctorate position?
Answer Options Response Percent Response Count
Less than one year 6,7% 32
1 year 11,9% 57
2 years 51,7% 247
3 years 14,9% 71
More than 3 years 14,9% 71
answered question 478
skipped question 21
3. In what year did (or will) your host/funding organisation cease funding/hosting/supporting your post doctorate position?
Answer Options Response Percent Response Count
Pre 2007 6,2% 29
2007 1,5% 7
2008 3,8% 18
2009 5,5% 26
2010 6,8% 32
2011 10,0% 47
2012 12,1% 57
2013 10,4% 49
2014 11,3% 53
post-2014 32,5% 153
answered question 471
skipped question 28
Note: There are minor discrepancies with Table 1 due to analysis and survey closure dates.

Care
er T
rack
ing
of D
oct
orat
e H
olde
rs –
Pil
ot
Proj
ect
Repo
rt
45
Appendix II: Online questionnaire results
4. In which region do you currently work or study?
Answer Options Response Percent Response Count
Africa 9,6% 48
Asia 6,6% 33
Europe 73,7% 367
Australia/ New Zealand
1,2% 6
Other Oceania 0,0% 0
North America 4,2% 21
Central America 1,2% 6
South America 3,4% 17
answered question 498
skipped question 1
5. In which country do you currently work or study?
Answer Optionscoded subsequent to analysis
Response Count
498
answered question 498
skipped question 1
6. What country are you a citizen/passport holder of?
Answer Optionscoded subsequent to analysis
Response Count
495
answered question 495
skipped question 4
7. Please tick your age category:
Answer Options Response Percent Response Count
Under 25 0,0% 0
26-30 12,4% 62
31-35 46,8% 233
36-40 23,5% 117
41-45 9,8% 49
46-50 3,0% 15
51-55 2,2% 11
56-60 1,2% 6
61-65 1,0% 5
Over 65 0,0% 0
answered question 498
skipped question 1

Care
er T
rack
ing
of D
oct
orat
e H
olde
rs –
Pil
ot
Proj
ect
Repo
rt
46
Appendix II: Online questionnaire results
9. Do you have/care for children?
Answer Options Response Percent Response Count
Yes 41,1% 202
No 58,9% 290
answered question 492
skipped question 7
10. Do you have other caring responsibilities (e.g. elder care, adult with disability)?
Answer Options Response Percent Response Count
Yes 11,7% 57
No 88,3% 430
answered question 487
skipped question 12
11. Did you take a career break for a year or more?
Answer Options Response Percent Response Count
Yes 10,7% 53
No (please go to Q13) 89,3% 441
answered question 494
skipped question 5
12. If yes, how easy or difficult was it to return to your previous position or find another suitable one?
Answer Options Response Percent Response Count
Very easy 16,9% 10
Fairly easy 35,6% 21
Fairly difficult 28,8% 17
Very difficult 18,6% 11
Please comment on factors that eased or made return difficult: 26
answered question 59
skipped question 440
13. What is the highest academic qualification you have been awarded?
Answer Options Response Percent Response Count
Primary degree 0,0% 0
Masters degree 2,6% 13
Doctorate degree 93,6% 466
Doctor of Medicine (M.D.) 2,0% 10
Other professional or postgraduate qualification (please specify) 1,8% 9
answered question 498
skipped question 1
8. Are you a man or woman?
Answer Options Response Percent Response Count
Man 57,2% 285
Woman 42,8% 213
answered question 498
skipped question 1

Care
er T
rack
ing
of D
oct
orat
e H
olde
rs –
Pil
ot
Proj
ect
Repo
rt
47
Appendix II: Online questionnaire results
15. In which year did you FINISH your doctorate or equivalent? If you are STILL STUDYING please put in the year you anticipate completion.
Answer Optionscoded subsequent to analysis
Response Count
Please enter in numerical format YYYY 498
answered question 498
skipped question 1
14. In which year did you START your doctoral studies or equivalent (highest level study)?
Answer Optionscoded subsequent to analysis
Response Count
Please enter in numerical format YYYY 498
answered question 498
skipped question 1
16. Please indicate the Domain of Science (Frascati Manual Classification) that best corresponds with your doctorate or equivalent:
Answer Options Response Percent Response Count
Natural Sciences 32,5% 162
Physical Sciences and Engineering 23,5% 117
Medical and Health Sciences 17,7% 88
Agricultural Sciences 0,6% 3
Social Sciences 13,7% 68
Humanities 5,6% 28
Other, please specify: 6,4% 32
answered question 498
skipped question 1
18. What was the geographic region of the institution that awarded your doctorate (or equivalent)?
Answer Options Response Percent Response Count
Africa 6,6% 33
Asia 4,4% 22
Europe 78,5% 390
Australia/New Zealand 1,8% 9
Other Oceania 0,2% 1
North America 5,0% 25
South America (including Central America) 3,4% 17
answered question 497
skipped question 2
17. Please indicate if your doctorate (or equivalent) was structured (achieved through defined course of study/training and independent research) or classical (achieved entirely through independent research in an apprenticeship type relationship with your supervisor):
Answer Options Response Percent Response Count
Structured 30,3% 150
Classical 69,7% 345
answered question 495
skipped question 4

Care
er T
rack
ing
of D
oct
orat
e H
olde
rs –
Pil
ot
Proj
ect
Repo
rt
48
Appendix II: Online questionnaire results
19. In what country was your doctorate (or equivalent highest level qualification) awarded?
Answer Optionscoded subsequent to analysis
Response Count
491
answered question 491
skipped question 8
22. Please indicate the economic status of the organisation(s) you currently work for:
Answer Options Response Percent Response Count
Public sector non-profit 78,2% 383
Public sector for profit 4,1% 20
Private sector for profit 5,5% 27
Private sector non profit 6,5% 32
Public Private partnership 1,4% 7
Other (please specify) 4,3% 21
answered question 490
skipped question 9
21. Which of the following financial arrangements best describes your current work/research situation:
Answer Options Response Percent Response Count
Employed/engaged by university/research institution and grant funded by other external grant/organisation
57,8% 286
Directly employed and funded by organisation you are working in 36,8% 182
Other (please specify) 5,5% 27
answered question 495
skipped question 4
20. Please tick your main employment status currently – please note that the term ‘employed’ includes funded post doc positions.
Answer Options Response Percent Response Count
Intern 0,2% 1
Permanent Part-time Employed (less than 30 hours per week) 1,2% 6
Permanent Full-time Employed (more than 30 hours per week) 35,1% 175
Temporary Part-time Employed (less than 30 hours per week) 3,2% 16
Temporary Full-time Employed (more than 30 hours per week 53,8% 268
Self Employed 1,2% 6
Full time study 1,4% 7
Career break/sabbatical 0,2% 1
Retired 0,0% 0
Unemployed 1,4% 7
Other (please specify) 2,2% 11
answered question 498
skipped question 1

Care
er T
rack
ing
of D
oct
orat
e H
olde
rs –
Pil
ot
Proj
ect
Repo
rt
49
Appendix II: Online questionnaire results
23. Which of the following best describes your current occupation? Please choose nearest category from SOC (Standard Occupational Classification) groups below or tick more than one box if you have more than one occupation:
Answer Options Response Percent Response Count
Management Occupations 7,6% 38
Business and Financial Operations Occupations 1,0% 5
Computer and Mathematical Occupations 10,8% 54
Architecture and Engineering Occupations 3,4% 17
Life Science Occupations 32,3% 161
Physical Science Occupations 23,7% 118
Social Science Occupations 12,0% 60
Community and Social Service Occupations 0,2% 1
Legal Occupations 1,8% 9
Education, Training, and Library Occupations 14,3% 71
Arts, Design, Entertainment, Sports, and Media Occupations 1,4% 7
Healthcare Practitioners and Technical Occupations 4,0% 20
Healthcare Support Occupations 2,8% 14
Protective Service Occupations 0,0% 0
Food Preparation and Serving Related Occupations 0,2% 1
Building and Grounds Cleaning and Maintenance Occupations 0,0% 0
Personal Care and Service Occupations 0,0% 0
Sales and Related Occupations 0,2% 1
Office and Administrative Support Occupations 3,4% 17
Farming, Fishing, and Forestry Occupations 0,0% 0
Construction and Extraction Occupations 0,0% 0
Installation, Maintenance, and Repair Occupations 0,8% 4
Production Occupations 0,2% 1
Transportation and Material Moving Occupations 0,0% 0
Military Specific Occupations 0,2% 1
Other (please specify) 10,6% 53
answered question 498
skipped question 1
24. Do you currently work as an academic/researcher (as per the Frascati Manual definition of researcher: ‘engaged in creative work undertaken on a systematic basis in order to increase the stock of knowledge, including knowledge of man, culture and society, and the use of this stock of knowledge to devise new applications’)?
Answer Options Response Percent Response Count
Yes 87,8% 437
No (please go to Q27) 12,2% 61
answered question 498
skipped question 1

Care
er T
rack
ing
of D
oct
orat
e H
olde
rs –
Pil
ot
Proj
ect
Repo
rt
50
Appendix II: Online questionnaire results
25. If yes, please indicate the level:
Answer Options Response Percent Response Count
Post Doctorate position/junior researcher 50,7% 224
Research Fellow 13,8% 61
Junior/Associate Lecturer 5,2% 23
Senior Researcher 9,0% 40
Senior Lecturer 2,5% 11
Associate Professor/Reader 5,4% 24
Professor/Head of Department 5,0% 22
Other/not applicable 1,6% 7
Please describe 6,8% 30
answered question 442
skipped question 57
26. If you work mainly as a researcher, at which level (as per European Framework for Research Careers)?
Answer Options Response Percent Response Count
R1 First Stage Researcher (up to the point of doctoral level qualification/PhD or equivalent)
7,1% 30
R2 Recognised Researcher (Doctorate holders or equivalent who are not yet fully independent)
53,6% 225
R3 Established Researcher (researchers who have developed a level of independence)
29,8% 125
R4 Leading Researcher (researchers leading their research area or field) 7,9% 33
Other (please specify) 1,7% 7
answered question 420
skipped question 79
27. If you are NOT working as a researcher (as per the Frascati definition above) please indicate the reasons and their importance:
Answer OptionsVery
ImportantFairly
importantFairly
unimportantVery
unimportantMean
Response Count
Interested in other career 19 21 15 10 2,25 65
Difficulty getting an academically suitable research post
38 14 11 7 1,81 70
Difficulty securing tenured/se-cure post
38 15 8 5 1,70 66
Lack of career structure in research careers
24 19 17 5 2,05 65
Low remuneration in research positions
19 14 19 12 2,38 64
More interesting post became available
19 21 17 8 2,22 65
Poor public recognition/status of research careers
12 11 19 25 2,85 67
Personal/family reasons 19 10 15 21 2,58 65
Other 8 2 1 9 2,55 20
Please specify: 14
answered question 75
skipped question 424

Care
er T
rack
ing
of D
oct
orat
e H
olde
rs –
Pil
ot
Proj
ect
Repo
rt
51
Appendix II: Online questionnaire results
28. Below are some of the reasons why an individual might choose to accept a post doctorate position (or equivalent). Thinking back to your FIRST post doctorate position, how important were each of these reasons in influencing your decision to accept that position:
Answer OptionsVery
ImportantFairly
importantFairly
unimportantVery
unimportantMean
Response Count
It was a necessary step toward desirable employment in my field
295 123 29 16 1,50 463
I wanted additional training in my doctoral/specialised field
187 168 78 27 1,88 460
I wanted training in another field 112 151 105 88 2,37 456
I wanted to work in a specific organization
60 124 162 107 2,70 453
I wanted to work with a specific person
65 111 141 134 2,76 451
I wanted to revise my dissertation for publication as a book
17 42 83 308 3,52 450
It was the only acceptable employment I could find at the time
60 104 97 189 2,92 450
Because the location suited me 85 169 109 91 2,45 454
Because the location suited my spouse/ partner
61 100 86 193 2,93 440
Other 22 12 5 33 2,68 72
Please specify: 33
answered question 473
skipped question 26
29. Of the following resources which were the most important supports in finding your first job after completion of your doctorate (or its equivalent)
Answer OptionsVery
ImportantFairly
importantFairly
unimportantVery
unimportantMean
Response Count
Academic Advisor 176 111 81 86 2,17 454
University Career Guidance Centre
28 39 97 276 3,41 440
Graduate students/alumni 21 77 103 237 3,27 438
Parents/relatives/friends 38 72 98 228 3,18 436
Internet advertisements/web search
125 119 61 138 2,48 443
Job advertisement in newspapers etc.
29 39 102 269 3,39 439
Job announcements in professional journals
43 70 104 222 3,15 439
Job/Career fairs 14 34 103 282 3,51 433
Job advertisements in Department/University
59 94 82 202 2,98 437
Previous job 98 131 73 135 2,56 437
Social and professional networks 167 132 63 88 2,16 450
Recruiters or head hunters 12 33 69 315 3,60 429
Other 24 10 8 55 2,97 97
Please specify: 35
answered question 482
skipped question 17
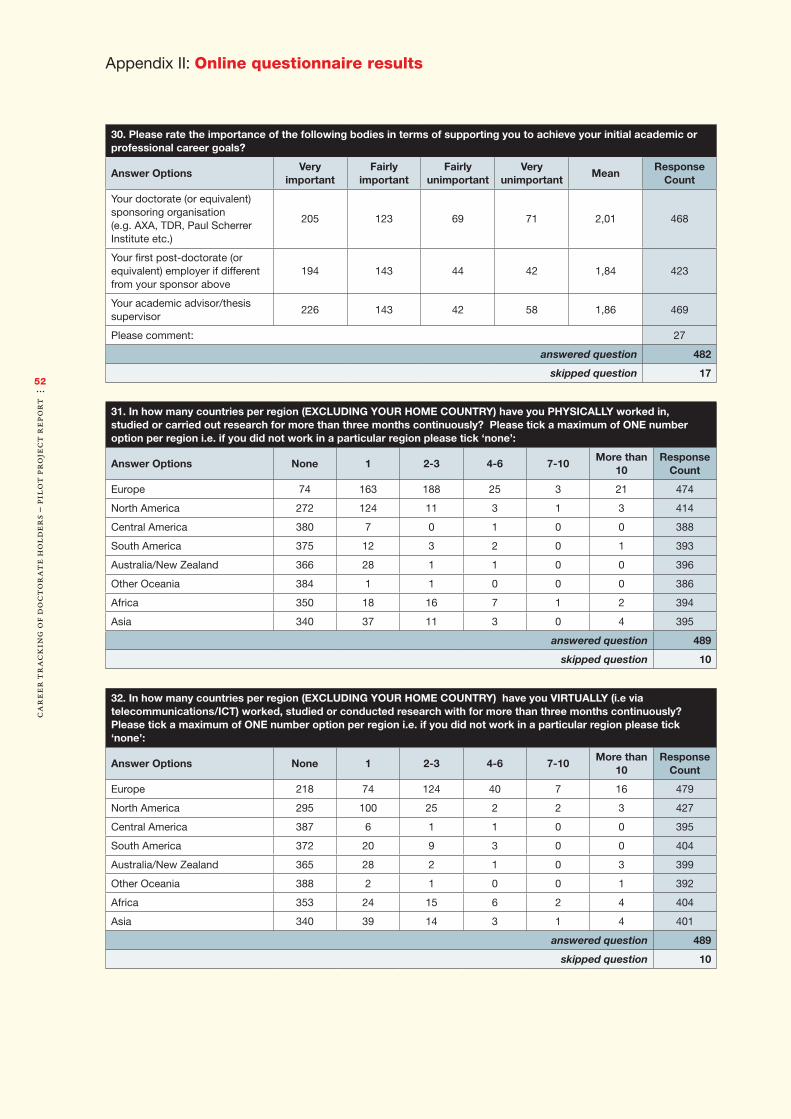
Care
er T
rack
ing
of D
oct
orat
e H
olde
rs –
Pil
ot
Proj
ect
Repo
rt
52
Appendix II: Online questionnaire results
30. Please rate the importance of the following bodies in terms of supporting you to achieve your initial academic or professional career goals?
Answer OptionsVery
importantFairly
importantFairly
unimportantVery
unimportantMean
Response Count
Your doctorate (or equivalent) sponsoring organisation (e.g. AXA, TDR, Paul Scherrer Institute etc.)
205 123 69 71 2,01 468
Your first post-doctorate (or equivalent) employer if different from your sponsor above
194 143 44 42 1,84 423
Your academic advisor/thesis supervisor
226 143 42 58 1,86 469
Please comment: 27
answered question 482
skipped question 17
31. In how many countries per region (EXCLUDING YOUR HOME COUNTRY) have you PHYSICALLY worked in, studied or carried out research for more than three months continuously? Please tick a maximum of ONE number option per region i.e. if you did not work in a particular region please tick ‘none’:
Answer Options None 1 2-3 4-6 7-10More than
10Response
Count
Europe 74 163 188 25 3 21 474
North America 272 124 11 3 1 3 414
Central America 380 7 0 1 0 0 388
South America 375 12 3 2 0 1 393
Australia/New Zealand 366 28 1 1 0 0 396
Other Oceania 384 1 1 0 0 0 386
Africa 350 18 16 7 1 2 394
Asia 340 37 11 3 0 4 395
answered question 489
skipped question 10
32. In how many countries per region (EXCLUDING YOUR HOME COUNTRY) have you VIRTUALLY (i.e via telecommunications/ICT) worked, studied or conducted research with for more than three months continuously? Please tick a maximum of ONE number option per region i.e. if you did not work in a particular region please tick ‘none’:
Answer Options None 1 2-3 4-6 7-10More than
10Response
Count
Europe 218 74 124 40 7 16 479
North America 295 100 25 2 2 3 427
Central America 387 6 1 1 0 0 395
South America 372 20 9 3 0 0 404
Australia/New Zealand 365 28 2 1 0 3 399
Other Oceania 388 2 1 0 0 1 392
Africa 353 24 15 6 2 4 404
Asia 340 39 14 3 1 4 401
answered question 489
skipped question 10

Care
er T
rack
ing
of D
oct
orat
e H
olde
rs –
Pil
ot
Proj
ect
Repo
rt
53
Appendix II: Online questionnaire results
33. In how many enterprises/commercial firms have you worked in the last seven years by region? Please tick ONE number option per region, if you did not work in a particular region please tick ‘none’:
Answer Options None 1 2-3 4-6 More than 6Response
Count
Home Country 312 100 48 6 6 472
European Country 348 58 37 5 2 450
North America 410 16 3 0 0 429
Central America 420 1 0 0 0 421
South America 416 4 1 2 0 423
Australia/New Zealand 417 6 0 0 0 423
Other Oceania 419 1 0 0 0 420
Africa 412 8 5 3 0 428
Asia 406 10 3 0 1 420
answered question 489
skipped question 10
34. How many times have you changed employer (including post-doc positions) in the last seven years?
Answer Options Response Average Response Total Response Count
Please enter a positive number e.g. 1/2/3 2,01 948 471
answered question 471
skipped question 28
35. Are you currently conducting research with researchers BASED IN another country/region (i.e. transnational research)?
Answer Options Response Percent Response Count
Yes 59,5% 289
No (please go to Q37) 40,5% 197
answered question 486
skipped question 13
36. If yes, which of the following ways and in which regions?
Answer Options EuropeNorth
AmericaCentral America
South America
Australia/New
Zealand
Other Oceania
Africa AsiaResponse
Count
Working on a joint publication
231 125 7 22 27 0 30 46 274
Collaborating at a distance on a joint research project with occasional/frequent physical presence
202 102 7 18 14 2 26 36 248
Using web based or virtual technology only (i.e no physical presence) to collaborate on a research project
121 84 8 17 15 0 17 27 164
Other 6 3 0 1 1 0 2 3 10
Please specify (sabbatical leave, field work etc.) 13
answered question 294
skipped question 205

Care
er T
rack
ing
of D
oct
orat
e H
olde
rs –
Pil
ot
Proj
ect
Repo
rt
54
Appendix II: Online questionnaire results
37. Please indicate whether you are currently working with researchers from a different DISCIPLINE(s) to yours in any of the following ways:
Answer Options Yes No Response Count
Working on a joint publication 257 211 468
Collaborating at a distance on a joint research project with occasional/frequent physical presence
200 253 453
Using web based or virtual technology only (i.e no physical presence) to collaborate on a research project
137 304 441
Other 14 185 199
Please specify (sabbatical leave, field work etc.) 16
answered question 475
skipped question 24
38. Please indicate whether you are currently working with industry/commercial ventures in any of the following ways:
Answer Options Yes No Response Count
Working on a joint publication 69 392 461
Collaborating at a distance on a joint research project with occasional/frequent physical presence
90 367 457
Using web based or virtual technology only (i.e no physical presence) to collaborate on a research project
53 394 447
Other 8 238 246
Please specify (sabbatical leave, field work etc.) 9
answered question 469
skipped question 30
39. Within the next year, do you plan to move to another country to live or work (for more than one year)?
Answer Options Response Percent Response Count
Yes 16,8% 82
No (Please go to Q42) 59,5% 291
Don’t know (Please go to Q42) 23,7% 116
answered question 489
skipped question 10
40. If yes, which country do you plan to move to?
Answer Optionscoded subsequent to analysis
Response Count
82
answered question 82
skipped question 417

Care
er T
rack
ing
of D
oct
orat
e H
olde
rs –
Pil
ot
Proj
ect
Repo
rt
55
Appendix II: Online questionnaire results
41. If you plan to move to another country, please indicate the MAIN reason for moving below:
Answer Options Response Percent Response Count
End of postdoc or job contract 33,9% 37
Returning to my home country 10,1% 11
Economic/financial opportunities 1,8% 2
Academic/career development opportunities 40,4% 44
Partner’s academic/career development opportunities 4,6% 5
Children’s educational/career development opportunities 1,8% 2
Family or personal reasons 5,5% 6
Political reasons 0,0% 0
Other 1,8% 2
Please specify: 3
answered question 109
skipped question 390
42. Do you use your doctorate level skills in your current post?
Answer Options Response Percent Response Count
Regularly 85,1% 406
Sometimes 12,6% 60
Never 2,3% 11
answered question 477
skipped question 22
43. How much of your time is dedicated to each of the following activities (total should add up to c. 100%)?
Answer Options 0-10% 11-20% 21-40% 41-60% 61-80% 81%-100%Response
Count
Research performing activities 38 45 95 96 119 84 477
Research supervision/management activities
136 162 91 33 18 5 445
Teaching activities 257 84 54 20 11 3 429
Technology transfer to industry 320 33 13 6 3 2 377
Administrative activities 206 139 52 18 12 5 432
Other 76 11 6 5 3 3 104
Please specify 30
answered question 480
skipped question 19

Care
er T
rack
ing
of D
oct
orat
e H
olde
rs –
Pil
ot
Proj
ect
Repo
rt
56
Appendix II: Online questionnaire results
44. Within the last 12 months, which of the following activities were you responsible for:
Answer Options Yes No Response Count
Formally supervising PhD students 167 288 455
Formally supervising undergraduate/master’s students
270 192 462
Supervising a work colleague’s research 231 222 453
Managing own research team 179 281 460
Technology Transfer to industry 62 380 442
Setting up laboratory 114 331 445
Lead authoring peer review article 336 119 455
Joint authoring peer review article 360 98 458
Performing peer reviews 307 145 452
Other 25 86 111
Please describe 30
answered question 478
skipped question 21
45. What was/were your main reason(s) for taking your current position? Please rate their importance to you when making the decision:
Answer OptionsVery
importantFairly
important
Fairly unimport-
ant
Very unimport-
antN/A Mean
Response Count
To receive training/experience in area outside of my PhD field
125 115 69 62 74 2,18 445
Expectation that my research and specialist skills would be strongly utilised
241 158 30 14 13 1,59 456
Next step in the career path 308 111 24 9 10 1,41 462
To continue my research in the field of my PhD
158 108 101 54 33 2,12 454
Carry out research independently 232 133 43 27 21 1,69 456
Encouraged by my PhD supervisor
40 98 97 122 84 2,84 441
Opportunity to work with a specific person or group
112 130 75 82 49 2,32 448
Carry out and support teaching activities
53 94 110 126 62 2,81 445
This type of position (“post-doc”) is generally expected for my preferred career
112 122 77 66 59 2,26 436
Other employment not available 52 75 81 129 98 2,85 435
Good salary available 66 163 116 75 25 2,48 445
Good work conditions other than salary
142 202 59 32 15 1,96 450
Other 16 3 1 5 60 1,80 85
Please describe: 22
answered question 474
skipped question 25
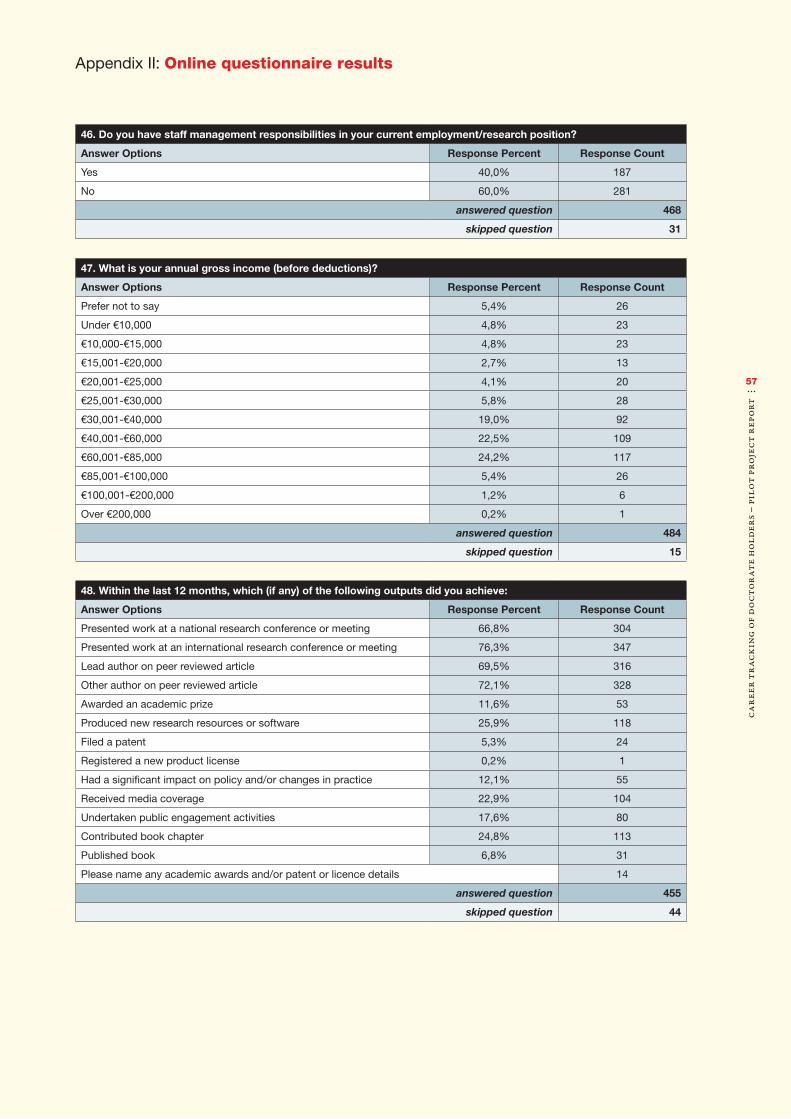
Care
er T
rack
ing
of D
oct
orat
e H
olde
rs –
Pil
ot
Proj
ect
Repo
rt
57
Appendix II: Online questionnaire results
46. Do you have staff management responsibilities in your current employment/research position?
Answer Options Response Percent Response Count
Yes 40,0% 187
No 60,0% 281
answered question 468
skipped question 31
48. Within the last 12 months, which (if any) of the following outputs did you achieve:
Answer Options Response Percent Response Count
Presented work at a national research conference or meeting 66,8% 304
Presented work at an international research conference or meeting 76,3% 347
Lead author on peer reviewed article 69,5% 316
Other author on peer reviewed article 72,1% 328
Awarded an academic prize 11,6% 53
Produced new research resources or software 25,9% 118
Filed a patent 5,3% 24
Registered a new product license 0,2% 1
Had a significant impact on policy and/or changes in practice 12,1% 55
Received media coverage 22,9% 104
Undertaken public engagement activities 17,6% 80
Contributed book chapter 24,8% 113
Published book 6,8% 31
Please name any academic awards and/or patent or licence details 14
answered question 455
skipped question 44
47. What is your annual gross income (before deductions)?
Answer Options Response Percent Response Count
Prefer not to say 5,4% 26
Under €10,000 4,8% 23
€10,000-€15,000 4,8% 23
€15,001-€20,000 2,7% 13
€20,001-€25,000 4,1% 20
€25,001-€30,000 5,8% 28
€30,001-€40,000 19,0% 92
€40,001-€60,000 22,5% 109
€60,001-€85,000 24,2% 117
€85,001-€100,000 5,4% 26
€100,001-€200,000 1,2% 6
Over €200,000 0,2% 1
answered question 484
skipped question 15

Care
er T
rack
ing
of D
oct
orat
e H
olde
rs –
Pil
ot
Proj
ect
Repo
rt
58
Appendix II: Online questionnaire results
49. Please rate your MAIN current host/working environment in terms of your satisfaction with the following key aspects:
Answer OptionsVery
satisfiedFairly
satisfiedFairly
dissatisfiedVery
dissatisfiedMean
Response Count
Career growth opportunities 121 211 98 36 2,11 466
Contribution to society 121 267 64 11 1,92 463
Prestige of organisation or job 172 212 68 8 1,81 460
Scientific environment 172 202 72 16 1,85 462
Organisational culture 96 207 112 40 2,21 455
Ethical awareness 132 236 60 22 1,94 450
Job security/stability 131 115 112 103 2,41 461
Salary 135 206 96 27 2,03 464
Research supervision 125 209 77 34 2,04 445
Mentoring and training 107 215 98 31 2,12 451
Career development support 74 182 140 57 2,40 453
Research infrastructure 165 181 70 30 1,92 446
Research grant/contract management capabilities
103 214 85 38 2,13 440
Work life balance 99 239 91 32 2,12 461
Other 6 4 0 15 2,96 25
Please specify: 8
answered question 471
skipped question 28

Care
er T
rack
ing
of D
oct
orat
e H
olde
rs –
Pil
ot
Proj
ect
Repo
rt
59
Appendix II: Online questionnaire results
50. Please rate the questionnaire you have just completed under the following categories:
Answer Options Very good Fairly good Fairly poor Very poor MeanResponse
Count
Clarity/understandability of questions
212 227 27 6 1,63 472
Relevance of questions to your career experiences
145 257 55 15 1,87 472
Design in terms of time taken/effort to complete
166 257 38 9 1,77 470
Suggested Improvements 52
answered question 474
skipped question 25
51. Would you be willing to complete this questionnaire again in three years time if asked?
Answer Options Response Percent Response Count
Yes 84,7% 410
No 15,3% 74
answered question 484
skipped question 15
52. Any additional comments you would like to make:
Answer Options Response Count
130
answered question 130
skipped question 369

Care
er T
rack
ing
of D
oct
orat
e H
olde
rs –
Pil
ot
Proj
ect
Repo
rt
60
Appendix III: Independent Samples Student’s t test on satisfaction levels with aspects of working situation
Aspects of working situation Equal variances Levene’s test for equality of variances t test for equality of means
F Sig. t df Sig. (2-tailed)
Mean difference
Std. error difference
95% confidence interval of the difference
Lower Upper
Career growth opportunitiesassumed .505 .478 -1.835 420 .067 -.16002 .08721 -.33144 .01141
not assumed -1.844 347.246 .066 -.16002 .08678 -.33069 .01065
Contribution to societyassumed 8.220 .004 -3.340 418 .001 -.22840 .06839 -.36282 -.09397
not assumed -3.310 332.162 .001 -.22840 .06900 -.36413 -.09266
Prestige of organisation or jobassumed 1.446 .230 -.928 415 .354 -.06991 .07531 -.21795 .07813
not assumed -.924 329.395 .356 -.06991 .07568 -.21878 .07896
Scientific environmentassumed .026 .871 2.336 417 .020 .18674 .07993 .02963 .34386
not assumed 2.287 311.606 .023 .18674 .08164 .02610 .34739
Organisational cultureassumed .001 .970 .905 410 .366 .07909 .08742 -.09277 .25095
not assumed .911 340.186 .363 .07909 .08685 -.09175 .24993
Ethical awarenessassumed 2.742 .099 .503 407 .615 .03997 .07949 -.11628 .19623
not assumed .513 358.138 .608 .03997 .07793 -.11328 .19323
Job security/stabilityassumed 8.959 .003 -9.685 417 .000 -.99030 .10225 -1.19128 -.78932
not assumed -10.036 377.725 .000 -.99030 .09867 -1.18431 -.79629
Research supervisionassumed .076 .783 -.121 407 .904 -.01054 .08730 -.18216 .16108
not assumed -.121 326.328 .904 -.01054 .08699 -.18168 .16060
Salaryassumed 1.369 .243 3.195 421 .002 .26278 .08226 .10109 .42448
not assumed 3.157 333.528 .002 .26278 .08323 .09907 .42650
Mentoring and trainingassumed .060 .807 -1.625 411 .105 -.13636 .08391 -.30131 .02859
not assumed -1.602 317.616 .110 -.13636 .08511 -.30381 .03109
Career development supportassumed .011 .918 -1.262 410 .208 -.11445 .09067 -.29269 .06379
not assumed -1.265 326.863 .207 -.11445 .09048 -.29245 .06356
Research infrastructureassumed 5.837 .016 5.222 408 .000 .45237 .08662 .28209 .62265
not assumed 5.024 286.290 .000 .45237 .09003 .27516 .62959
Research grant/contract management capabilitiesassumed 4.588 .033 .784 401 .433 .06904 .08806 -.10408 .24215
not assumed .758 284.726 .449 .06904 .09114 -.11035 .24843
Work-life balanceassumed 1.424 .233 .083 417 .934 .00673 .08073 -.15196 .16541
not assumed .085 359.904 .933 .00673 .07947 -.14955 .16300

Care
er T
rack
ing
of D
oct
orat
e H
olde
rs –
Pil
ot
Proj
ect
Repo
rt
61
Appendix III: Independent Samples Student’s t test on satisfaction levels with aspects of working situation
Aspects of working situation Equal variances Levene’s test for equality of variances t test for equality of means
F Sig. t df Sig. (2-tailed)
Mean difference
Std. error difference
95% confidence interval of the difference
Lower Upper
Career growth opportunitiesassumed .505 .478 -1.835 420 .067 -.16002 .08721 -.33144 .01141
not assumed -1.844 347.246 .066 -.16002 .08678 -.33069 .01065
Contribution to societyassumed 8.220 .004 -3.340 418 .001 -.22840 .06839 -.36282 -.09397
not assumed -3.310 332.162 .001 -.22840 .06900 -.36413 -.09266
Prestige of organisation or jobassumed 1.446 .230 -.928 415 .354 -.06991 .07531 -.21795 .07813
not assumed -.924 329.395 .356 -.06991 .07568 -.21878 .07896
Scientific environmentassumed .026 .871 2.336 417 .020 .18674 .07993 .02963 .34386
not assumed 2.287 311.606 .023 .18674 .08164 .02610 .34739
Organisational cultureassumed .001 .970 .905 410 .366 .07909 .08742 -.09277 .25095
not assumed .911 340.186 .363 .07909 .08685 -.09175 .24993
Ethical awarenessassumed 2.742 .099 .503 407 .615 .03997 .07949 -.11628 .19623
not assumed .513 358.138 .608 .03997 .07793 -.11328 .19323
Job security/stabilityassumed 8.959 .003 -9.685 417 .000 -.99030 .10225 -1.19128 -.78932
not assumed -10.036 377.725 .000 -.99030 .09867 -1.18431 -.79629
Research supervisionassumed .076 .783 -.121 407 .904 -.01054 .08730 -.18216 .16108
not assumed -.121 326.328 .904 -.01054 .08699 -.18168 .16060
Salaryassumed 1.369 .243 3.195 421 .002 .26278 .08226 .10109 .42448
not assumed 3.157 333.528 .002 .26278 .08323 .09907 .42650
Mentoring and trainingassumed .060 .807 -1.625 411 .105 -.13636 .08391 -.30131 .02859
not assumed -1.602 317.616 .110 -.13636 .08511 -.30381 .03109
Career development supportassumed .011 .918 -1.262 410 .208 -.11445 .09067 -.29269 .06379
not assumed -1.265 326.863 .207 -.11445 .09048 -.29245 .06356
Research infrastructureassumed 5.837 .016 5.222 408 .000 .45237 .08662 .28209 .62265
not assumed 5.024 286.290 .000 .45237 .09003 .27516 .62959
Research grant/contract management capabilitiesassumed 4.588 .033 .784 401 .433 .06904 .08806 -.10408 .24215
not assumed .758 284.726 .449 .06904 .09114 -.11035 .24843
Work-life balanceassumed 1.424 .233 .083 417 .934 .00673 .08073 -.15196 .16541
not assumed .085 359.904 .933 .00673 .07947 -.14955 .16300

Care
er T
rack
ing
of D
oct
orat
e H
olde
rs –
Pil
ot
Proj
ect
Repo
rt
62
Appendix IV: Glossary of statistical terms
Th is glossary of statistical terms used within the report is included for convenience and quick reference, as readers may not be familiar with all expressions. Explanations have been simplified as much as possible.
Confidence interval (also called margin of error)The confidence interval is a range of values within which the true value of what is being measured is expected to fall. E.g. if you use a confidence interval of 4 and 32% percent of your sample picks an answer you can be ‘sure’ that if you had asked the question of the entire relevant population between 28% (32-4) and 36% (32+4) would have picked that answer.
Confidence levelThe confidence level tells you how sure you can be. It is expressed as a percentage and represents how often the true percentage of the population who would pick an answer lies within the confidence interval. A 95% confidence level means you can be 95% certain and a 99% confidence level means you can be 99% certain. Most researchers use the 95% confidence level.
CorrelationThis refers to the strength of a relationship between two variables. A strong, or high, correlation means that two or more variables have a strong relationship with each other while a weak, or low, correlation means that the variables are hardly related. There are many statistical tests that are used to determine correlation, such as the Pearson correlation test.
(Pearson) Correlation coefficientThe correlation coefficient r is a measure of the strength of the relationship. The ’r’ score is a positive or negative measure of the strength of the relationship. A perfect positive/negative relationship measures 1.00/-1.00. In real life perfect correlations do not exist. Correlation should not be confused with causation – a strong correlation (highly positive or negative r score) might be suggestive of causation but further analysis to rule out coincidental or other factors is required.
Cross-tabulationThis calculation shows the relationship between two or more survey questions.
Cumulative frequency Refers to the total of the absolute frequencies of all events at or below a certain point in an ordered list of events.
FrequencyThe frequency is the number of times the event occurred in an experiment or study.
Levene’s testThis is an inferential statistic used to assess the equality of variances for a variable calculated for two or more groups. Levene’s test is often used before a comparison of means.
Likert scaleThe Likert scale is the most widely used approach to scaling (agree/disagree type) responses in survey research. See http://www.simplypsychology.org/likert-scale.html.
Linear relationshipTwo variables are linearly associated if a change in one is associated with a proportional change in the other, with the same constant of proportionality throughout the range of measurement.
Mean or x ̄The mean refers to the average and is represented by the symbol x̄.
ModeThe mode is the number that occurs most frequently within a set of numbers.
p value/statistical significanceThe p value is a measure of the significance of results (see Student’s t test below). The p value is a number between 0 and 1 and interpreted in the following way:•A small p value (typically ≤.05) indicates strong
evidence against the null hypothesis, so the null hypothesis is rejected.
•A large p value (>.05) indicates weak evidence against the null hypothesis, so the null hypothesis cannot be rejected.
•p values very close to the cut-off (.05) are considered to be marginal (could go either way). The p value allows readers to draw conclusions about the strength or statistical significance of reported results.

Care
er T
rack
ing
of D
oct
orat
e H
olde
rs –
Pil
ot
Proj
ect
Repo
rt
63
Appendix IV: Glossary of statistical terms
rSee correlation coefficient
Statistically significant(see ‘p value’ above and ‘Student’s t test’ below)
Student’s t testA Student’s t test measures the significance of the difference between two mean (average) scores. It enables an assessment of whether or not the difference between mean scores is due to chance or other factors. Example: we might have a hypothesis that a group of men and women would score the same (null hypothesis) on a test of verbal reasoning. The t test allows an assessment of whether any difference between the average scores is due to chance or intrinsic differences (the p value or probability level). The standard benchmark is 5% (p=.05). When the p value is smaller than the significance level the null hypothesis is rejected and an alternative hypothesis is accepted. A result is seen as ‘significant’ when the p value is smaller than the significance level, i.e. when the probability of what we observed occurring given the null hypothesis is true – a p value smaller than the cut-off point. Lower p values indicate higher levels of significance. A p value of .001** is ‘more significant’ than one of .05*.
VariableA variable is something that can be changed, such as a characteristic or value. Examples include age, sex, salary, intelligence quotient.
x ̄Symbol used to show ‘mean’ or average (see above).

Care
er T
rack
ing
of D
oct
orat
e H
olde
rs –
Pil
ot
Proj
ect
Repo
rt
64
Appendix V: List of abbreviations and acronyms
AXA RF AXA Research Fund
CDH Careers of Doctorate Holders
CIRGE Center for Innovation and Research in Graduate Education
CNIL Commission nationale de l’informatique et des libertés (French National Commission on Data Protection)
ERA European Research Area
ESF European Science Foundation
EU European Union
EUA European University Association
EURYIEuropean Young Investigator Awards
FNRFonds National de la Recherche (National Research Fund)
GRADE The Goethe Graduate Academy
ICTInformation and Communications Technology
MDMedical Doctor
MO Member Organisation
MORE 2 Mobility Patterns and Career Paths of EU Researchers
NGONon-Governmental Organisation
NIFUNordic Institute for Studies in Innovation, Research and Education
NSF National Science Foundation
OECD Organisation for Economic Co-operation and Development
PhD Doctor of Philosophy
PO Participating Organisation
PSI Paul Scherrer Institute
R&D Research & Development
R1 First Stage Researcher (up to the point of PhD)
R2 Recognised Researcher (PhD holder or equivalent who is not yet fully independent)
R3Established Researcher (researcher who has developed a level of independence)
R4 Leading Researcher (researcher leading his or her research area or field)
SOCStandard Occupational Classification
SPSS Statistical Package for the Social Sciences
SSH Social Sciences and Humanities
TDRSpecial Programme for Research and Training in Tropical Diseases
UNESCO United Nations Educational, Scientific and Cultural Organization
US United States


European Science Foundation1 quai Lezay-Marnésia • BP 9001567080 Strasbourg cedex • FranceTel: +33 (0)3 88 76 71 00 Fax: +33 (0)3 88 37 05 32www.esf.org
May 2015 – Print run: 750 Graphic design: Dans les villes, Strasbourg