care units pressure levels in Portuguese neonatal ...
26
Full Terms & Conditions of access and use can be found at http://www.tandfonline.com/action/journalInformation?journalCode=vaeh20 Download by: [b-on: Biblioteca do conhecimento online UP] Date: 14 March 2017, At: 09:50 Archives of Environmental & Occupational Health ISSN: 1933-8244 (Print) 2154-4700 (Online) Journal homepage: http://www.tandfonline.com/loi/vaeh20 Assessment and characterization of sound pressure levels in Portuguese neonatal intensive care units Joana Santos, Carlos Carvalhais, Ana Xavier & Manuela V. Silva To cite this article: Joana Santos, Carlos Carvalhais, Ana Xavier & Manuela V. Silva (2017): Assessment and characterization of sound pressure levels in Portuguese neonatal intensive care units, Archives of Environmental & Occupational Health, DOI: 10.1080/19338244.2017.1304883 To link to this article: http://dx.doi.org/10.1080/19338244.2017.1304883 Accepted author version posted online: 13 Mar 2017. Submit your article to this journal View related articles View Crossmark data
Transcript of care units pressure levels in Portuguese neonatal ...
Full Terms & Conditions of access and use can be found athttp://www.tandfonline.com/action/journalInformation?journalCode=vaeh20
Download by: [b-on: Biblioteca do conhecimento online UP] Date: 14 March 2017, At: 09:50
Archives of Environmental & Occupational Health
ISSN: 1933-8244 (Print) 2154-4700 (Online) Journal homepage: http://www.tandfonline.com/loi/vaeh20
Assessment and characterization of soundpressure levels in Portuguese neonatal intensivecare units
Joana Santos, Carlos Carvalhais, Ana Xavier & Manuela V. Silva
To cite this article: Joana Santos, Carlos Carvalhais, Ana Xavier & Manuela V. Silva (2017):Assessment and characterization of sound pressure levels in Portuguese neonatal intensive careunits, Archives of Environmental & Occupational Health, DOI: 10.1080/19338244.2017.1304883
To link to this article: http://dx.doi.org/10.1080/19338244.2017.1304883
Accepted author version posted online: 13Mar 2017.
Submit your article to this journal
View related articles
View Crossmark data
ACCEPTED MANUSCRIPT
ACCEPTED MANUSCRIPT 1
Assessment and characterization of sound pressure levels in Portuguese neonatal intensive
care units
Joana Santos*a, Carlos Carvalhais
a, Ana Xavier
a, Manuela V. Silva
a
a Scientific Area of Environmental Health, Research Centre on Health and Environment
(CISA/ESS.PPorto), School of Health of Polytechnic Institute of Porto (ESS.PPorto), Rua Dr.
António Bernardino de Almeida, 400, 4200-072 Porto, Portugal. E-mail address: [email protected] /
[email protected] / [email protected] / [email protected]
*Corresponding author
Joana Santos
Address Rua Dr. António Bernardino de Almeida, 400, 4200-072 Porto, Portugal
E-mail address [email protected]
Joana Santos and Carlos Carvalhais contributed equally to this work.
Acknowledgements:
This work is part of the ―NeoNoise‖ project, which is being conducted and supported by the
Occupational and Environmental Health Research Group of the Research Centre on Health and
Environment (SOA/CISA), School of Health of Polytechnic Institute of Porto (ESS.IPP). The
authors would like to thank the participants of the study and the assistance given by the
Occupational Health Services of the studied hospitals. The authors are also grateful to the BSc
Environmental Health students (from ESS.IPP) António Azevedo, Mara Nóia and Maria João
Coelho for partial data collection.
Abstract
In NICU, systematic exposure to sound pressure levels above the recommended can affect both

ACCEPTED MANUSCRIPT
ACCEPTED MANUSCRIPT 2
neonates and staff. This study aimed to evaluate the sound pressure levels in three Portuguese
NICU and the noise perception of staff. The measurements were performed with a sound level
meter, considering the location of the main sources of noise and the layout of the units. A
questionnaire was applied to assess noise perception of professionals. The staff classified the
environment (regarding noise) as ―slightly uncomfortable‖ (41.1%) and 48.4% considered it as
―acceptable‖. In addition, the majority (55.5%) considered ―equipment‖ as the most annoying
source of noise. The results showed that noise levels were excessive in all the evaluated areas of
the NICUs, exceeding international guidelines, with the levels ranging between 48.7 dBA to 71.7
dBA. Overall, there is a need for more research in order to verify the effectiveness of some
actions and strategies to reduce the impact of noise in NICU.
Keywords: noise; NICU; healthcare staff.
ACCEPTED MANUSCRIPT
ACCEPTED MANUSCRIPT 3
Introduction
The premature infant in the neonatal intensive care unit (NICU) is dependent of highly advanced
medical care, which has demonstrated remarkably effective success in treating high risk infant’s
illness. However, even with an impressive advance of medical technology, the incidence of
disability and neurodevelopmental disorders among survivors of NICU remains high and
problematic. Indeed, due to the high complexity of procedures and technology used in the NICU,
these environment conditions include intense sensorial stimulus such as excessive lighting and
noise which are incompatible with well-being of neonates, family and professionals. Mechanical
devices, ventilation systems, as well as patients and staff are general sources within hospitals. In
the particular case of NICU rooms and inside incubators, noise production is due to alarms
produced by life support devices, flow of medical gas, communication among professionals and
during activities of nursing care [1-3]. Additionally, ongoing exposure to alarms, noisy
incubators and loud jarring sounds occur regularly in the NICU environment, putting premature
infants at risk of noise induced hearing loss and other many health problems, such as sleep
disorders and failure in cognitive activations [4,5]. NICU infant stress reactions including
physiological and behavioral changes have been associated with sound levels in the incubator
[6]. In fact, noise has been compared with aminoglycosides as an equal detriment to the
developing cochlea. Moreover, it has been documented as a noxious stimulus with deleterious
physiological effects in the premature infant. These effects include apnea; bradycardia; and
abrupt fluctuations in heart rate, respiratory rate, blood pressure, and oxygen saturation [3,4,7–
10]. Sensitivity to excessive noise begins at 6 months gestation and extends through the newborn
period 2-3 months after birth [11], with the neonates being more vulnerable to the effects of

ACCEPTED MANUSCRIPT
ACCEPTED MANUSCRIPT 4
noise because of their immaturity. More information regarding auditory and non-auditory health
effects of noise has been reported by Basner et al. [5]. Furthermore, noise as a stressor does not
only influence negatively the healing process of patients (in this case premature infants) but also
puts pressure on the workers which can result in a higher error occurrence [12–14]. In fact, there
has been very little research on the influences of acoustic conditions on healthcare staff [15]. It is
well stablished that patients are the center of every hospital, but it is known that the hospital
environment has many occupational health risks due to the variety of clinical and non-clinical
tasks performed by healthcare workers. The exposure to psychosocial, chemical, physical,
mechanical and biological hazards are common in hospital units and predispose healthcare
workers to different types of accidents [16]. However, the work performed in NICU can be
particularly psychologically demanding which combined with environmental factors within the
NICU, can increase the risk of work accidents occurrence, with negative consequences for staff
and also for patients.
A literature review conducted by Konkani & Oakley [17] showed that several authors studied
and characterized acoustic environment of intensive care units in hospitals. The noise amplitude
was measured in dB or frequency analysis by some of them, while others applied an approach
combining noise measurement with patient or staff questionnaire surveys or interviews. In
Portugal, only Nicolau et al. [18] characterized noise levels in NICU. They concluded that noise
levels were above the recommended by international guidelines and emphasized the need to train
health care staff and include actively health professionals in noise reduction strategies. The
current study is integrated in a larger project - NeoNoise project, which combine objective and
subjective approaches in order to characterize the acoustic environment in Portuguese NICU.

ACCEPTED MANUSCRIPT
ACCEPTED MANUSCRIPT 5
Besides that, this project aims to determine the influence of sound pressure levels in health and
well-being of premature infants and health professionals. The main challenge of the project is to
develop guidelines to reduce noise levels that take into account the reality of the Portuguese
healthcare services [19]. The objective of this study is to quantify noise levels in three NICU and
to obtain surveys from healthcare staff in the assessment of real and perceived noise.
Materials and Methods
This study was carried out in the NICU of three hospitals (A, B and C) located in the north
region of Portugal. The study included a walkthrough inspection, measurements for the
assessment of the sound pressure levels and assessment of health care professional’s noise
perceptions. The authorization to perform the study was given by three hospitals, after favorable
statement by their Ethics Committee or approval by their respective administration boards,
including NICU responsible.
Walkthrough survey
A walkthrough inspection was made to characterize the built environment and indoor spaces of
the three NICU under study. A checklist for this purpose was used. Detailed information
regarding the building environment such as traffic and rural/urban surroundings and other
external noise sources, construction characteristics, among others, was gathered. Identification of
all relevant information such as area, finishing materials, and conditions concerning floor, walls,
ceiling, windows and ground as well as equipment installed and health care activities routines
was made. The existing equipment were common to the three NICU, namely: cardiopulmonary
monitors, blood pressure monitors, ventilators (attached to an endotracheal tube or to continuous
positive airway pressure (C-PAP) tubes), oximeters, Bili lights, among others. It was possible to

ACCEPTED MANUSCRIPT
ACCEPTED MANUSCRIPT 6
verify that NICU had some preventive measures to reduce noise levels, mainly maintenance
programs of the equipment.
NICU - A
The clinical area of the unit consists of two rooms (A1—Intensive Care and A2—Special Care),
without total separation between infrastructures. Room A1 includes the integrated set of
physical, technical, and human expertise, where premature infants in critical condition with
failure of vital bodily functions are assisted by advanced life support for 24 h/d. Room A2 also
includes the same resources but not intended for neonates requiring mechanical ventilation. Both
preparation of parenteral nutrition and medication are located in a common area of the two
rooms, but the entrance is accessed through room A. The NICU (rooms A and B) has capacity to
provide care for 19 patients with a total of 14 incubators and 5 nurseries. The existing physical
infrastructure separating the compartments consists of plywood with glazed surface on top. The
floor is concrete with vinyl covering and walls are half covered with vinyl and half plasterboard
panels coated with washable paint.
NICU - B
This unit consists of two rooms (B1 and B2), without physical separation between
infrastructures. The floor is concrete with vinyl covering and walls and ceiling are in
plasterboard panels coated with washable paint. Each room provide care for approximately 3 and
6 newborns, respectively. Both the preparation of the parenteral nutrition and medication are in
room B2 and, as a result, it has the greatest amount of staff activity. This NICU has capacity to
provide care for 9 patients.
NICU - C

ACCEPTED MANUSCRIPT
ACCEPTED MANUSCRIPT 7
In hospital C, the NICU consists of 3 areas. The areas C1 and C2, which are divided by a glass
wall with a corridor that allows communication between the two. The floor is concrete with vinyl
covering and walls and ceiling are in plasterboard coated with washable paint. C1 and C2 are
equipped with 5 incubators and 5 nurseries as well as a workstation, which supports both areas.
The C3 area is an open space with 6 incubators and 3 nurseries. It has a workstation devoted to
the preparation of medication and parenteral nutrition. This NICU has capacity to provide care
for 19 patients.
Noise Measurements
The measurements were carried out continuously over 24 hours, during seven days in each
measurement place (work station, traffic zone, inside incubator (except NICU B)). The
measurement protocol was based on the orientations of previous studies [20]. In this context, a
preliminary survey was performed in order to identify noise sources. Measurements were
performed using a sound level meter class 1 (01 dB®, model Solo-Premium) at least 1 m away
from the walls/equipment at a height between 1 m and 1.65 m and inside incubators. The
measurements of peak sound pressure level (Lp, Cpeak) were made using the C filter and the A-
weighted equivalent sound pressure level (LAeq) were obtained using the A filter (frequency
weighting filter that simulates human hearing). Slow response time averaging (1 second) was
also used considering it’s the most appropriate response for the majority of the applications in
hospitals and provide stable readings [21]. To ensure accurate measurement, recording was
preceded by calibration of the sound level meter [22] with an acoustic calibrator class 1
(RION®, model NC-74). Reference values given by WHO [23] and other organizations, were
used in the analysis and interpretation of results. After the field measurements, the data were

ACCEPTED MANUSCRIPT
ACCEPTED MANUSCRIPT 8
transferred and processed in the dBTRAIT software, version 5.4.
Health Care Staff Perceptions
The analysis of noise perception of health care staff in their workplaces involved the application
of a questionnaire, in order to characterize working conditions, comfort and the main noise
sources. The developed questionnaire already tested in previous studies of this project, was
divided into three main sections containing a total of 11 questions: (1) demographic information
(sex, age, profession, years of work in NICU, shift); (2) judgment of personal acceptability of
noise and comfort; and (3) judgment of the noisiest shift and main sources of noise in the NICU.
The personal acceptability statement and the tolerance scale consisted of judgements made about
the local noise environment. Furthermore, there was no contact between the researchers and the
participants in the study (volunteers), during the fulfilment of the questionnaires, since they were
delivered by a nurse (responsible for the NICU) and placed inside an envelope after its
fulfilment, in a completely anonymous process. At the end of the shift, they were collected by
the responsible nurse who sent it to the researchers. Of the total of 95 questionnaires, 90.5%
were answered by women. The mean age of the sample was 40.4 years (min. 24.0; max. 61.0),
and regarding the years working at NICU, the mean was 10.1 years (min. 0.5; max. 35.0).
Detailed information regarding the health care staff who participated in the questionnaire survey
is given by Table 1.
Statistical Analysis
The processing and data analysis involved descriptive and inferential statistics. The normality
Kolmogorov Smirnov test, Student’s t-test for independent samples and ANOVA one way were
applied. The software IBM SPSS (Statistical Package for the Social Sciences) 20th version and

ACCEPTED MANUSCRIPT
ACCEPTED MANUSCRIPT 9
MS Excel 2013 were used for the analysis.
Results
The noise levels obtained in the six rooms of the assessed NICU’s are shown in Table 2, as well
as the frequencies spectrum in octave bands.
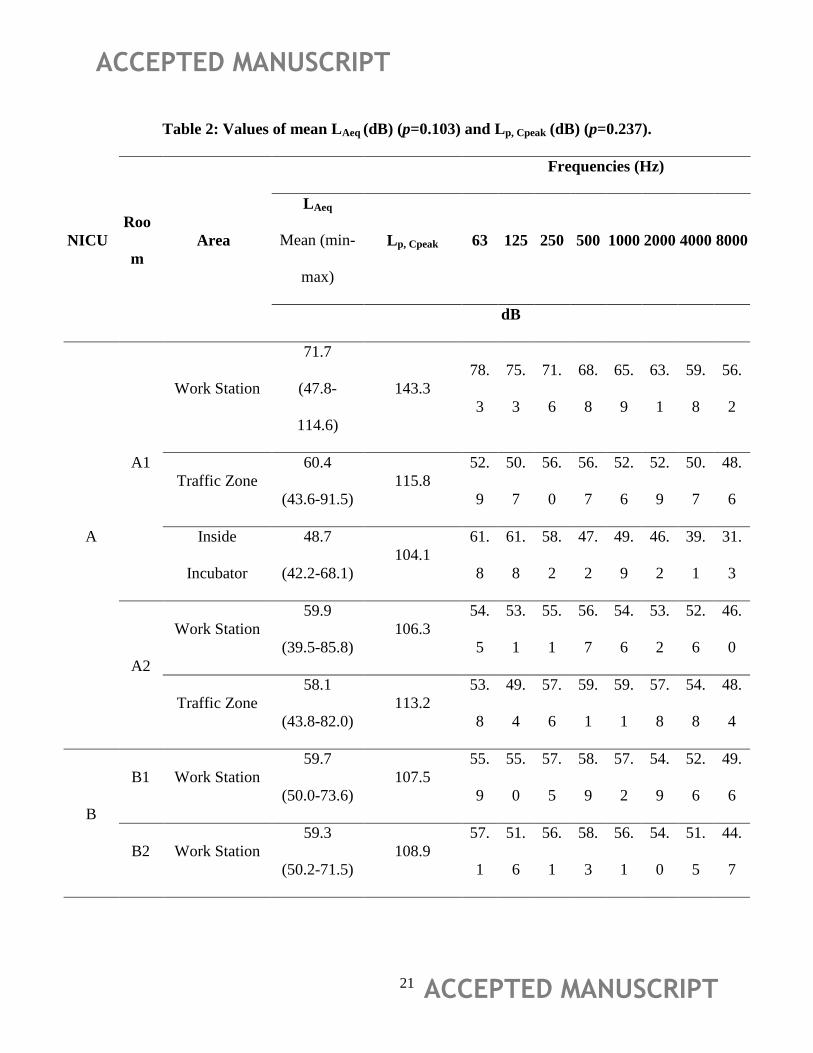
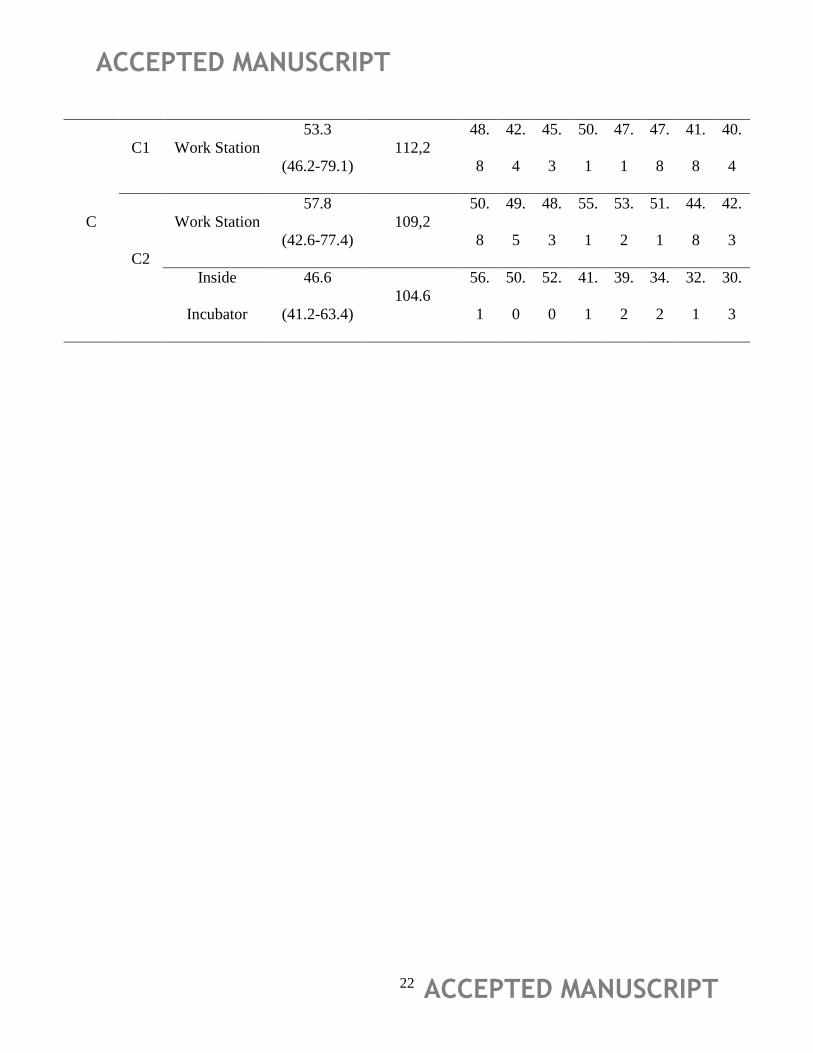
In NICU A, LAeq (dBA) values ranged between 58.1 (A2 – Traffic Zone) to 71.7 dBA (A1 –
Work Station). In NICU B, LAeq ranged between 59.3 (B1) to 59.7 dBA (B2). In NICU C, LAeq
ranged between 53.3 (C2) to 57.8 dBA (C1). No significant differences (P=0.103) were found
between the three NICU. NICU C had the lowest noise levels and NICU A, the higher ones. The
highest Lp, Cpeak (dBC) value was found in the ―Work Station‖ area of Room A1 (143.3 dBC).
Data showed that no significant differences were found between Lp, Cpeak (dBC) values (p=0.237).
Except in room A1 – Work Station and A1/C2 - Inside Incubator, 500 Hz was the frequency
which had higher levels in the areas under study. The demographic characteristics of the sample
of health care staff who participated in this study are presented in Table 1.
Of the total of 95 questionnaires, 36.8% were received from NICU A, 38.9% from NICU B and
24.2% from NICU C. The majority of the questionnaires (90.5%) were answered by women.
Additionally, more than a half of the sample was composed by nurses (54.7%), followed by
operational assistants (25.3%) and physicians (18.9%). Also, the majority of the staff have
worked in NICU between 5 to 20 years (49.5%), and the mean age of the sample was 40.4 years.
At the time of the questionnaire survey, workers who participated in the study were mainly from
the morning shift (55.8%). The responses of the relevant questions of the questionnaire are
shown in Table 3.
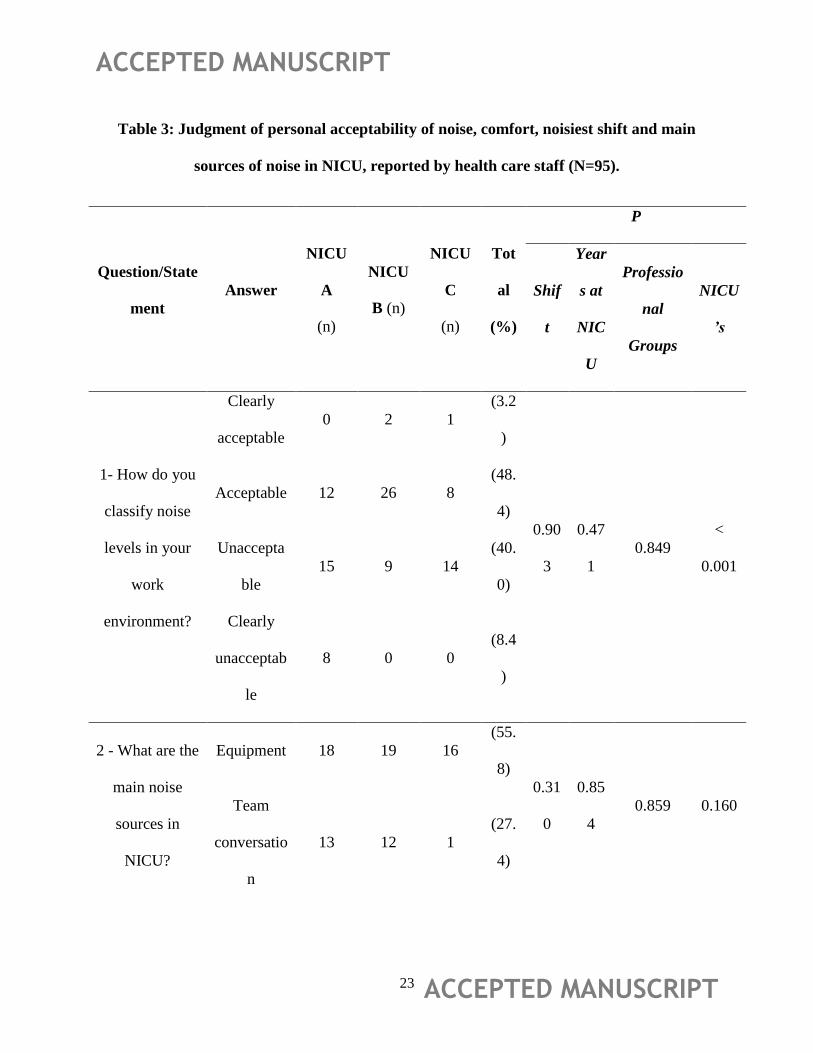
Regarding the acceptability of the working environment, 3.2% of the participants rated noise as

ACCEPTED MANUSCRIPT
ACCEPTED MANUSCRIPT 10
"Clearly Acceptable" on their workplace, 48.4% as "Acceptable", 40.0% as "Unacceptable" and
8.4% as "Clearly Unacceptable". Statistical differences between professional groups and NICUs,
were found. Concerning the main sources of noise, 55.8% of staff reported "equipment",
including telephones and the signals and sounds from medical devices, as the most annoying
noise sources in NICU. The "Team conversation" was rated by 27.4% of professionals, "visits"
by 9.5% and ―healthcare procedures‖ by 7.4%. No statistical differences between shifts,
professional groups, years working at NICU and NICU´s, were observed. With reference to the
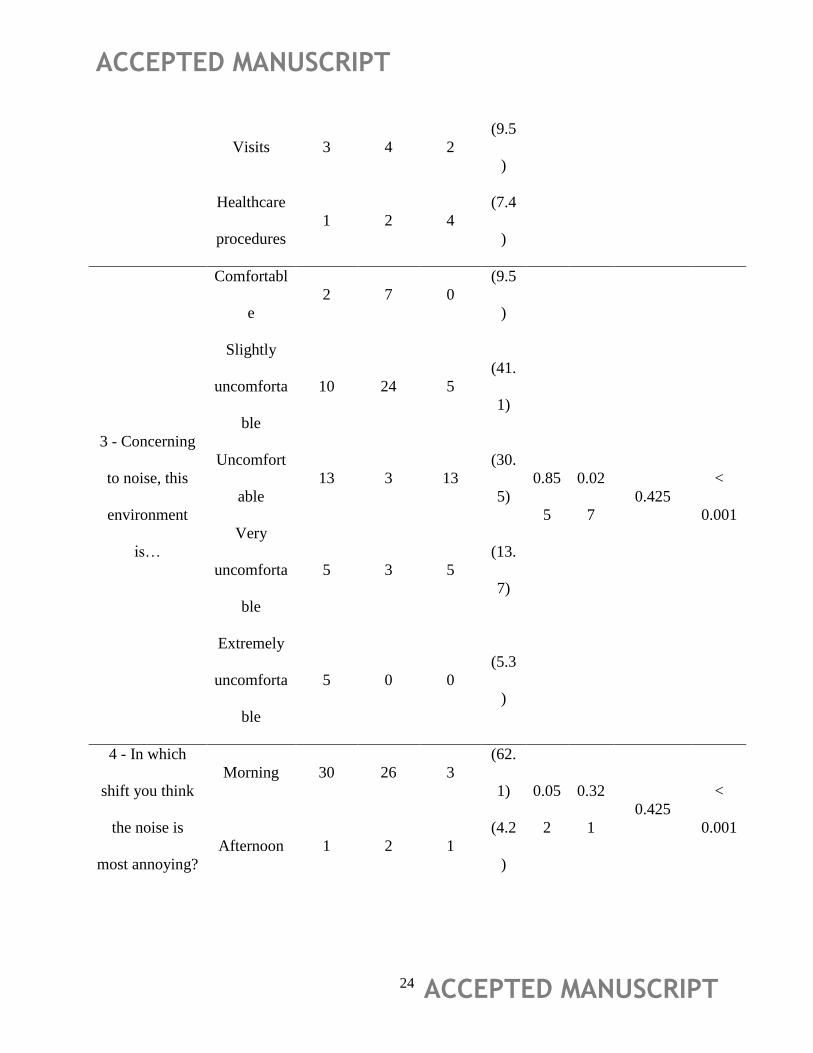
perception of comfort in relation to the work environment, 9.5% of health professionals
considered the work environment as "Comfortable", 41.1% ―Slightly uncomfortable‖, 30.5%
"Uncomfortable", 13.7% ―Very uncomfortable‖ and 5.3% ―Extremely uncomfortable‖.
Statistical differences between NICUs and years working in these environments, were found.
Finally, health staff reported the most annoying shift regarding noise: 62.1% of respondents
considered the morning shift as the most uncomfortable, followed by night shift rated by 33.7%
of the participants. Statistical differences between NICUs, were found.
Discussion
As shown in Table 2, noise levels in the three NICU were higher than the recommended by
WHO, which proposes that the average background noise in hospitals should not exceed 35 dB
LAeq for areas where patients are treated or observed [23], and by other organizations such the
United States Environmental Protection Agency (45 dBA daytime / 35 dBA night) [24] and the
American Academy of Paediatrics (45 dBA) [25]. Considering that concentration, precise
communication and fast decisions are necessary in hospitals, the acoustical environment has to
be considered an enormous strain for the staff and a potential risk [12]. Generally, NICU A had

ACCEPTED MANUSCRIPT
ACCEPTED MANUSCRIPT 11
the higher noise levels (mainly in A1). Since it is the large unit, it has a considerably larger
multidisciplinary staff, more traffic from ancillary support and visitors, and more equipment in
use, which contribute to the overall noise levels than do smaller units. Other studies comparing
single-room NICU with open-unit NICU (similar to NICU A, B and C) revealed higher noise
levels mostly in open-units [26,27]. Basner et al. [5] stated that noise levels in hospitals are now
typically more than LAeq 15–20 dB higher than those recommended which is in agreement with
the majority of the obtained results (Table 2). As a matter of fact, similar data were found in
other studies [2,18,28]. Accordingly, hospital noise might be an increasing threat to patient
rehabilitation and staff performance. Even though the noise levels reported in Table 2 were not
high enough to be considered as a danger for hearing, these average levels might be strong
enough to induce physiological stress responses as well as disorders regarding communication
and work performance [12]. The questionnaire survey showed the same pattern: the majority of
the staff classified NICU environment regarding noise as ―Slightly Uncomfortable‖ and
―Uncomfortable‖, despite the statistical significant differences between the responses of the staff
of the three NICU (Table 3). In general, noise was identified by healthcare professionals as an
agent with a negative impact on the environment. Indeed, other studies in hospital context found
similar data [1,29,30]. However, in a study conducted in an emergency department, 53% of the
sample (only constituted by nurses) felt their cognitive function was never or rarely affected by
noise [31]. The morning shift was perceived as the most annoying, followed by night shift. This
can be explained by the concentration of staff activity during the morning (medical routines,
clinical interventions, visits, among others). During the night, noise levels are expected to
decrease in order to encourage natural sleeping. Several studies showed a noise reduction during
ACCEPTED MANUSCRIPT
ACCEPTED MANUSCRIPT 12
the night shift about 2 dB [2] up to 5 dB [32] when compared with the morning shift. There were
statistical differences of the perceived comfort and noisiest shift between NICU, maybe due to
the influence of specific organizational factors of the NICUs. There were also significant
statistical differences of the perceived comfort considering the years working at NICU. This may
due to the fact that 35.8% of the respondents work at NICU less than 5 years and 59% were more
experienced working at NICU environment.
Data analysis revealed that low frequencies tended to have more influence on noise produced in
the NICU than higher frequencies (Table 2). These results are in agreement with Gray & Philbin
[21], who stated that noise in nurseries is dominated by low frequencies, with some exceptions
due to loud mid-frequencies alarms. Livera et al. [33] analyzed the noise generated by the
equipment’s used in the NICU, across the spectrum of frequencies, and concluded that those
(incubators, ventilators, infusion pumps, radiators, etc.) equipped with alarm, produce higher
sound pressure levels at higher frequencies. Kellam & Bhatia [34] suggested that human speech
contribute to the spike in sound energy at 500 Hz. In addition, results described by Carvalhais et
al. [1] showed the same pattern. In fact, evidence shows a reduction in sound pressure levels
predominantly above 400 Hz during the night, where there is a tendency to decrease
conversation and alarm sounds [1,33].
Conclusions
The studied NICUs presented higher sound pressure levels than recommended by international
organizations. Thus, routine activities of healthcare professionals have been identified as a
potential source of noise. The need to elevate the level of speech to overcome the noisy
environment in the NICU, thereby increasing the negative impacts on staff, newborns, and their

ACCEPTED MANUSCRIPT
ACCEPTED MANUSCRIPT 13
families, is another concern. High noise levels are associated with an increased rate of errors and
accidents, leading to a performance decrease among staff. Several actions could be taken in order
to minimize exposure to noise in NICU. Almadhoob & Ohlsson [14], stated that by minimizing
the sound levels that reach the neonate, the resulting stress on the cardiovascular, respiratory,
neurological and endocrine systems can be diminished, thereby promoting growth and reducing
adverse neonatal outcomes, as well as, improving staff performance and parental satisfaction.
For instance, it can be achieved by lowering the sound levels in an entire unit, treating the infant
in a section of a NICU or in a ’private’ room, and lastly with incubators in which the sound
levels are controlled. In fact, several studies showed that ―private room‖ or single-room NICU
environment has been the most effective way to address sound issues, especially when used in
conjunction with a cultural change among the staff [26,27]. Lastly, regardless of the adjustment
period of the operational management in NICU to deal with the new design [35], these single-
room NICU also seems to improve staff satisfaction regarding physical environment and
working conditions [36]. In addition, the confirmation of the influence of other physical changes
of the space on noise reduction, is also needed. An action plan, including a quiet time protocol
could be seen as a first step to improve a quiet environment, especially when structural
modifications are not economically viable or predicted. However, more research is needed in
order to verify which daily healthcare activities have more impact in noise production inside
incubators. After that it will be easier to address specific actions when performing those
activities.
ACCEPTED MANUSCRIPT
ACCEPTED MANUSCRIPT 14
References
1. Carvalhais C, Santos J, Da Silva MV, Xavier A. Is there sufficient training of health care
staff on noise reduction in neonatal intensive care units? a pilot study from neonoise
project. J. Toxicol. Environ. Heal. - Part A Curr. Issues 2015;78(13):897-903.
doi:10.1080/15287394.2015.1051204.
2. Santos J, Carvalhais C, Nóia M, Vieira da Silva M, Santos Baptista J. NeoNoise Project:
Preliminary results of sound pressure levels in a neonatal intensive care unit. In: Arezes P,
Baptista JS, Barroso M, et al., eds. SHO 2014 – International Symposium on Occupational
Safety and Hygiene. Guimarães, Portugal: SPOSHO; 2014:520.
3. Bremmer P, Byers JF, Kiehl E. Noise and the Premature Infant: Physiological Effects and
Practice Implications. J. Obstet. Gynecol. Neonatal Nurs. 2003;32:447-454.
doi:10.1177/0884217503255009.
4. Ceylan N, Kaba S, Karaman K, Celiker M, Basbugan Y, Demir N. Investigation of the
effect of the efficiency of noise at different intensities on the DNA of the newborns. Noise
Health 2016;18(80):7-9. doi:10.4103/1463-1741.174364.
5. Basner M, Babisch W, Davis A, et al. Auditory and non-auditory effects of noise on
health. Lancet 2014;383(9925):1325-1332. doi:10.1016/S0140-6736(13)61613-X.
6. Lickliter R. The role of sensory stimulation in perinatal development: insights from
comparative research for care of the high-risk infant. J. Dev. Behav. Pediatr.
2000;21(6):437-447. doi:00004703-200012000-00006 [pii].
7. Philbin MK, Klaas P. Evaluating studies of the behavioral effects of sound on newborns.
J. Perinatol. 2000;20:S61-S67. doi:10.1038/sj.jp.7200447.

ACCEPTED MANUSCRIPT
ACCEPTED MANUSCRIPT 15
8. Wachman EM, Lahav A. The effects of noise on preterm infants in the NICU. Arch. Dis.
Child. Fetal Neonatal Ed. 2011;96:F305-F309. doi:10.1136/adc.2009.182014.
9. Brown G. NICU Noise and the Preterm Infant. Neonatal Netw. J. Neonatal Nurs.
2009;28(3):165-173. doi:10.1891/0730-0832.28.3.165.
10. Krueger C, Wall S, Parker L, Nealis R. Elevated sound levels within a busy NICU.
Neonatal Netw. 2005;24(6):33-7. doi:10.1891/0730-0832.24.6.33.
11. Anagnostakis D, Petmezakis J, Messaritakis J, Matsaniotis N. Noise pollution in neonatal
units: A potential health hazard. Acta Paediatr. Scand. 1980;69(6):771-773. Available at:
http://www.scopus.com/inward/record.url?eid=2-s2.0-
0019143201&partnerID=40&md5=a76faa4071e383adc531c79b57831542.
12. Siegmann S, Notbohm G. Noise in hospitals as a strain for the medical staff. In:
Proceedings of Meetings on Acoustics Meeting Acoustics.Vol 19.; 2013:040092-040092.
doi:10.1121/1.4801032.
13. Allaouchiche B, Duflo F, Debon R, Bergeret A, Chassard D. Noise in the postanaesthesia
care unit. Br. J. Anaesth. 2002;88(3):369-373. doi:10.1093/bja/88.3.369.
14. Almadhoob A, Ohlsson A. Sound reduction management in the neonatal intensive care
unit for preterm or very low birth weight infants. Cochrane database Syst. Rev.
2015;1:CD010333. doi:10.1002/14651858.CD010333.pub2.
15. Xie H, Kang J, Mills GH. Clinical review: The impact of noise on patients’ sleep and the
effectiveness of noise reduction strategies in intensive care units. Crit. Care 2009;13(2):1-
8. doi:10.1186/cc7154.
16. Nunes C, Santos J, da Silva MV, Lourenço I, Carvalhais C. Comparison of different

ACCEPTED MANUSCRIPT
ACCEPTED MANUSCRIPT 16
methods for work accidents investigation in hospitals: A Portuguese case study. Work A J.
Prev. Assess. Rehabil. 2015;51(3):601-609. doi:10.3233/WOR-152007.
17. Konkani A, Oakley B. Noise in hospital intensive care units-a critical review of a critical
topic. J. Crit. Care 2012;27(5):522.e1-522.e9. doi:10.1016/j.jcrc.2011.09.003.
18. Nicolau AS, Casal D, Lopes PM, Kronenberg P. O ruído nas unidades neonatais de Lisboa
e Vale do Tejo. Acta Pediatr. Port. 2005;36:15-21.
19. Carvalhais C, Santos J, Xavier A, Silva M V. Noise reduction and control in hospital
environment: design of the NeoNoise project. In: Ahmed N, ed. Advances in Noise
Analysis, Mitigation and Control. Rijeka: InTech; 2016:229-244.
20. Robertson A, Kohn J, Vos P, Cooper-Peel C. Establishing a noise measurement protocol
for neonatal intensive care units. J. Perinatol. Off. J. Calif. Perinat. Assoc. 1998;18:126-
130. Available at: http://www.ncbi.nlm.nih.gov/pubmed/9605303.
21. Gray L, Philbin MK. Measuring sound in hospital nurseries. J. Perinatol. 2000;20:S100-
S104. doi:10.1038/sj.jp.7200440.
22. Kent WT, Tan AW, Clarke MC, Bardell T. Excessive noise levels in the neonatal ICU:
potential effects on auditory system development. J. Otolaryngol. 2002;31:355-360.
doi:10.2310/7070.2002.34358.
23. Berglund B, Thomas L, Dietrich HS. Guidelines for Community Noise. Geneva,
Switzerland; 1999. Available at: http://www.who.int/docstore/peh/noise/guidelines2.html.
24. U. S. Environmental Protection Agency. Information on Levels of Environmental Noise
Requisite to Protect Public Health and Welfare with an Adequate Margin of Safety
(EPA/ONAC 550/9-74-004). 1974.

ACCEPTED MANUSCRIPT
ACCEPTED MANUSCRIPT 17
25. American Academy of Pediatrics: Committee on Environmental Health. Noise: A Hazard
for the Fetus and Newborn. Pediatrics. 1997;100:724–7.
26. Liu W. Comparing sound measurements in the single-family room with open-unit design
neonatal intensive care unit: the impact of equipment noise. J. Perinatol.
2011;32(10):368-373. doi:10.1038/jp.2011.103.
27. Stevens D, Khan MA, Munson D, Reid E, Helseth C, Buggy J. The impact of architectural
design upon the environmental sound and light exposure of neonates who require
intensive care: an evaluation of the Boekelheide Neonatal Intensive Care Nursery. J.
Perinatol. 2007;27:20-28. doi:10.1038/sj.jp.7211838.
28. Freudenthal A, van Stuijvenberg M, van Goudoever JB. A quiet NICU for improved
infants’ health, development and well-being: A systems approach to reducing noise and
auditory alarms. Cogn. Technol. Work 2013;15(3):329-345. doi:10.1007/s10111-012-
0235-6.
29. Gurses AP, Carayon P. Exploring performance obstacles of intensive care nurses. Appl.
Ergon. 2009;40:509-518. doi:10.1016/j.apergo.2008.09.003.
30. Santos J, Miguel AS. Noise Levels in Hospital Environment – The Case of Intensive Care
Units. In: Arezes P, Baptista JS, Barroso M, et al., eds. SHO 2012 – International
Symposium on Occupational Safety and Hygiene. Guimarães, Portugal: Portuguese
Society for Occupational Safety and Hygiene; 2012:394-396.
31. Graneto J, Damm T. Perception of noise by emergency department nurses. West. J.
Emerg. Med. 2013;14(5):547-50. doi:10.5811/westjem.2013.5.16215.
32. Darbyshire JL, Young JD. An investigation of sound levels on intensive care units with

ACCEPTED MANUSCRIPT
ACCEPTED MANUSCRIPT 18
reference to the WHO guidelines. Crit. Care 2013;17:R187. doi:10.1186/cc12870.
33. Livera MD, Priya B, Ramesh A, et al. Spectral analysis of noise in the neonatal intensive
care unit. Indian J Pediatr 2008;75. doi:10.1007/s12098-008-0048-z.
34. Kellam B, Bhatia J. Sound Spectral Analysis in the Intensive Care Nursery: Measuring
High-Frequency Sound. J. Pediatr. Nurs. 2008;23:317-323.
doi:10.1016/j.pedn.2007.09.009.
35. Smith TJ, Schoenbeck K, Clayton S. Staff perceptions of work quality of a neonatal
intensive care unit before and after transition from an open bay to a private room design.
Work A J. Prev. Assess. Rehabil. 2009;33(2):211-227. doi:10.3233/WOR-2009-0868.
36. Stevens DC, Helseth CC, Khan M a, Munson DP, Smith TJ. Neonatal intensive care
nursery staff perceive enhanced workplace quality with the single-family room design. J.
Perinatol. 2010;30(5):352-358. doi:10.1038/jp.2009.137.
ACCEPTED MANUSCRIPT
ACCEPTED MANUSCRIPT 19
Table 1: Characteristics of the surveyed healthcare staff (N=95).
NICU A NICU B NICU C N (%)
N (%) 35 (36.8) 37 (38.9) 23 (24.2) 95 (100)
SEX
Male 6 3 0 9 (9.5)
Female 29 34 23 86 (90.5)
AGE IN YEARS
18-39 21 18 6 45 (47.4)
40-59 13 18 15 46 (48.4)
≥ 60 1 1 0 2 (2.1)
Missings 0 0 2 2 (2.1)
PROFESSIONAL
GROUP
Operational Assistants 6 10 8 24 (25.3)
Nurses 21 18 13 52 (54.7)
Physicians 8 9 1 18 (18.9)
Missings 0 1 0 1 (1.1)
YEARS AT NICU
<5 10 18 6 34 (35,8)
5-20 20 16 11 47 (49.5)
>20 3 2 4 9 (9.5)
ACCEPTED MANUSCRIPT
ACCEPTED MANUSCRIPT 20
NICU A NICU B NICU C N (%)
Missings 2 1 2 5 (5.3)
SHIFT
Morning 20 21 12 53 (55.8)
Afternoon 9 9 6 24 (25.3)
Night 6 7 5 18 (18.9)
ACCEPTED MANUSCRIPT
ACCEPTED MANUSCRIPT 21
Table 2: Values of mean LAeq (dB) (p=0.103) and Lp, Cpeak (dB) (p=0.237).
NICU
Roo
m
Area
Frequencies (Hz)
LAeq
Mean (min-
max)
Lp, Cpeak 63 125 250 500 1000 2000 4000 8000
dB
A
A1
Work Station
71.7
(47.8-
114.6)
143.3
78.
3
75.
3
71.
6
68.
8
65.
9
63.
1
59.
8
56.
2
Traffic Zone
60.4
(43.6-91.5)
115.8
52.
9
50.
7
56.
0
56.
7
52.
6
52.
9
50.
7
48.
6
Inside
Incubator
48.7
(42.2-68.1)
104.1
61.
8
61.
8
58.
2
47.
2
49.
9
46.
2
39.
1
31.
3
A2
Work Station
59.9
(39.5-85.8)
106.3
54.
5
53.
1
55.
1
56.
7
54.
6
53.
2
52.
6
46.
0
Traffic Zone
58.1
(43.8-82.0)
113.2
53.
8
49.
4
57.
6
59.
1
59.
1
57.
8
54.
8
48.
4
B
B1 Work Station
59.7
(50.0-73.6)
107.5
55.
9
55.
0
57.
5
58.
9
57.
2
54.
9
52.
6
49.
6
B2 Work Station
59.3
(50.2-71.5)
108.9
57.
1
51.
6
56.
1
58.
3
56.
1
54.
0
51.
5
44.
7
ACCEPTED MANUSCRIPT
ACCEPTED MANUSCRIPT 22
C
C1 Work Station
53.3
(46.2-79.1)
112,2
48.
8
42.
4
45.
3
50.
1
47.
1
47.
8
41.
8
40.
4
C2
Work Station
57.8
(42.6-77.4)
109,2
50.
8
49.
5
48.
3
55.
1
53.
2
51.
1
44.
8
42.
3
Inside
Incubator
46.6
(41.2-63.4)
104.6
56.
1
50.
0
52.
0
41.
1
39.
2
34.
2
32.
1
30.
3
ACCEPTED MANUSCRIPT
ACCEPTED MANUSCRIPT 23
Table 3: Judgment of personal acceptability of noise, comfort, noisiest shift and main
sources of noise in NICU, reported by health care staff (N=95).
Question/State
ment
Answer
NICU
A
(n)
NICU
B (n)
NICU
C
(n)
Tot
al
(%)
P
Shif
t
Year
s at
NIC
U
Professio
nal
Groups
NICU
’s
1- How do you
classify noise
levels in your
work
environment?
Clearly
acceptable
0 2 1
(3.2
)
0.90
3
0.47
1
0.849
<
0.001
Acceptable 12 26 8
(48.
4)
Unaccepta
ble
15 9 14
(40.
0)
Clearly
unacceptab
le
8 0 0
(8.4
)
2 - What are the
main noise
sources in
NICU?
Equipment 18 19 16
(55.
8)
0.31
0
0.85
4
0.859 0.160 Team
conversatio
n
13 12 1
(27.
4)
ACCEPTED MANUSCRIPT
ACCEPTED MANUSCRIPT 24
Visits 3 4 2
(9.5
)
Healthcare
procedures
1 2 4
(7.4
)
3 - Concerning
to noise, this
environment
is…
Comfortabl
e
2 7 0
(9.5
)
0.85
5
0.02
7
0.425
<
0.001
Slightly
uncomforta
ble
10 24 5
(41.
1)
Uncomfort
able
13 3 13
(30.
5)
Very
uncomforta
ble
5 3 5
(13.
7)
Extremely
uncomforta
ble
5 0 0
(5.3
)
4 - In which
shift you think
the noise is
most annoying?
Morning 30 26 3
(62.
1) 0.05
2
0.32
1
0.425
<
0.001
Afternoon 1 2 1
(4.2
)

ACCEPTED MANUSCRIPT
ACCEPTED MANUSCRIPT 25
Night 4 9 19
(33.
7)