Care home performance across England March 2019... · 2019-03-05 · notably higher than CQC care...
12
1 Care home performance across England March 2019
Transcript of Care home performance across England March 2019... · 2019-03-05 · notably higher than CQC care...

1
Care home performance across England
March 2019
2
About Independent Age
Whatever happens as we get older, we all want to remain independent and live
life on our own terms. That’s why, as well as offering regular friendly contact
and a strong campaigning voice, Independent Age can provide you and your
family with clear, free and impartial advice on the issues that matter: care and
support, money and benefits, health and mobility. A charity founded over 150
years ago, we’re independent so you can be.
Website
For more information, visit our website www.independentage.org
Helpline
We give free, confidential advice over the telephone for older people, their
families and carers on issues such as getting help at home, adaptations, care
assessments, paying for care, staying in touch with other people and welfare
benefits.
Arrange to speak to one of our advisers for free and confidential advice and
information. Freephone 0800 319 6789 or email [email protected]
Registered charity number 210729
For any questions about the report, please contact:
Jeremy Bushnell (Senior Policy Officer)
To see an interactive map of the variation in care home quality please visit:
https://www.independentage.org/care-home-performance-across-england-2019
About this briefing
Following on from work conducted by Independent Age in 2017 and 2018, this briefing
assesses the state of care home performance across England and looks at what is being
done to tackle poor performance.
We have used publicly available CQC inspection data (taken from January 2019) to work
out a total figure for the percentage of care homes in each local authority that are rated
either “Inadequate” or “Requires Improvement”. Using research from the last two years
we have tracked which areas have demonstrated improvement and which have
worsened.
This briefing also outlines how we as an organisation want to see care home quality
develop and what factors are key to ensuring that care home quality does improve.

Independent Age: Care Home Performance Across England, as of January 2019
3
Key findings
In the last year, more than a third (37%) of local authorities have seen care
home ratings get worse in their area.
This is an extremely concerning trend and a significant increase on the 22% of local
authorities that saw care home ratings in their area fall between 2017 and 2018. With an
ageing population and increased pressures on social care, it is imperative that the social
care system is of a sufficient quality to meet the current and future demands. This trend
shows the system is not ready and the variation in care home quality is only increasing.
Access to a choice of good quality care home settings is still very much a matter of luck.
The variation in quality of care homes between regions in England is recognised by older
people and their families. One focus group participant told us “My sister-in-law … lives in
Cambridgeshire and … the homes there seem to be run totally different to the homes here [in
Bexley]”.
Over the last year, 2.6 Million older people are now more likely to face poor
choice of care home.
More than two and a half million older people live in the 56 local authorities where care
home ratings have deteriorated. During the last year their chances of facing a poorer
range of care choices increased, at a time when high costs and lack of accessibility
already create vast challenges.
Many older people we spoke to have a real fear of care homes. In Manchester which, in
2019, tops the table of local authorities where care home performance is declining, we
heard from one focus group participant: “I’m frightened of care homes in case I have to go in
one”.
What does a ‘Requires Improvement’ or ‘Inadequate’ rating look like?
For a care home to receive a ‘Requires Improvement’ or ‘Inadequate’ rating, the service
must be failing to deliver the minimum quality of care that is expected, in categories
including safety and caring.
Issues highlighted in care homes with these ratings have included:
Residents not receiving medicine as they were prescribed.
The service not always being caring.
Staff failing to monitor individual’s nutrition and hydration.
Residents not always treated with dignity in their interactions with staff.
Audits and processes not being followed so that safety cannot be guaranteed.
These are issues no individual should have to endure, particularly when they may be paying
a very high weekly cost. They help to make concrete what a poor rating really means for
the people living within that home.
We believe every older person is entitled to good quality care, and therefore should be
entitled to a ‘Good’ or ‘Outstanding’ care home.

4

Independent Age: Care Home Performance Across England, as of January 2019
5
What needs to happen now?
“Instead of thinking, ‘Oh my God, I’m going to end up there!’ I actually want to think, ‘If I do have to
go into care, I want to look forward to how fantastic it would be.’” Independent Age focus group
participant, Birmingham.
It is well known that social care is in crisis. At the heart of this crisis is the chronic
underfunding of the system with social care spending shrinking by £7 billion since 20101.
Local authorities are planning to push through social care cuts of £700 million in
2018/2019 - nearly 5% of their total budget2 - in order to balance their books.
At a time when our population is ageing, local authorities are facing increasing demands
on their social care services, and when care quality is such an issue, this is a situation
that cannot continue.
However, money is not the only issue. It is essential that a poor rating triggers urgent,
comprehensive action so that care homes are provided with the support they need to
improve the quality of care they are delivering.
We believe the following principles must be used to successfully address poor quality
care;
Timely responses to poor ratings
Collaborative working with others in the sector
Utilising the experiences of colleagues in the sector
How can we improve care home performance in England?
The CQC has identified some common themes amongst those care homes that have
successfully improved upon a poor care home rating3. These themes include:
Leadership
Cultural Change
Person-centred care
Staffing
Building a community
Working with partners
All of these factors have been used to ensure a change of direction at care homes,
helping them take poor quality care and turn it into high quality care that places the
wellbeing of residents at the centre.
Whether it’s a change of manager at the top, or working with other care homes who
have themselves improved, research has demonstrated that these factors can play a
significant role in improving a care home’s rating.
1 ADASS, Budget Survey 2018, 2018 2 Ibid 3 CQC, Driving improvement: Case studies from nine adult social care services, June 2018

Independent Age: Care Home Performance Across England, as of January 2019
6
An inconsistent approach?
However, we know that care homes and local authorities do not have a consistent
approach to shaping their care home market and helping make these much needed
improvements.
In an FOI sent to all local authorities in 20174 we sought to identify how local authorities
go about fulfilling their Care Act requirements to engage with the care market in their
area and thereby drive up quality.
While every local authority acknowledged their responsibility in this regard, it was clear
that some local authorities put more resources and effort into engaging with the market,
than others.
Good practice includes regular assessments of care homes, but also active engagement
with care homes to maintain a comprehensive understanding of their costs of care and
other pressures they are facing. This was achieved through provider forums and market
engagement events as well as in some cases a newly appointed team within the local
authority to specifically look at increasing care quality within the area.
4 Independent Age, Caring for the Care Act: A freedom of information research briefing, November 2017
A case study of local authority care home improvement – Leicestershire County Council
Leicestershire County Council has developed a novel approach to supporting local care providers to improve
the quality and standard of care available to users. Since 2012, Leicestershire County Council has hosted a
Quality Team consisting of individuals with social care expertise (ex care home managers and a nurse among
them) who work alongside providers to help them make improvements. This activity is funded by the Better
Care Fund and forms part of the Council’s overall approach to quality assurance and improvement.
The goal of the team is to support social care providers to deliver good quality, safe care by working with
them to enhance staff capability in terms of practical skills, knowledge and leadership. Any local provider can
access the support free of charge, regardless of whether they hold a contract with Leicestershire County
Council. Some providers that the Quality Team work with are referred due to contractual compliance and
where areas for improved practice have been identified. Others self-refer for support because they wish to
improve the quality of the service that they deliver.
Members of the Quality Team meet with key staff from providers in their practice settings and through
education, coaching and the provision of tools and resources they aim to change practice and ways of
thinking in a sustainable way. The team develops a programme of support tailored to the provider’s needs
that covers diverse topics including care plans, medication, risk assessment and training. In these
interactions, the team play a wide variety of roles including counsellor, mentor, advisor and mediator.
The Quality Team has engaged with 111 of the 182 care homes in the region, though to differing degrees.
The Quality Team initiative has also resulted in improved relationships between providers and the Council
more generally.
The ELSCQua project at the Personal Social Services Research Unit at LSE will be releasing a detailed case
study report looking at local authorities initiatives to improve social care quality (including Leicestershire) in
April 20191. This is independent research funded by the National Institute for Health Research School for
Social Care Research (NIHR SSCR). The views expressed in this presentation are those of the author(s) and
not necessarily those of the NIHR SSCR, NIHR or the Department of Health and Social Care.

Independent Age: Care Home Performance Across England, as of January 2019
7
A lesson from schools?
Care homes remain an overlooked sector in public services. Data shows that we tolerate
poor care home quality far more than failing GP surgeries or schools.
Despite well documented challenges facing the education sector, Ofsted ratings are
notably higher than CQC care home ratings with only 1 in 8 schools rated poorly. With
this in mind, is helpful to compare the processes and structures that follow a poor school
rating, contrasting it with the level of investment in tackling poor care home ratings.
More regular inspections
Following on from a rating of ‘Special Measures’, schools tend to be re-inspected on a
termly basis. On each occasion a report will be published to provide a regular
assessment of whether the school is improving.
This constant re-evaluation ensures that the school is made accountable for making the
changes necessary to drive performance.
This is in contrast to the situation in care homes where the CQC is required to return six
months after a poor rating is issued to see if changes have been made. This is a
considerable period of time, particularly given that more than third of people will only be
resident in a care home for a period of a year or less5.
Executive experience
In some cases, once a school receives a poor rating, an experienced executive head
teacher is employed to work in collaboration with the incumbent head and drive
improvements in the school.
The use of an executive head can mean that a school’s improvements are guide by an
experienced professional with a grounded understanding of what measures will raise the
school’s performance.
CQC research outlined occasions where a change in management was initiated to
stimulate a change in culture and provide expert experience of how to make quick,
sustainable changes which improved the quality of care being delivered. However, this
type of support and change is not always available to care homes and having the luxury
of gaining an experienced manager is not an option for many of those homes needing to
make drastic change.
Collaborative working and learning
A key part of improving a school’s Ofsted rating is linking that school with other
organisations, including being sponsored by an academy chain, with a background in
improving similar schools. This gives the school the opportunity to engage with others
who have experience of improving school quality and can help them shape the
improvements that need to be made.
We believe the principles of urgency, collaboration and use of expertise are key
in addressing the worrying trends in declining care quality.
Independent Age will be continuing to work with others to make the case for
comprehensive and sustainable support packages for care homes that are
currently struggling to provide high quality care.
5 PSSRU, Length of stay in care homes , 2011
Independent Age: Care Home Performance Across England, as of January 2019
8
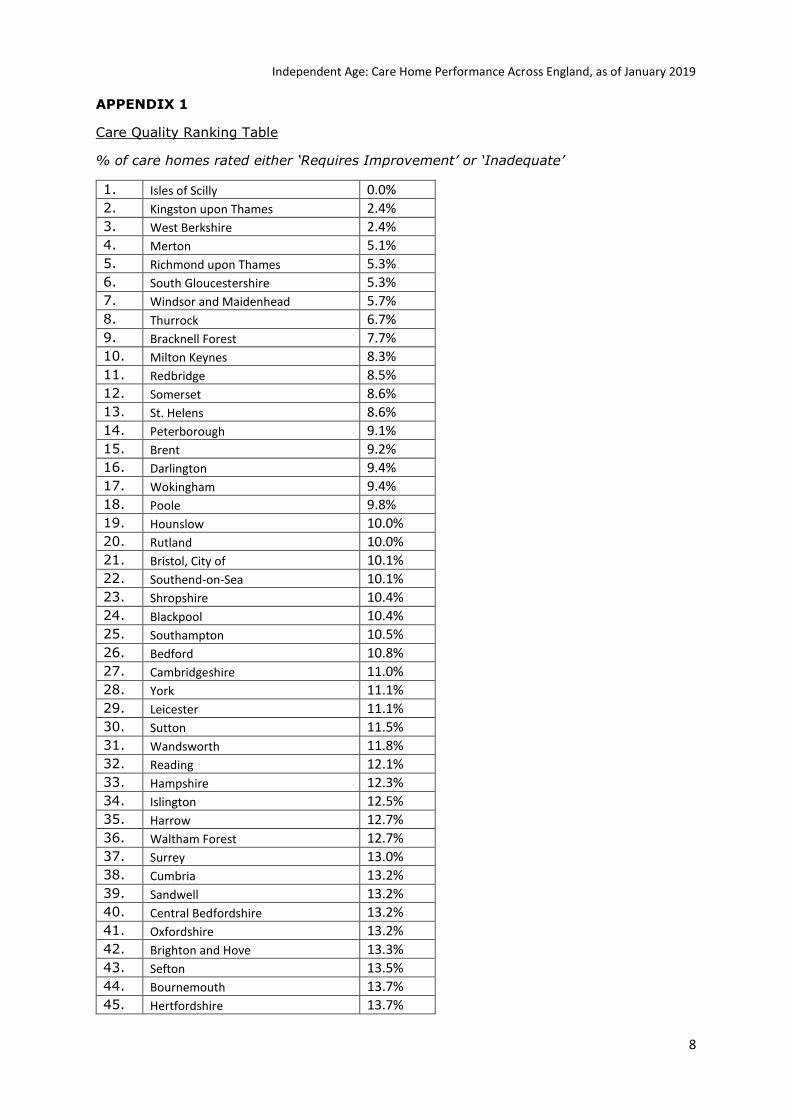
APPENDIX 1
Care Quality Ranking Table
% of care homes rated either ‘Requires Improvement’ or ‘Inadequate’
1. Isles of Scilly 0.0%
2. Kingston upon Thames 2.4%
3. West Berkshire 2.4%
4. Merton 5.1%
5. Richmond upon Thames 5.3%
6. South Gloucestershire 5.3%
7. Windsor and Maidenhead 5.7%
8. Thurrock 6.7%
9. Bracknell Forest 7.7%
10. Milton Keynes 8.3%
11. Redbridge 8.5%
12. Somerset 8.6%
13. St. Helens 8.6%
14. Peterborough 9.1%
15. Brent 9.2%
16. Darlington 9.4%
17. Wokingham 9.4%
18. Poole 9.8%
19. Hounslow 10.0%
20. Rutland 10.0%
21. Bristol, City of 10.1%
22. Southend-on-Sea 10.1%
23. Shropshire 10.4%
24. Blackpool 10.4%
25. Southampton 10.5%
26. Bedford 10.8%
27. Cambridgeshire 11.0%
28. York 11.1%
29. Leicester 11.1%
30. Sutton 11.5%
31. Wandsworth 11.8%
32. Reading 12.1%
33. Hampshire 12.3%
34. Islington 12.5%
35. Harrow 12.7%
36. Waltham Forest 12.7%
37. Surrey 13.0%
38. Cumbria 13.2%
39. Sandwell 13.2%
40. Central Bedfordshire 13.2%
41. Oxfordshire 13.2%
42. Brighton and Hove 13.3%
43. Sefton 13.5%
44. Bournemouth 13.7%
45. Hertfordshire 13.7%

Independent Age: Care Home Performance Across England, as of January 2019
9
46. Greenwich 14.3%
47. Cornwall 14.4%
48. Croydon 14.6%
49. Northamptonshire 14.7%
50. County Durham 14.7%
51. Leicestershire 14.8%
52. Dorset 14.9%
53. Gloucestershire 15.0%
54. Devon 15.1%
55. Bury 15.4%
56. Newham 15.4%
57. North Lincolnshire 15.5%
58. Havering 15.6%
59. Sunderland 15.8%
60. Warwickshire 15.8%
61. Enfield 15.9%
62. Lambeth 15.9%
63. Worcestershire 16.3%
64. Bromley 16.4%
65. Buckinghamshire 16.8%
66. Barnet 16.9%
67. Lincolnshire 16.9%
68. Suffolk 17.1%
69. Essex 17.2%
70. Rotherham 17.3%
71. East Riding of Yorkshire 17.4%
72. North East Lincolnshire 17.4%
73. Lancashire 17.6%
74. Rochdale 17.6%
75. Doncaster 17.7%
76. North Somerset 17.8%
77. Southwark 18.2%
78. Telford and Wrekin 18.2%
79. Lewisham 18.3%
80. Wigan 18.4%
81. Plymouth 18.8%
82. South Tyneside 18.8%
83. Derbyshire 19.0%
84. Bolton 19.1%
85. Medway 19.4%
86. North Yorkshire 19.7%
87. Torbay 19.8%
88. Nottinghamshire 19.8%
89. Norfolk 19.9%
90. Oldham 20.0%
91. Camden 20.0%
92. Slough 20.0%
93. East Sussex 20.1%
94. Gateshead 20.3%

Independent Age: Care Home Performance Across England, as of January 2019
10
95. Herefordshire, County of 20.5%
96. Sheffield 20.5%
97. Wolverhampton 20.9%
98. Halton 21.1%
99. Solihull 21.1%
100. Northumberland 21.4%
101. Hackney 21.4%
102. Swindon 21.6%
103. Cheshire West and Chester 21.6%
104. Redcar and Cleveland 21.8%
105. West Sussex 22.1%
106. Barking and Dagenham 22.2%
107. Birmingham 22.4%
108. Kent 22.6%
109. Blackburn with Darwen 22.9%
110. Hartlepool 23.1%
111. Salford 23.1%
112. Westminster 23.1%
113. Derby 23.2%
114. Leeds 23.3%
115. Dudley 23.3%
116. Bexley 23.5%
117. Hillingdon 24.5%
118. Newcastle upon Tyne 24.6%
119. Kingston upon Hull, City of 24.7%
120. Bath and North East Somerset 25.0%
121. Hammersmith and Fulham 25.0%
122. Haringey 25.0%
123. Stoke-on-Trent 25.3%
124. North Tyneside 25.5%
125. Luton 25.6%
126. Stockport 26.2%
127. Nottingham 26.4%
128. Kensington and Chelsea 27.3%
129. Knowsley 28.0%
130. Wakefield 28.1%
131. Stockton-on-Tees 28.3%
132. Liverpool 28.8%
133. Ealing 28.8%
134. Cheshire East 29.9%
135. Middlesbrough 30.2%
136. Wiltshire 30.4%
137. Warrington 30.8%
138. Trafford 31.5%
139. Wirral 31.7%
140. Coventry 31.9%
141. Bradford 31.9%
142. Walsall 32.0%
143. Staffordshire 32.6%

Independent Age: Care Home Performance Across England, as of January 2019
11
144. Kirklees 33.1%
145. Tower Hamlets 33.3%
146. Calderdale 34.0%
147. Tameside 34.2%
148. Barnsley 35.4%
149. Isle of Wight 37.8%
150. Portsmouth 39.5%
151. Manchester 44.0%
APPENDIX 2
Care Quality by Region
Region % of homes rated “Inadequate” or
“Requires Improvement”
2018 2019
London 17.4% 15.2%
East of England 17.4% 15.8%
East Midlands 18.2% 17.5%
North East 18.3% 20.3%
South West 20.4% 15.8%
South East 20.4% 17.5%
West Midlands 21.3% 21.8% Yorkshire and The
Humber 26.1% 23.3%
North West 28.2% 21.7%

Independent Age: Care Home Performance Across England, as of January 2019
12
APPENDIX 3
Top 10 and Bottom 10 for improvement between 2018 and 2019
TOP – Most improved local authorities
% point decrease in proportion of care homes rated ‘Requires Improvement’ or
‘Inadequate’
1. St Helen’s -22.9%
2. Tameside -22.5%
3. Kensington and Chelsea -18.2%
4. Windsor and Maidenhead -17.8%
5. City of Bristol -17.7%
6. Sefton -17.5%
7. Stockport -17.1%
8. Oldham -16.8%
9. South Gloucestershire -15.5%
10. Westminster -15.4%
BOTTOM – Greatest declining local authorities
% point increase in proportion of care homes rated ‘Requires Improvement’ or
‘Inadequate’
142. Camden 10.0%
143. Rutland 10.0%
144. Redcar and Cleveland 10.5%
145. Lewisham 10.6%
146. Ealing 10.8%
147. Reading 12.1%
148. Middlesbrough 13.2%
149. Blackburn with Darwen 13.8%
150. Luton 15.1%
151. Southwark 18.2%